The Weekend Report May 19th
.
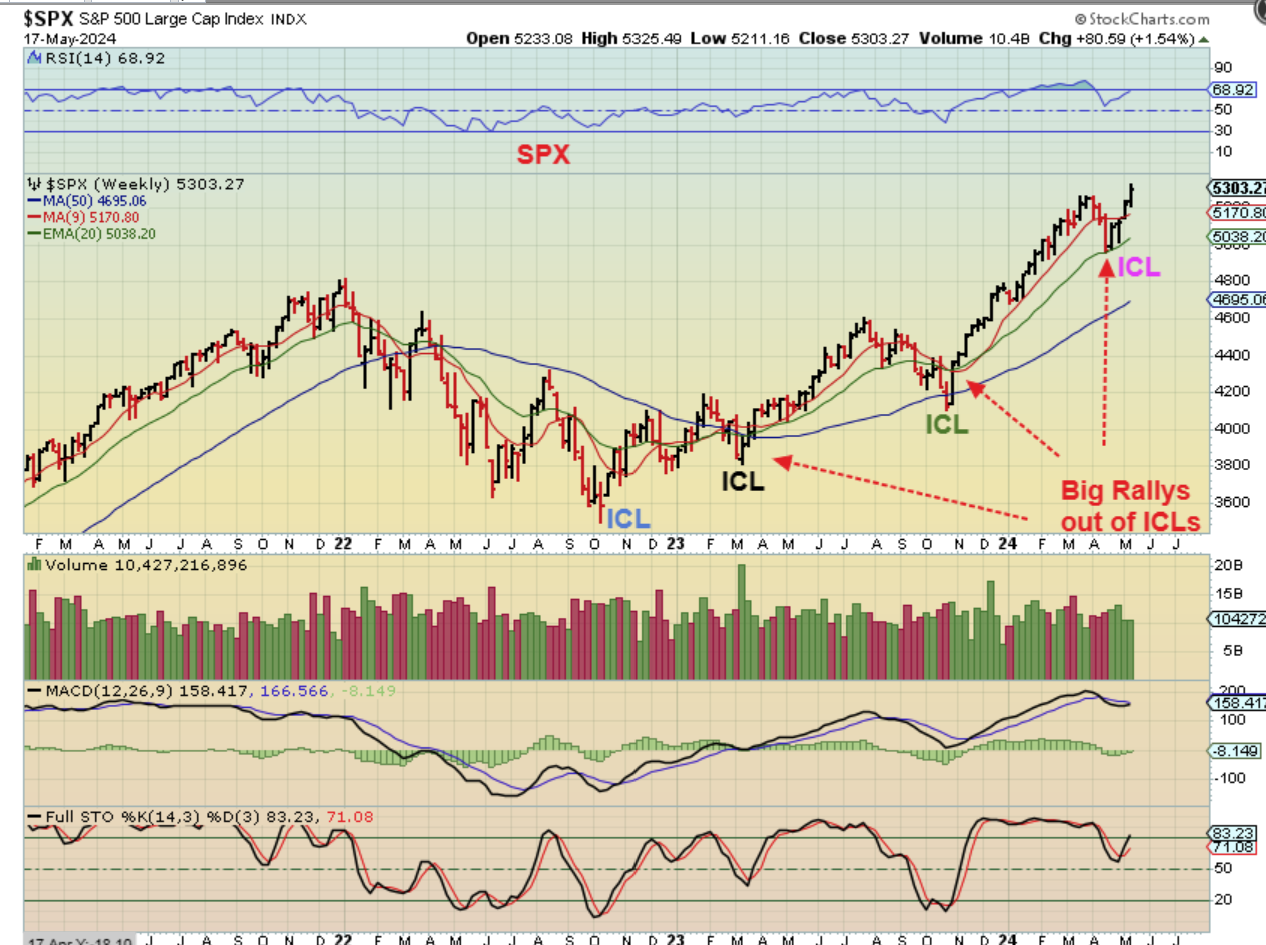
SPX WEEKLY – Our 3 week drop into an ICL landed and reversed right at the 20 ema. With an ICL I would expect at least 2 daily cycles that show strength, but the last 2 ICLS obviously showed strength for many weeks, as seen here. Everything mentioned here goes for the NASDAQ too, these remain bullish for now.
.
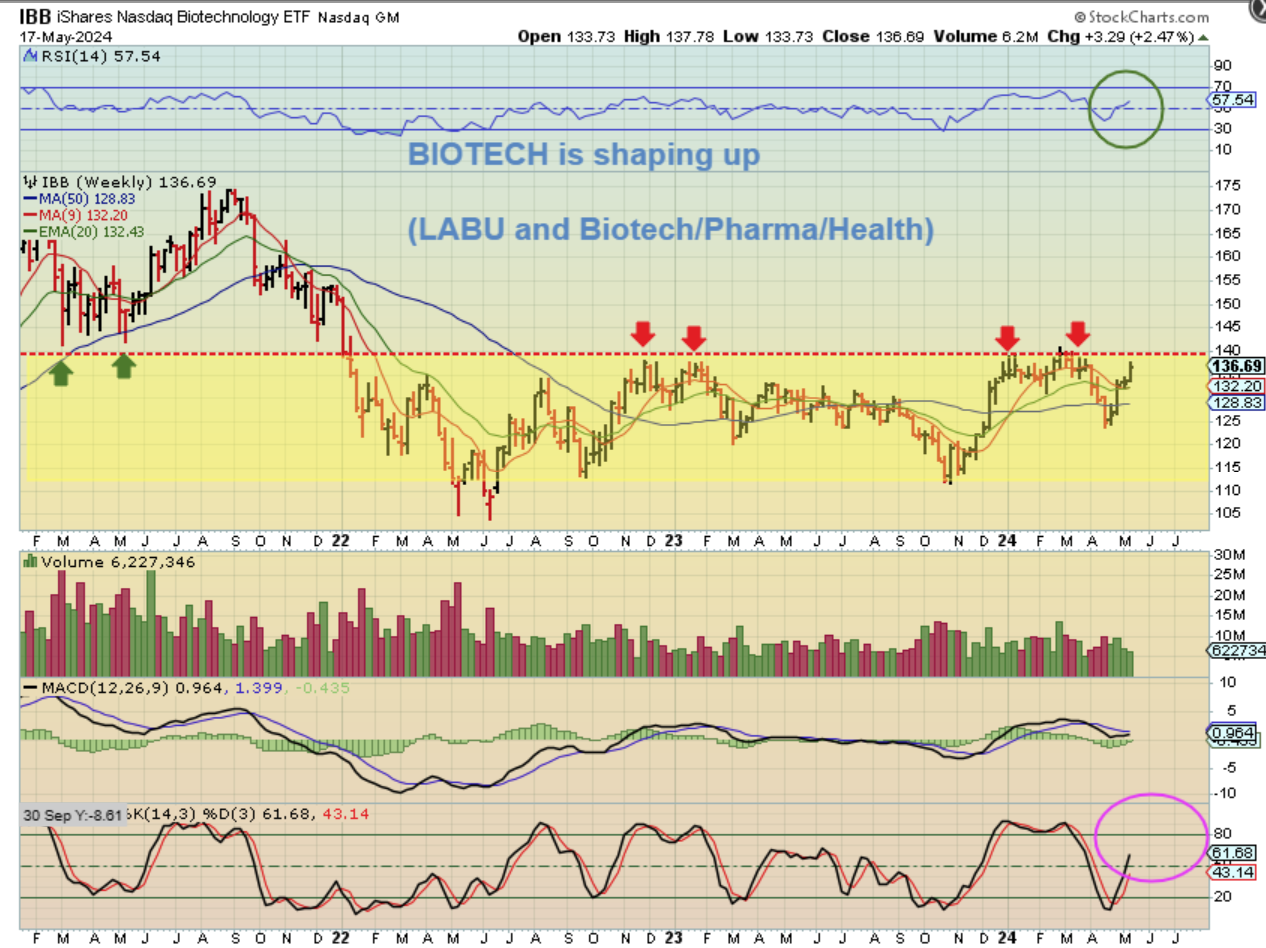
IBB WEEKLY – This affects LABU, so we see that the Biotech sector has been held down in a base. In the next week or 2 we should see whether it can breakout or not, but so far we’ve had 4 weeks higher out of that last sell off (ICL).
.
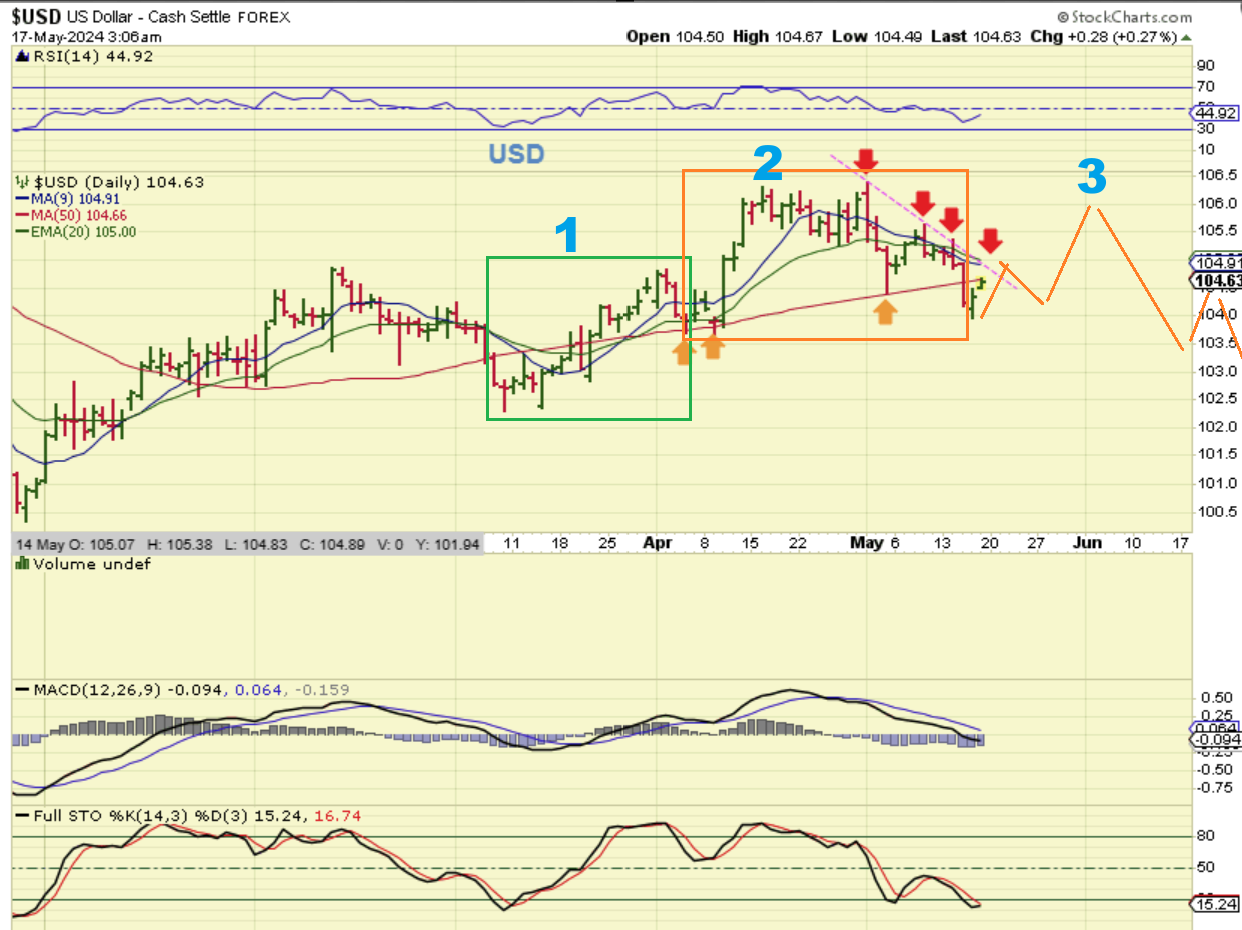
THE USD DAILY showed some weakness at the end of that 2nd daily cycle, especially after the Fed Mtg. I think that it can bounce in a 3rd daily cycle, and then it should weaken & roll over to new lower lows again.
(Note: That bounce or 3rd daily cycle may not be as high as I drew it here),
Let’s examine the weekly chart for more clues…
,
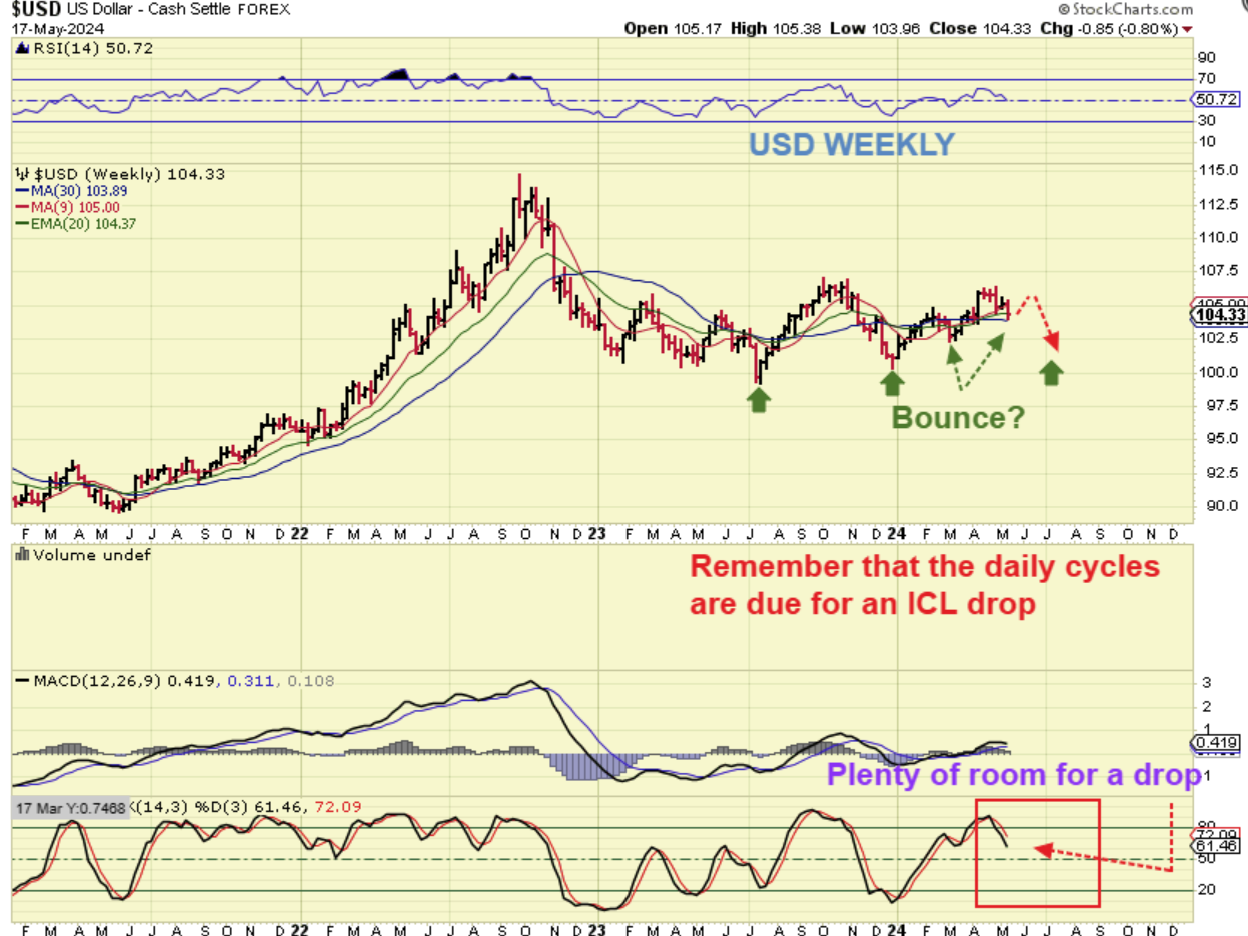
USD WEEKLY –
1. Look at the stochastics. The USD is still in an overbought condition, so it does have more room to the downside.
2. We just finished the 2nd daily cycle and the 3rd can roll over and continue a drop into the next ICL.
.
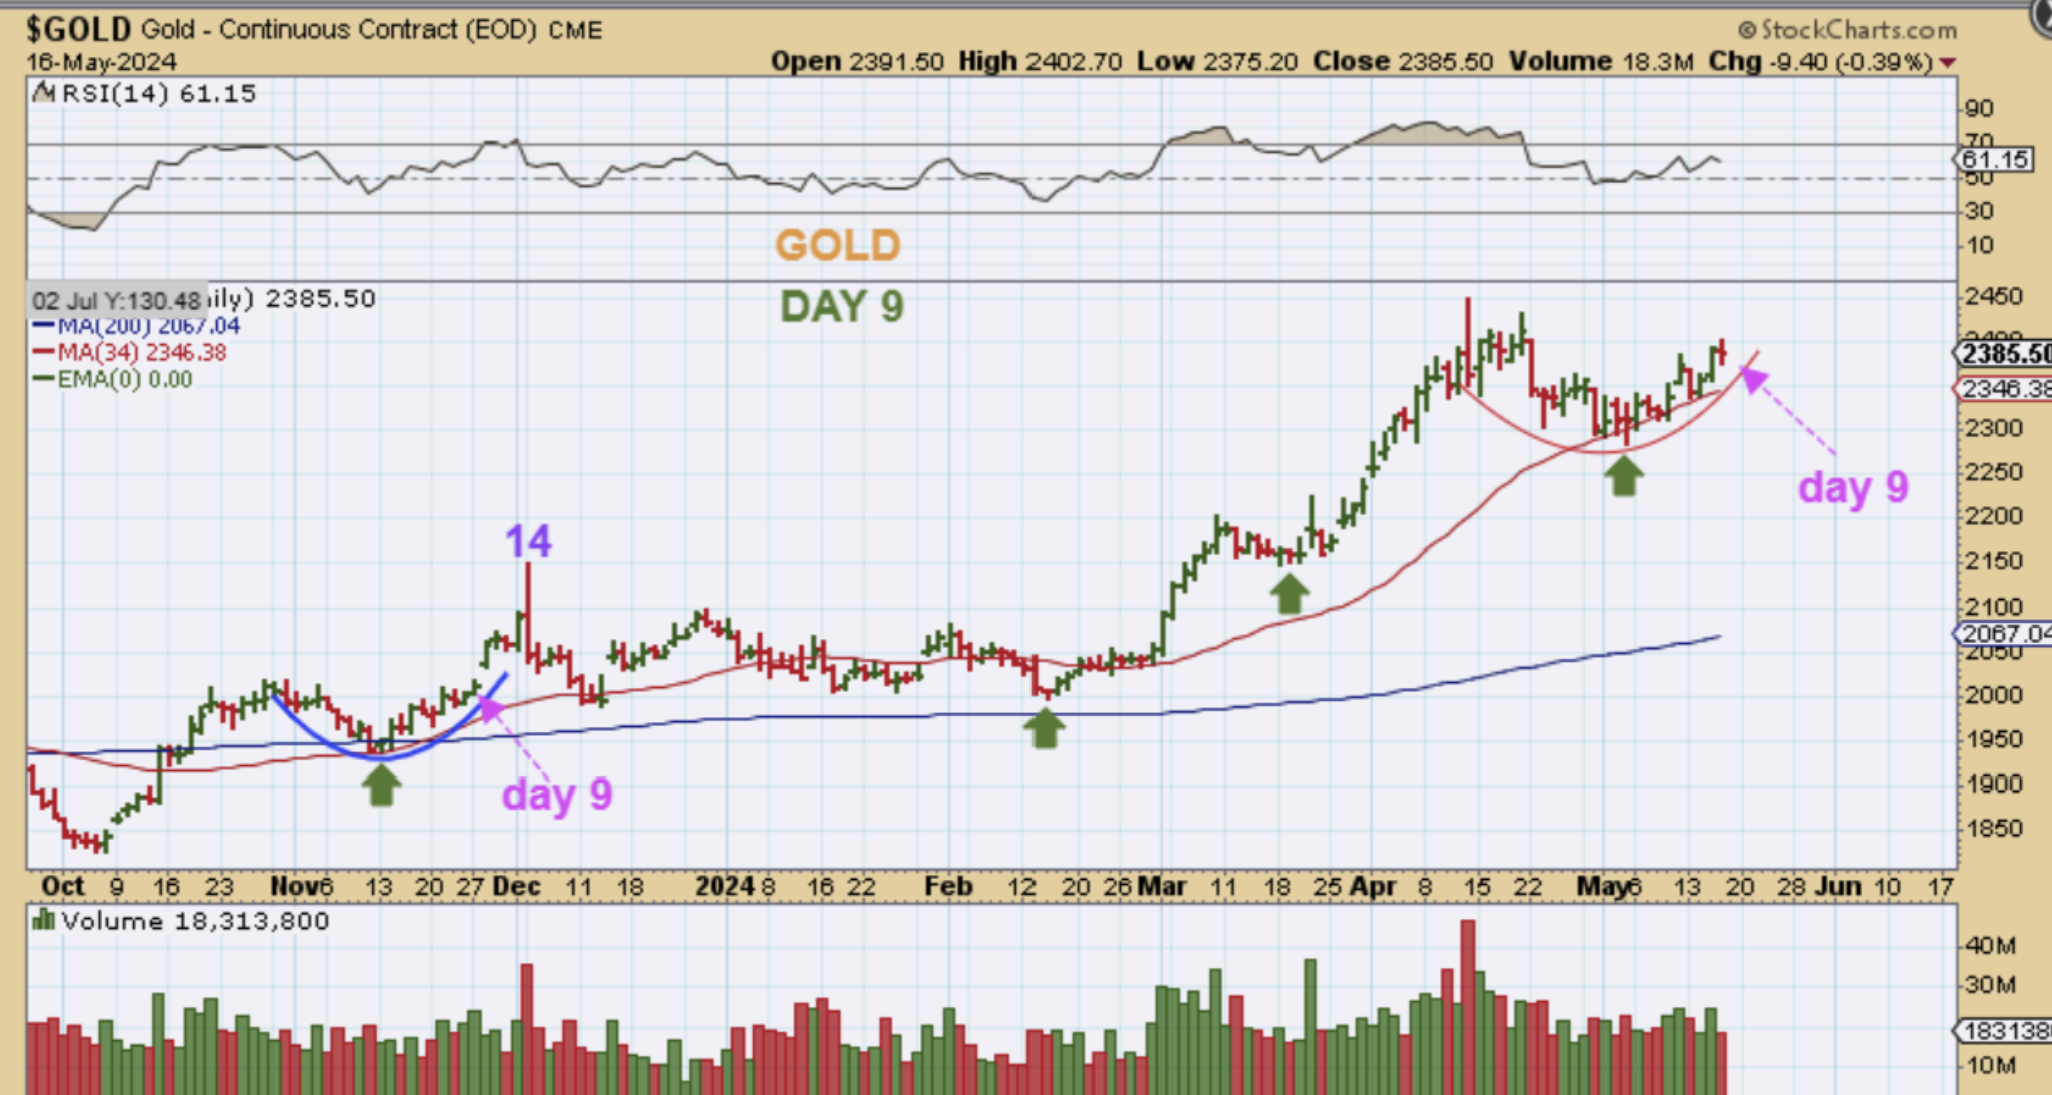
GOLD DAILY #1 – The 3rd daily cycle:
This was in Fridays report before Fridays trading, but I just want to use it to show you that we have had a 1st and a 2nd daily cycle completed since February lows. The 3rd daily cycle is where we are now and it could remain strong or it can weaken and start to consolidate the recent gains further. So…
.
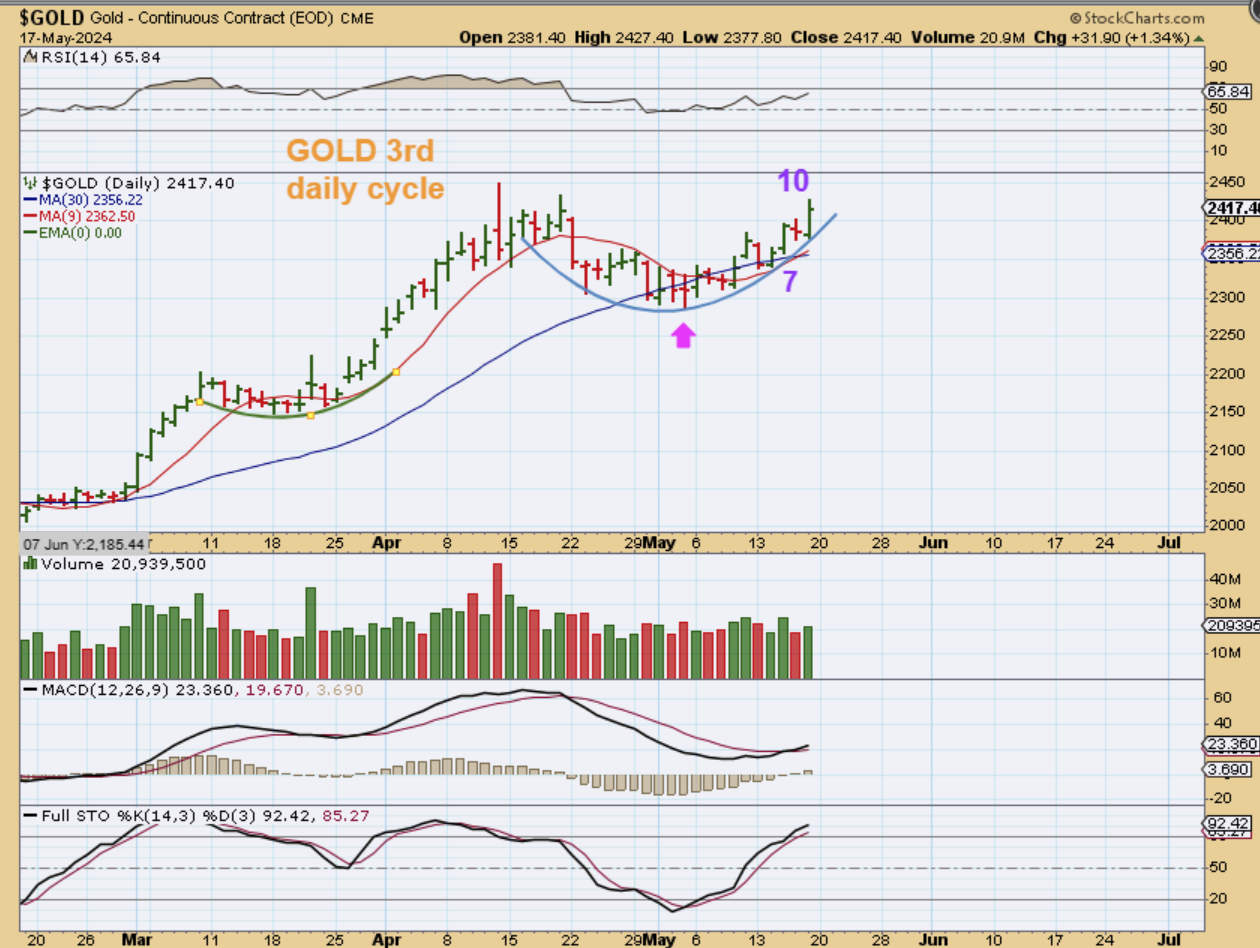
GOLD DAILY chart #2:
The 3rd daily cycle is where we are now, and it looks to be forming another bullish cup on Friday day 10. Gold could remain strong here in the 3rd daily cycle, or it can also slightly start to weaken and start to consolidate the recent gains further by chopping sideways until the next dcl.
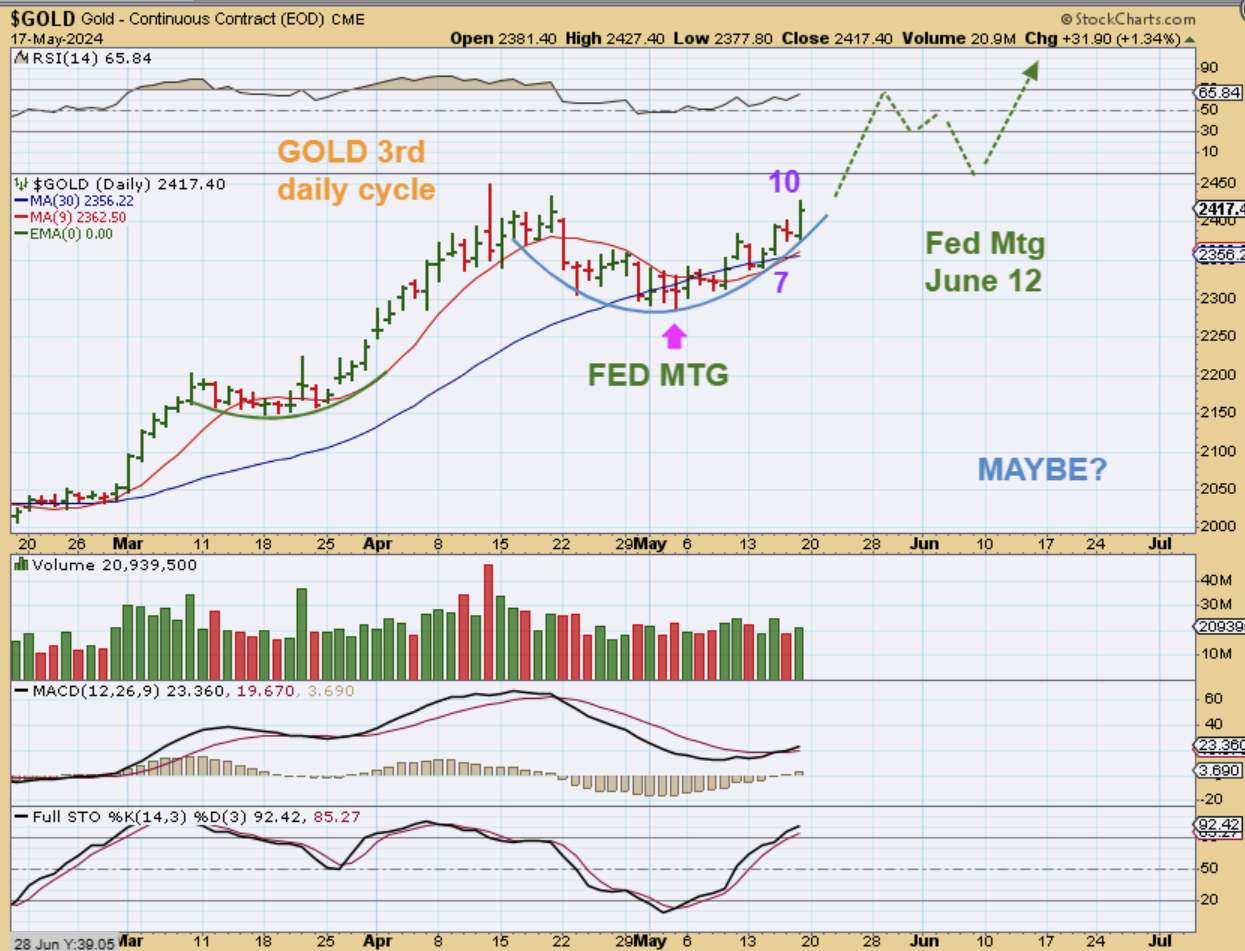
GOLD DAILY #3: Here I will just show a bullish version between now and the June 12th Fed Mtg.
.
You may recall that Gold was selling off into the May 1st Fed Mtg, but when he hinted that inflation was still manageable and then we also had the release of the CPI Numbers showing inflation dropped slightly, Gold has started to rise and formed the right side of this cup. That could continue until we get closer to the next Fed Mtg, due at June 12th. So as an idea or a guess, I drew a cup with a breakout and then a back test at the June Fed mtg. THIS is if the 3rd daily cycle forms as R.T. If it forms L.T., then we may see Gold get choppy after day 12 or 13 and chop sideways in to the fed day.
So let’s look at the weekly, simply knowing that we are on day 10 of the 3rd daily cycle…
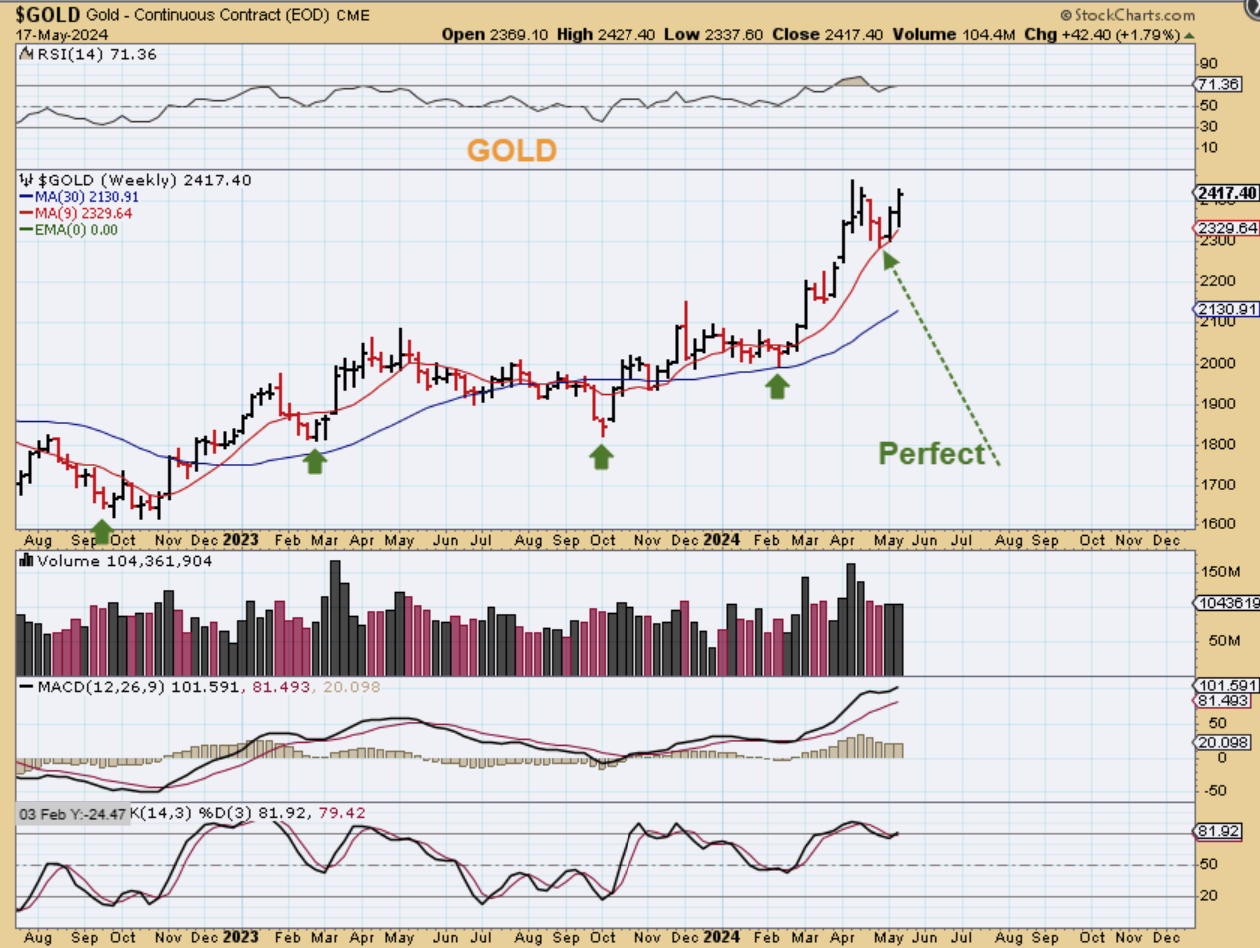
GOLD WEEKLY – The selloff or consolidation that we saw in Gold has reversed at the 10week ma and now we’ve had 2 weeks of strength out of those lows. This actually is a bullish set up, and it does look like Gold wants to go higher. That said, I am also aware that we are in the 3rd daily cycle, so we’ll see how high this wants to play out day by day. I will, of course, continue to discuss how it unfolds during the weekday reports.
.
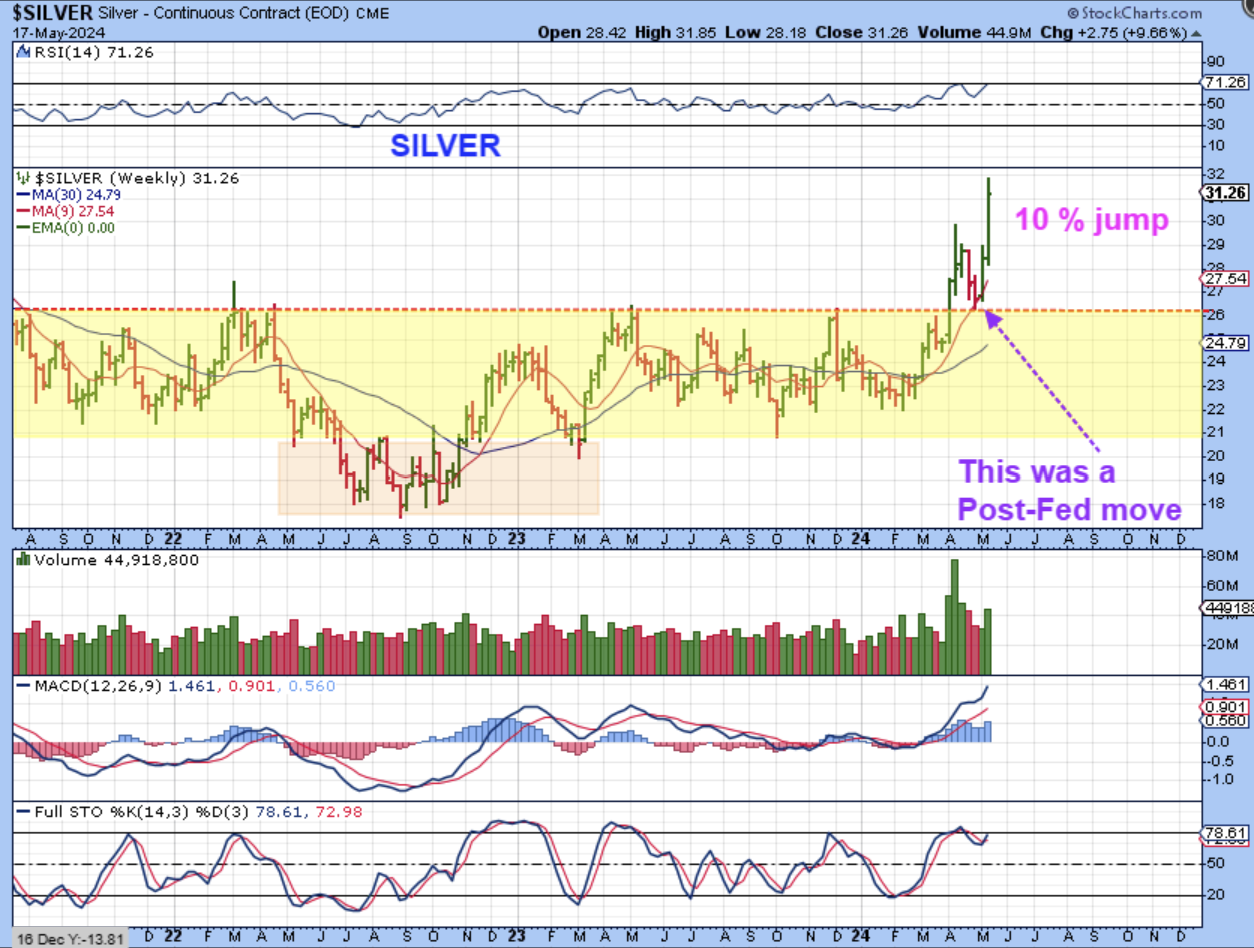
SILVER WEEKLY – Silver really took off last week and this week, after the Fed Chaiman discussed that rate cuts may still be on the table, the CPI Numbers came in weaker than expected, etc. Silver was up 10% and it has closed above that key $30 area.
.
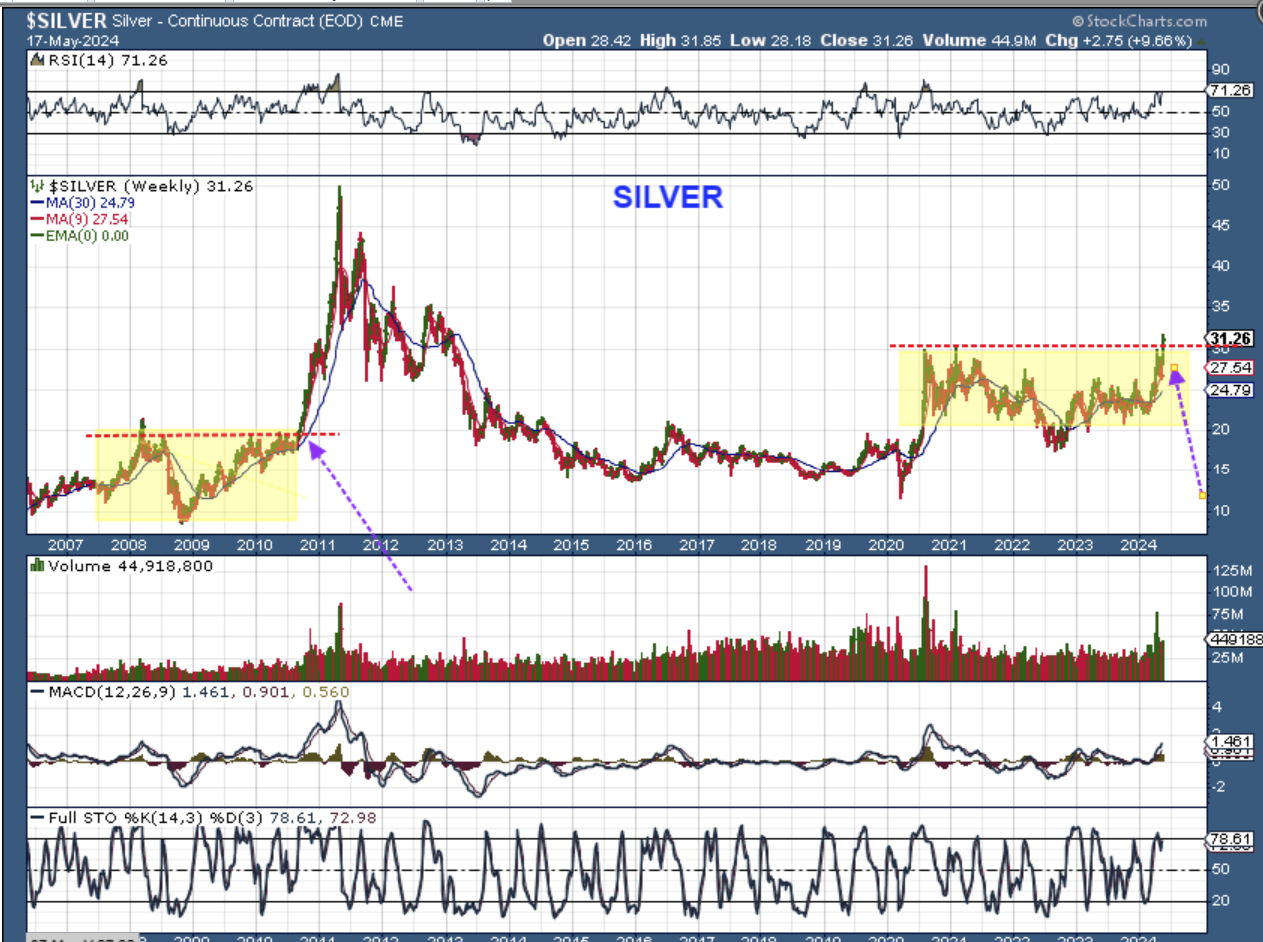
SILVER WEEKLY – I have been pointing out that the last time we saw a large consolidation from roughly 2008-2010 and Silver broke out from it, we saw a Moon Shot! Well, Silver is now above that $30 area and looks to be breaking out, so there is a chance that we could see acceleration now or after a back test this summer. Silver stocks did very well this week—-as expected!
.
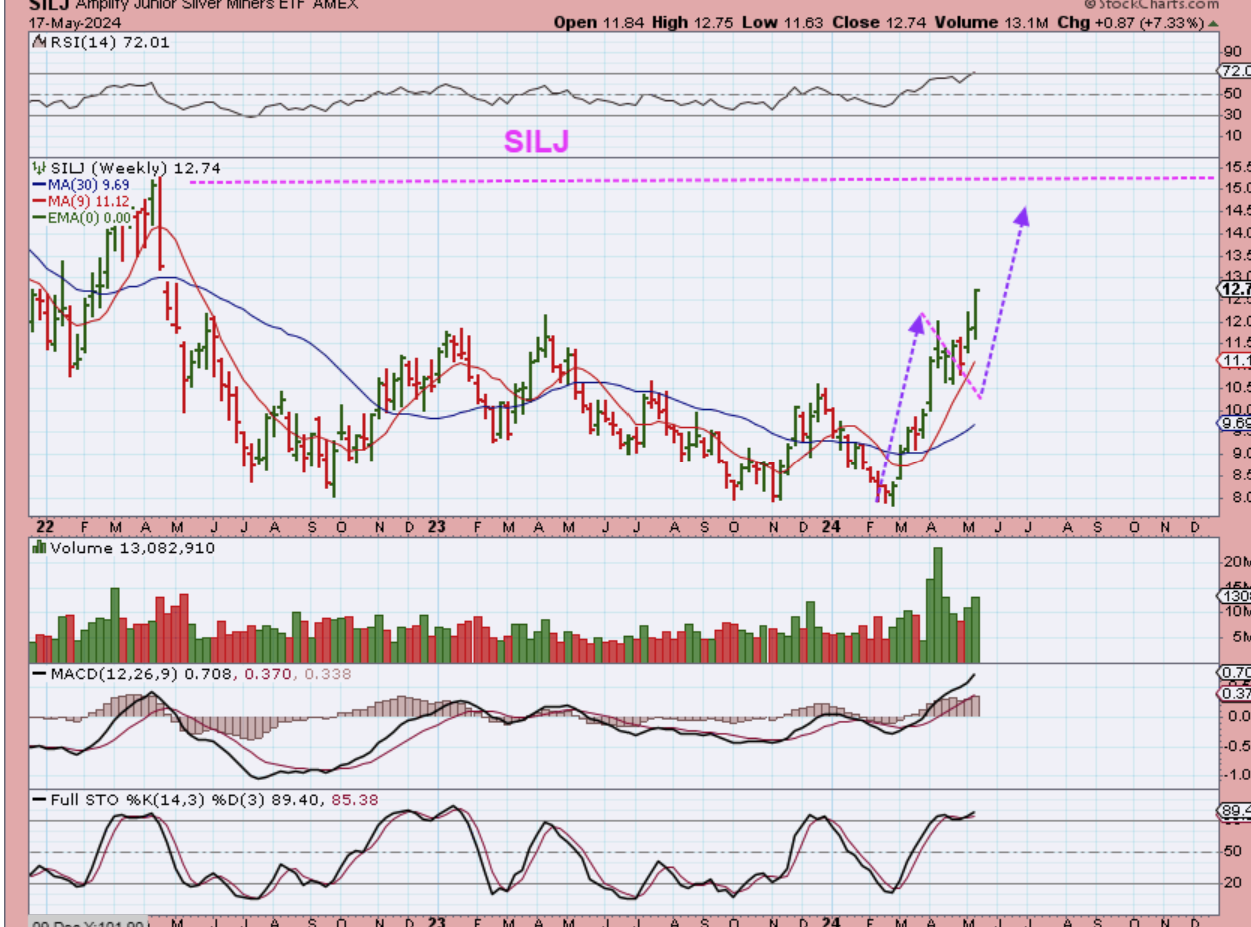
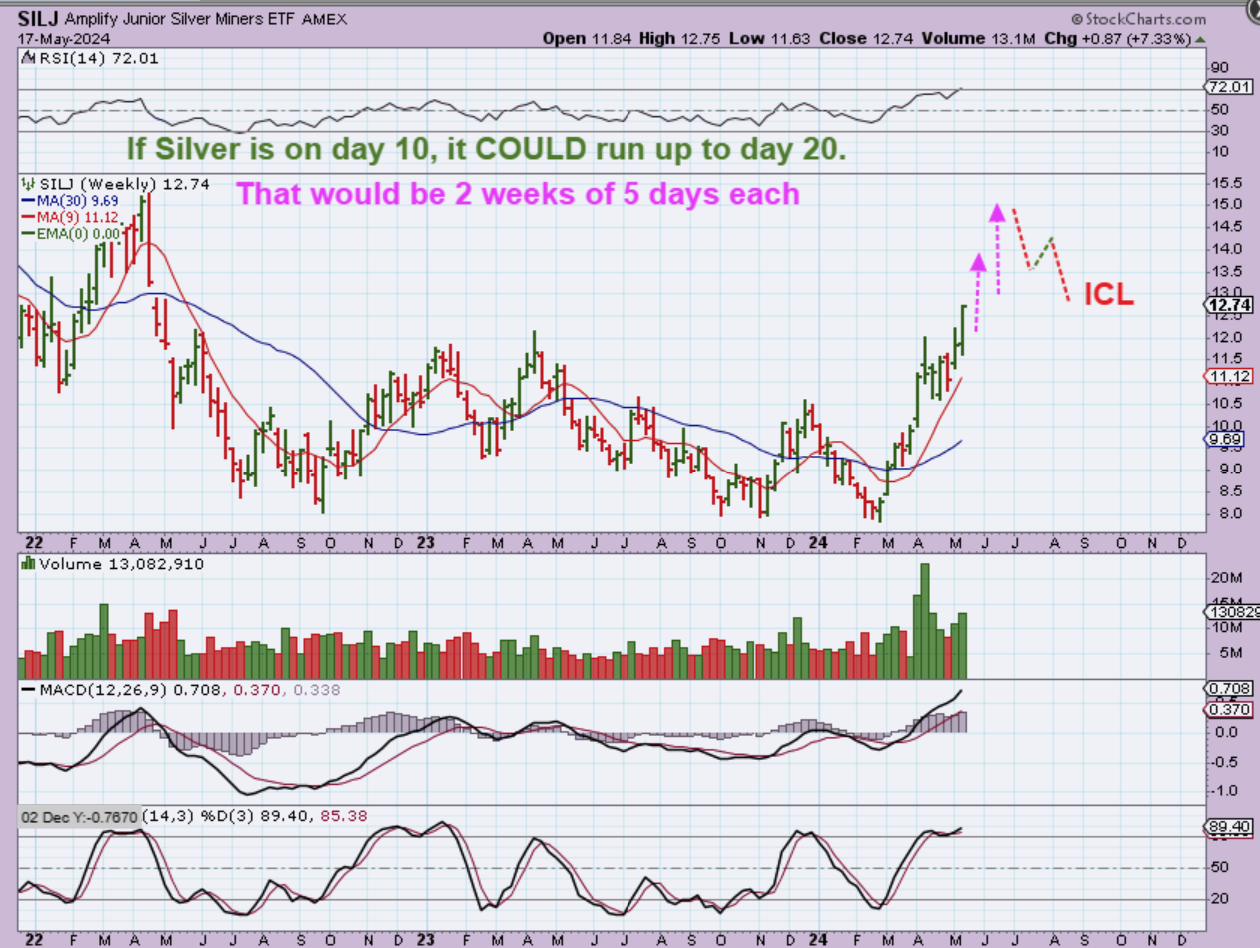
SILJ WEEKLY – This type of move could actually have an upside target of near $15, we just can’t say for sure whether that will happen immediately (in this 3rd daily cycle) or over time, but…
.
SILJ WEEKLY – SILJ has reached the overbought point on the weekly, but it could also continue higher for 2 weeks as shown here. Why do I say that? 2 weeks is only 10 trading days, and we are on day 10 for Silver. Please read the chart.
.
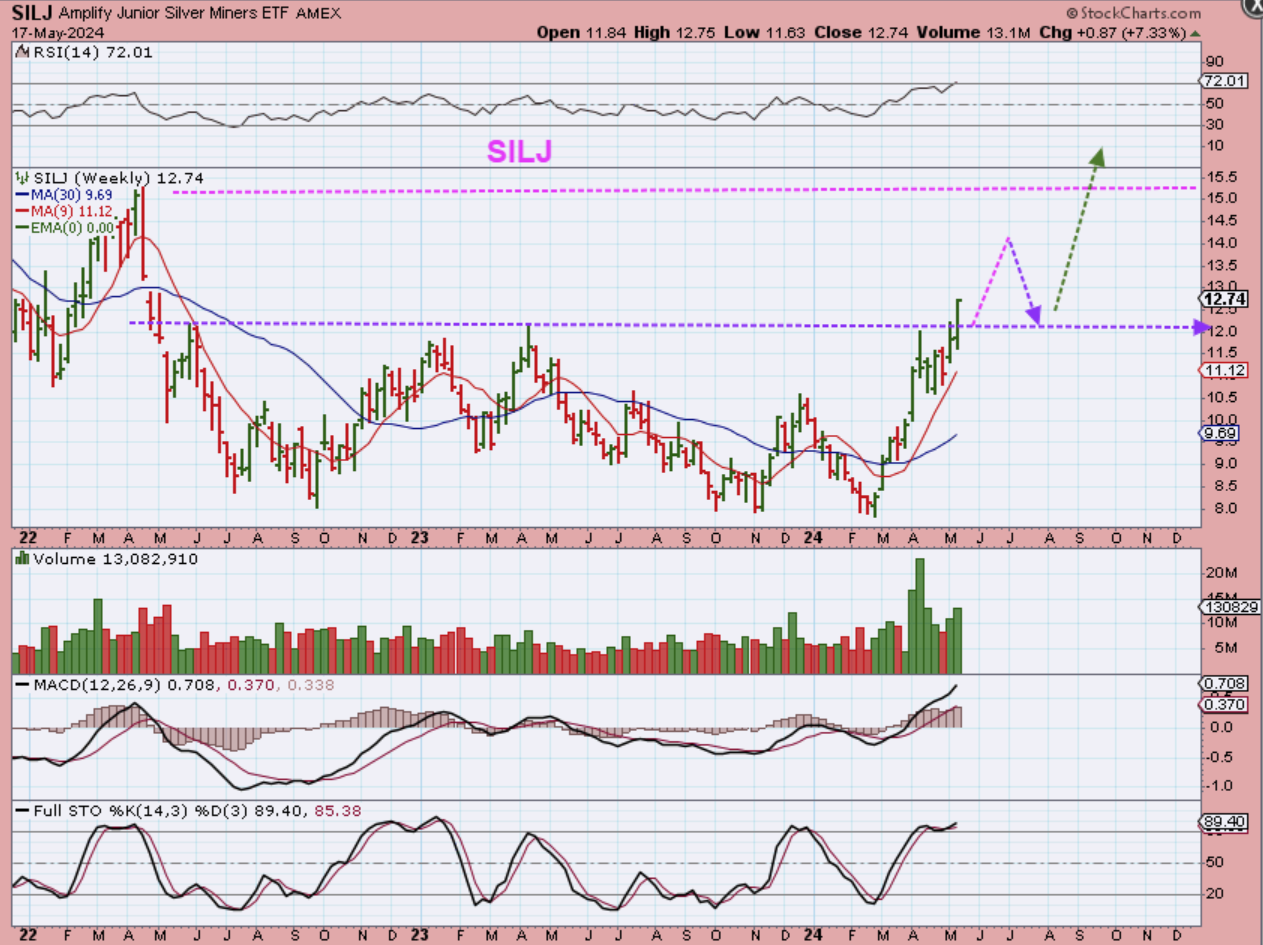
SILJ WEEKLY – Stepping back, we also see that SILJ actually just broke above the base. A quick rally to $15 could complete a run to the 2022 highs. I also drew a back test, since a dcl or eventually an ICL may cause a pullback.
.
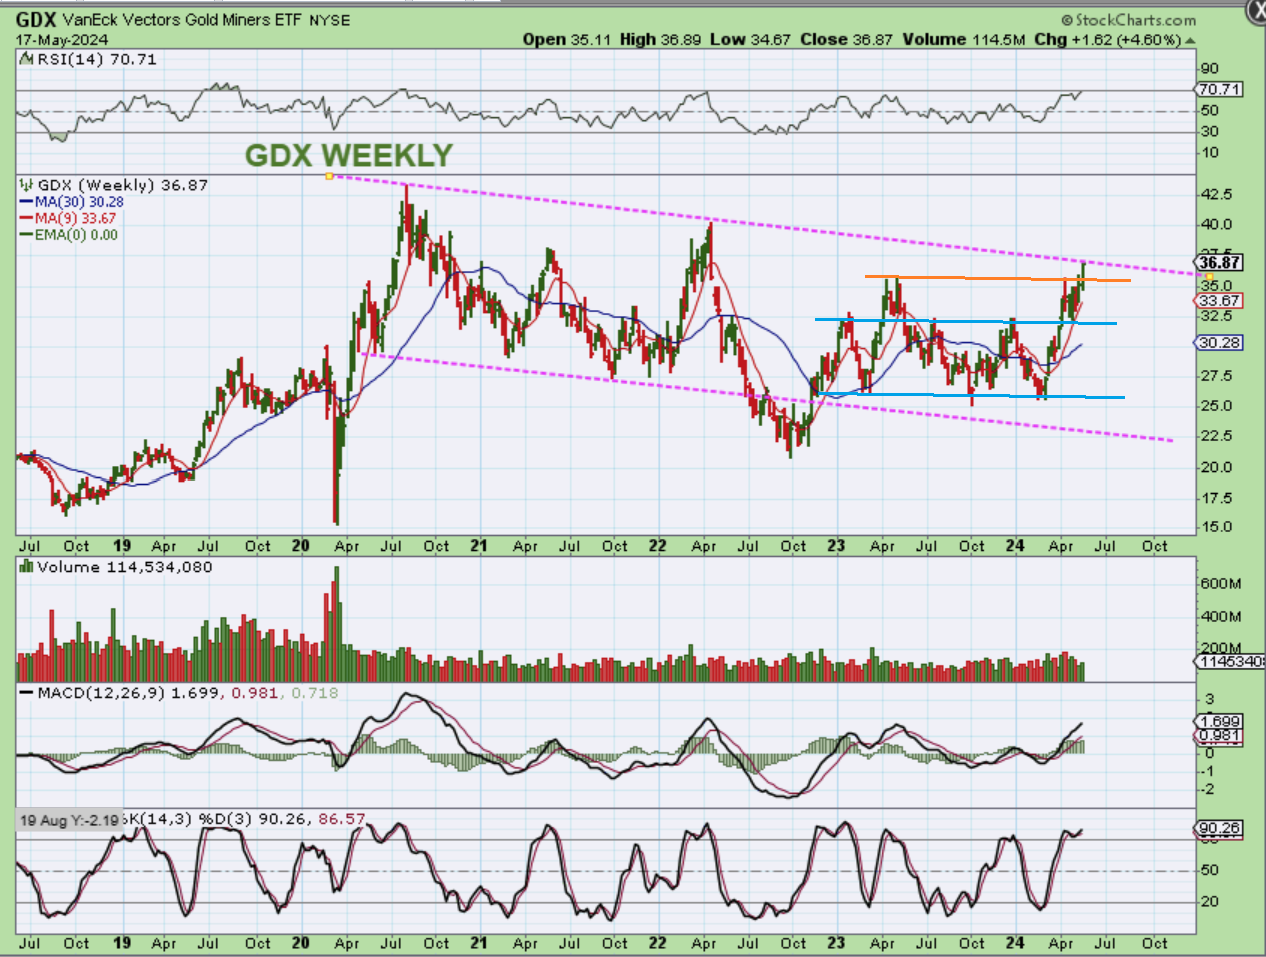
GDX WEEKLY –
1. GDX did not break out from the larger multiyear consolidation yet, but
2. It has broken above the blue base and orange prior highs of 2023.
3. It is at the top of the larger 4 year consolidation, so a breakout is likely imminent in 2024.
.
Recently I discussed that with Gold Miners like HMY, KGC, IAG, OR, etc taking the lead and running, and Silver stocks somewhat lagging, we could expect Silver stocks to finally play catch up. We may want to buy and hold a basket of Miners has always been the theme-to catch the surprises to the upside. That Silver Miner run has now happened. Let me just quickly show you something:
.
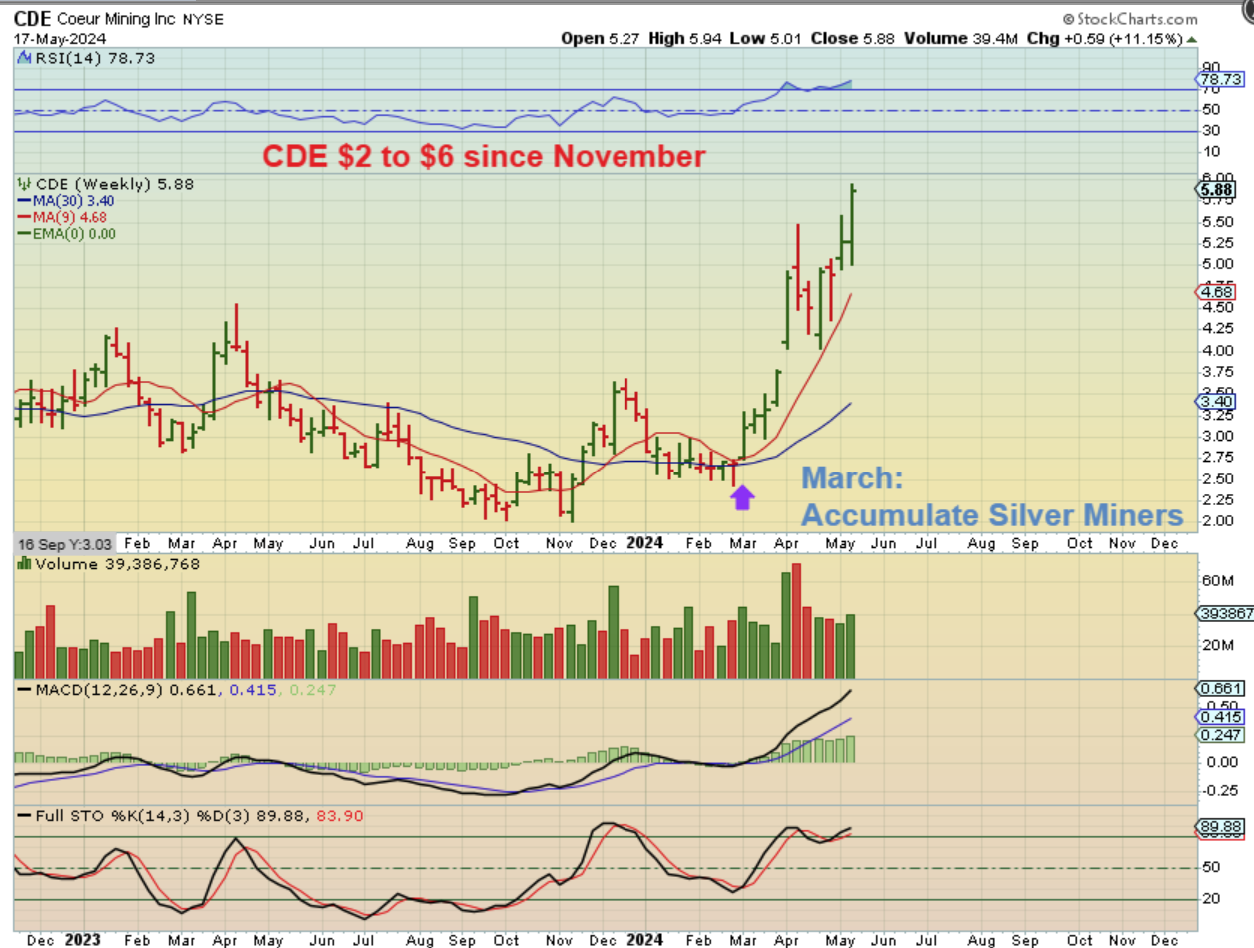
CDE has now tripled over time. Was it an easy ride? Not at all, most of that run came from March to now though, so the bulls are winning, that is for sure.
.
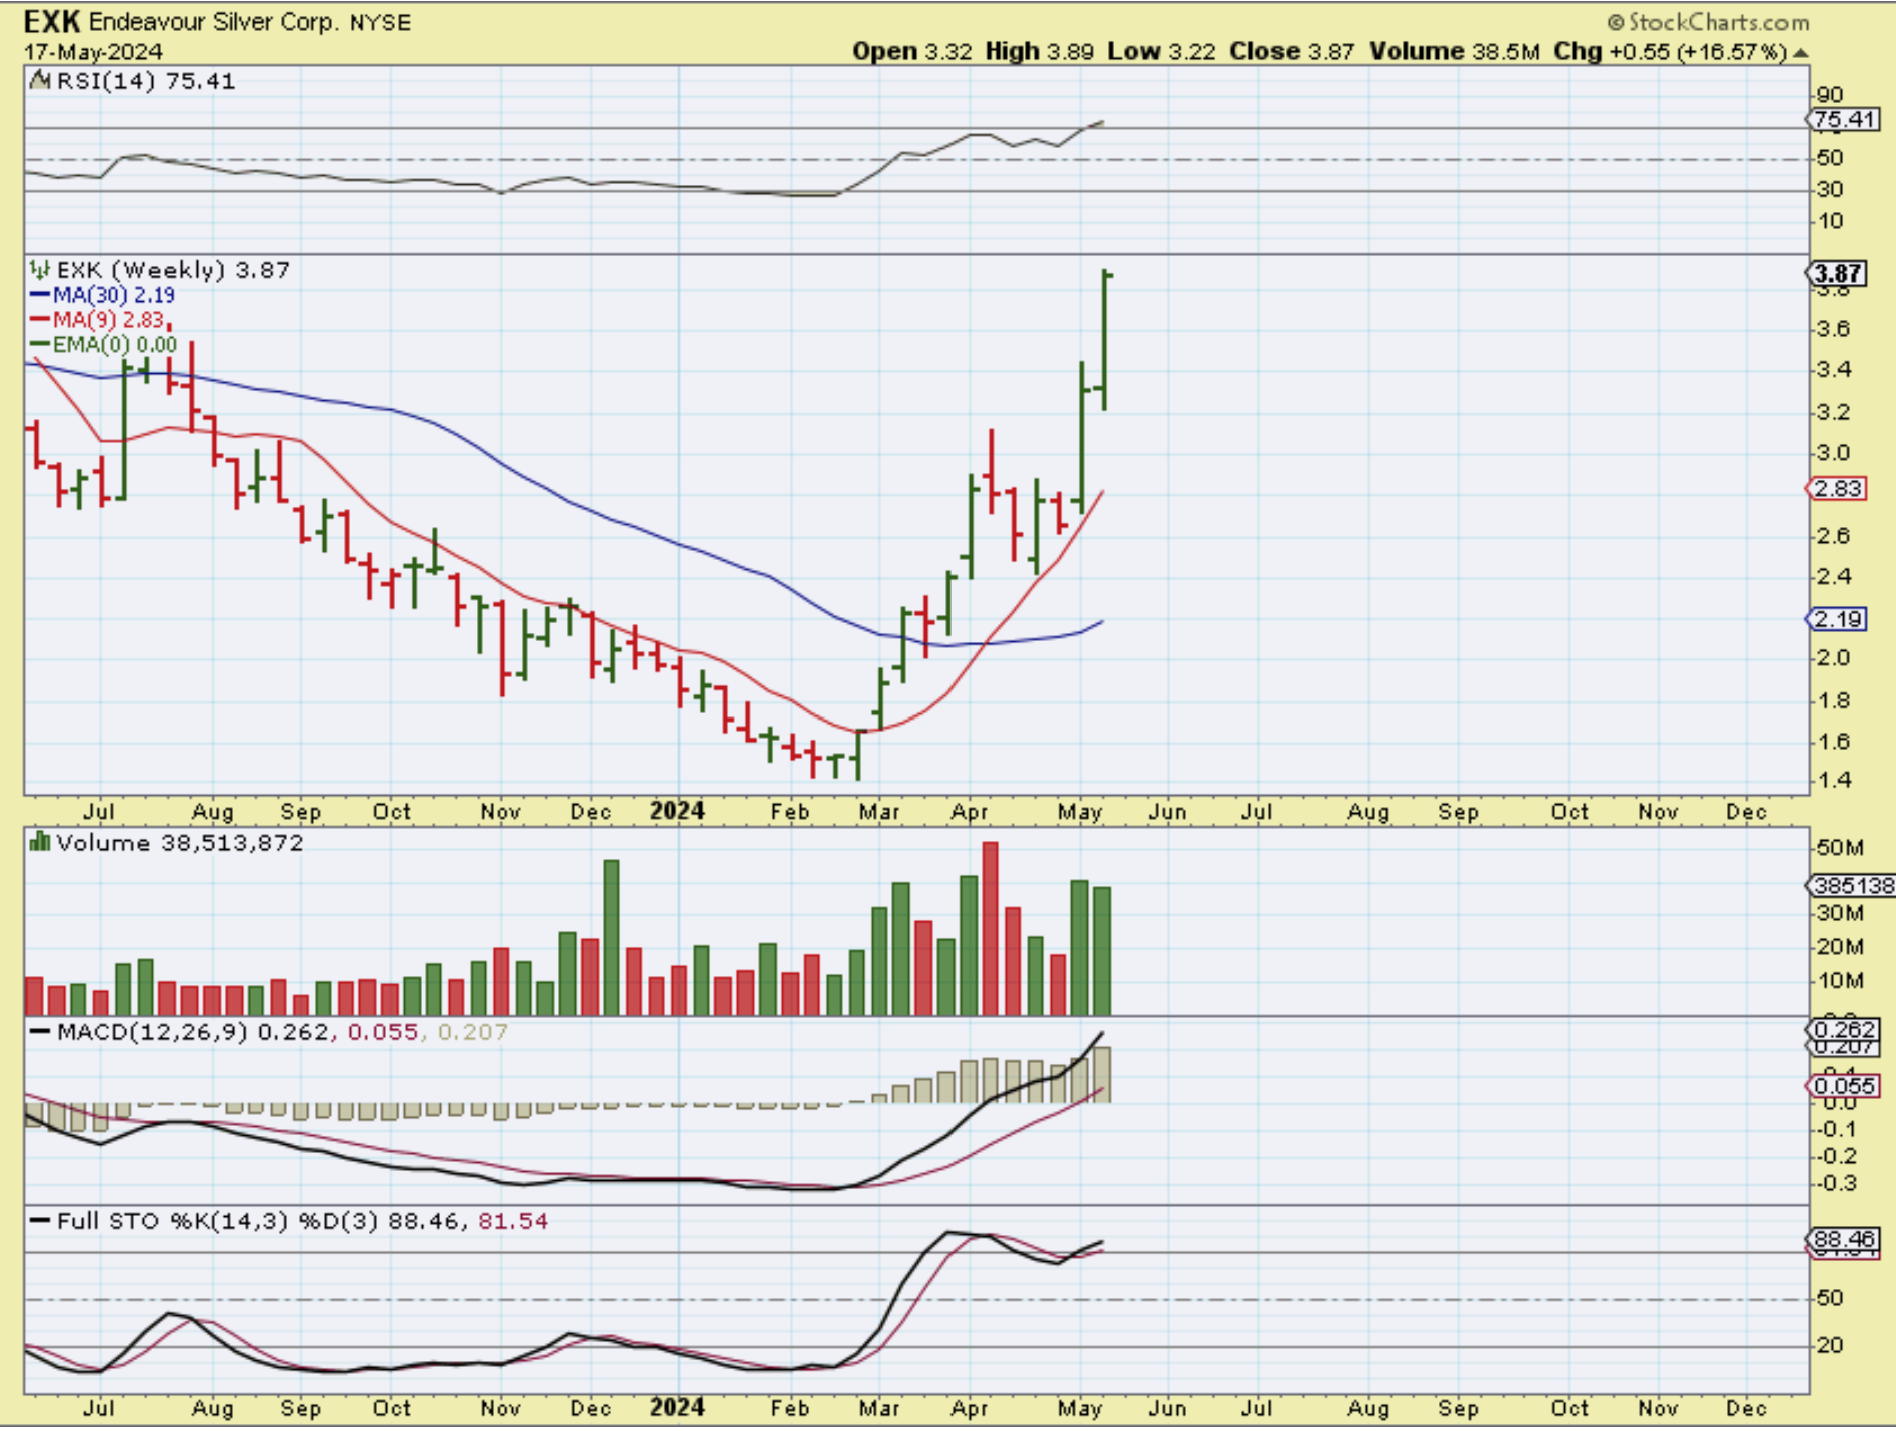
EXK, HL, FSM, GATO, etc are also running well.
EXK was up 25% 2 weeks ago and 16.57% last week alone (40%), but from the March time period it has almost tripled!! If you had these in your basket and simply bought and held them, you are feeling pretty good about this sector. April was choppy when we dipped into the dcl heading to the fed meeting, but Silver stocks have SURGED since that meeting.
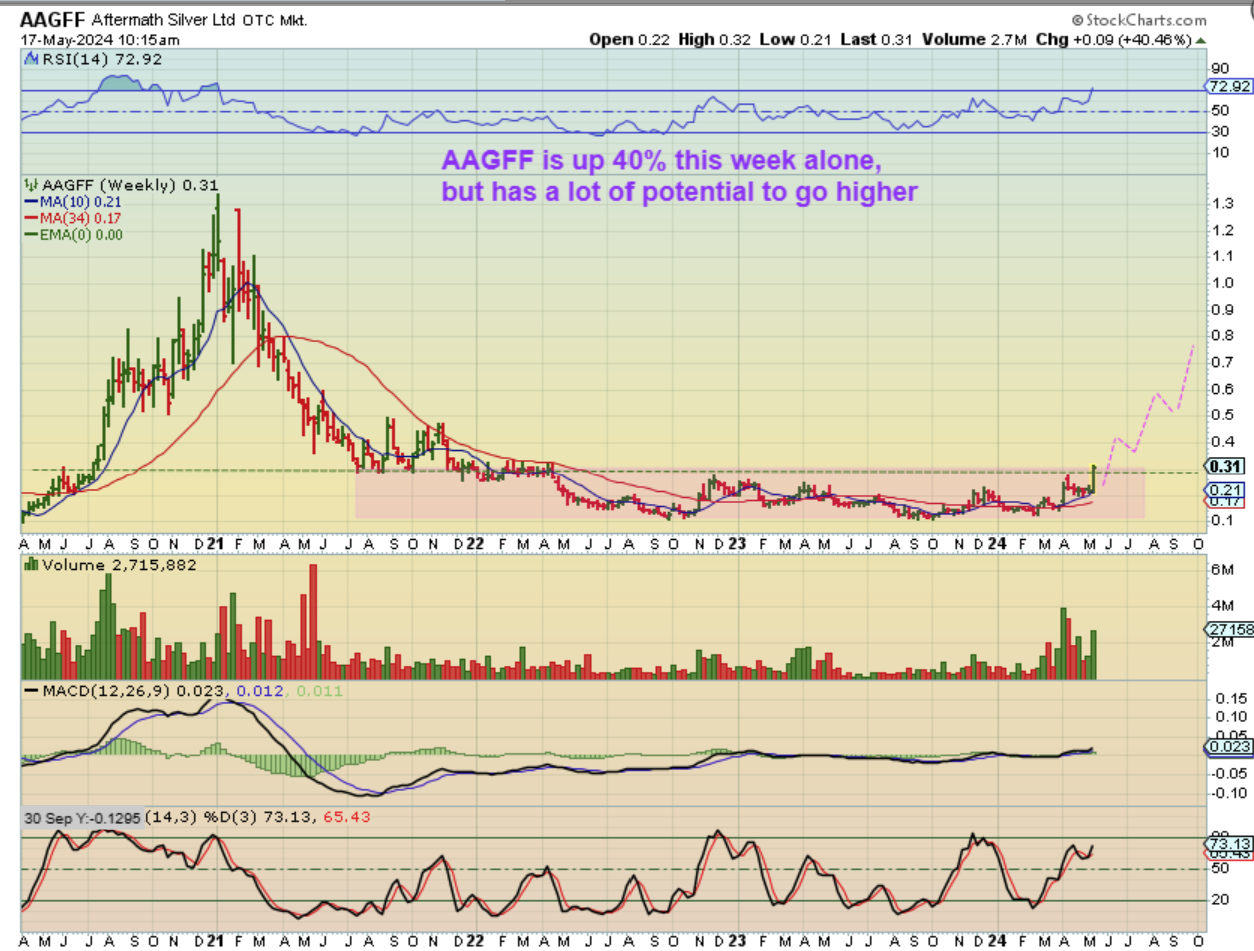
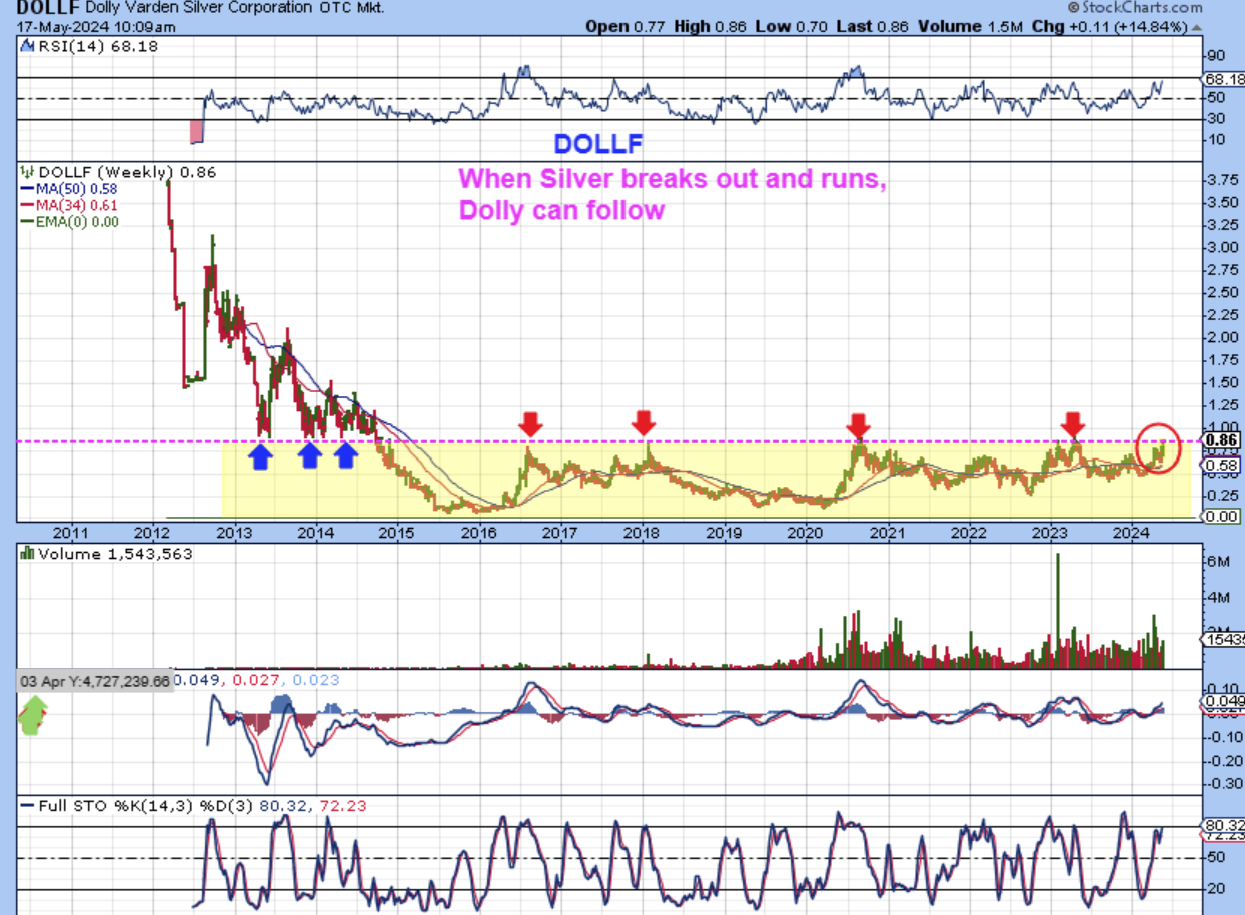
And often times after the larger Miners have been running for a while (Think of EGO, HMY, KGC, etc.), the juniors and explorers start to ramp up, and we have been seeing that take place now too. I will just discuss 2 of them to make that point: AAGFF and DOLLF, since I had been discussing them over the past weeks, but there are others too.
.
AAGFF WEEKLY – AAGFF is breaking from a long 2 year base now, and a 40% gain for the week is great. In fact, the larger weekly pop 5 weeks prior to this week was also a 42% up week, so these are making great progress.
DOLLF closed up 17.58 % for the week (this chart was captured on Friday at 10 a.m., so it moved even higher on Friday. You can see that when you step back, this also has a LONG Base, and a break from these bases can often lead to buyers paying attention and jumping in. The base is an accumulation phase. Read the chart please.
.
We have seen bullish action in the General Markets and Precious Metals sectors after they bottomed with the Fed Mtg and CPI Numbers. Oil broke down and remains choppy. At this point, another sector that looks to have bottomed is the Crypto area or Bitcoin, so I will discuss that below. Enjoy your weekend!
.
~ALEX
.
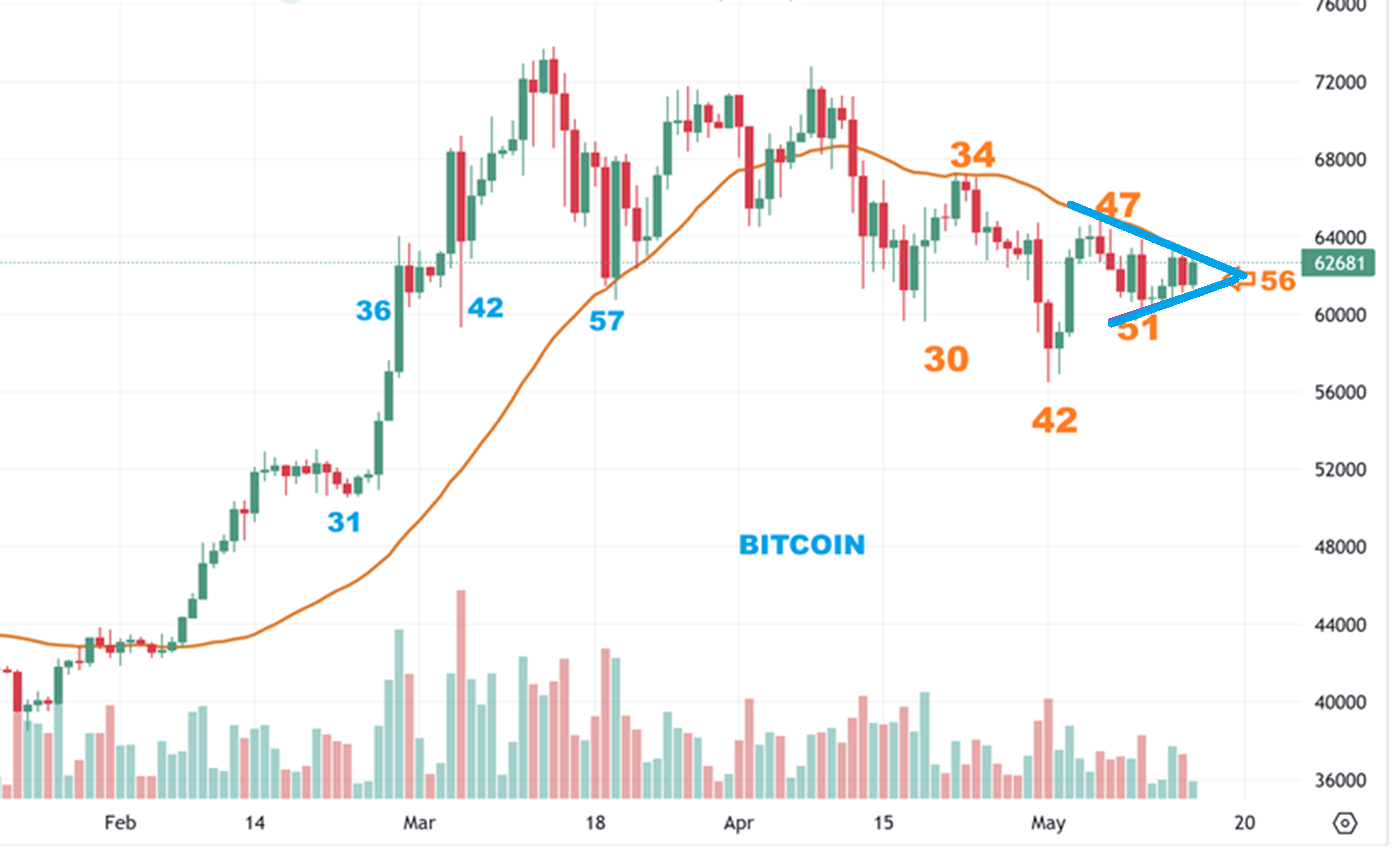
Below are 2 of a few charts that I used this week to show that BITCOIN bottomed:
.
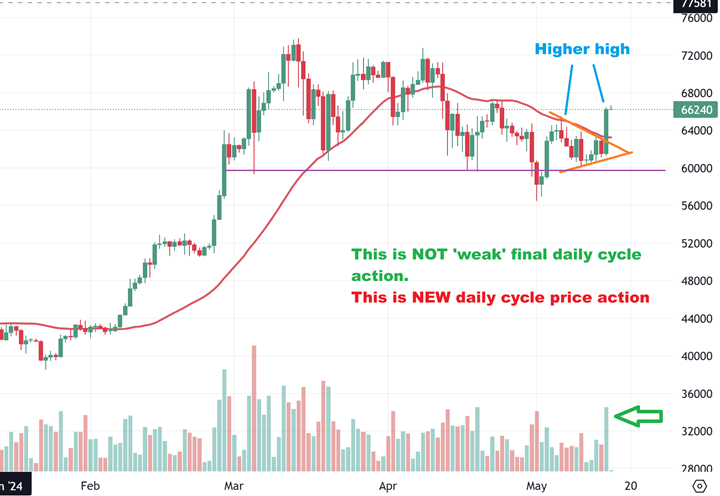
I mentioned that BITCOIN had formed a triangle by day 56, and if we see a breakout, that should identify a dcl.
.
BITCOIN broke out and made a higher high and a higher low with that triangle, so a dcl was marked and now we can start another 60 day cycle, most likely higher. Now a check of the weekly chart should be interesting…
.
Now a check of the weekly chart should be interesting…
.
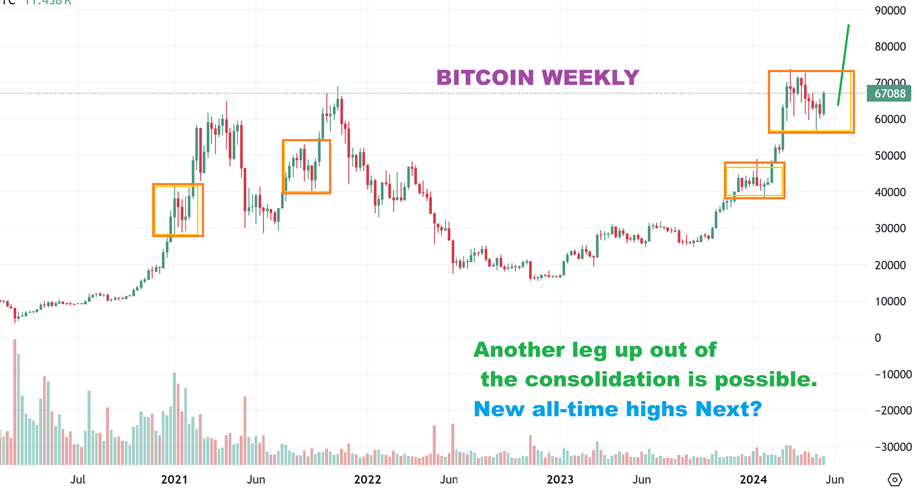
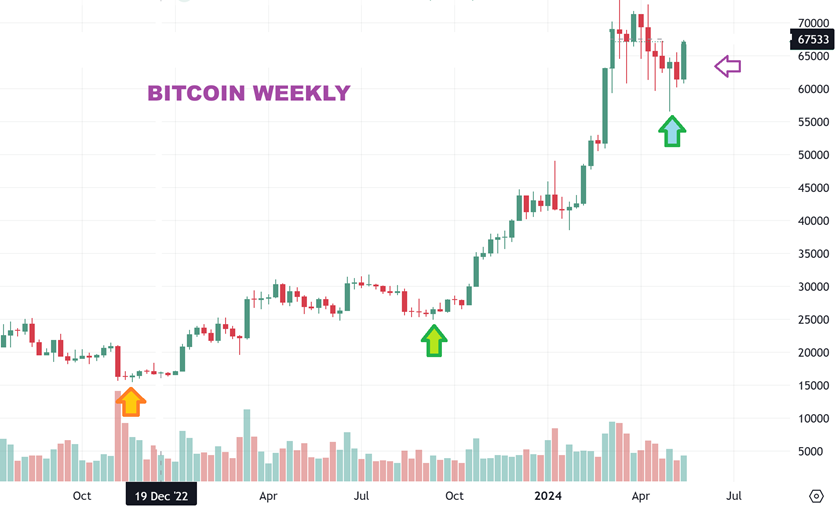
BITCOIN WEEKLY: That is a beautiful weekly candle and logically, I would not expect these candles to show up at the end of a daily cycle, before it bottoms. That is when the cycle should be at its weakest. So that tells me that we are seeing strength, and we know that these larger weekly candles show up after a low is in place.
.
BITCOIN WEEKLY: It would now stand to reason that we could see another run higher. A measured move higher is ‘Roughly’ $92,000 if volume and strength comes into the sector. With the ETFS & big players now buying, this candle may trigger that buying.