
Thursday May 16th _ They’re Still Running
.
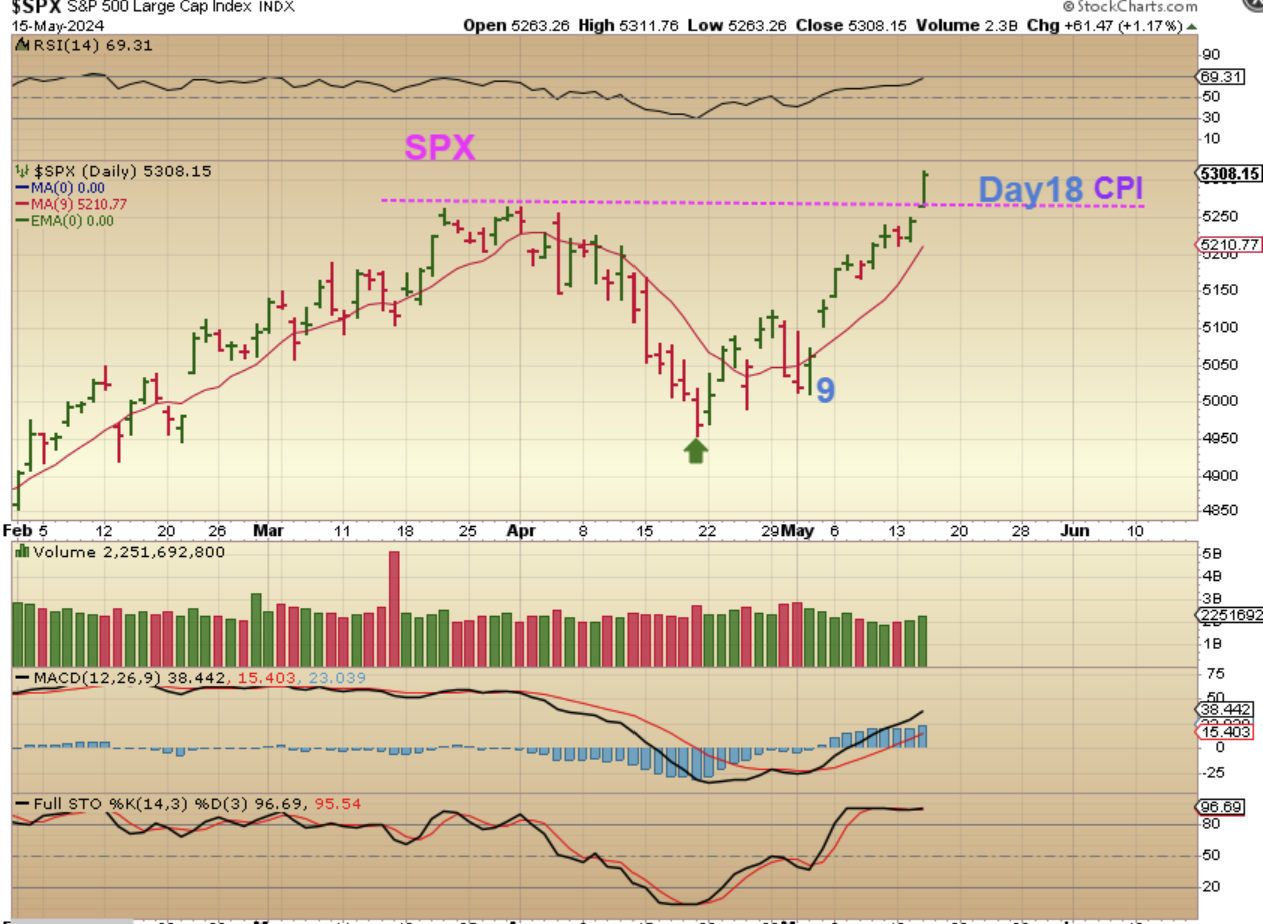
SPX – The CPI Number showed less inflation than estimated and the Bulls just took off running. 🙂 With an ICL in place, the only selling that would likely have taken place would have been a 1/2 cycle dip, but that didn’t happen. The bulls are still running and TQQQ, SOXL, SPXL, and many stocks continue making gains.
.
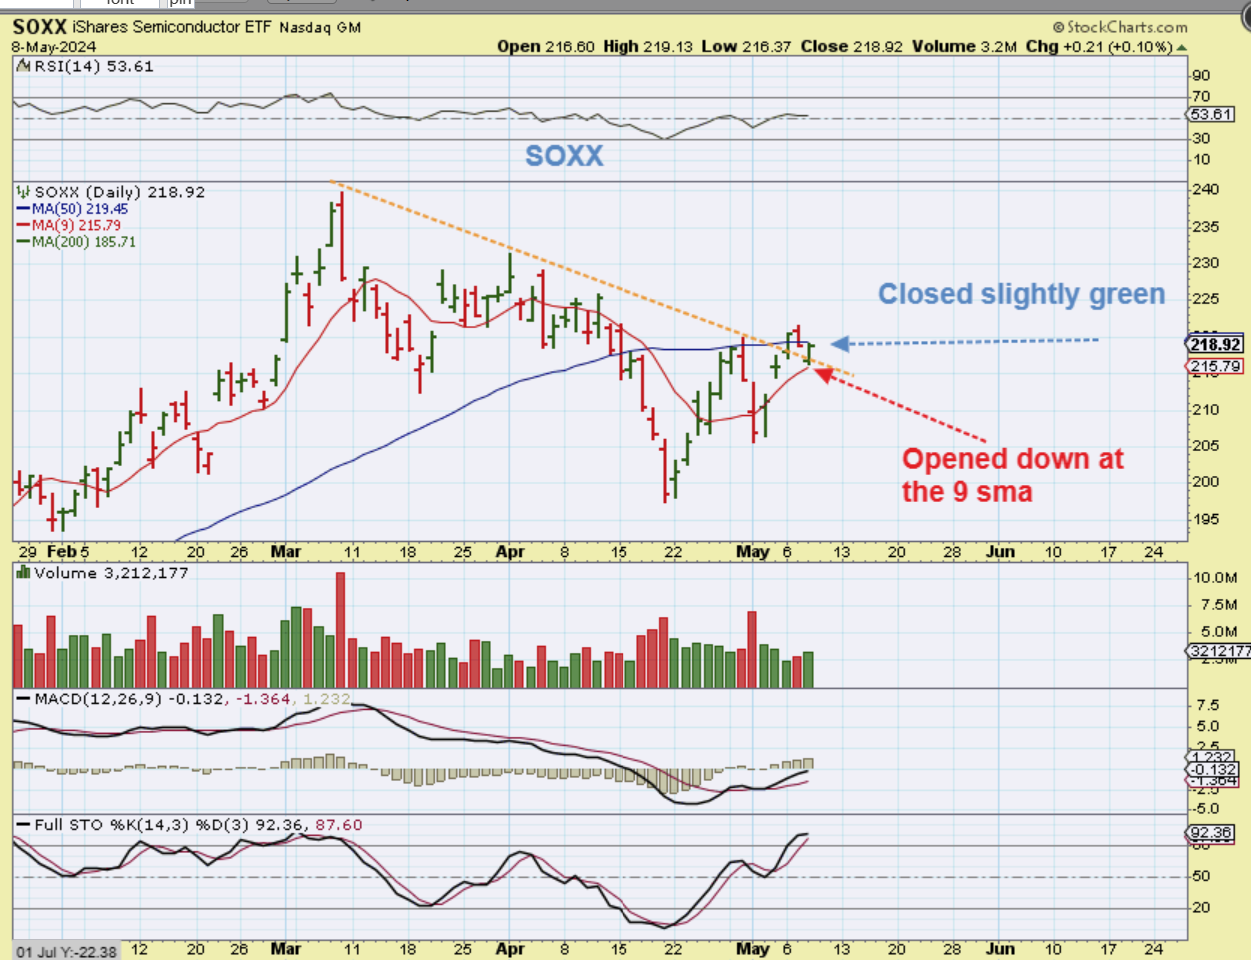
SOXX – You may recall that on May 8th, I pointed out that the SPX & NASDAQ already broke out above their downtrend lines & their 50sma and were running higher, but the SOXX was lagging. I thought that this reversal at the 9sma could be another good entry (lagger) with a stop under the 9sma.
.
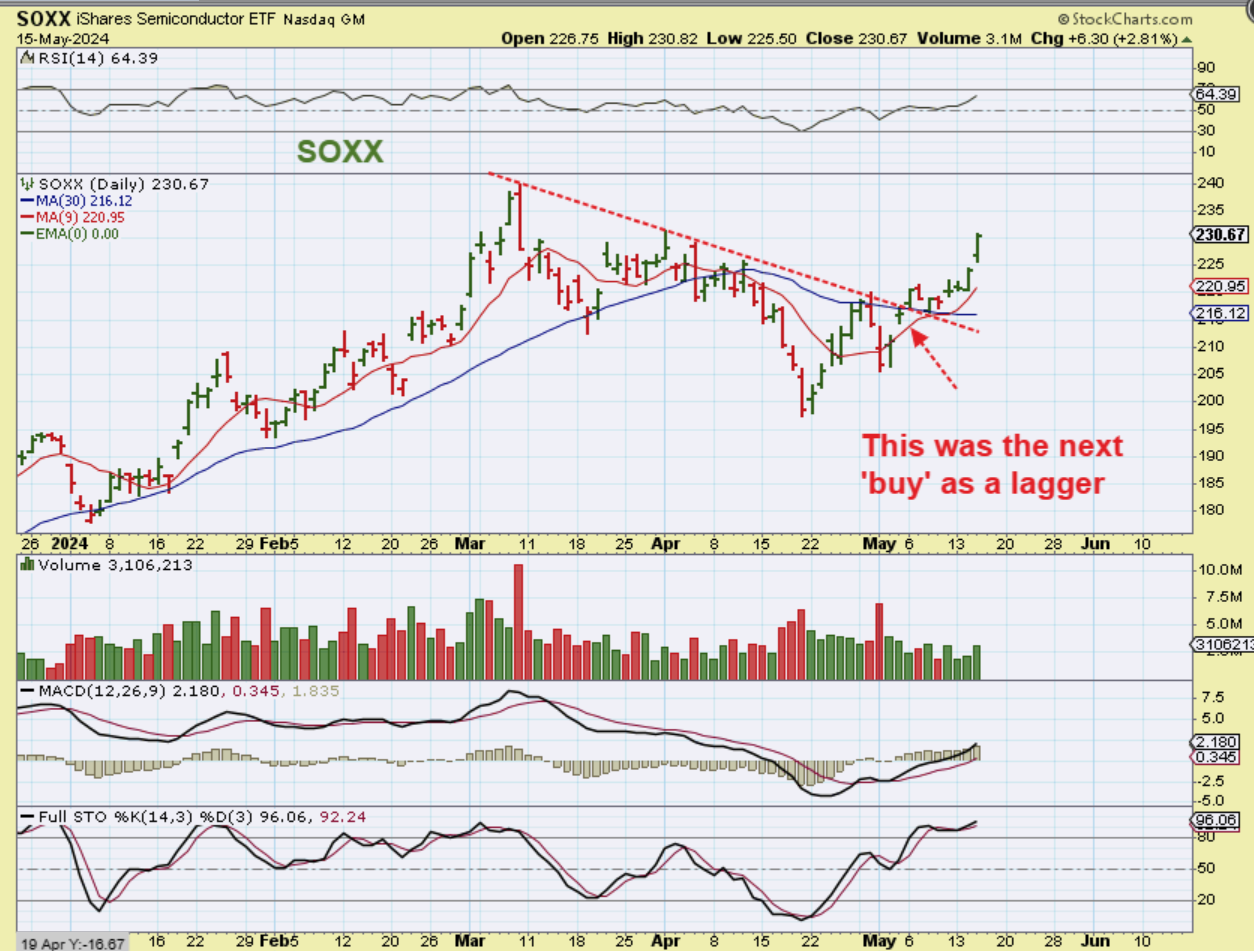
SOXX -That arrow should be pointing 3 candles to the right, but this downtrend line is where the next buy (SOXL) would have made a nice entry. The bulls are running. The next good entry will either be a half cycle dip or the next dcl , but that is not due for weeks actually.
.
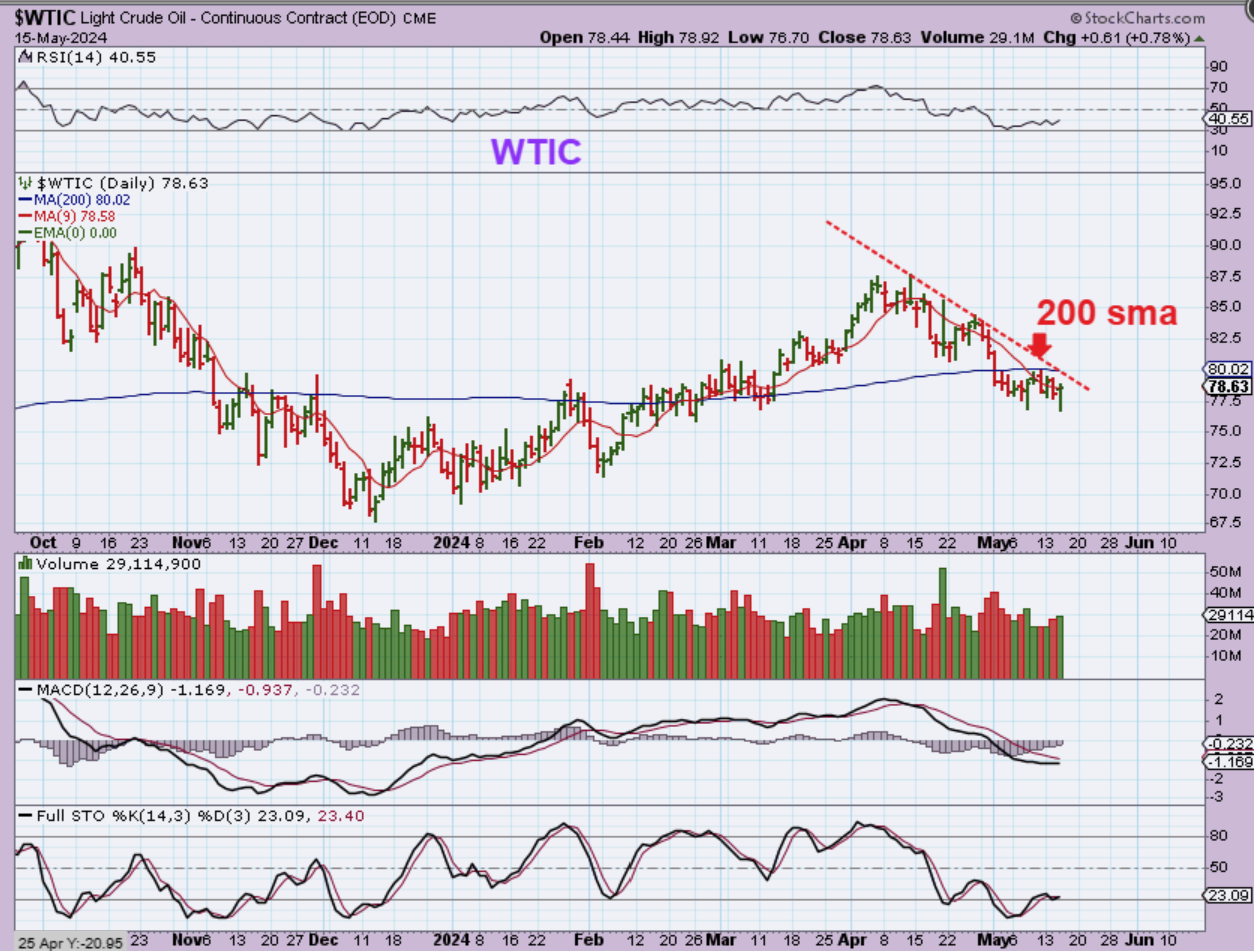
WTIC – Oil is still under the 200sma.
.
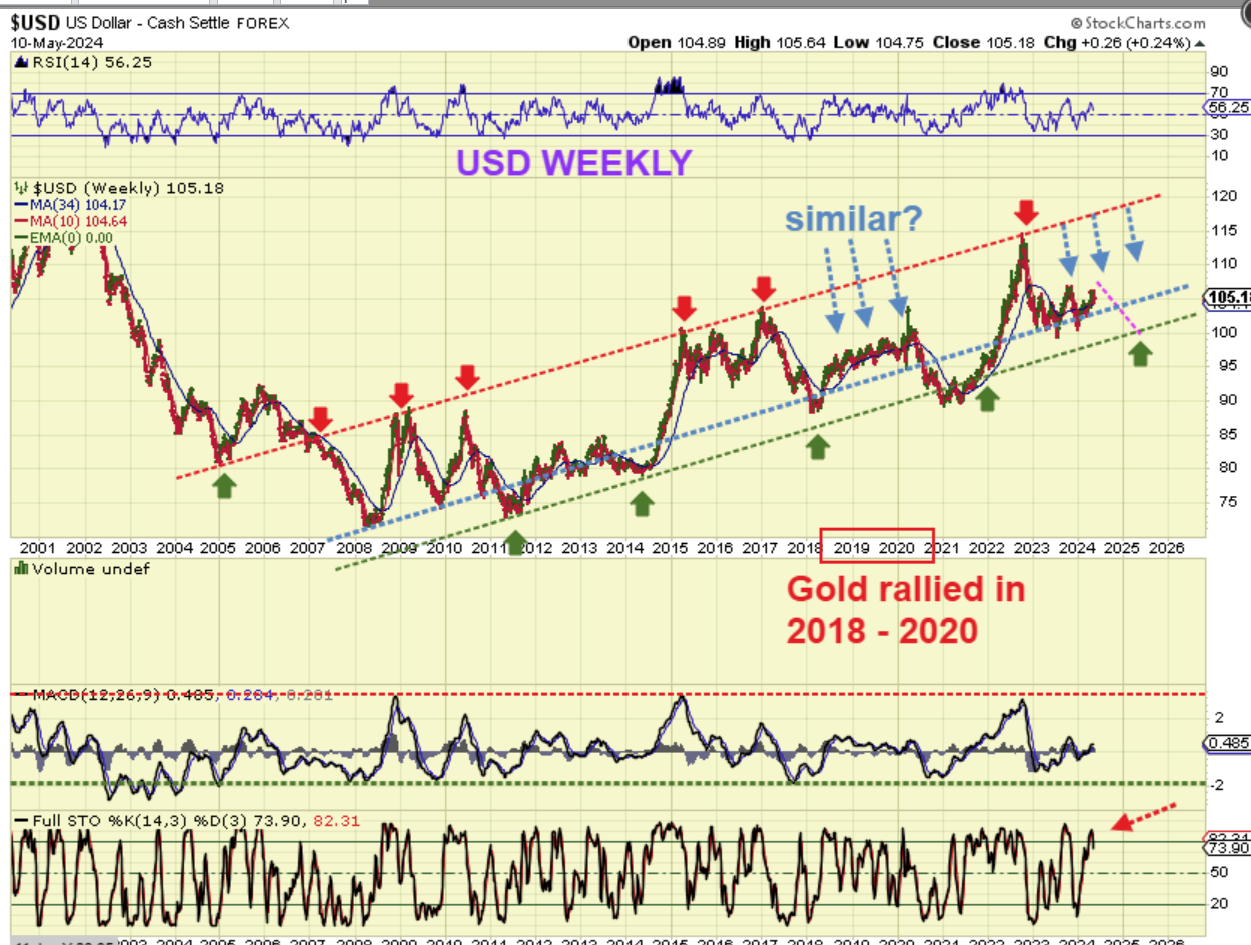
The USD MAY 10 – In recent reports, I showed that the USD seems to be rolling over and should go lower.
.
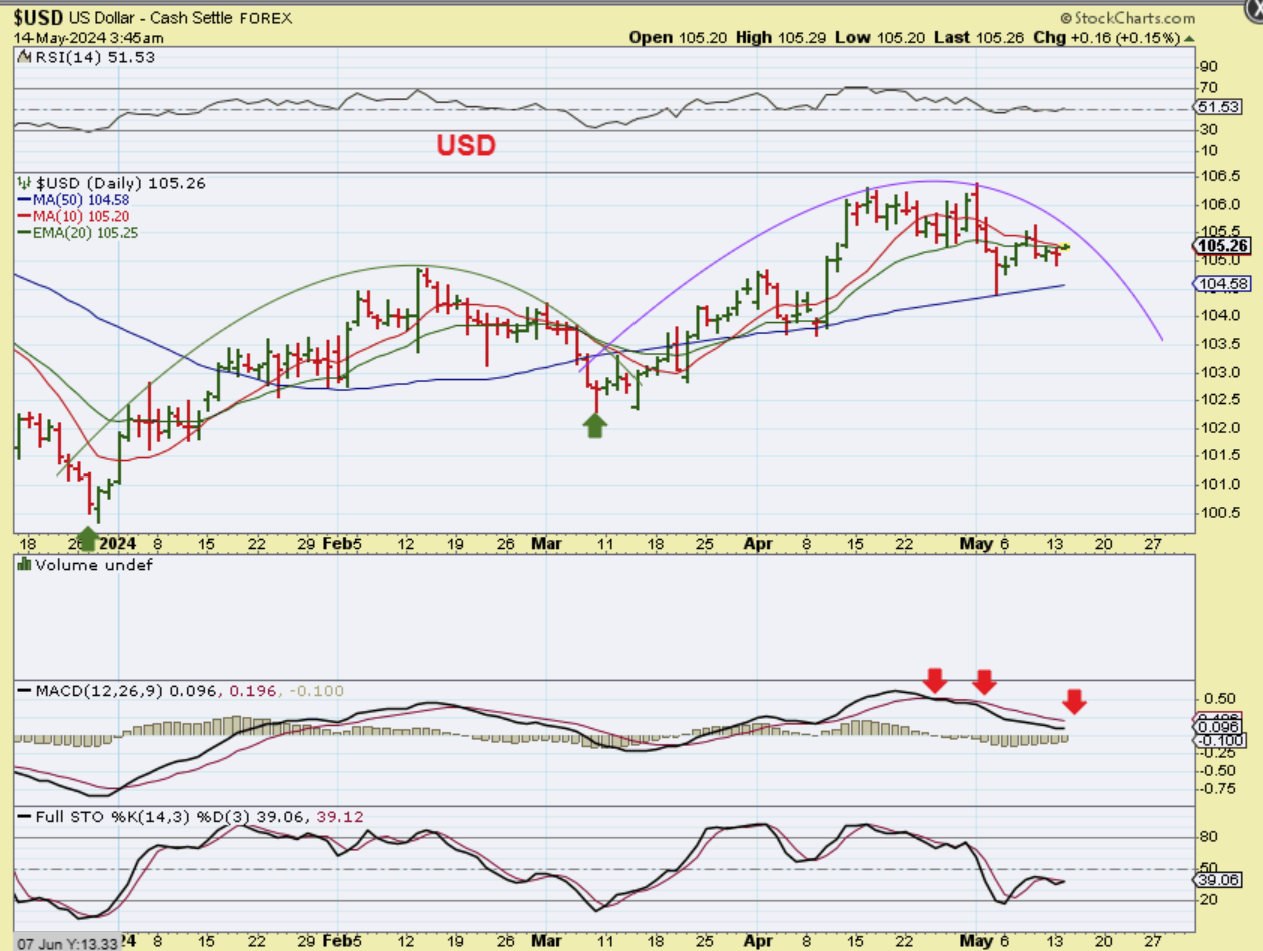
The USD May 14th, I still saw the USD as likely rolling over…
.
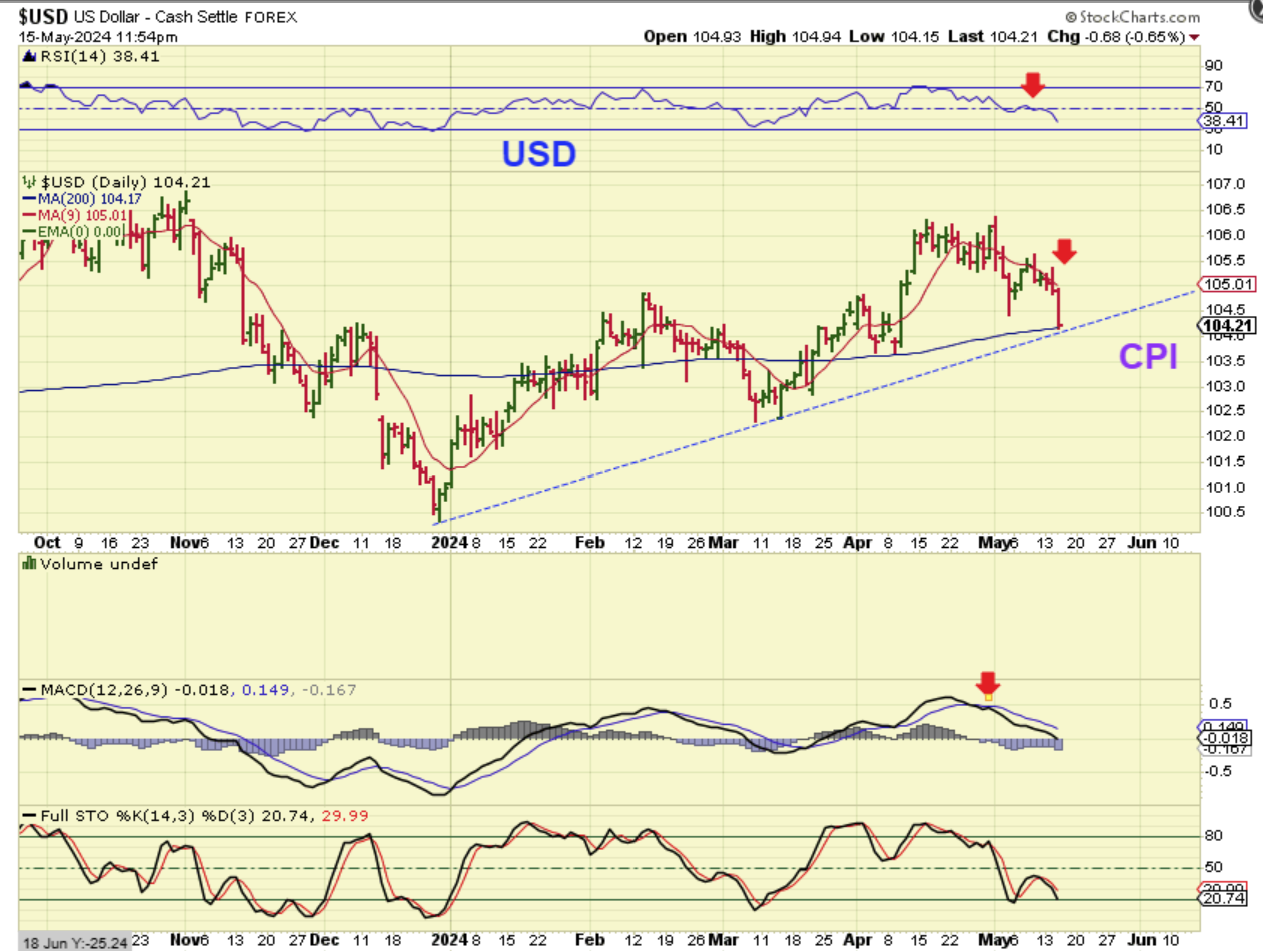
The USD rolling over. The USD plunged to support with the CPI Numbers being released. It could bounce, but it did NOT like the CPI Numbers (or what it may mean for interest rates).
.
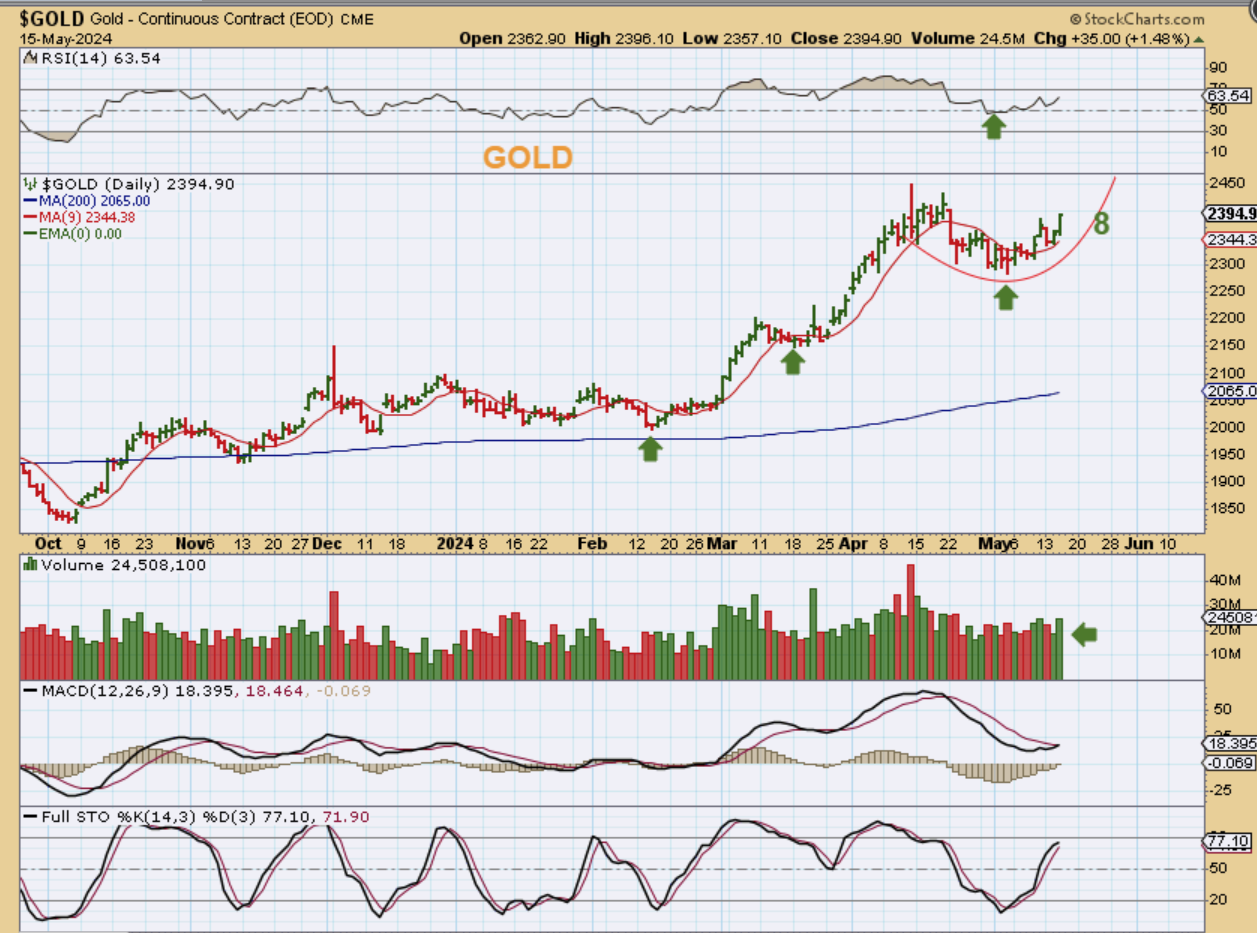
GOLD Wednesday on day 8, Gold started moving higher and closed near the highs of the day. This is a bullish set up after the CPI Report.
..
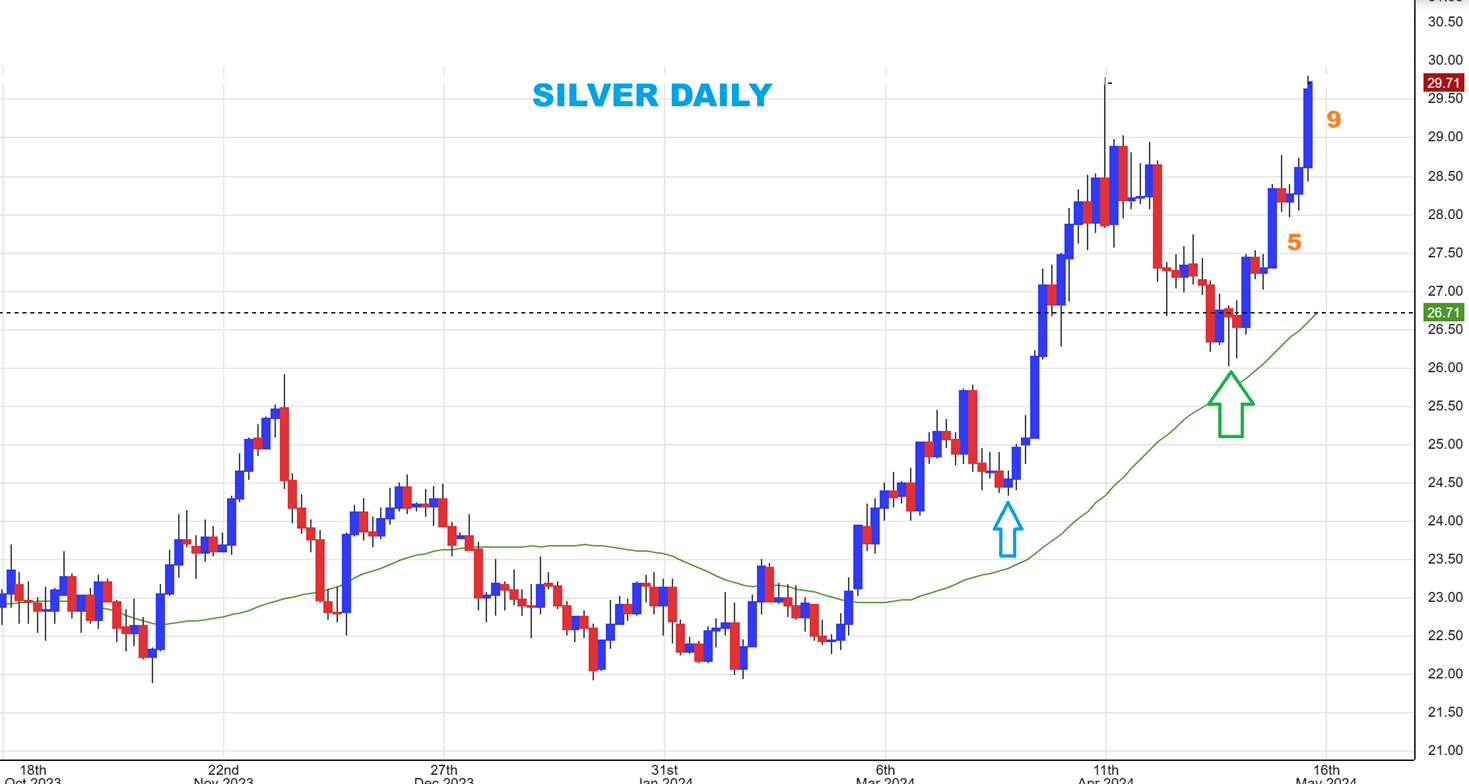
SILVER surged on day 9 and that steep rise for Silver out of the dcl is showing strength. The first target should be $31 ish. Notice that we are almost touching $30. We are almost at $30. We are right about at $30.
.
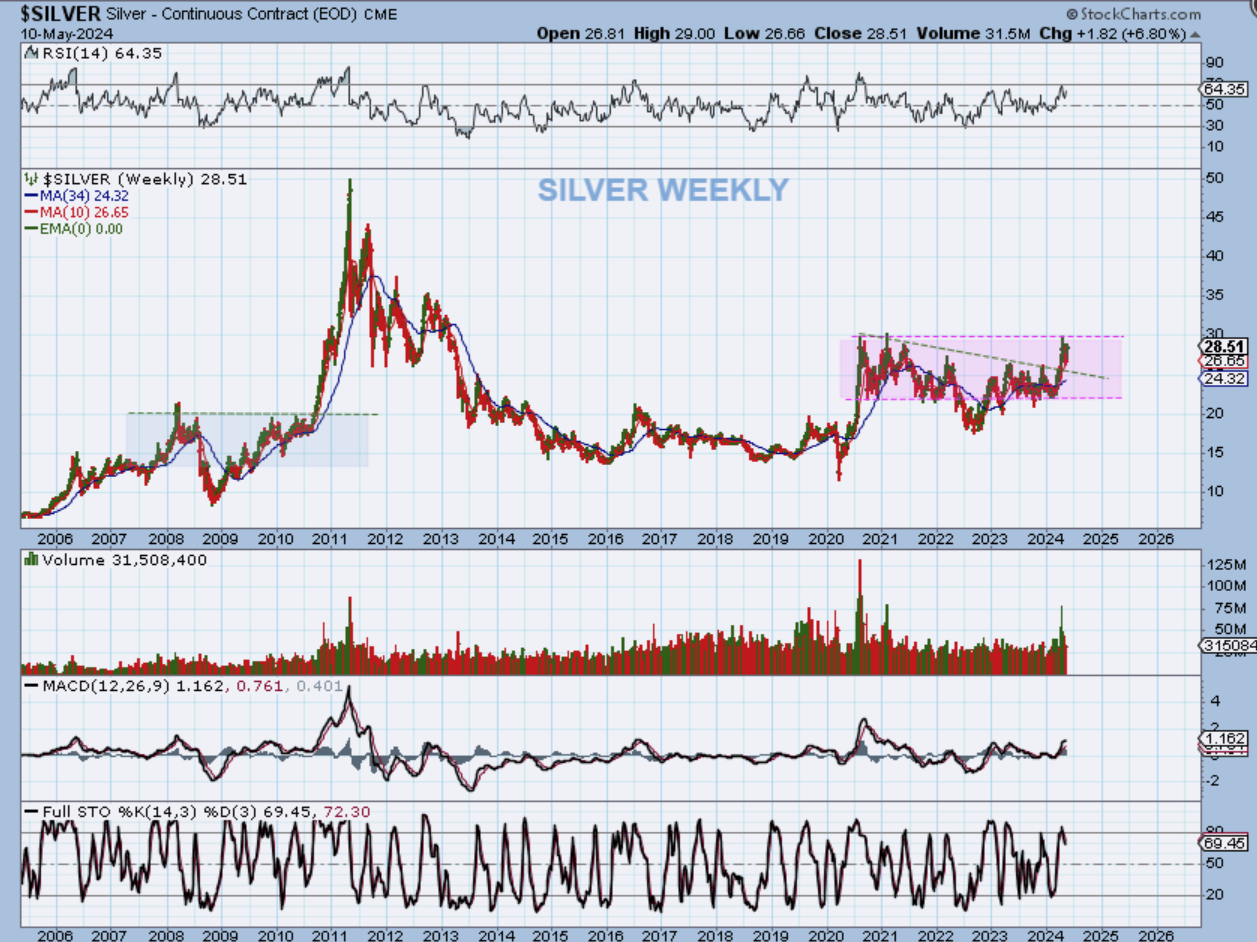
SILVER – Did you remember that in my weekend chart I showed that $30 was pretty important? So will this pull back as L.T., or break out and scream higher with that CPI Number giving it a push? Stay tuned.
.
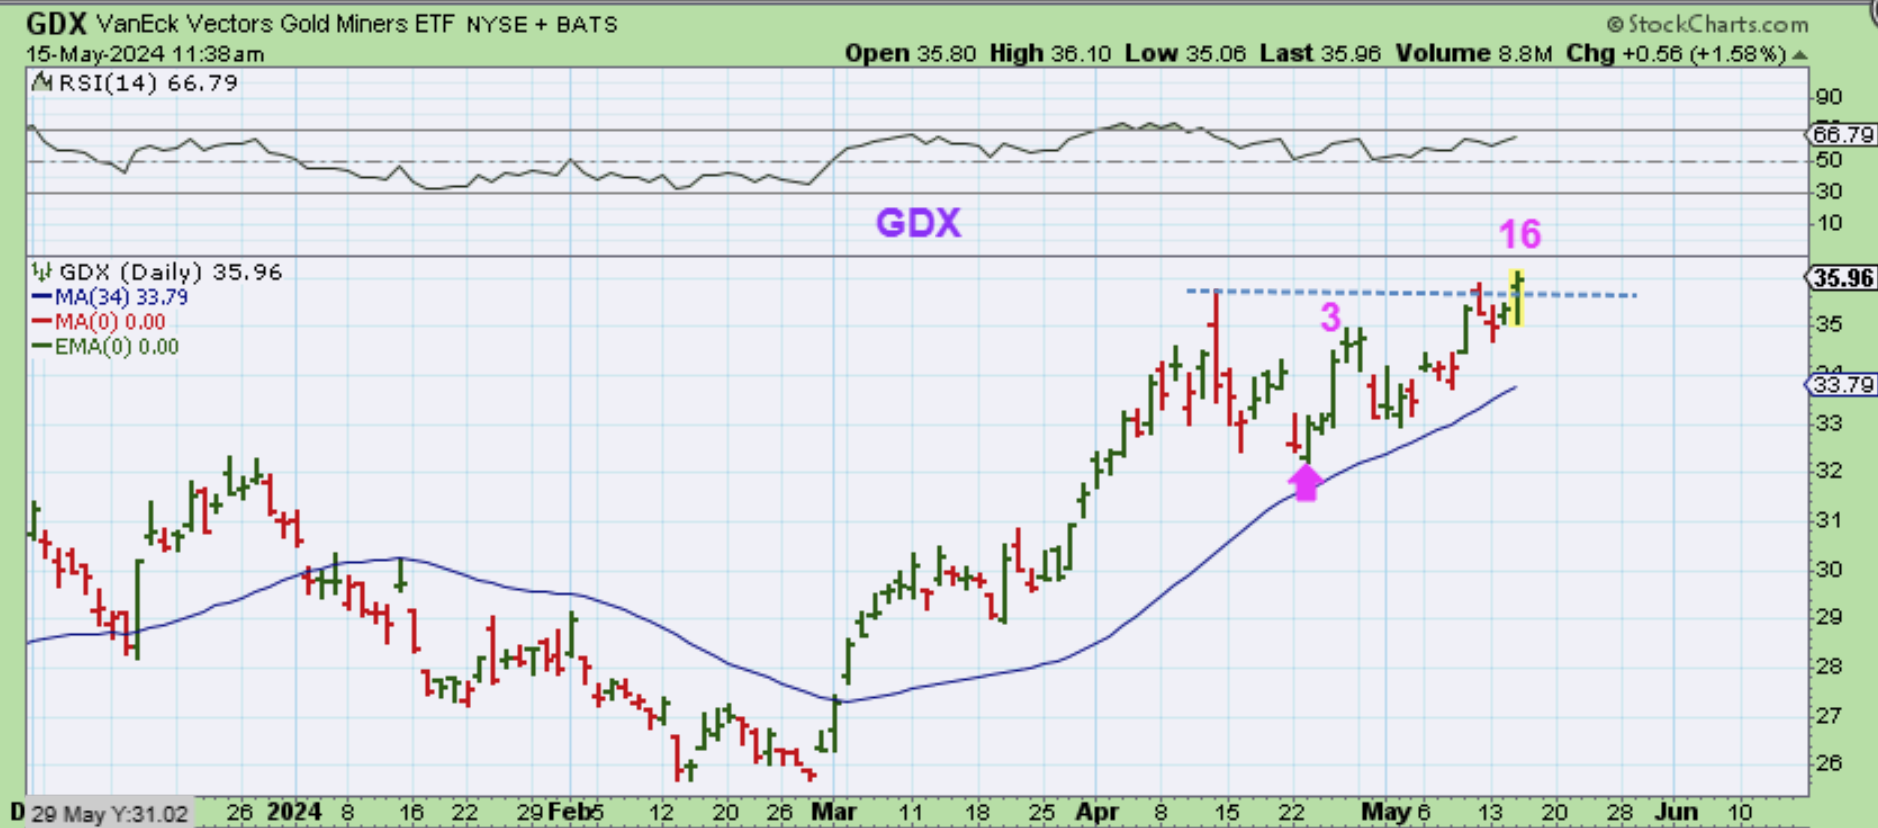
GDX is breaking out from a multiweek consolidation and made new highs.
.
Well, the PPI numbers came out on Tuesday and the markets dipped lower, but then turned upward and rallied. We then saw follow through higher when the CPI Numbers actually came in lower than the estimates. That renewed the thought that the feds rate hikes must have started to choke inflation off, and rate cuts could be back on the table for 2024. The Bulls are still running strong, and
1. We have an ICL in place for the General Markets
2. This new data may cause us to get a strong 3rd daily cycle, so it is possible that Gold & Silver will form as R.T. Daily cycles, and finally
3. Yesterdays commentary for Bitcoin becoming bullish also seems to be bullishly playing out. I will discuss that below, enjoy your Thursday trading! 🙂
.
~ALEX
.
FROM YESTERDAY I SAID:
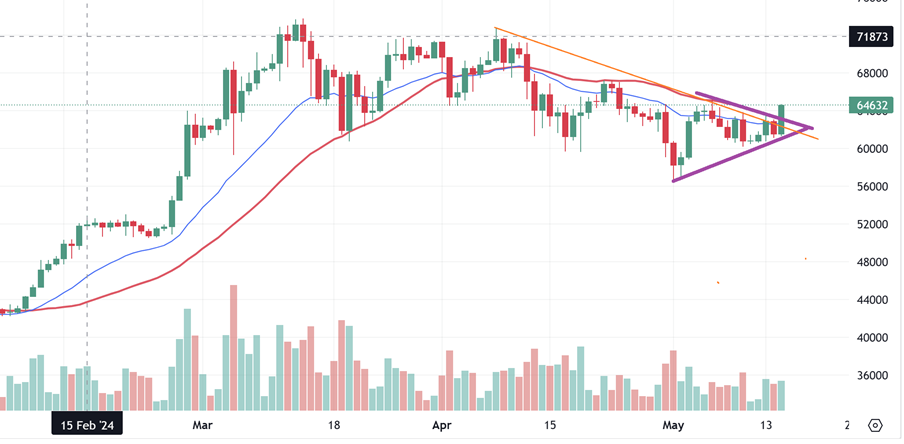
IF THIS FORMS A SMALL TRIANGLE HERE AND BREAKS ABOVE THAT UPPER LINE (All you have to see is a new high above the day 54 or 55 area), THAT may be signaling that it is a breakout and ready to run.
I have mentioned many times in past reports that at times I see a triangle form and then break higher and THAT Apex marks the dcl, even though the low can be slightly higher. Buying pressure keeps the low from breaking below the triangle. I AM NOT SAYING that this will happen, I am simply alerting you to it, just in case it happens in ‘real time’ midday today or tomorrow.
.
BITCOIN : On Wednesday Morning Bitcoin did start breaking out, so I posted this chart and said, “DCLs can and have formed inside of a bullish triangle”.
I also posted some Crypto stocks that have bottomed ahead of time in recent reports and RIOT in the comments yesterday. I do believe the sector is ready to go, so….
.
.
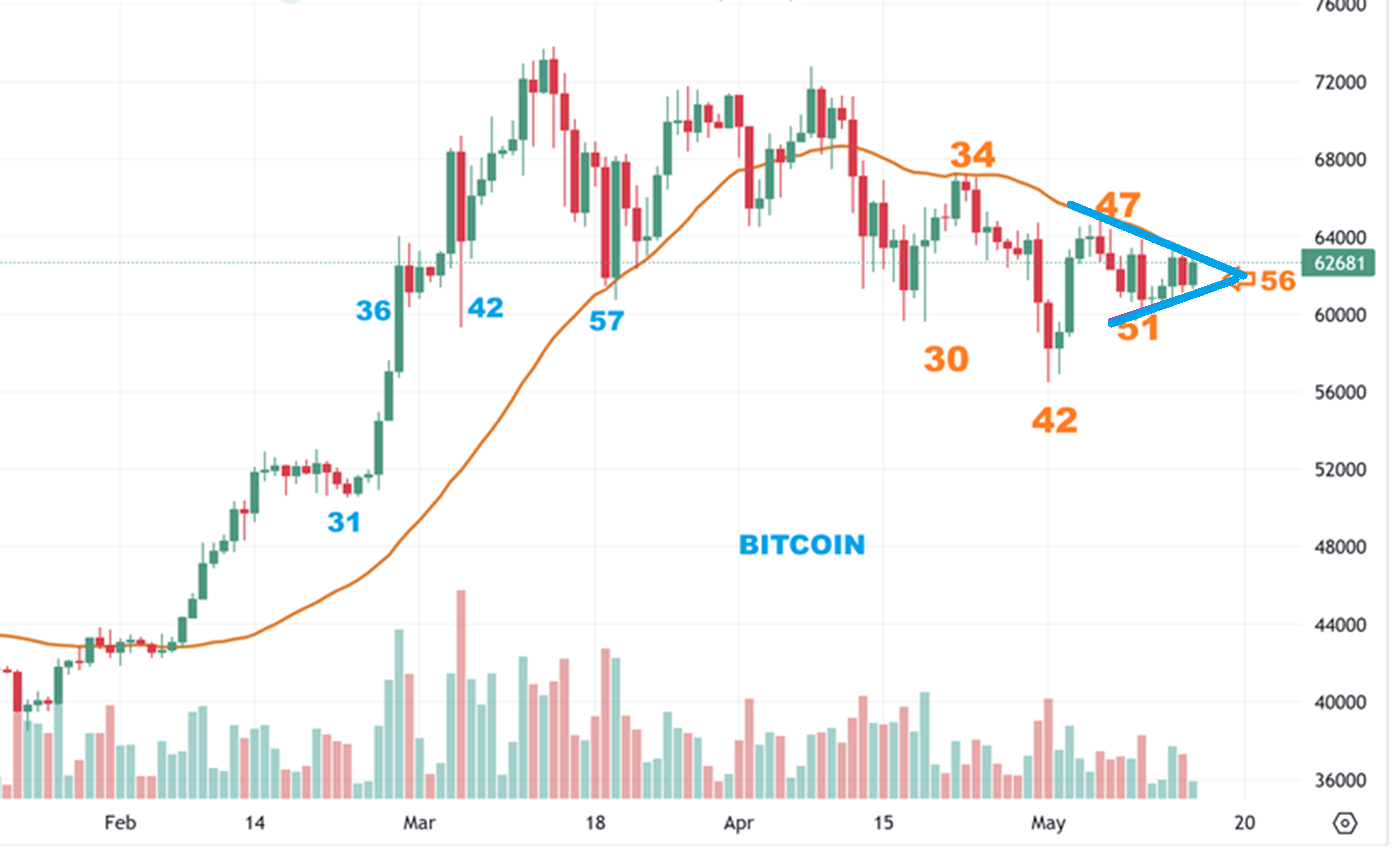
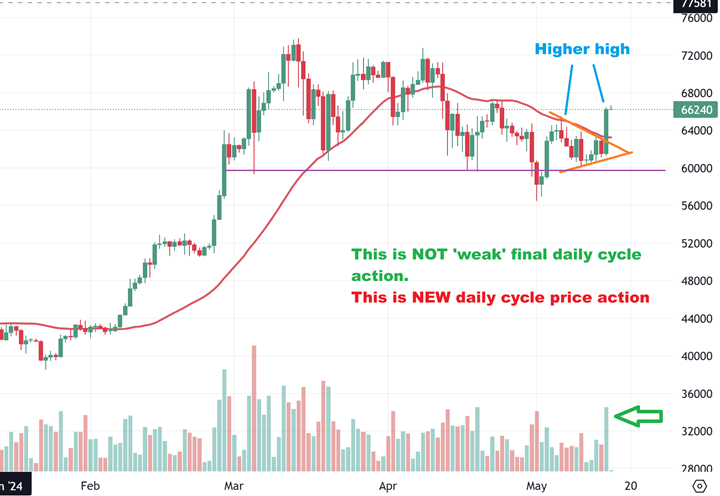
BITCOIN – By the close we see that Bitcoin not only broke above the downtrend and 34 & 50 sma, but it kept pushing higher and now has a higher high with strong volume.
This looks very bullish and I am often a contrarian. Bad news is often emotional and wrong and shows me that sentiment that was once overly bullish & frothy is now dying down. News reports of Bitcoins halving being damaging to it are starting to pop up, so that tells me that sentiment has died down and some have become bearish. Some that were yelling ‘Bitcoin to $100,000!’ are now calling for a drop.
.
CONRARIAN FACTOR – I saw this article that came out yesterday morning (May 15th). Right on time to show that some of the bulls are giving up at the wrong time.

.
LETS DO A MINER REVIEW:
.
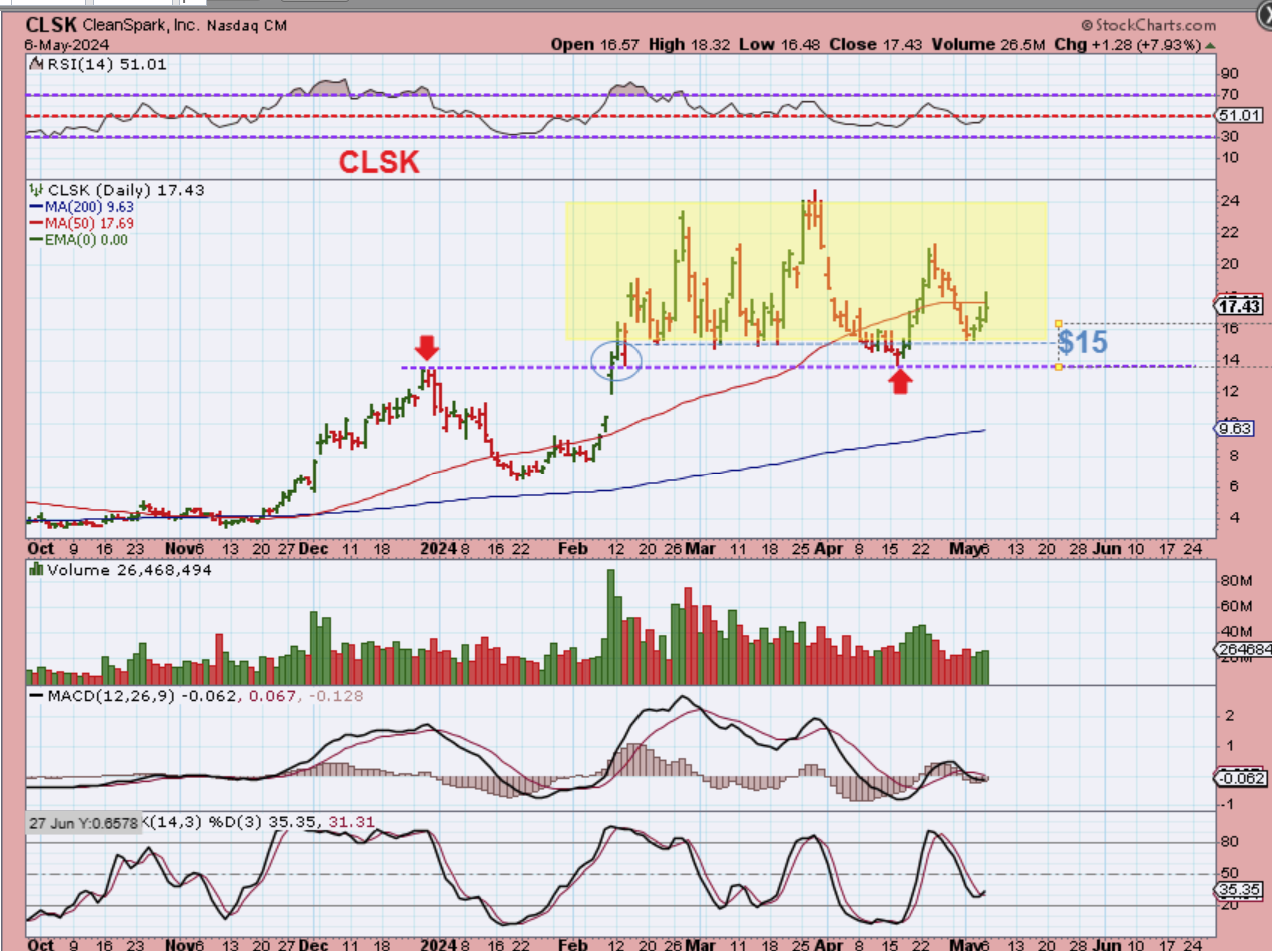
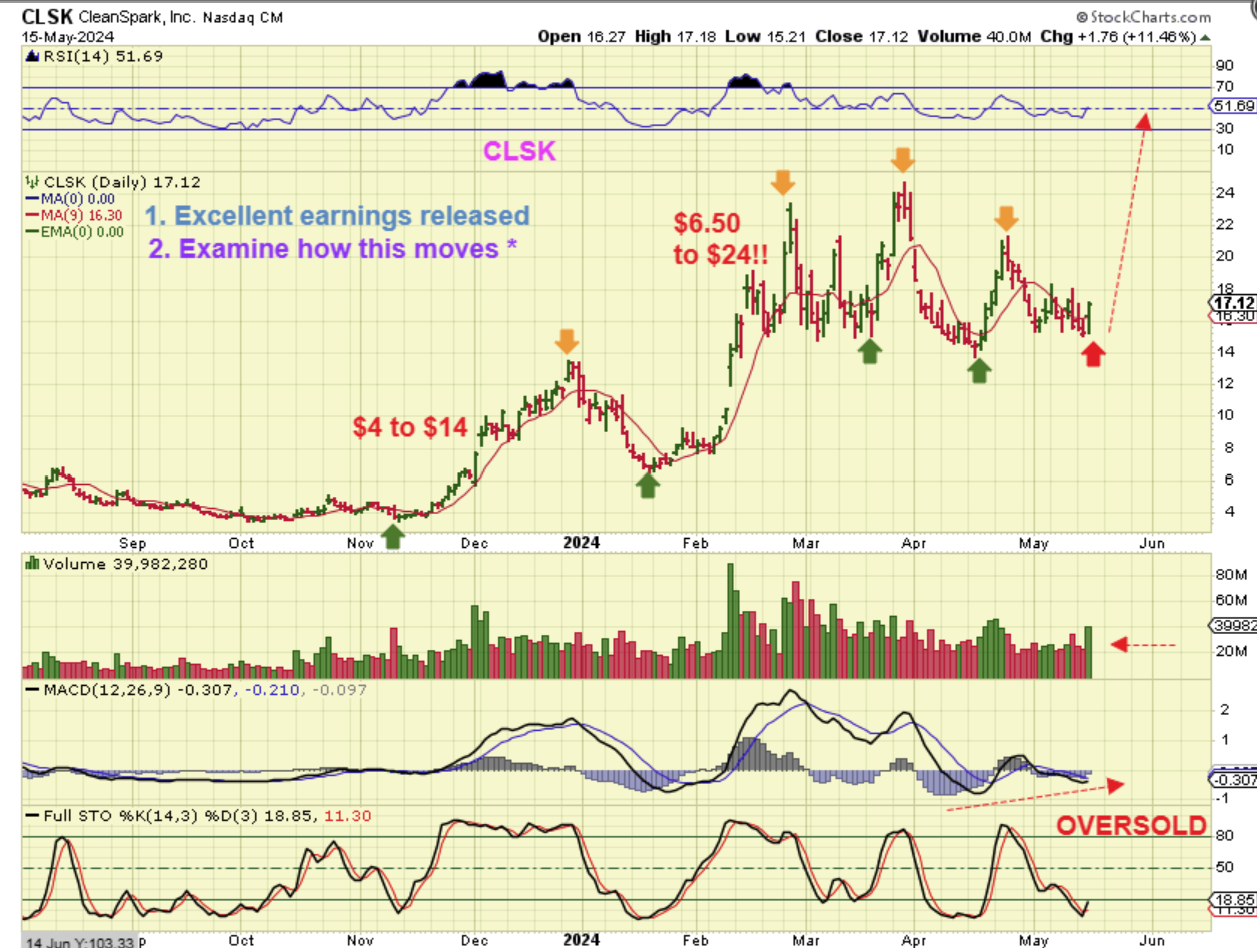
CLSK – On May 6 I said that the support of $15, which was repeatedly faithful, was allowed to be breached to tag the December highs as a back-test of the breakout(Red arrows). On the next drop the $15 held again, so I said that if I see CLSK at $15 when Bitcoin bottoms, I would feel safe buying there.
.
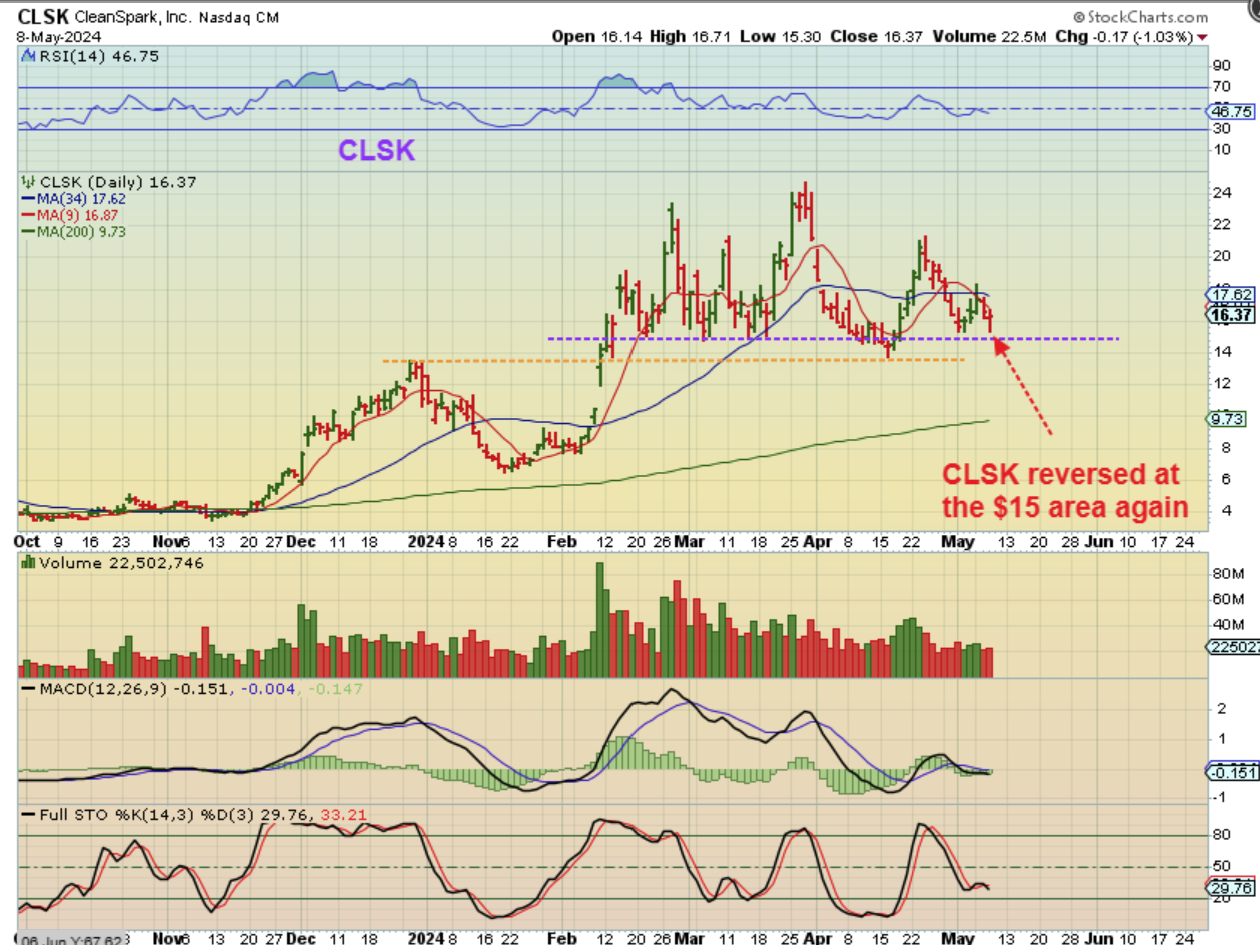
CLSK – On May 8 It dropped there again, but I didn’t feel that Bitcoin was bottoming yet, so I simply pointed it out here.
.
CLSK – On May 9 I LOVED their earnings report, so I shared it.
MARA and CLSK had very nice Earnings releases last week.
.
CLSK – Fell to $15 this week again and on Wednesday it started to reverse right at that $15 area again. I feel it has likely bottomed for the final tag of $15 with Bitcoin breaking out yesterday morning. Now let me point out how CLSK moves on this chart. It has the habit of making huge runs at the right time. We saw $4 to $14, $6.50 to $24, etc. These were triples in 2 months.
.
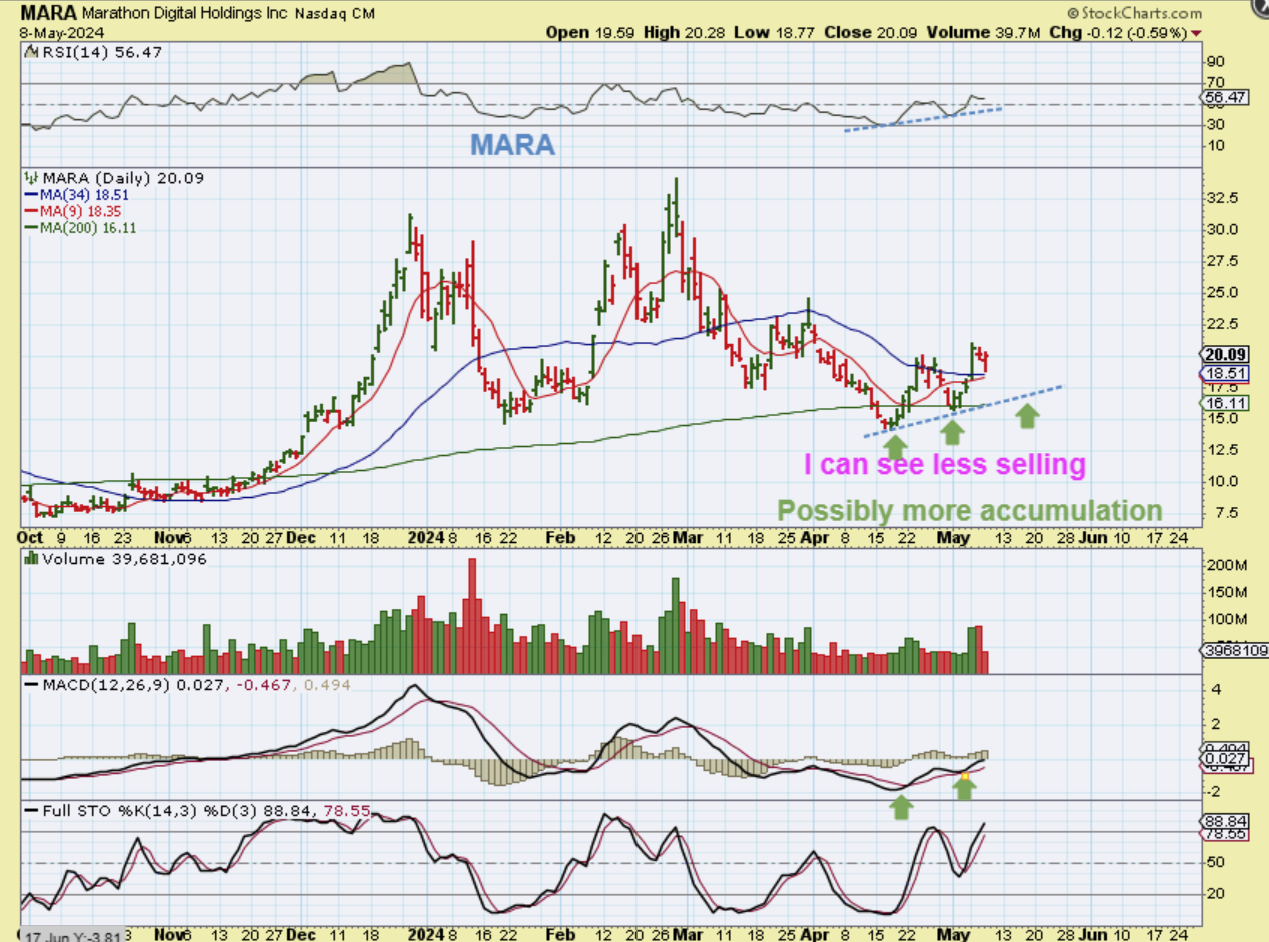
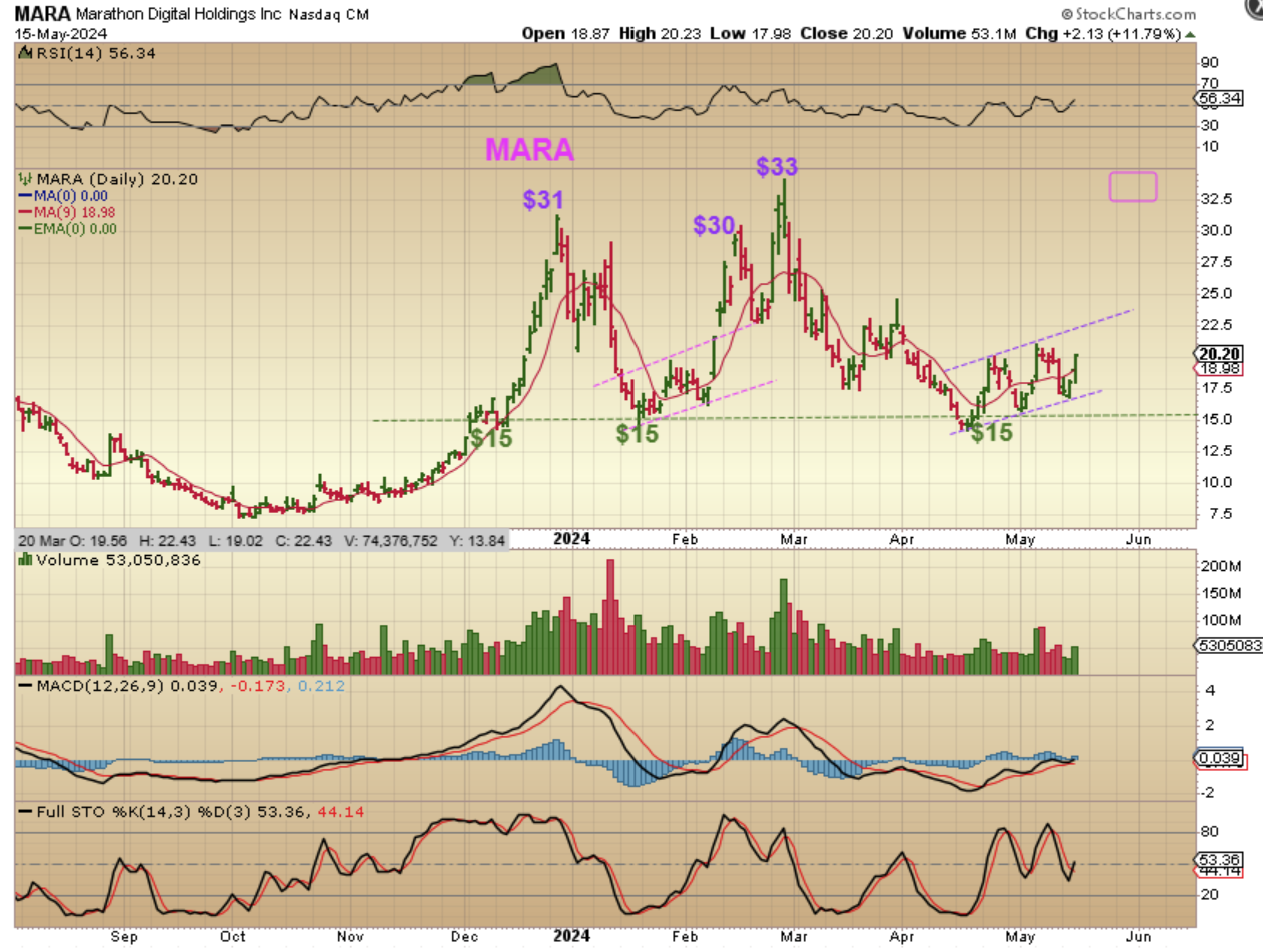
MARA was making higher lows and I thought that it looked to be under accumulation on May 8. I stated that some of these seem to be bottoming ahead of Bitcoin. These were bullish signs, so it was encouraging.
.
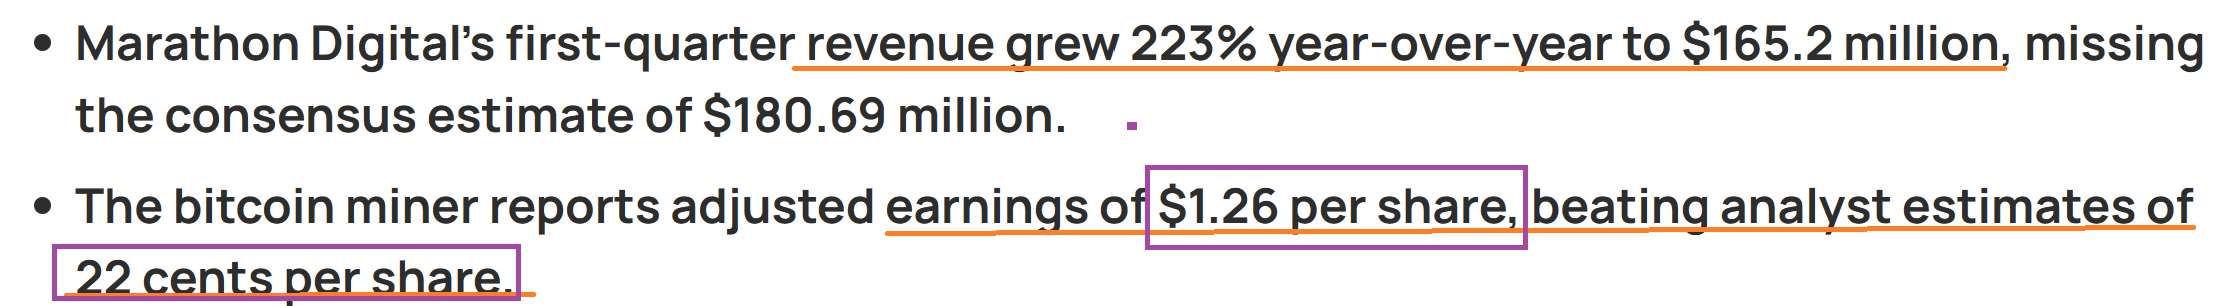
MARA released what looked to be strong earnings too. I shared this in my report at the time of the earnings release last week.
.

MARA reacted with an 11.79% rise yesterday. If Bitcoin bottomed, this can try to make its way back to $33 highs or more, with that bullish earnings report.
.
RIOT is oversold and formed a bullish wedge set up. RIOT has also already released earnings.

.
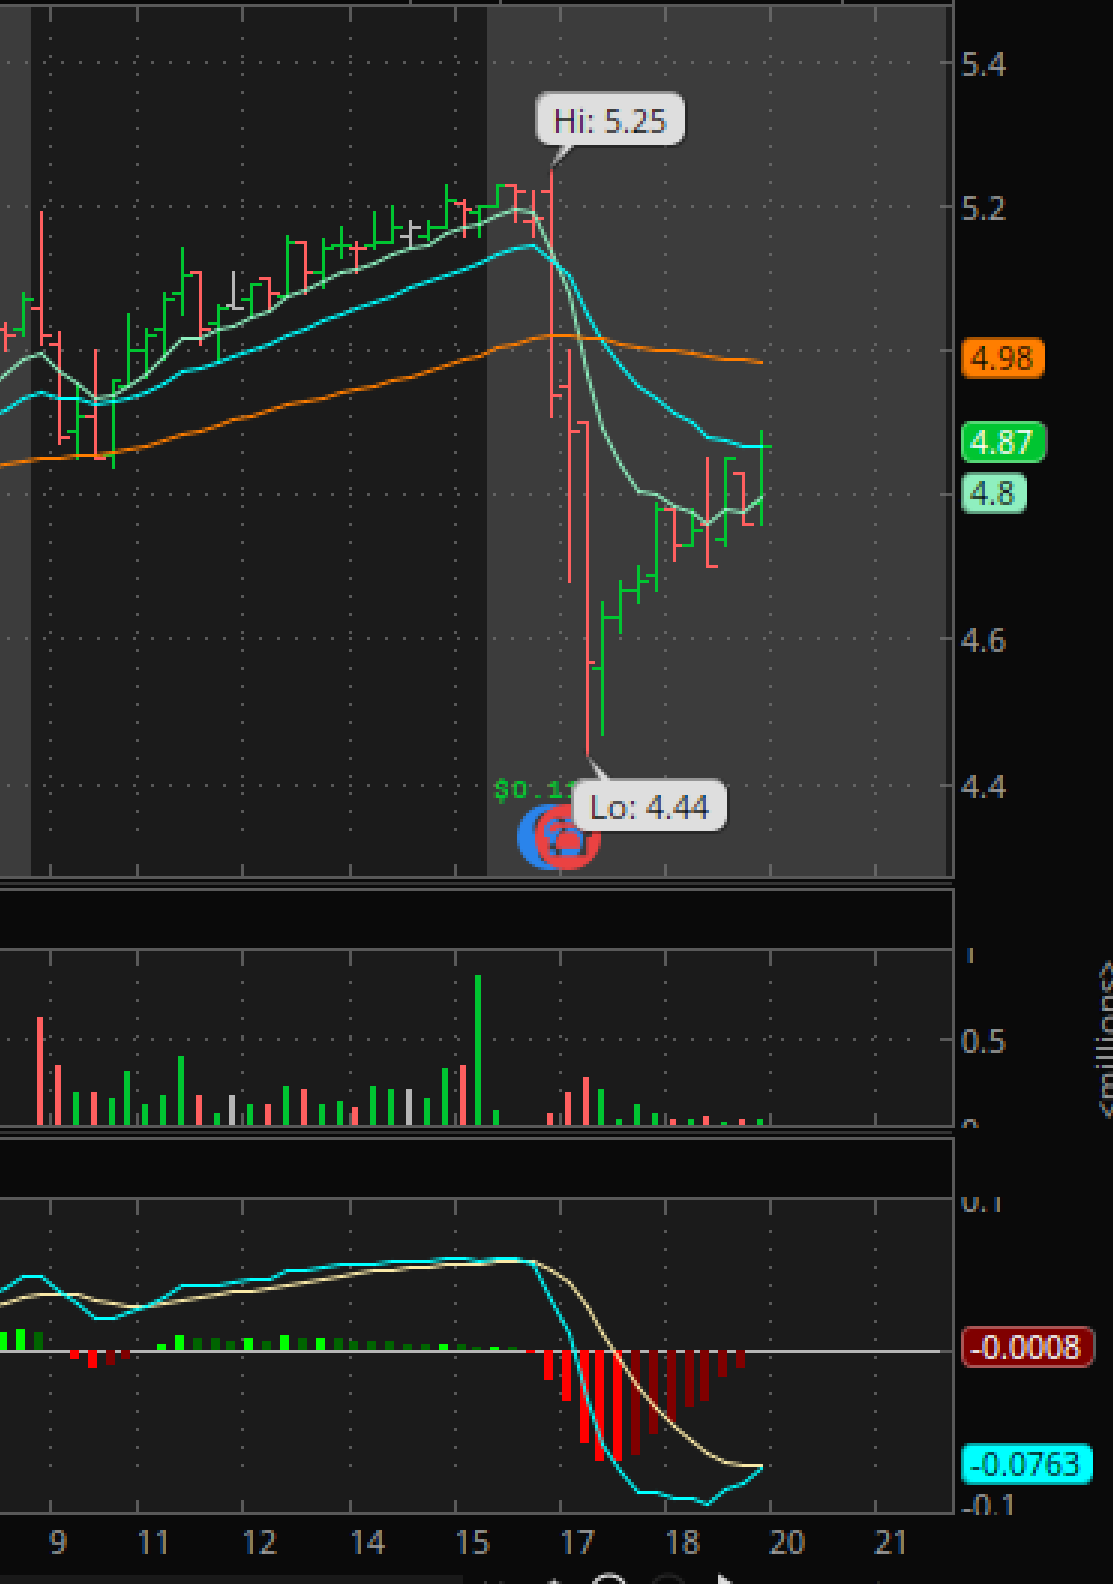
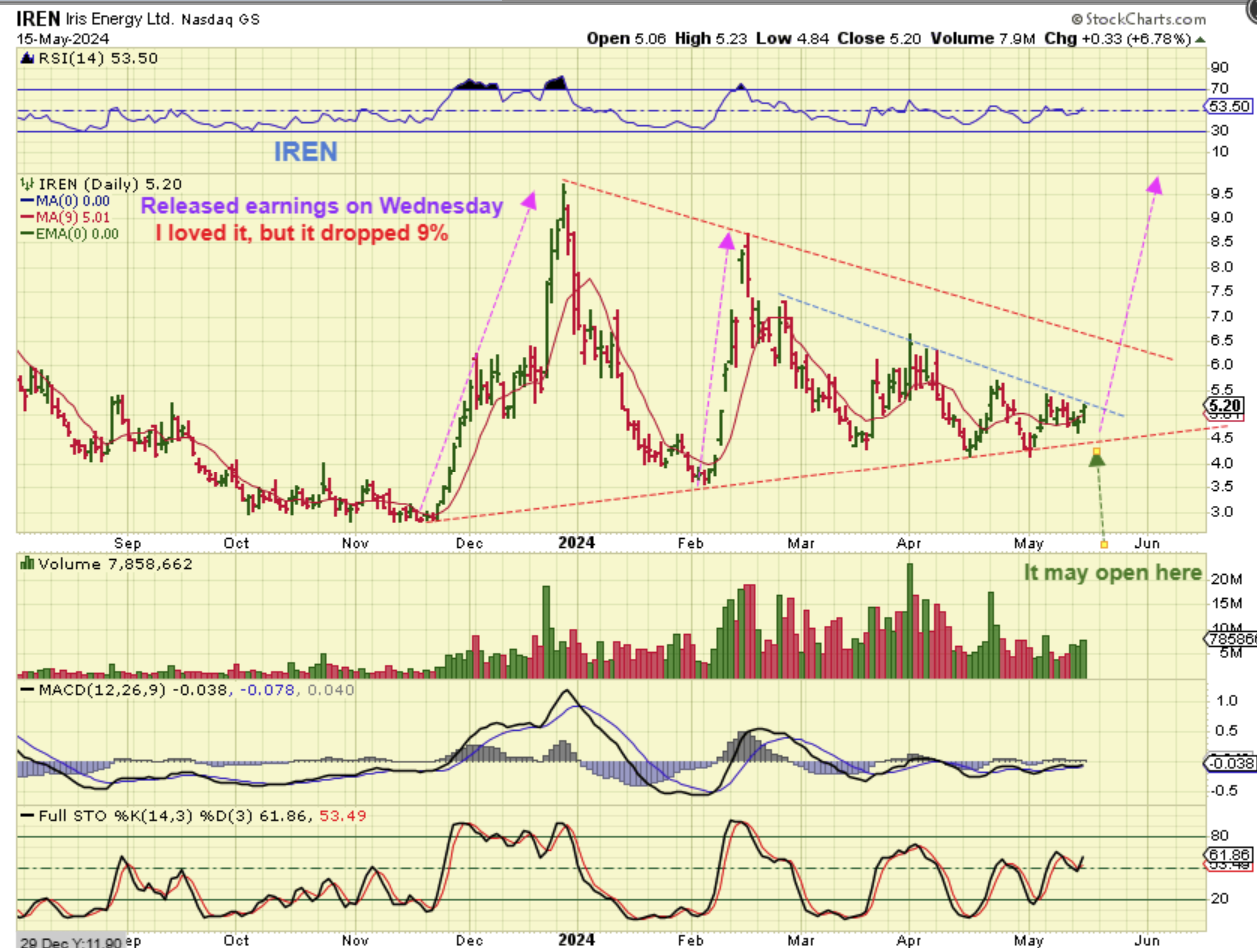
IREN released their earnings after the market yesterday. I was waiting for this and to be honest, I thought that it was a good report. It sold off hard in after hrs from $5.25 to $4.44. They then had an earnings call, and it started to climb back up. That sell off may be a false reaction, so let’s look at the daily.
.
IREN had closed at $5.20 and to be honest, this chart really looks good. What I saw of the earnings was good news, so I am not sure why it sold off by about 15% and then bounced back to down about 7%. I am watching this one on Thursday…
.

