Weekend of May the 4th – Almost There
.
As a quick 2 chart review, we have a set up that I was going to short, but I mentioned on Friday that I won’t short it now, because it started to look bullish post Fed Mtg. I mentioned on these 2 charts…
.
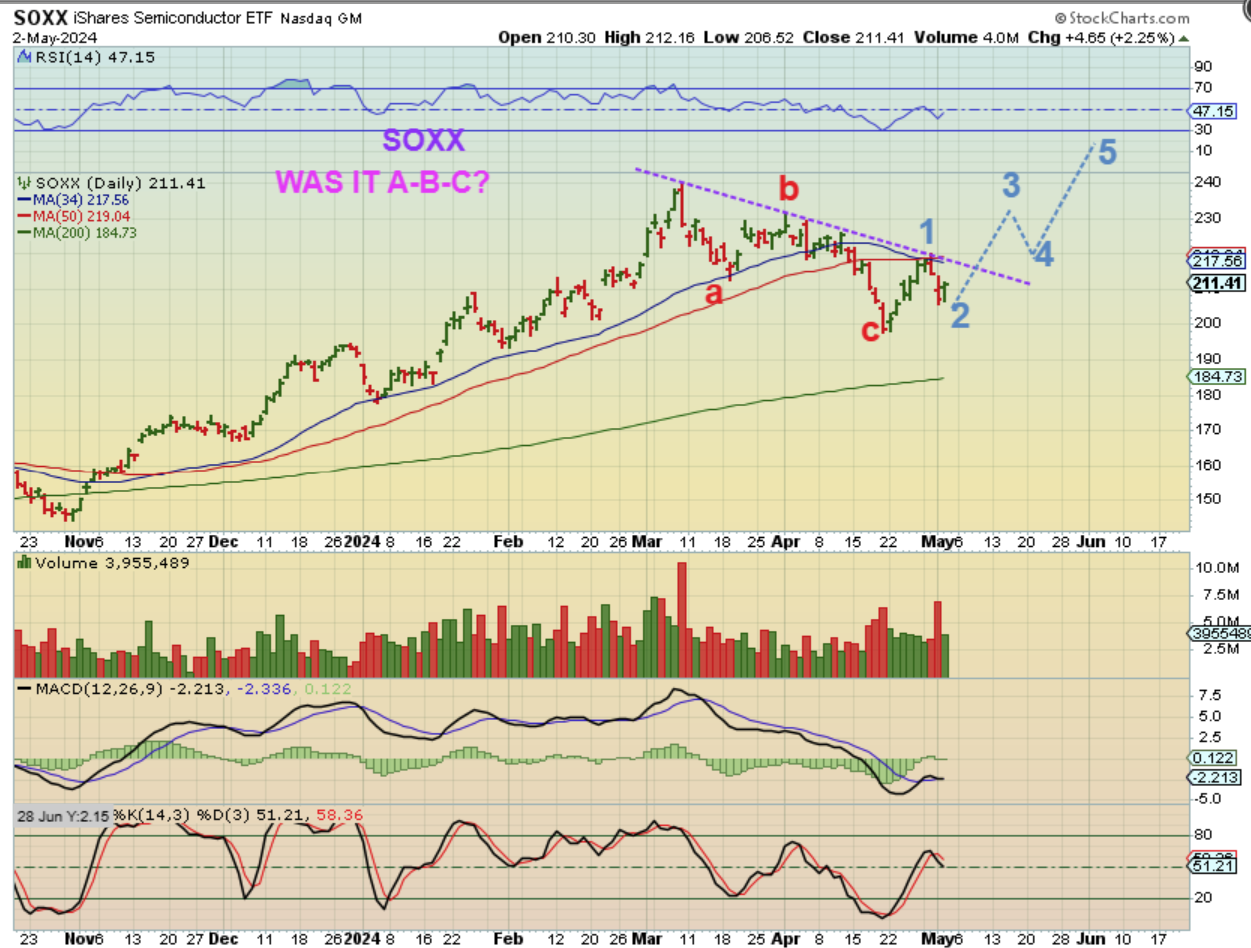
SOXX – So far, post Fed price action was a reversal higher, so we could have had an a-b-c down into a dcl complete, and now we’d be on day 9 of possibly 5 waves up. The cycle count for that drop from ‘a’ to ‘c’ just seems too short at 22 days, so …
.
SOXX – We could also still be trying to finish a 5 wave drop after being rejected at the 50sma.

.
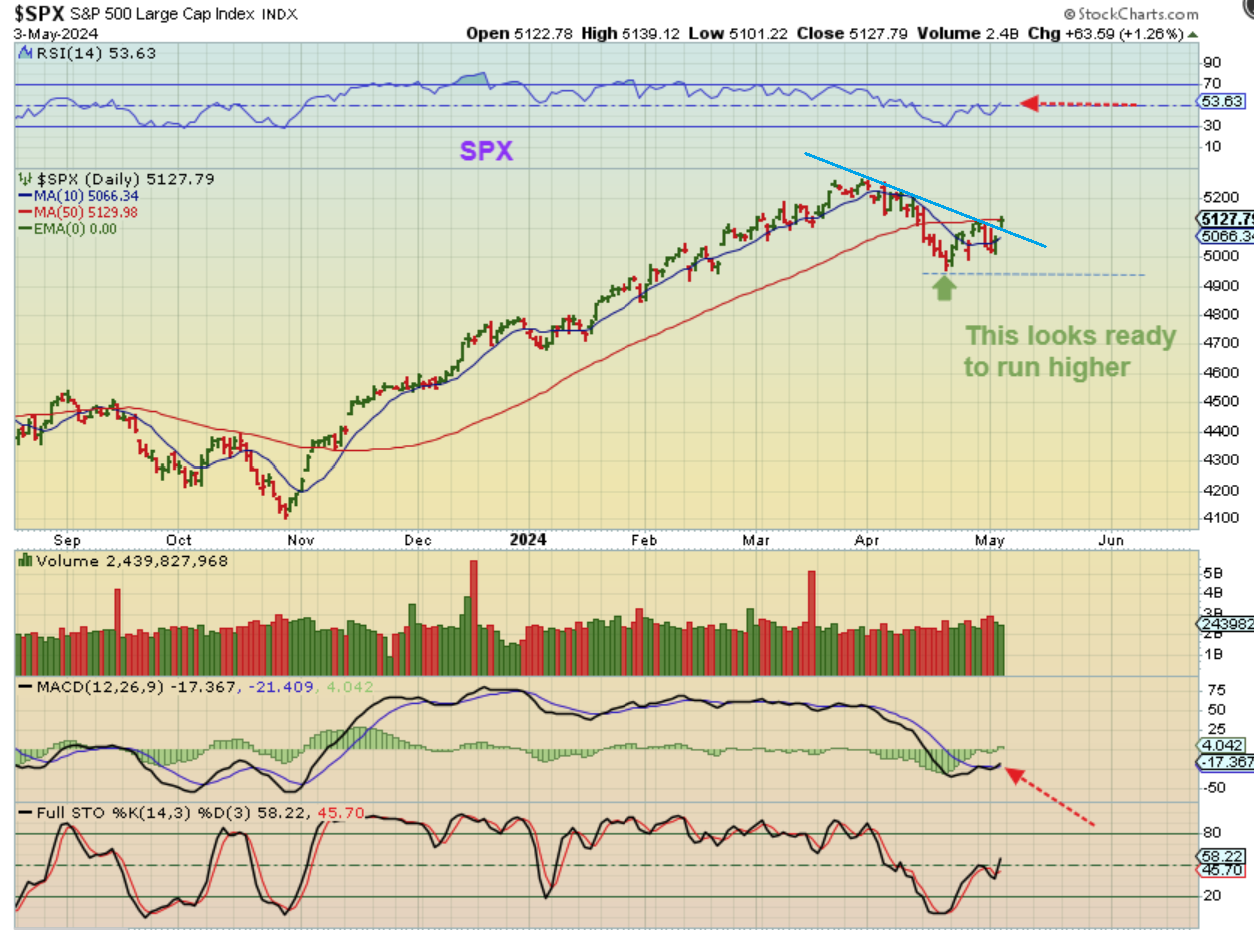
The Daily for The SPX shows us more upside right to the 50sma, and this does look like it could just go higher from here. It broke the downtrend as a starter, and the MACD is crossing higher. The cycle count seems too short for a dcl, but the 10sma is curling back up and it seems as though the F.O.M.C Meeting & speech have given the markets more hope when the fed said that he doesn’t expect a rate hike next.
.
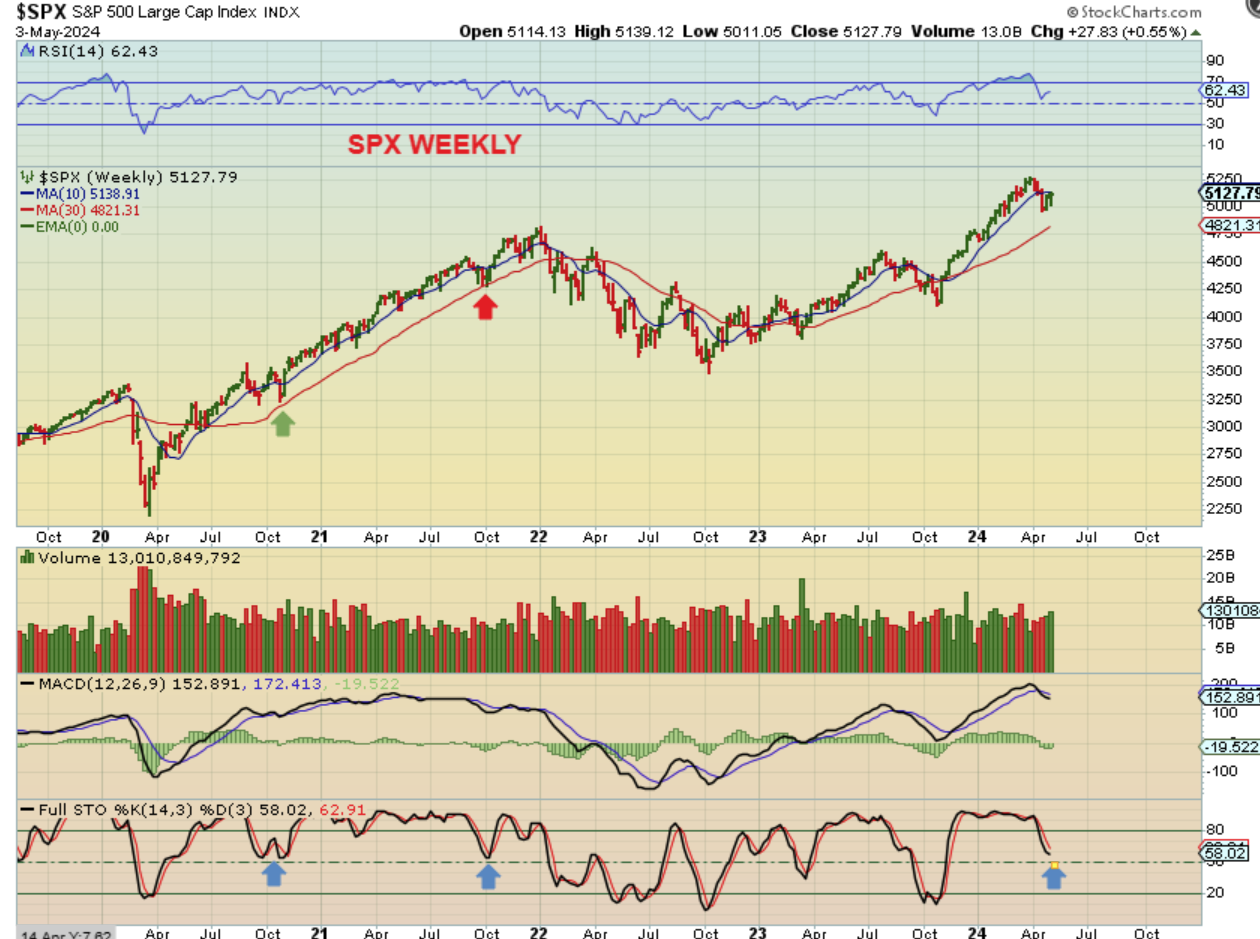
SPX WEEKLY – The weekly shows price reversed up to the 10 week ma. A break above is bullish.
.
.
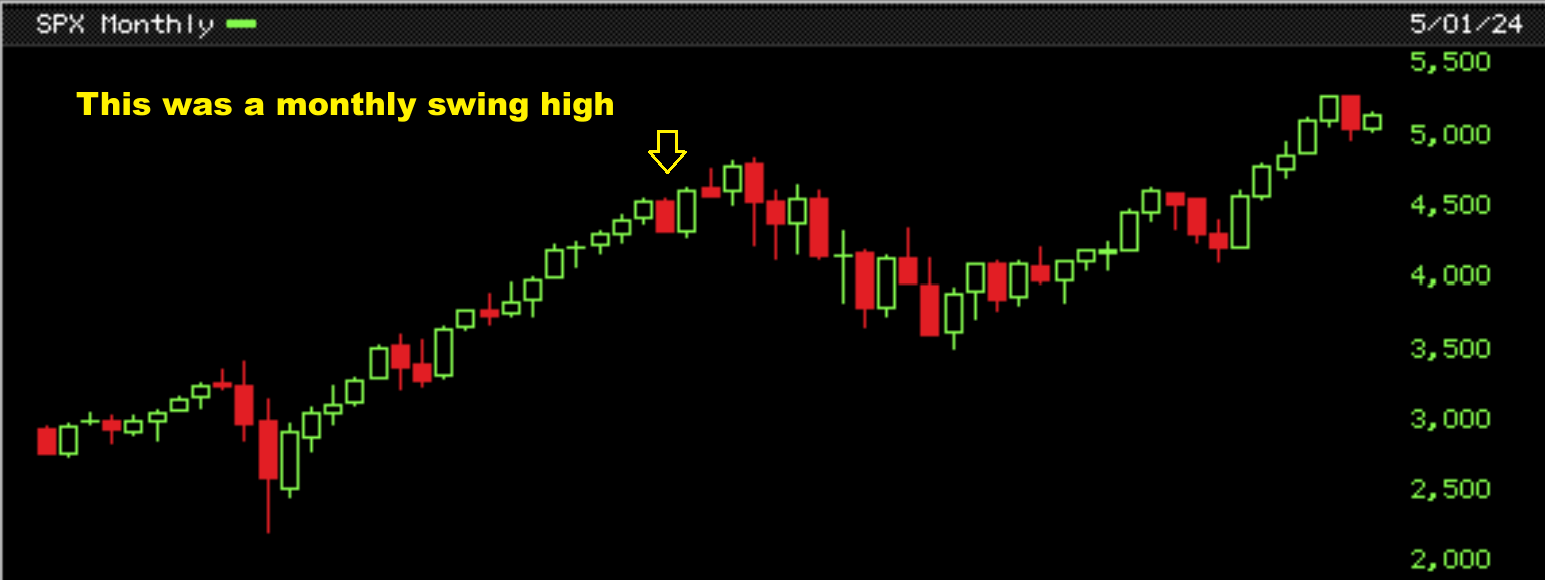
SPX MONTHLY – What about the monthly swing high? Doesn’t that make things look bearish? We have seen Monthly swing highs that simply acted as a pause in the past. I placed an arrow on one here.
.
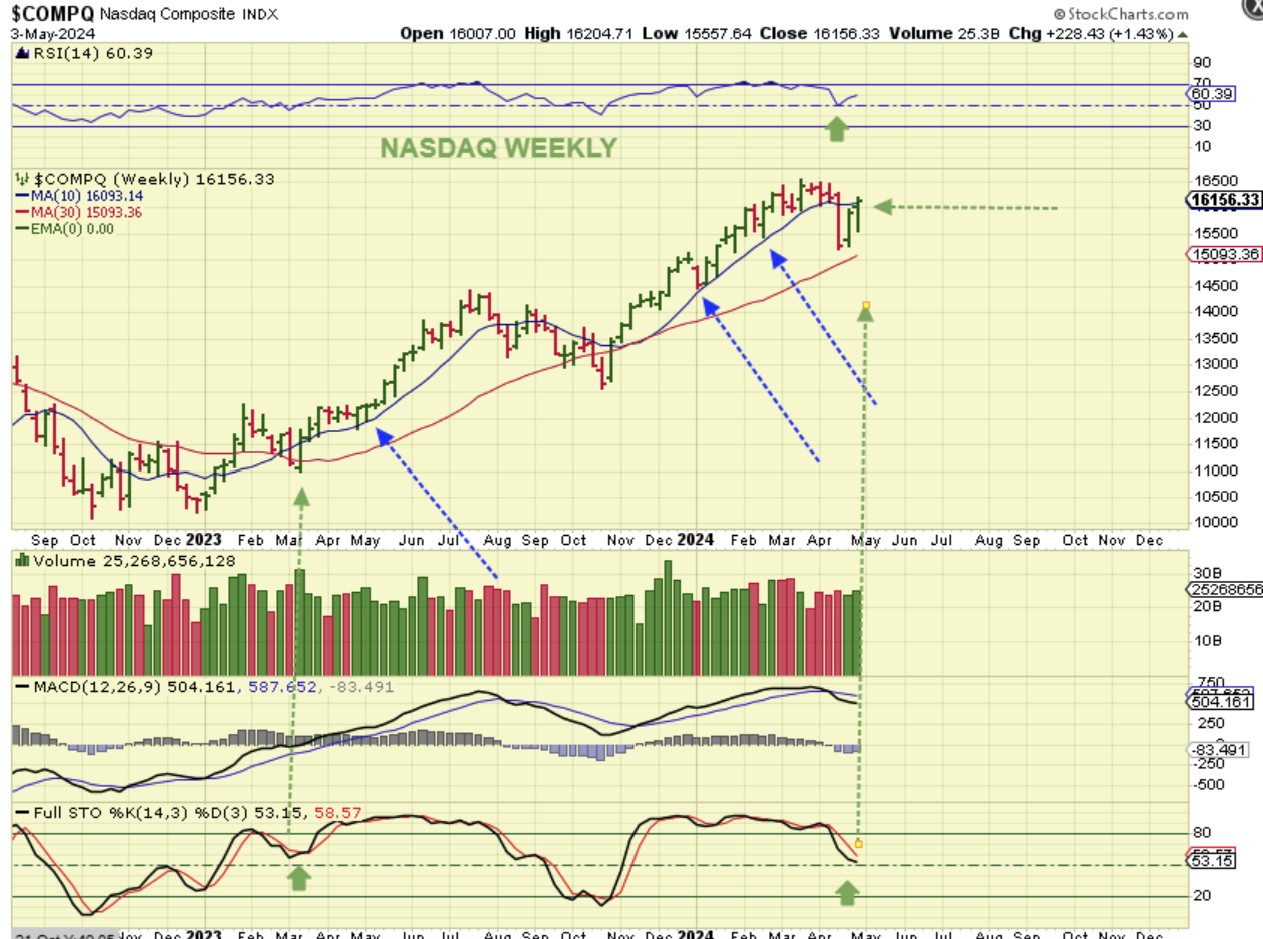
THE NASDAQ WEEKLY: After quite a sharp one week drop, the Nasdaq Weekly actually DID recover the 10sma, so this looks bullish,
.
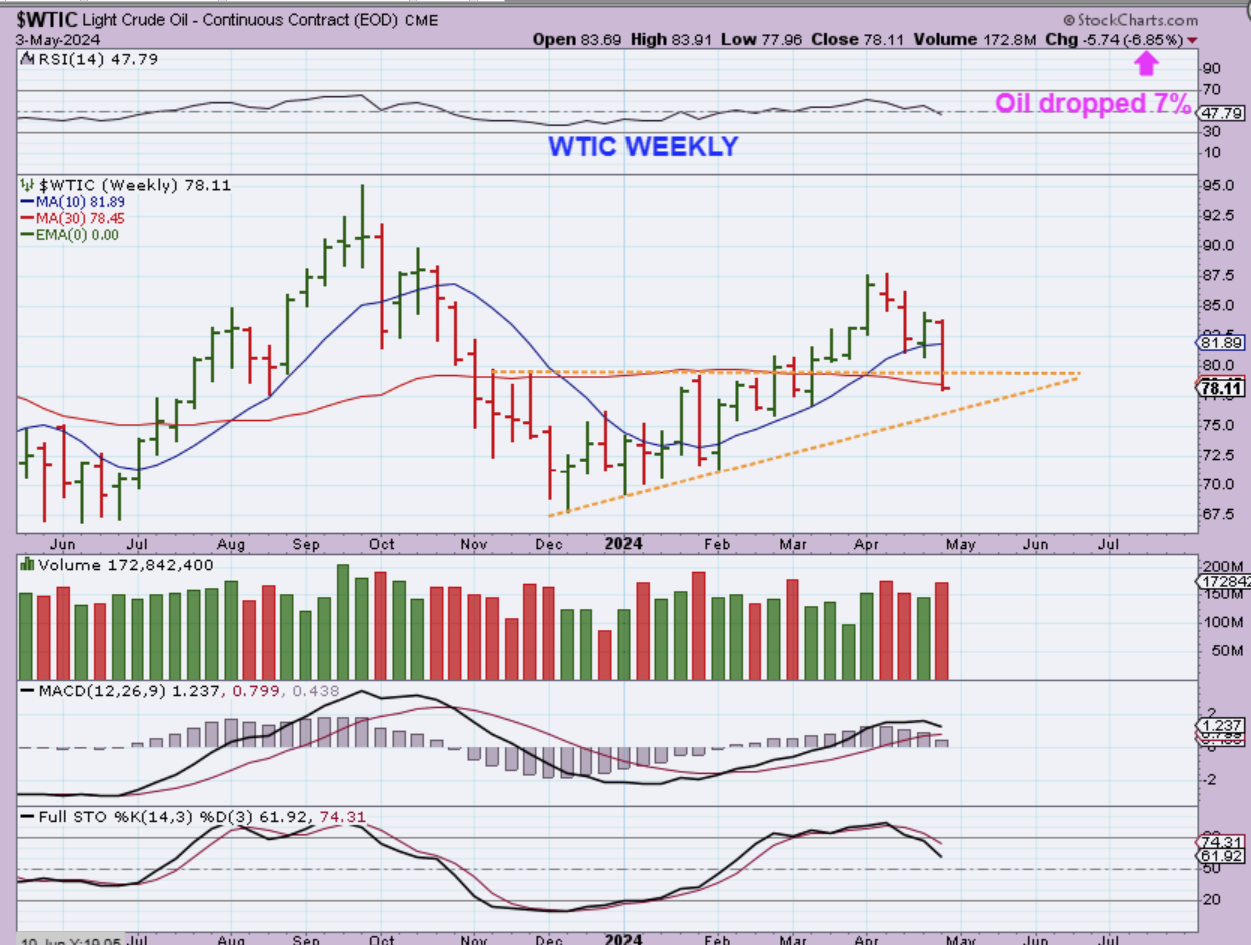
WTIC WEEKLY – Oil, on the other hand, which was climbing steadily higher week after week, had a 2 week drop into what appeared to be the dcl on a daily chart, and the timing was perfect for that. Oil reversed higher at the 10 week ma, so this looked like a perfect dcl. This week though, Oil had a sharp 7% drop come right out of nowhere. This is concerning, and some of the Oil Stocks dropped like that too.
.
In Fridays report I said this:
.
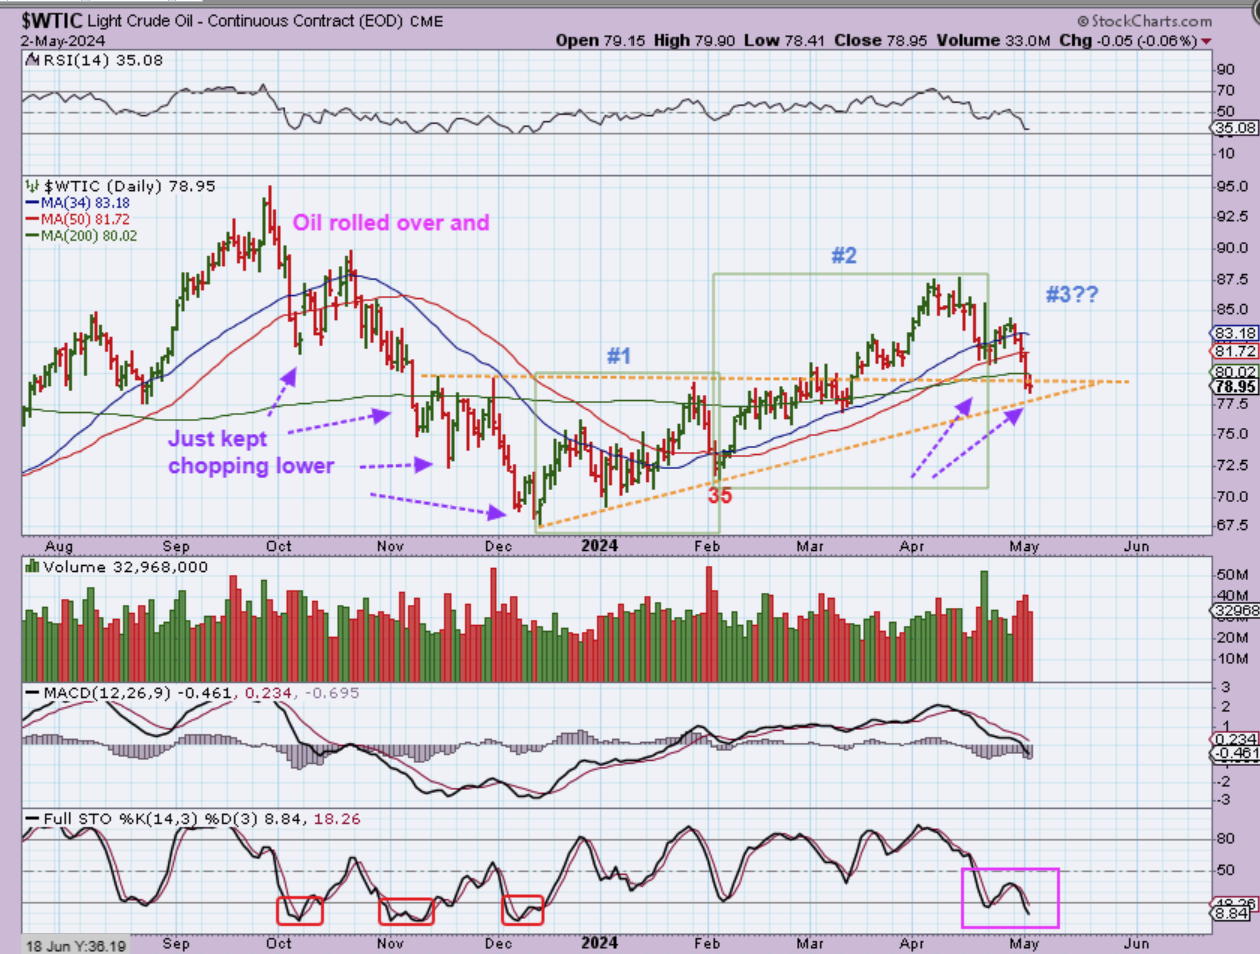
WTIC – Oil was doing fine until this week. It rolled over and now it looks like we were in the 3rd daily cycle and it broke down very early. There is a chance that this is a very long 2nd daily cycle, because the first one put in a very short dcl (Day 35, remember?). If this is a very long 2nd daily cycle it should bottom soon and show strength, but right now the selling is high volume and Oil is choppy.
.
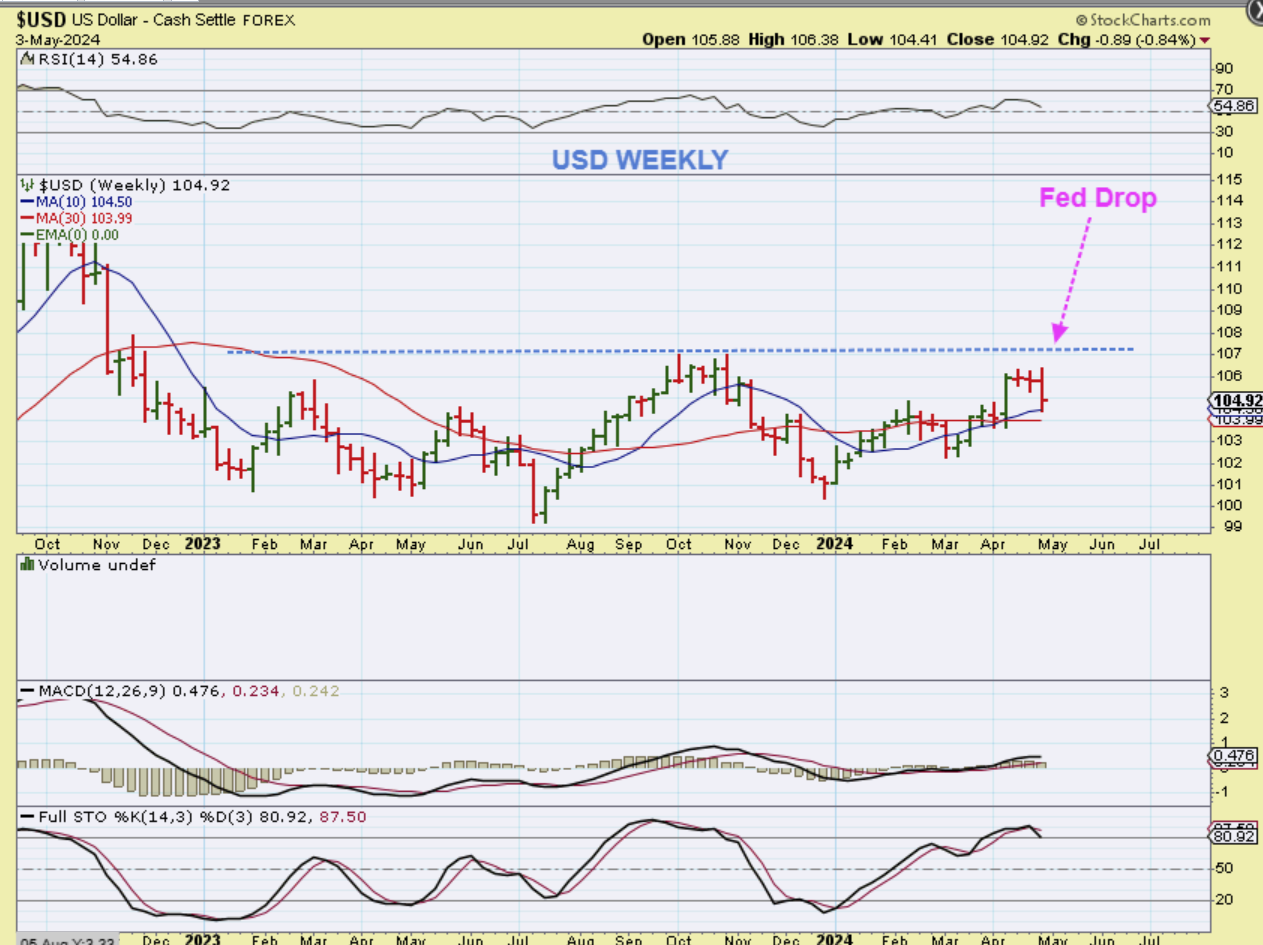
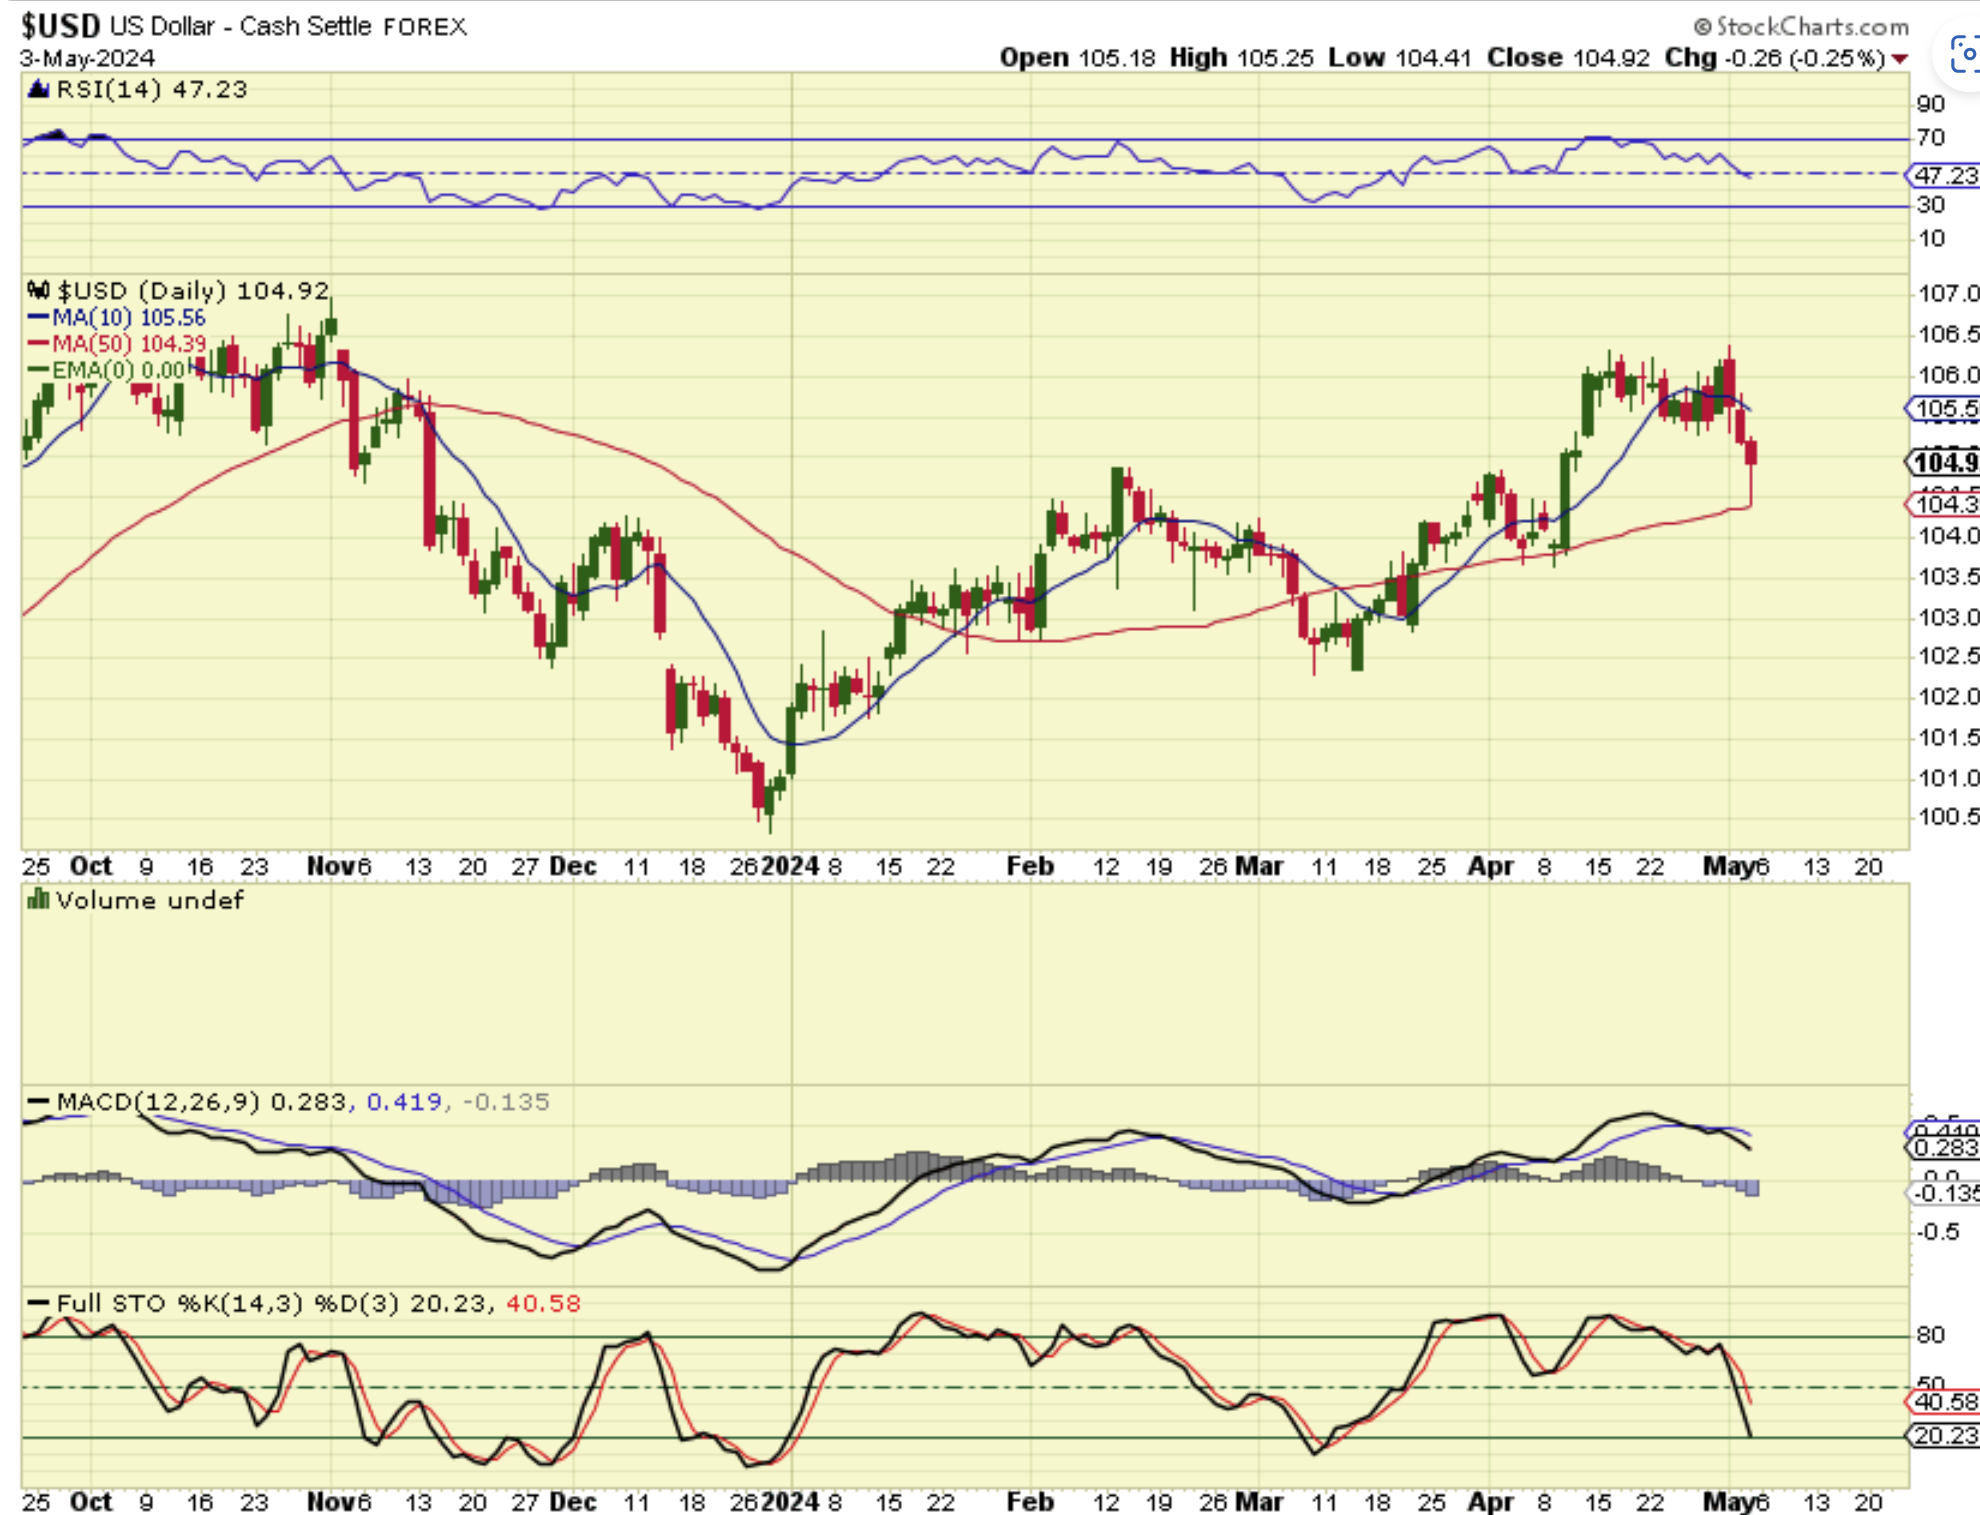
USD WEEKLY – The USD was chopping sideways, but it dropped sharply on Friday, so the weekly chart looks like this.
.
It actually dropped and reversed at the 50sma on a daily chart, so it might be a dcl for the USD.
.
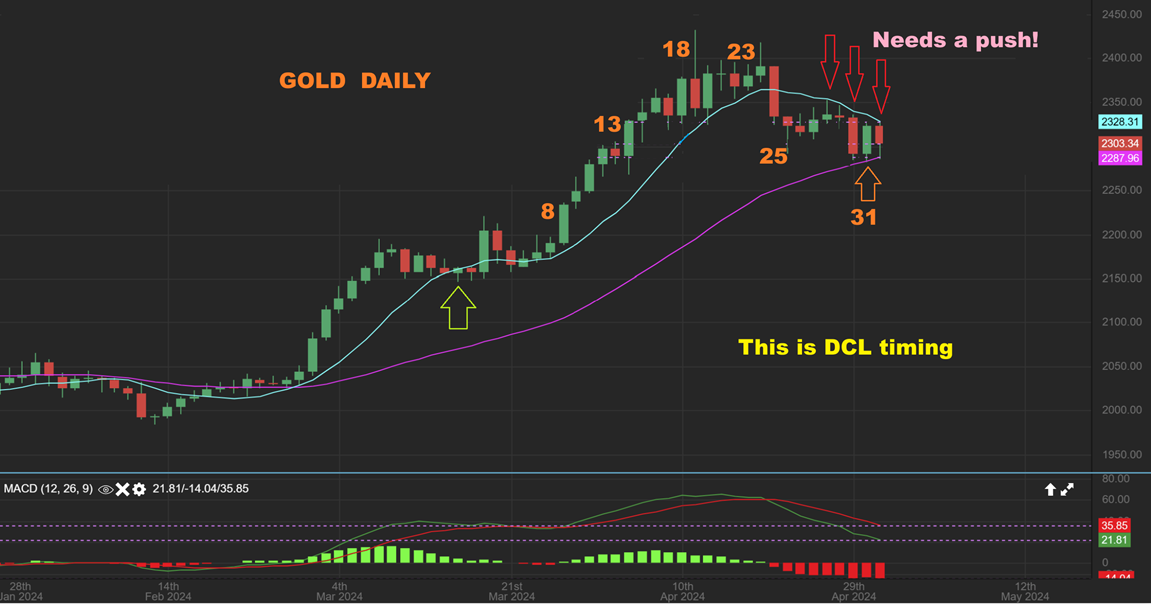
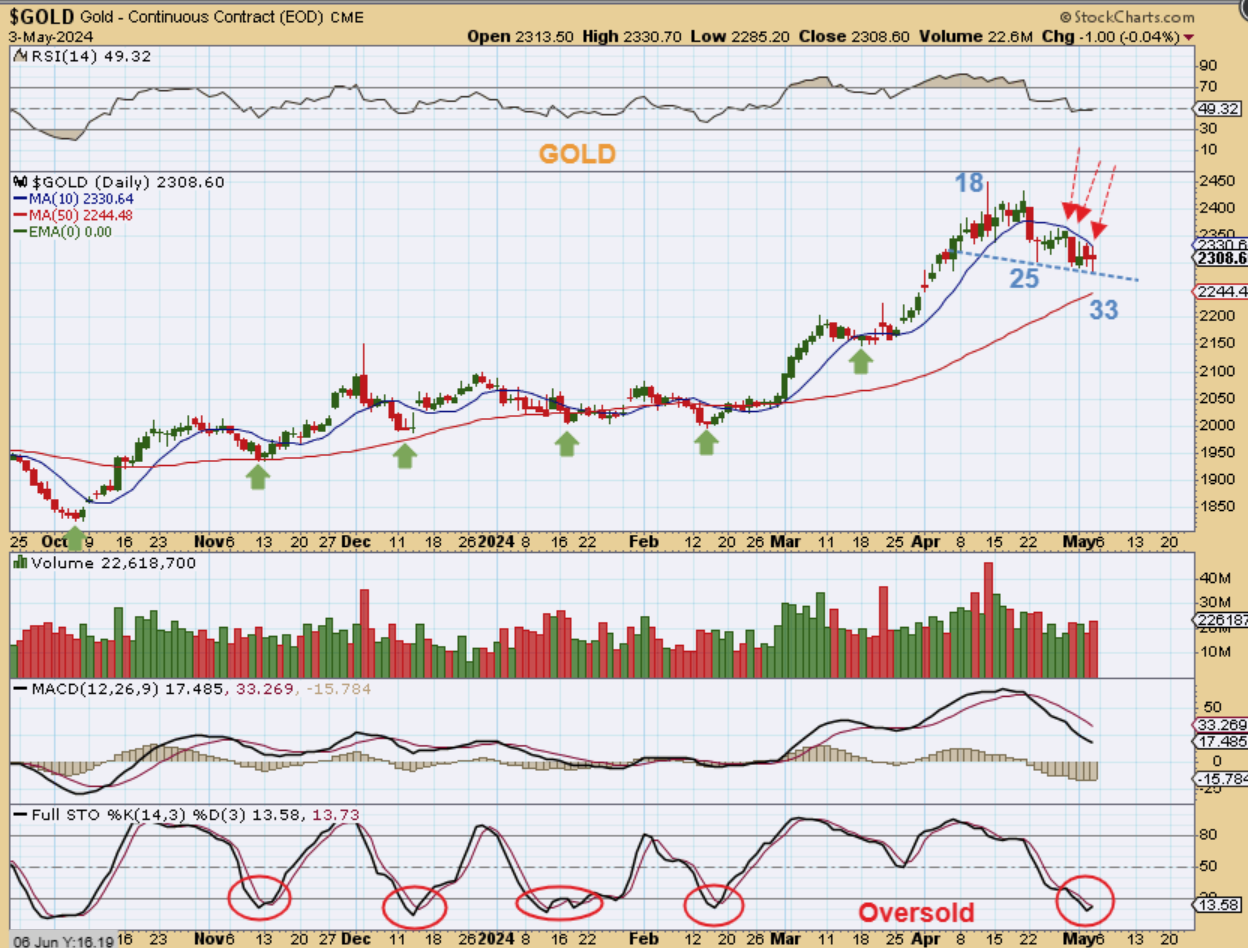
IN FRIDAYS REPORT I MENTIONED THAT GOLD is due for a dcl with this low at day 31. It was pinched between the upper 10sma and lower 34 sma, but it Could still drop to the 50sma. On Friday Gold dropped to a slightly new low and then recovered. So GOLD now has a day 33 low, and that is proper time for a dcl.
.
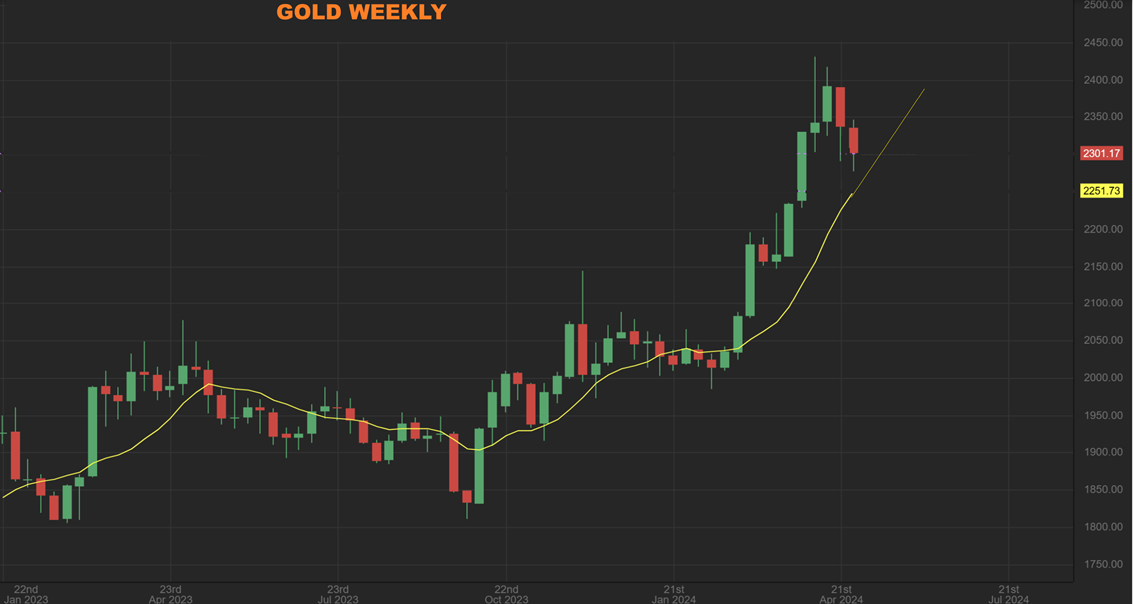
GOLD WEEKLY – Gold dropped and bounced and left this weekly candle, and even though it didnt touch the 10 week ma on that drop. Gold may have the day 33 dcl in place, so we’ll see what next week brings our way, but at this point it remains a bullish set up.
..
On Friday Gold dropped to a slightly new low and then recovered on day 33. So GOLD now has a day 33 low, and that is proper time for a dcl. I thought that we might tag that 50sma, so we could get 1 more dip next week, but that is not necessary at this point. Basically we either ALREADY HAVE a day 33 dcl or we are VERY CLOSE to a dcl in Gold. Gold pushing any higher looks like a break of the 10sma for confirmation.
.
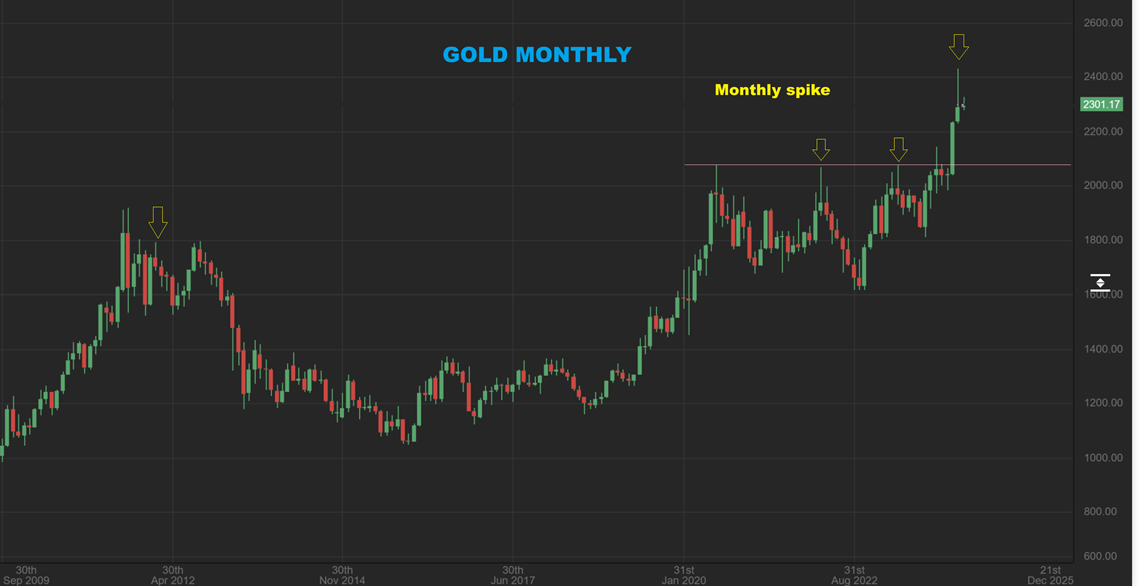
And April has ended, so this is THE GOLD MONTHLY CHART–
We had a big spike and reversal in April so this, in my opinion, will be the peak for this intermediate cycle. Even though price can go higher in the 3rd daily cycle, I feel that it just wouldn’t make new all-time highs. That said, Gold can run higher and can make new all-time highs in the next intermediate cycle.
.
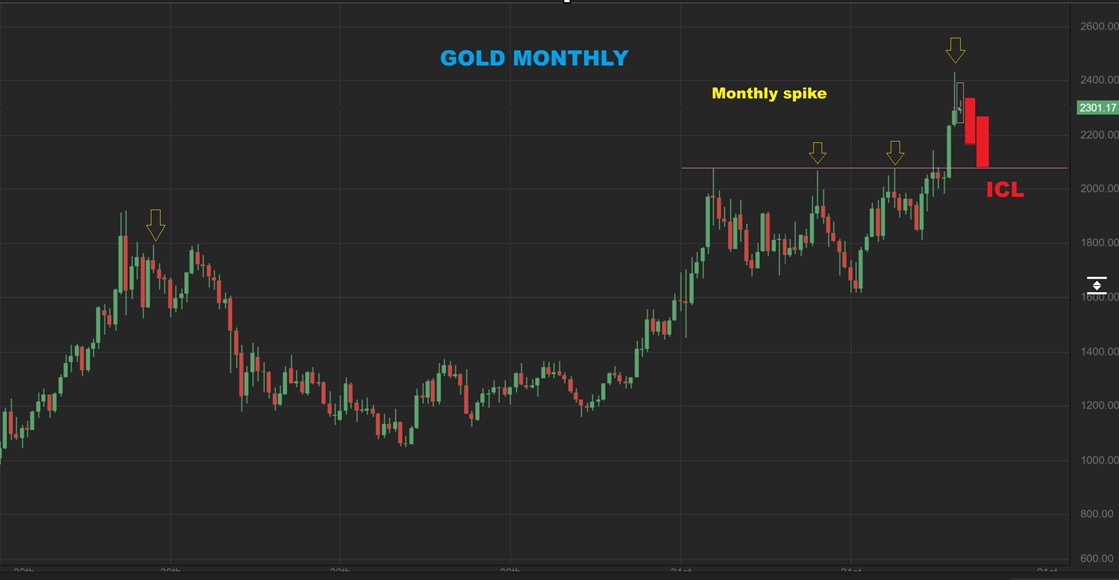
GOLD MONTHLY – I’m sorry about the big scary red candles, they shouldn’t look quite this foreboding 🙂 I’m just drawing a rally in the 3rd daily cycle that can roll over into a back test of the break out with the next ICL. That dip could take 2 or 3 months, so each candle represents that, but the candles should be skinner and les ugly.
.
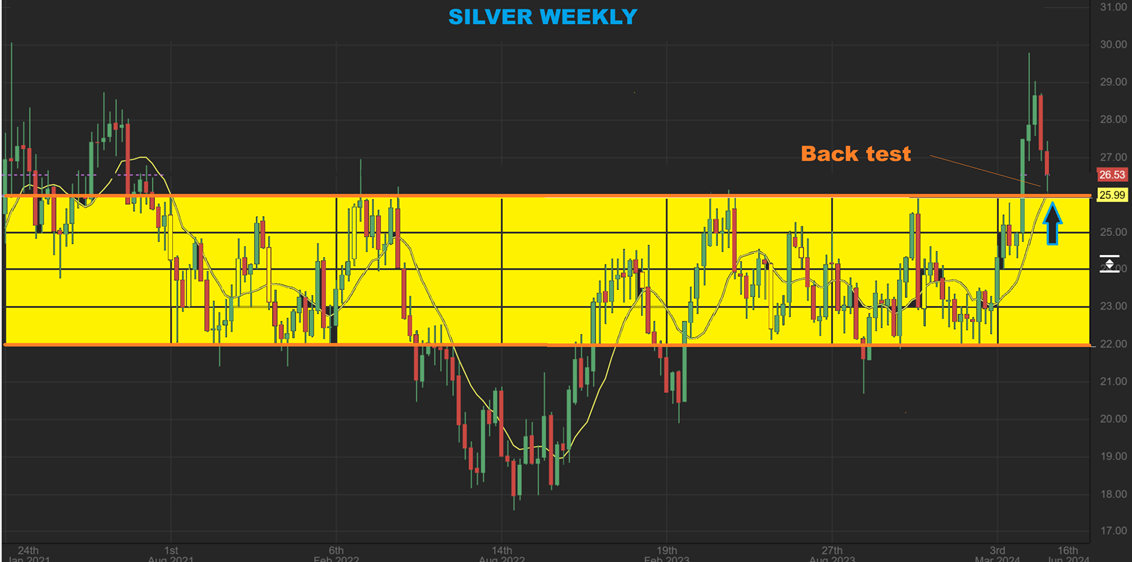
SILVER WEEKLY – Silver did drop down to support and bounced. The timing is day 26 for Silver on the daily chart and day 33 for Gold, but if it bottoms here and Gold bottoms here at day 33, then they can sync up.
.
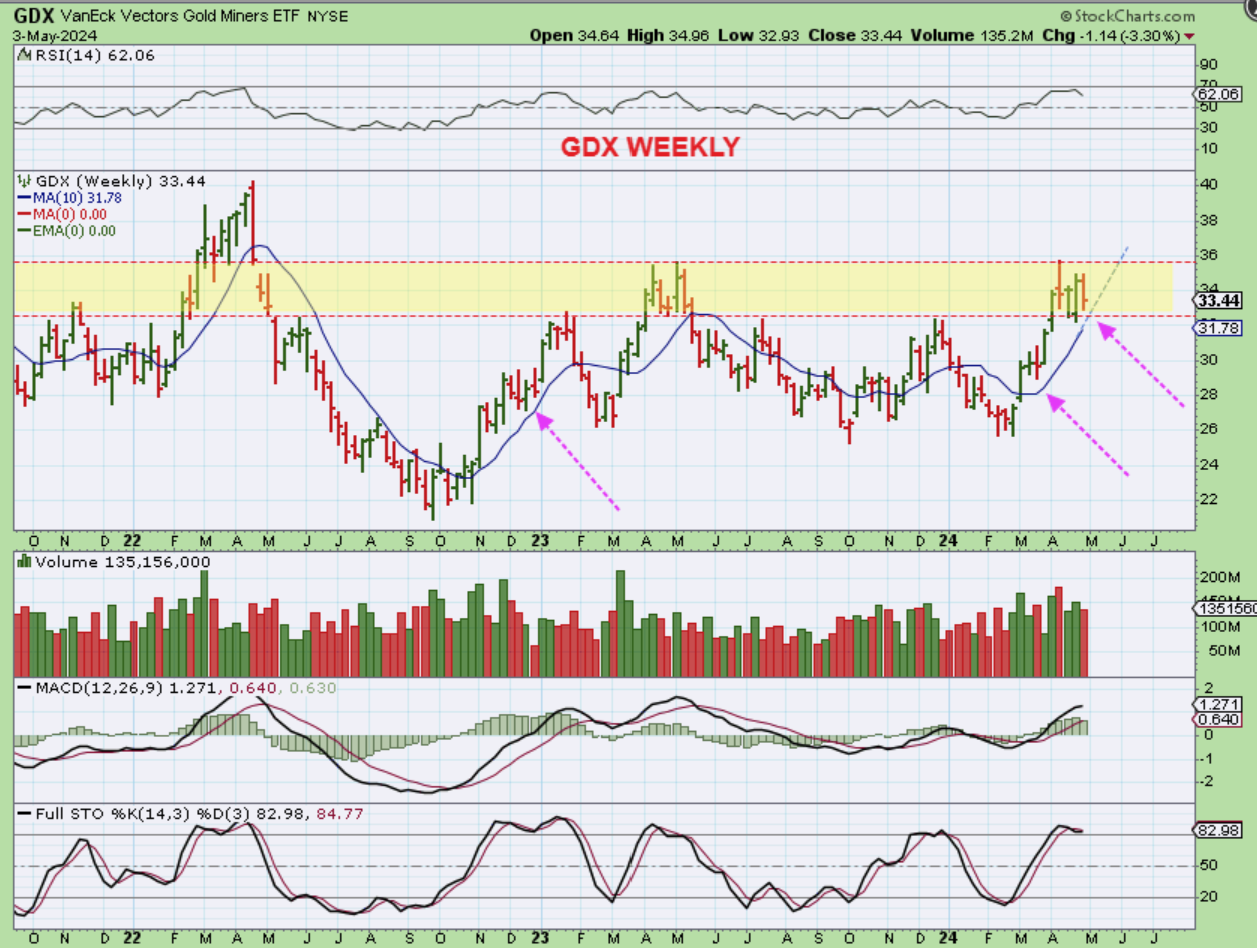
GDX WEEKLY- And the Miners dropped this week, but they have actually been holding up well as Silver and Gold sold off. This is chopping sideways at resistance (yellow area), but has reached the 10 week ma and can move higher when Gold & Silver give us the dcl.
.
The General Markets responded positively after the Fed Mtg and Speech, and they are close to the 50sma. Next week we’ll see if they can continue higher or not. The Precious Metals Gold & Silver are within the timing for a dcl, with Gold at day 33. I think that we’ll see that confirmation of a dcl next week, so Miners can be accumulated now or after that dcl is confirmed. Another nice trade will be the Crypto area, when Bitcoin is due to bottom is roughly 10 days, and I’ll discuss that below. The chop and drop as we head down into a dcl does get a little boring, but once we bottom, going long can add to our profits. We are almost there! Enjoy your weekend!
.
~ALEX
.
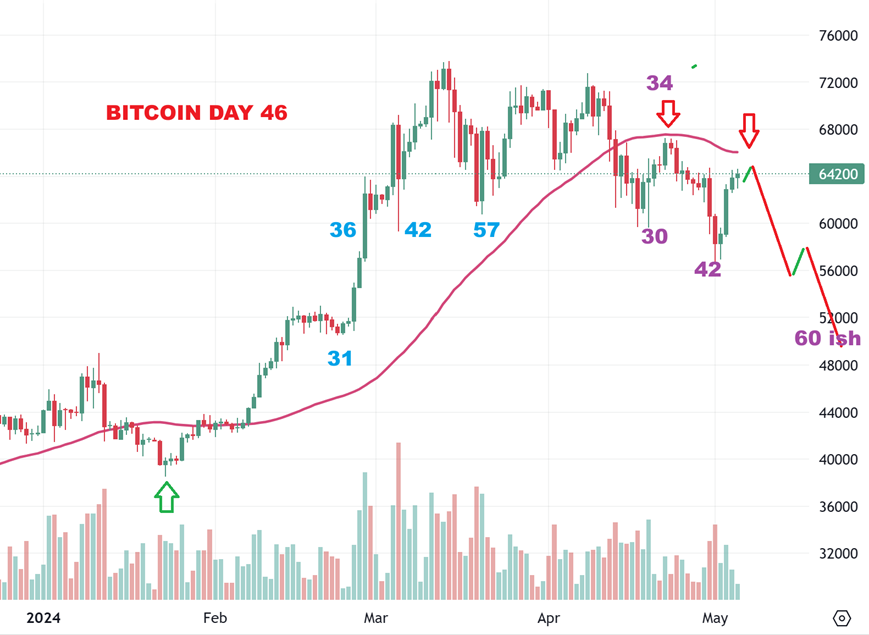
BITCOIN is doing as expected. It broke down and failed at that 30 day 1/2 cycle low (Breaking below day 57 of the last daily cycle). That told me that price would not make new highs, instead it would bounce, become choppy, and eventually chop lower until we get closer to day 60. It is now on day 46, so it could be roughly 10 days away from a low. I just want to be patient and be ready to trade long when it gets to a final low closer to day 60. The last dcl came at day 57.