April 13th Weekend Report – Time For A Rest?
As we have seen with the General Markets and Precious Metals markets, a Bull run can be quite an impressive move. After a good run though, all bull markets will eventually need a rest. We will either see a drop into a DCL or an ICL, depending on where we are timing-wise, and then that bull run can resume if conditions remain bullish. Our markets do look ready for a rest, so let’s take a look at what we have with our current set up in the charts.
.
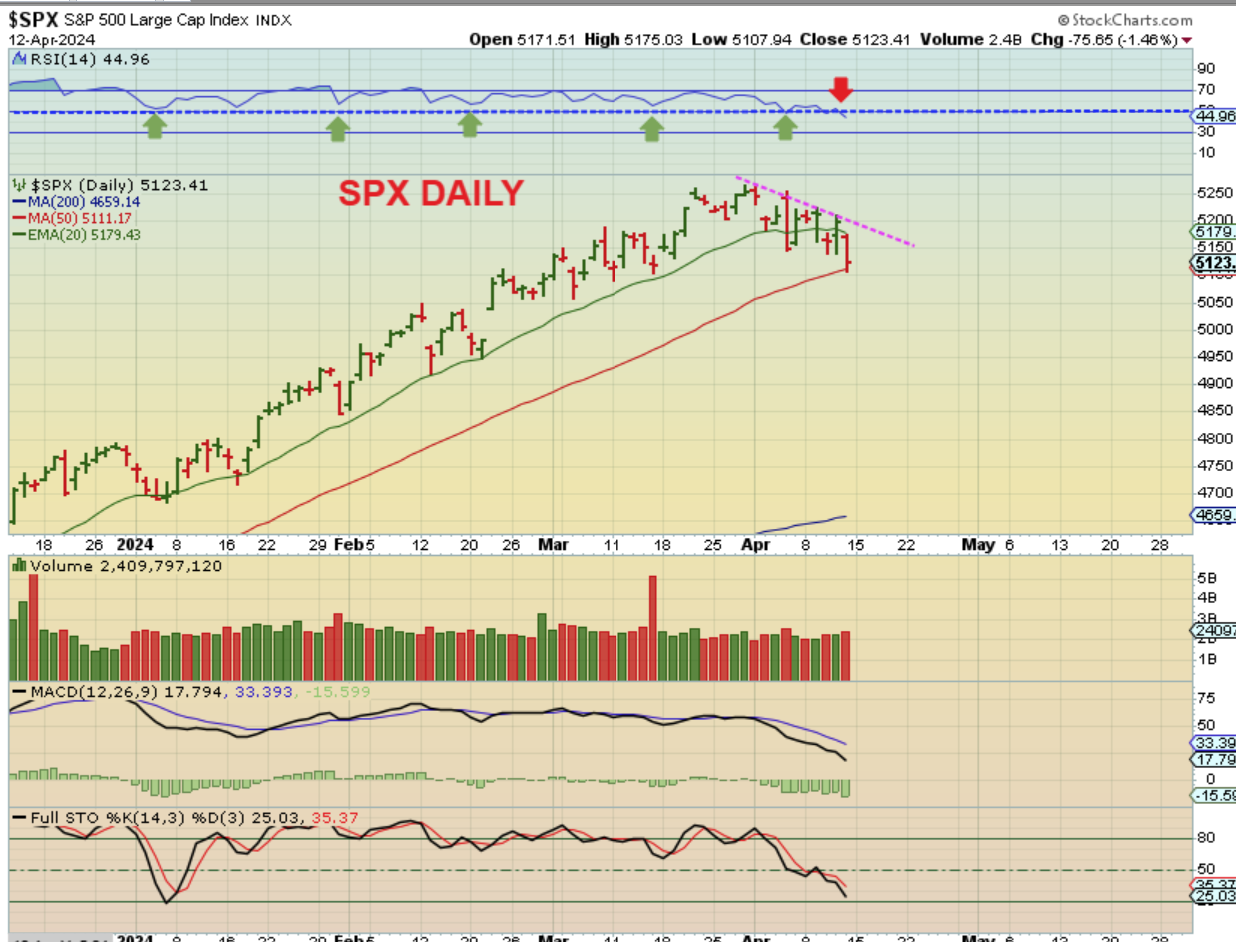
SPX DAILY – The SPX has been chopping lower and Fridays drop was as big as the CPI drop over a week ago on Wednesday. As you can clearly see, the bull run that was faithfully holding up at the 20ema has changed. This could lead to rallies that keep rolling over and eventually give us a correction into the Next ICL.
.
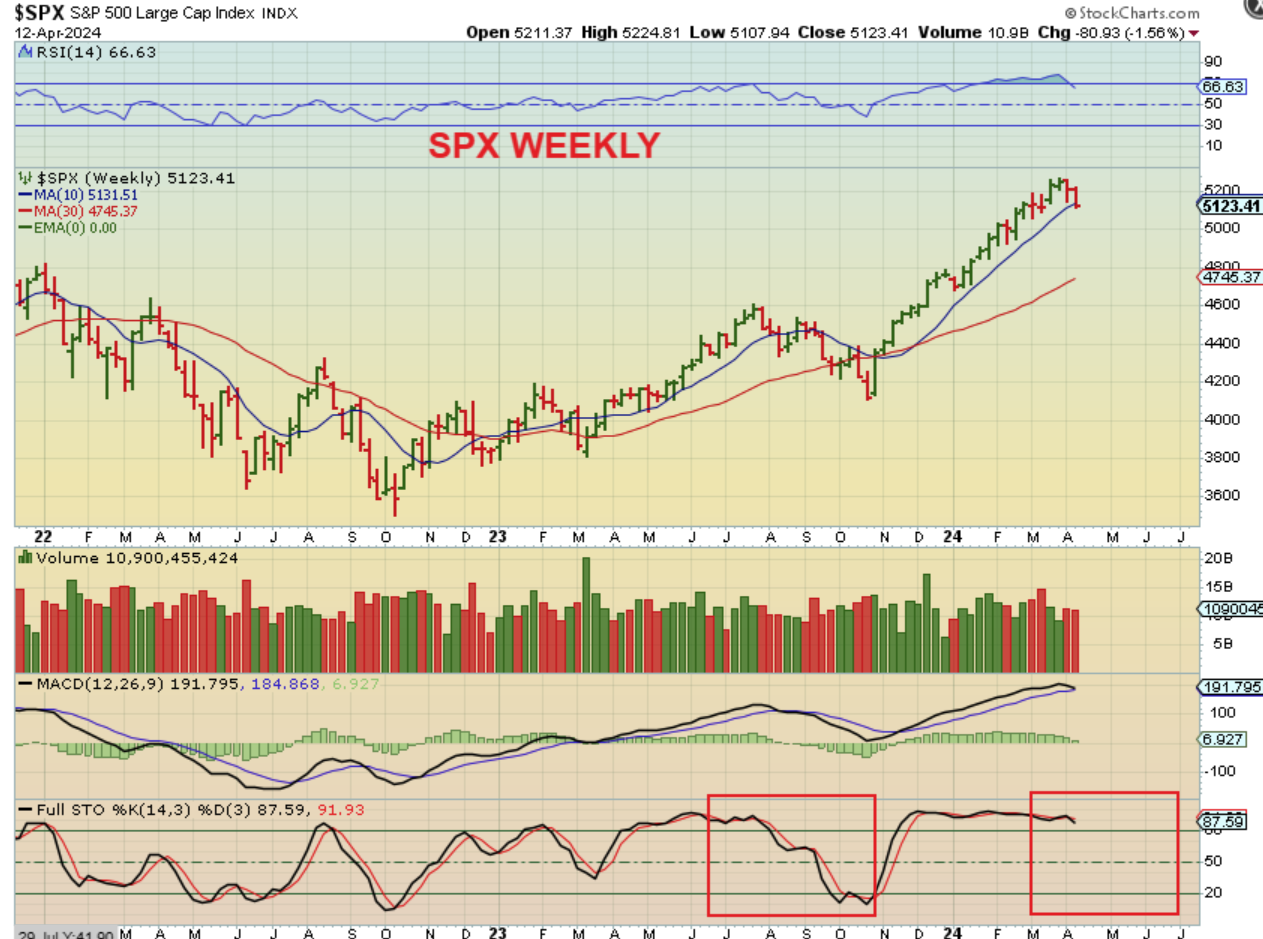
SPX WEEKLY – On a weekly Bull Run we often see the 10 & 30 ma hold as support, but we just closed under the 10 week ma, confirming that something is starting to change in our General Markets. This is not bearish, but a correction has started, So…
.
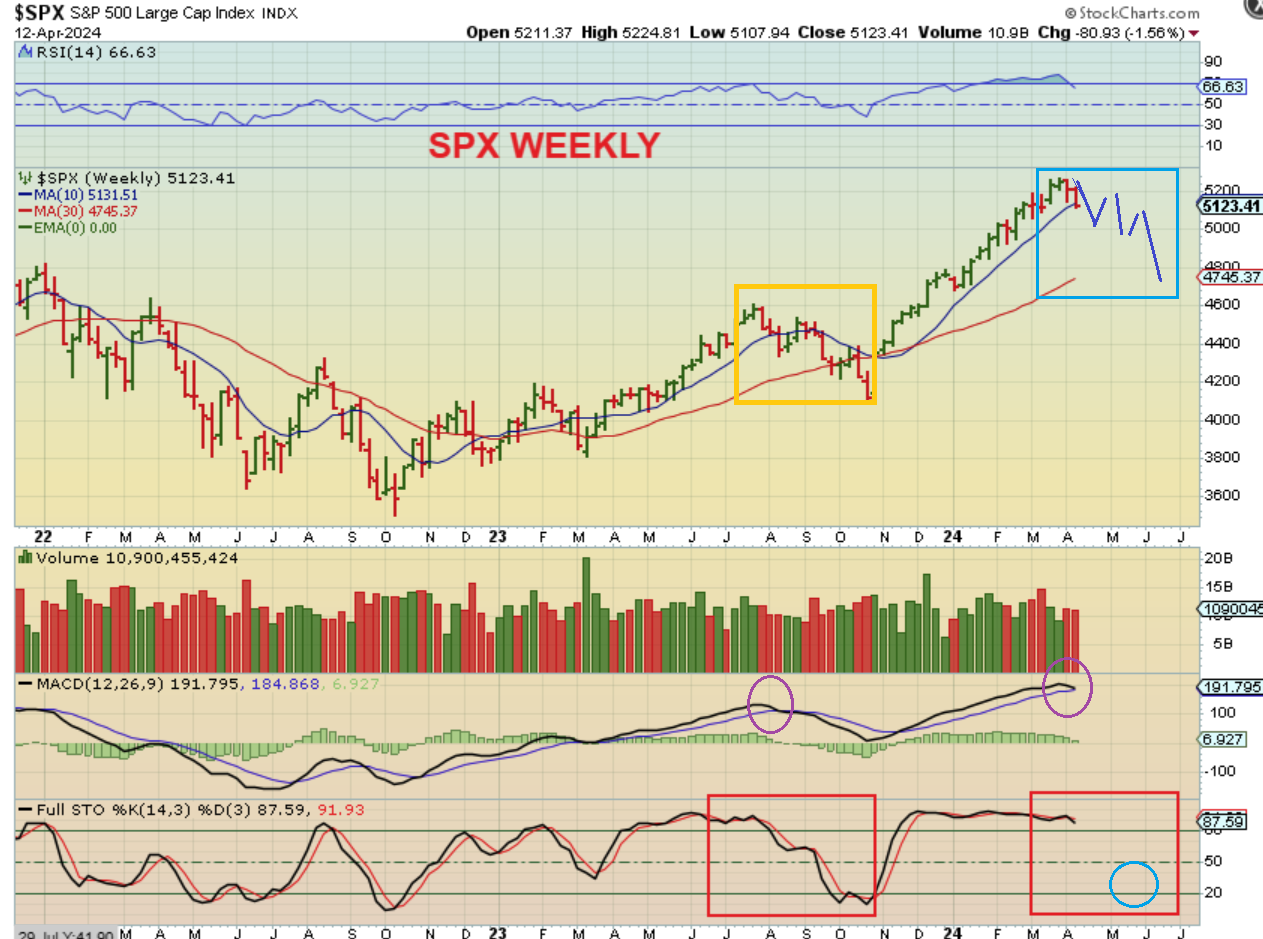
The Bull looks ready to take a rest, likely bouncing lower in similar fashion to what we saw in July – October of last year. The MACD and Stochastics may also follow that path. So we could have 2 more daily cycles lower over time. That will be a major buy opportunity when an ICL is in place. Maybe a rate cut or renewed mention of it from the Fed finally gives us a rally out of that low if inflation cooperates.
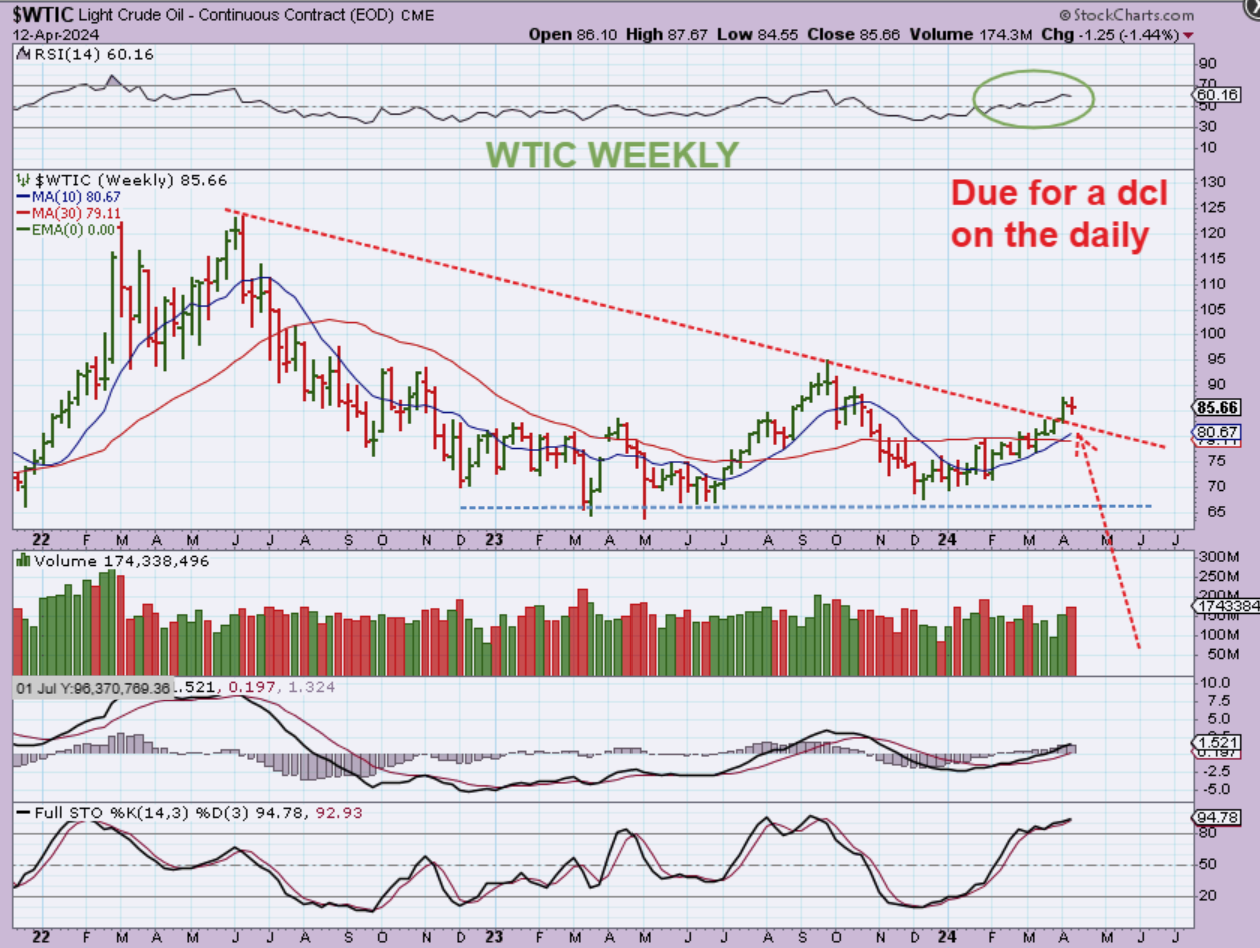
WTIC WEEKLY – We caught the lows in Dec/January, but it was too choppy for me, so I (we) traded Crypto stocks, Mj Stocks, Biotech, etc. Oil was on now day 47 on Friday, so even though it has been bullish, its due for a dip into a dcl. That dip often lasts around 50 days, so a back test of this breakout may be all that we get. We are at $85, the 10 week ma is at $80, so a dcl could come anywhere in that area. I have mentioned MRO, VLO, NOG, ERF, APA, OKE, XOP & GUSH, etc as trades here over the past few months.
.
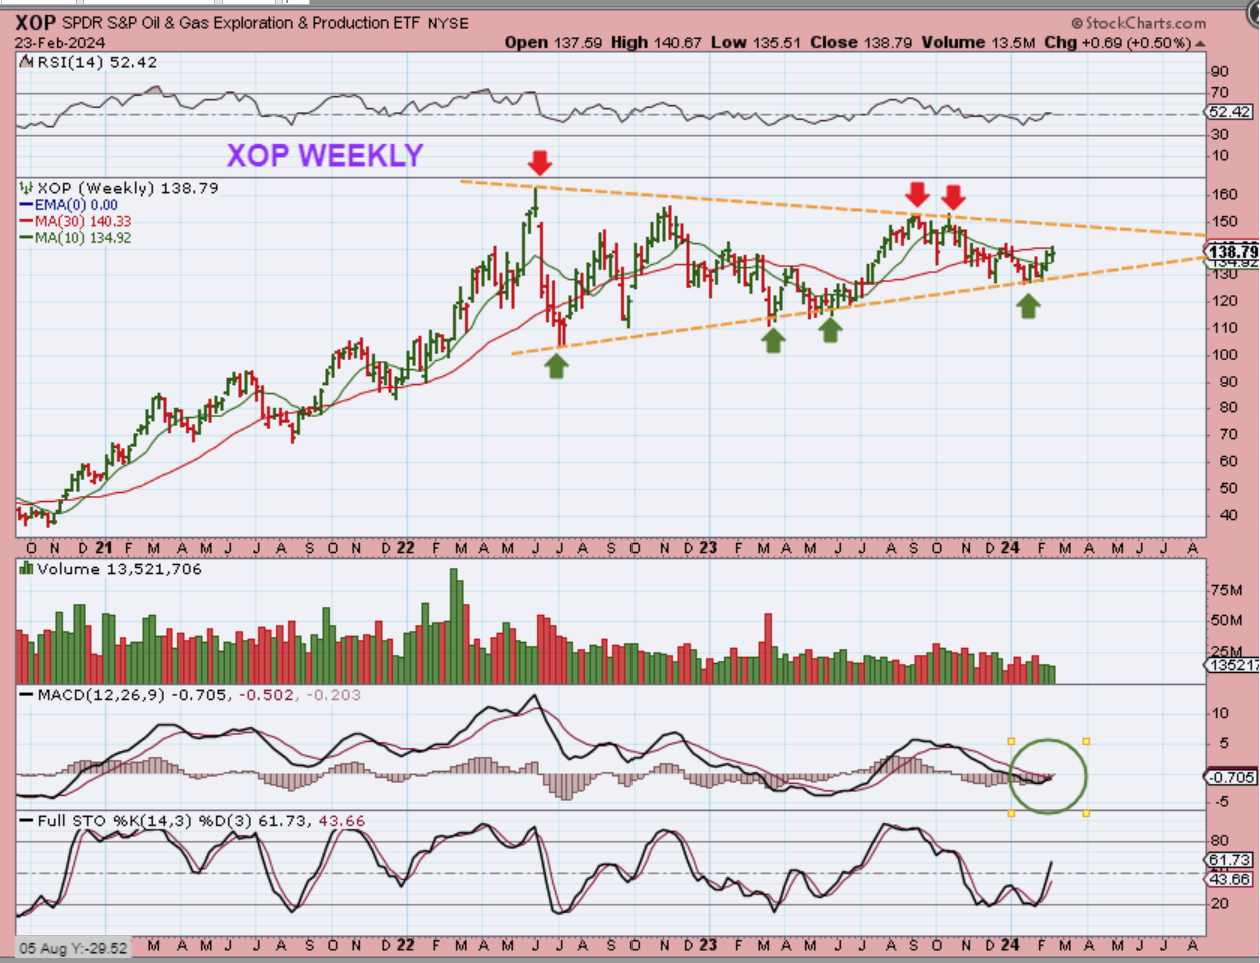
XOP WEEKLY – Back in January and February I was pointing out this very bullish looking triangle in the weekly chart of XOP. This was the buy area and then a breakout was possible…
.
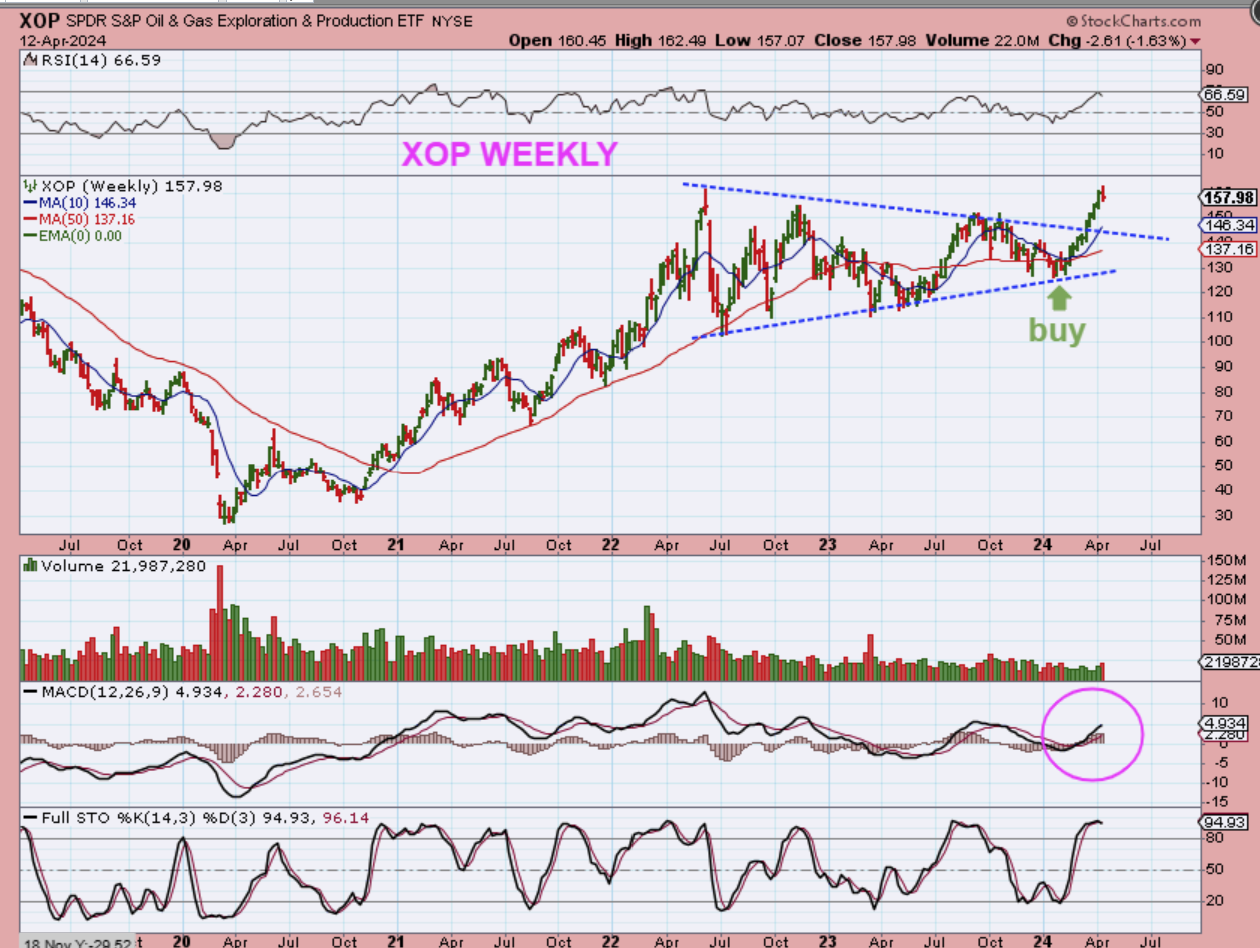
XOP WEEKLY – The XOP broke out and continued higher. Some of the Oil stocks were actually very good trades. I thought that this would back test, and it still could with the General Markets dipping lower, but so far it is running away. XOP was down 1.63% last week though.
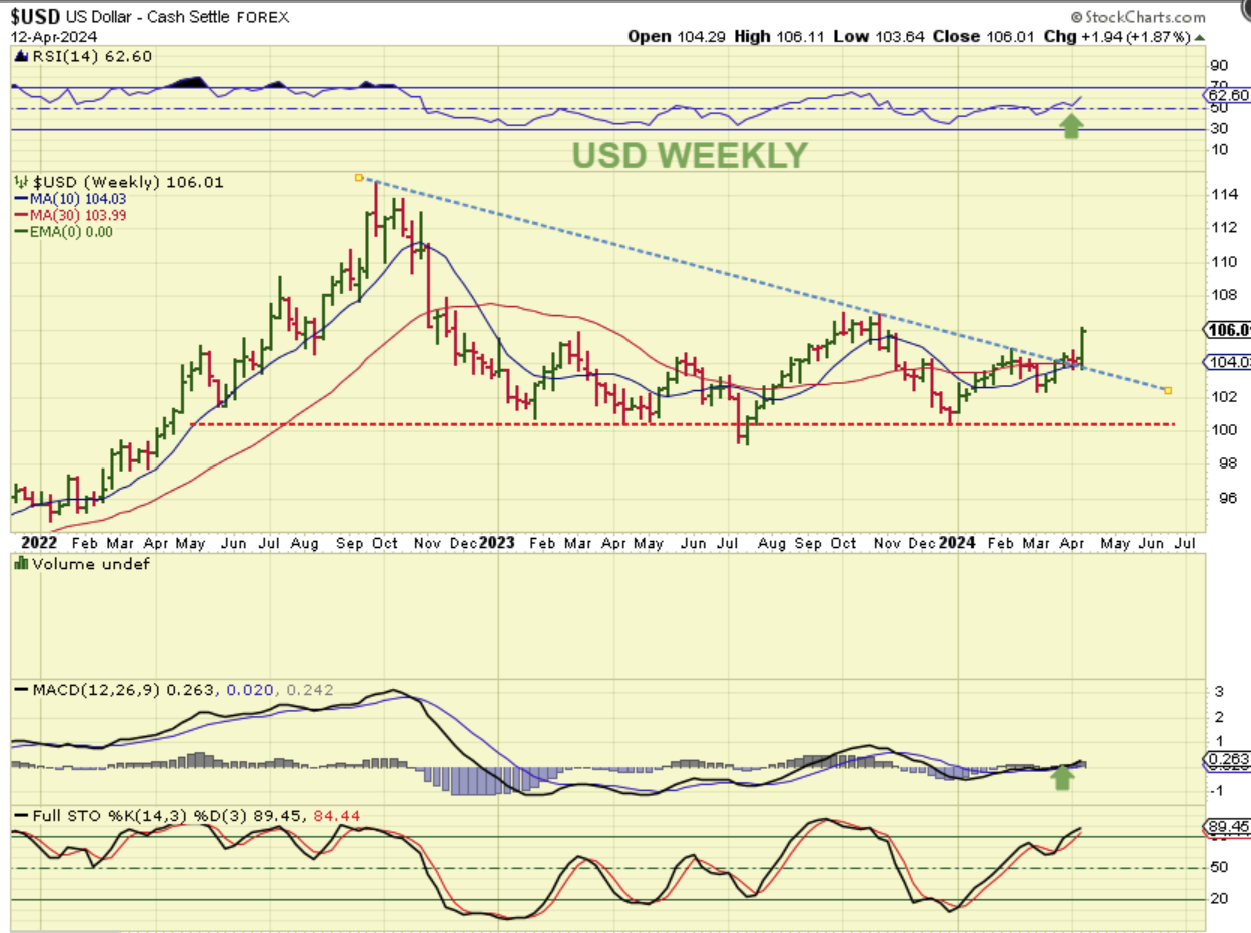
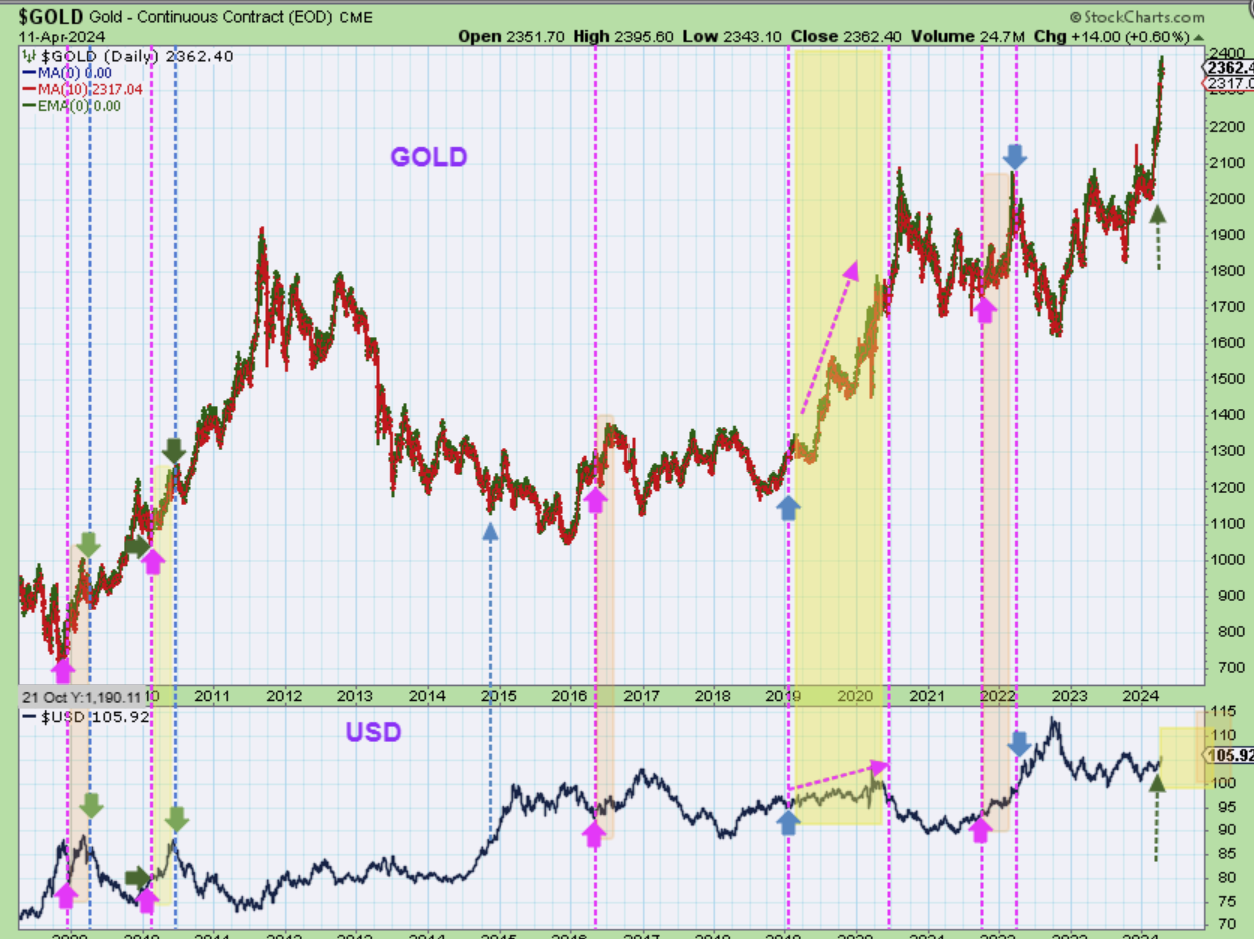
USD WEEKLY – We saw a strong spike higher in the USD and Gold and Silver were spiking higher with it on Friday, but Gold and Silver eventually sold off. This is very bullish for the USD can might be attributed to the higher CPI Numbers (no rate cuts for the foreseeable future). People have concerns about Gold when they see a stronger dollar…
.
People have concerns about Gold when they see a stronger dollar, so in the past I have pointed out times when the USD ran higher and Gold did too. This chart shows a number of those times, and then I will zoom in on the next chart, but here we saw it in 2009, 2010, 2016, 2019-2020, and 2022, so it can happen and it has happened. Lets zoom in on those smaller 2009 & 2010 area…
.
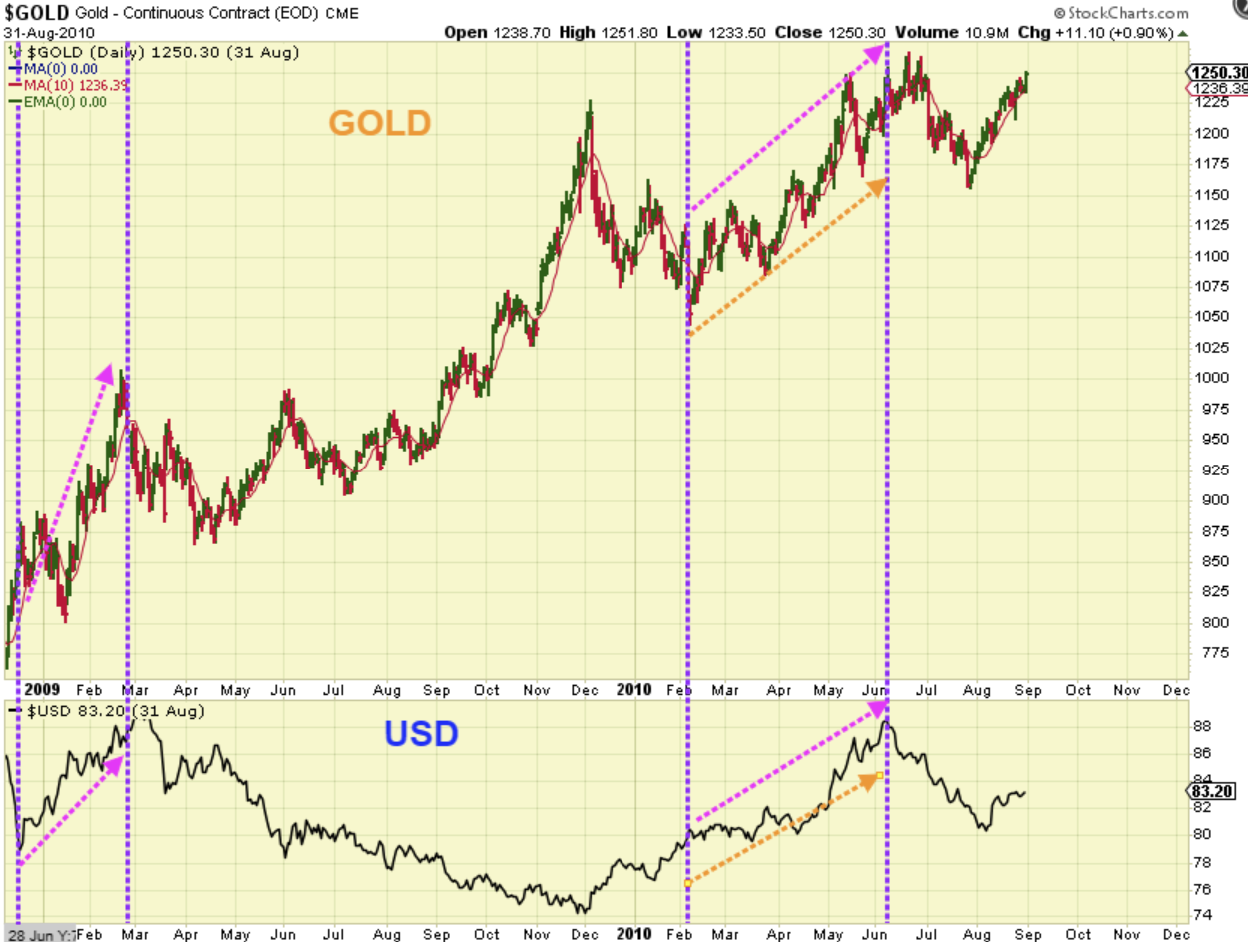
So here we’ll zoom in on 2 of the times when the USD ran higher and Gold did too. In each case it lasted for few months and I think that we’ll see that happen again. The only thing that may be different is that as the USD rises, Gold may dip, and then when the USD dips, Gold may rise (alternating or taking turns). Why do I say that?…
.
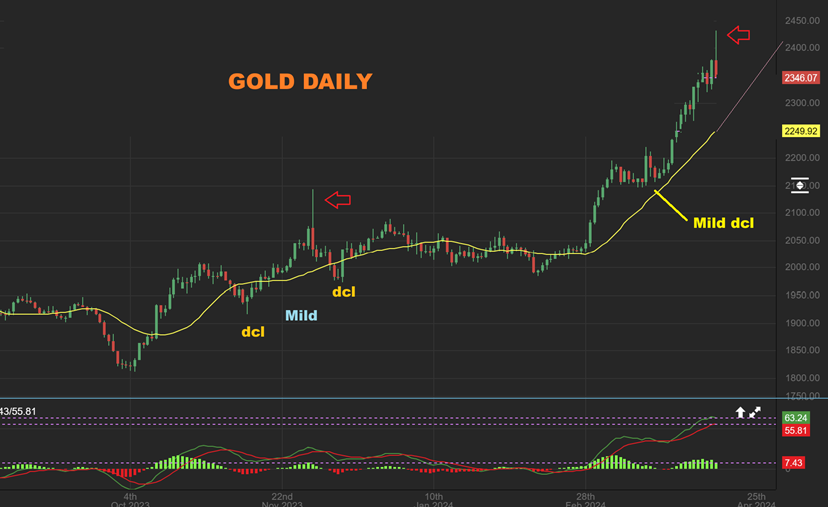
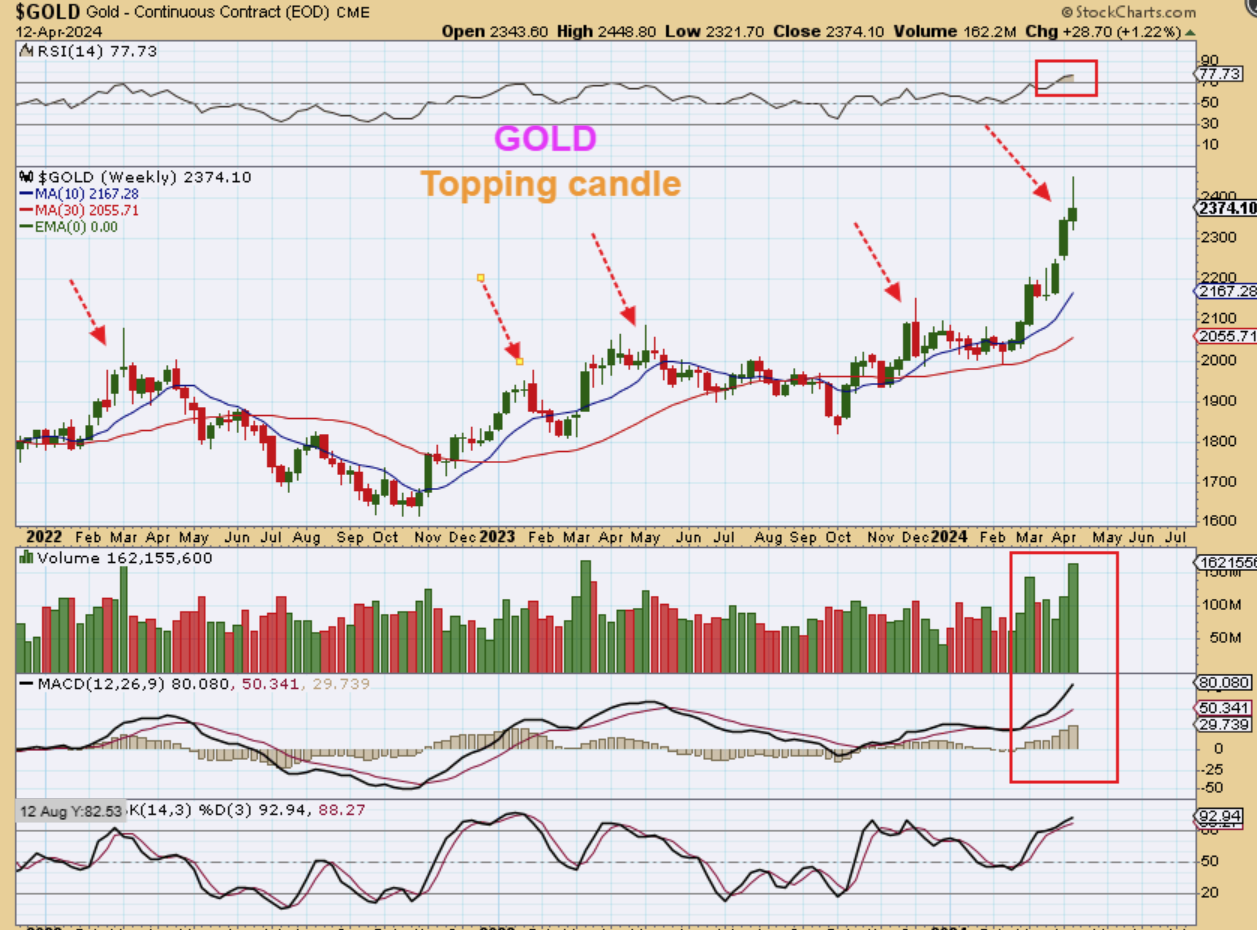
I say that because we had another ‘exhaustion’ spike in price on Friday called a shooting star, similar to what we saw in December with GOLD (see the Red arrows). That was followed by a drop. Not a huge crash, but a pullback into a dcl. So that may be where we are headed next. These spikes are, in technical analysis, the top of a run and a good place to lock in gains, to buy the next dip. You can see that after the Dec reversal spike, the next low was the 3rd daily cycle and then an ICL followed later, leading us to this massive rally.
.
Again, You can see that after the Dec ‘Shooting Star’ (reversal spike), the next low was the dcl that started the 3rd daily cycle, and then an ICL followed later, leading us to this massive rally. So selling in a bull market isn’t ‘Necessary’, but it does help to avoid some choppiness and temporarily giving the gains back. It also gives you cash to buy lower, so you have done the old “Buy low, Sell high, Buy low again. 🙂 There is a time to hold them and a time that selling is o.k.
.
IN THE LIVE COMMENTING AREA OF OUR DAILY REPORTS:
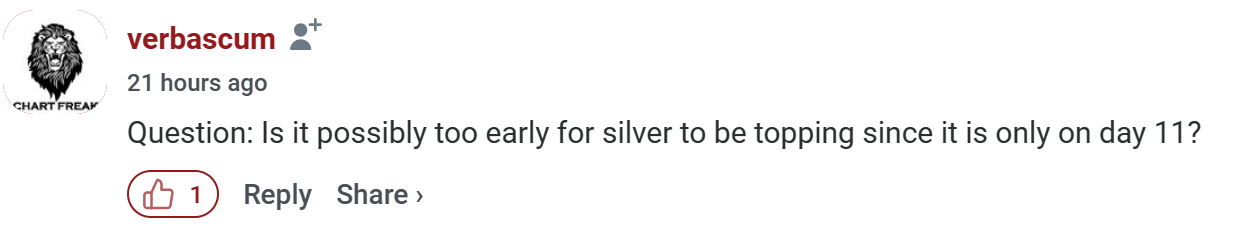
I thought that this was an excellent question in the comments Friday by Verbascum, because Silver also had that ‘spike’ that sold off into a bearish shooting star, but the count was earlier than Golds count: So I have 2 possible answers for this, and both conclude with the fact that the shooting star is a temporary top for Silver, but it is now overall bearish. Let’s discuss it…
Answer #1:
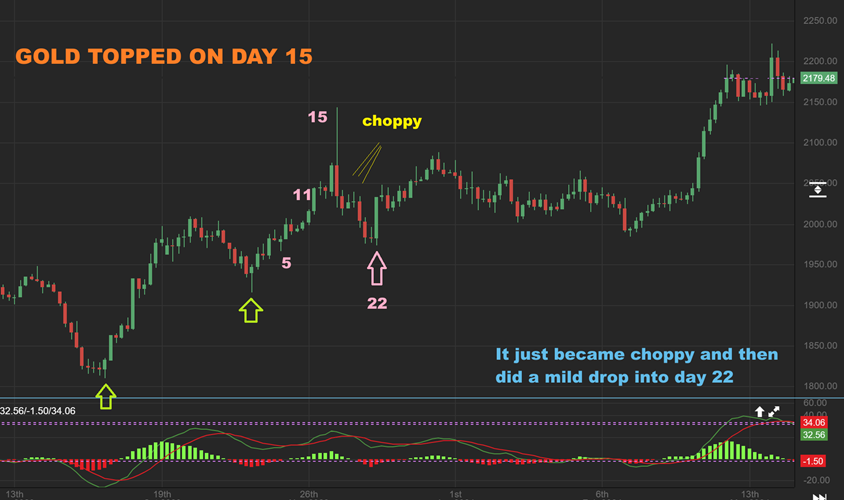
Looking at the GOLD DAILY again, I counted it out and saw that when Gold did that Dec 3 shooting star, it was only on day 15. It then actually chopped sideways before dropping into a short daily cycle low on day 22. So Silver could top on day 11, and become choppy & sideways next week too, yet still put in a shorter daily cycle to also keep it right translated. A day 21 or 22 dcl would show bullishness, as buyers step in. That is answer number 1, yes the topping candle can be a top for Silver, but not long term bearish by any means.
ANSWER #2:
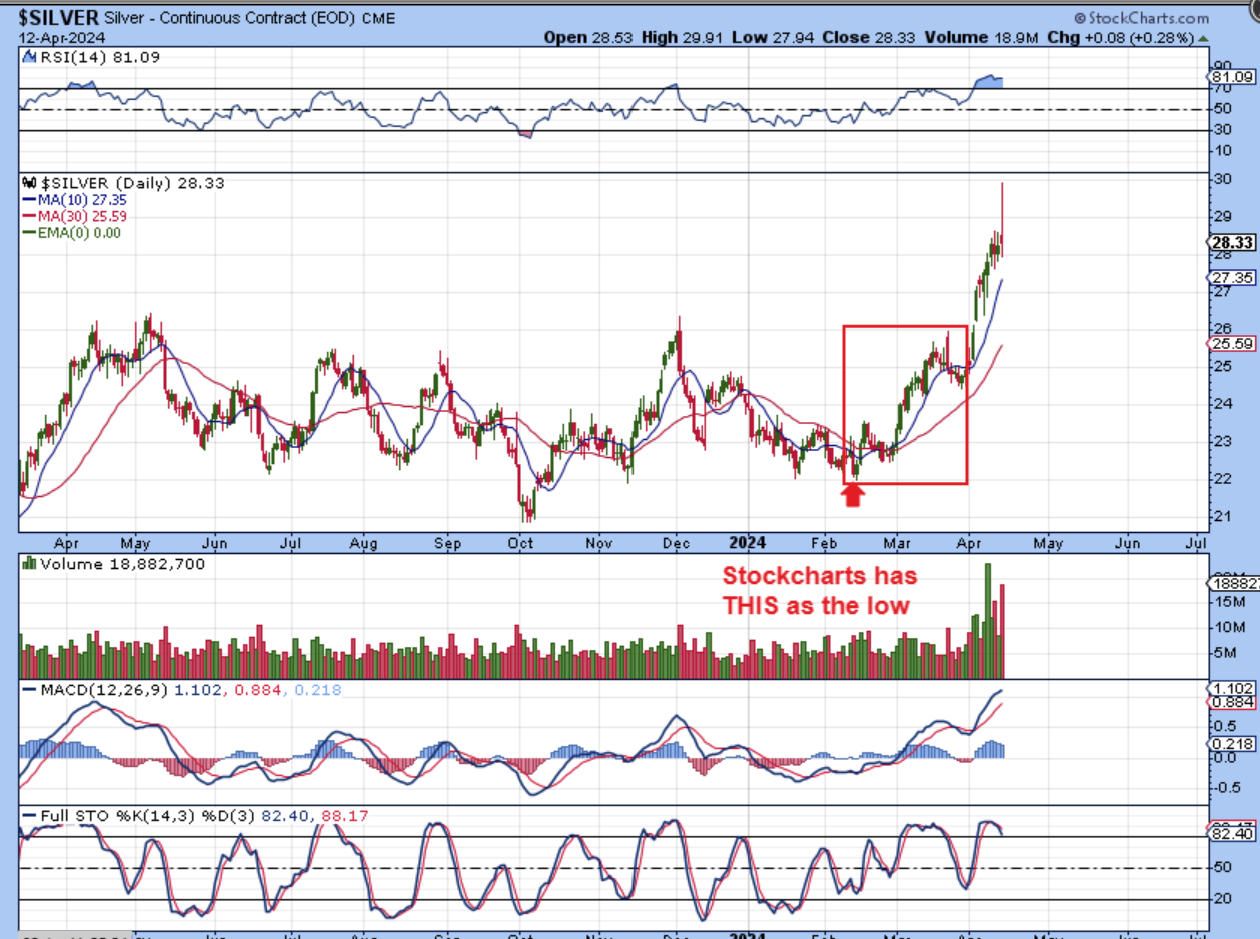
SILVER DAILY – What I am about to point out is an oddity, but on Stockcharts Silver bottomed on what I have marked here, and that low is 50 cents lower than the one in January before it. So I counted THAT low as the dcl and that red box shows the daily cycle. That would give us day 11 for the shooting star. My Point is this— Stockcharts is only showing where the price of silver traded during the times that The U.S. Markets were open. What does SPOT SILVER Show?
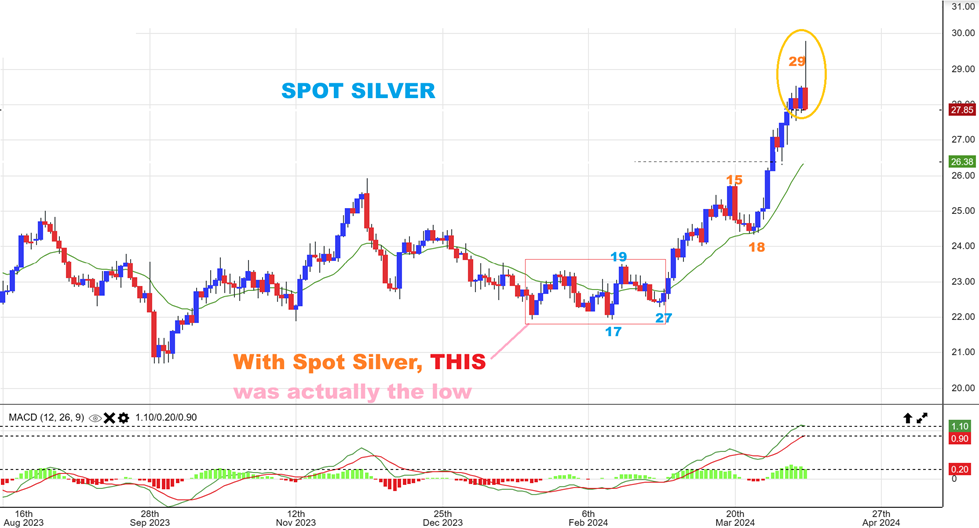
SPOT SILVER shows where Silver traded in real time.
With Spot silver, the real low actually showed up pre-market at the first low, as shown here. What would that do to the count? We would see a count from THAT low to the second low as 17 days and then a push to a new higher high and then a dip to a higher low dcl at day 27, one daily cycle. Starting daily cycle #2 from there, we would be on day 29 with that shooting star. THAT makes sense. So in conclusion…
.
This still doesn’t line up with Golds count, but we have seen that in the past. This really does give us a day 29 high counting from that blue day 27 low, with that first daily cycle being a sideways bottoming process with higher lows. THIS COULD BE TAKEN AS THE REAL COUNT. If so, we would form a dcl in a week or so and may chop sideways for a bit to build steam for the real break out (I will discuss that later)
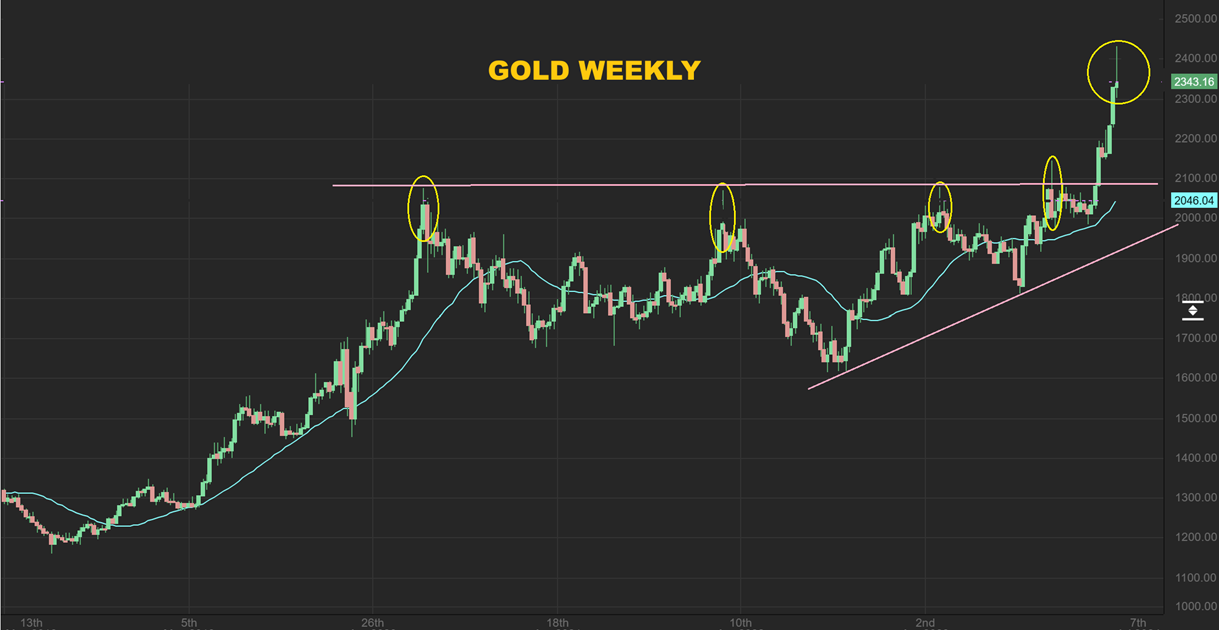
GOLD WEEKLY – Well, we have a topping candle here on the weekly chart too, so this often calls for a little choppiness to cool off the extreme bullish sentiment. That also allows the USD to show its strength. Looking at the DEC Spike, we see that it was actually followed by 3 smaller weeks up and 4 weeks down (sideways chop).
.
GOLD WEEKLY – Taking a look at the big picture, this has been a massive bull run after the breakout and we caught and rode every bit of it, even before the breakout took place. Congratulations on buying a ‘Basket of Miners’ and just sitting tight, but now you may want to lock in some gains if you haven’t.
.
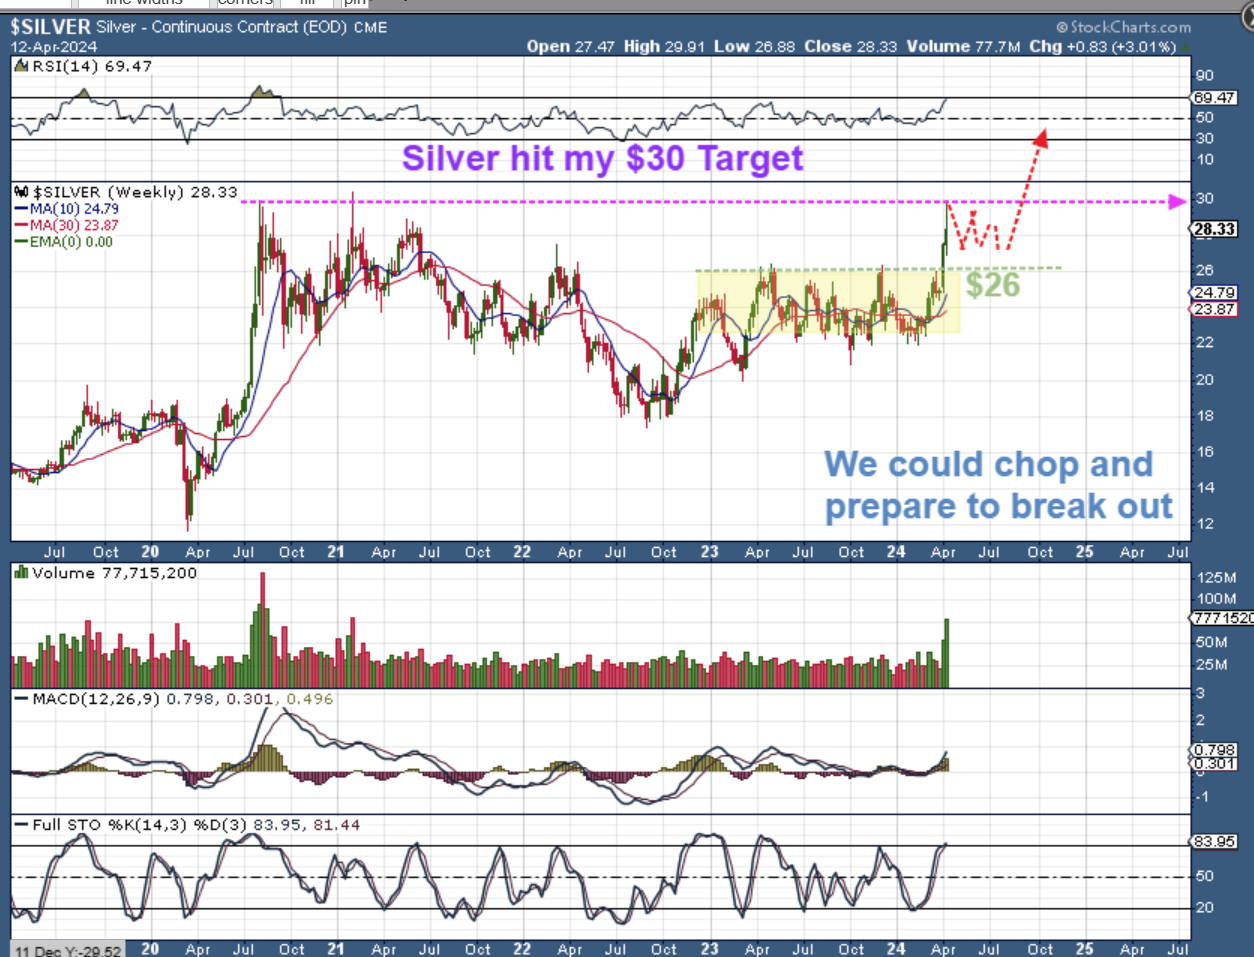
SILVER WEEKLY – I’m sure that you recall that I have been saying that after Silver breaks the $26 barrier, it would work its way through that area above $26 and get to the $30 area, and then it would likely take a rest. It looks like we got there very quickly this week (on Friday) and it immediately took a rest. It is reasonable to believe that this will now chop sideways and build steam for THE REAL BREAKOUT! 🙂
.
Do you remember when I said earlier in this report:
THIS COULD BE TAKEN AS THE REAL COUNT. If so, we would form a dcl in a week or so and may chop sideways for a bit to build steam for the real breakout (I will discuss that later)
This would be THE REAL BREAKOUT!
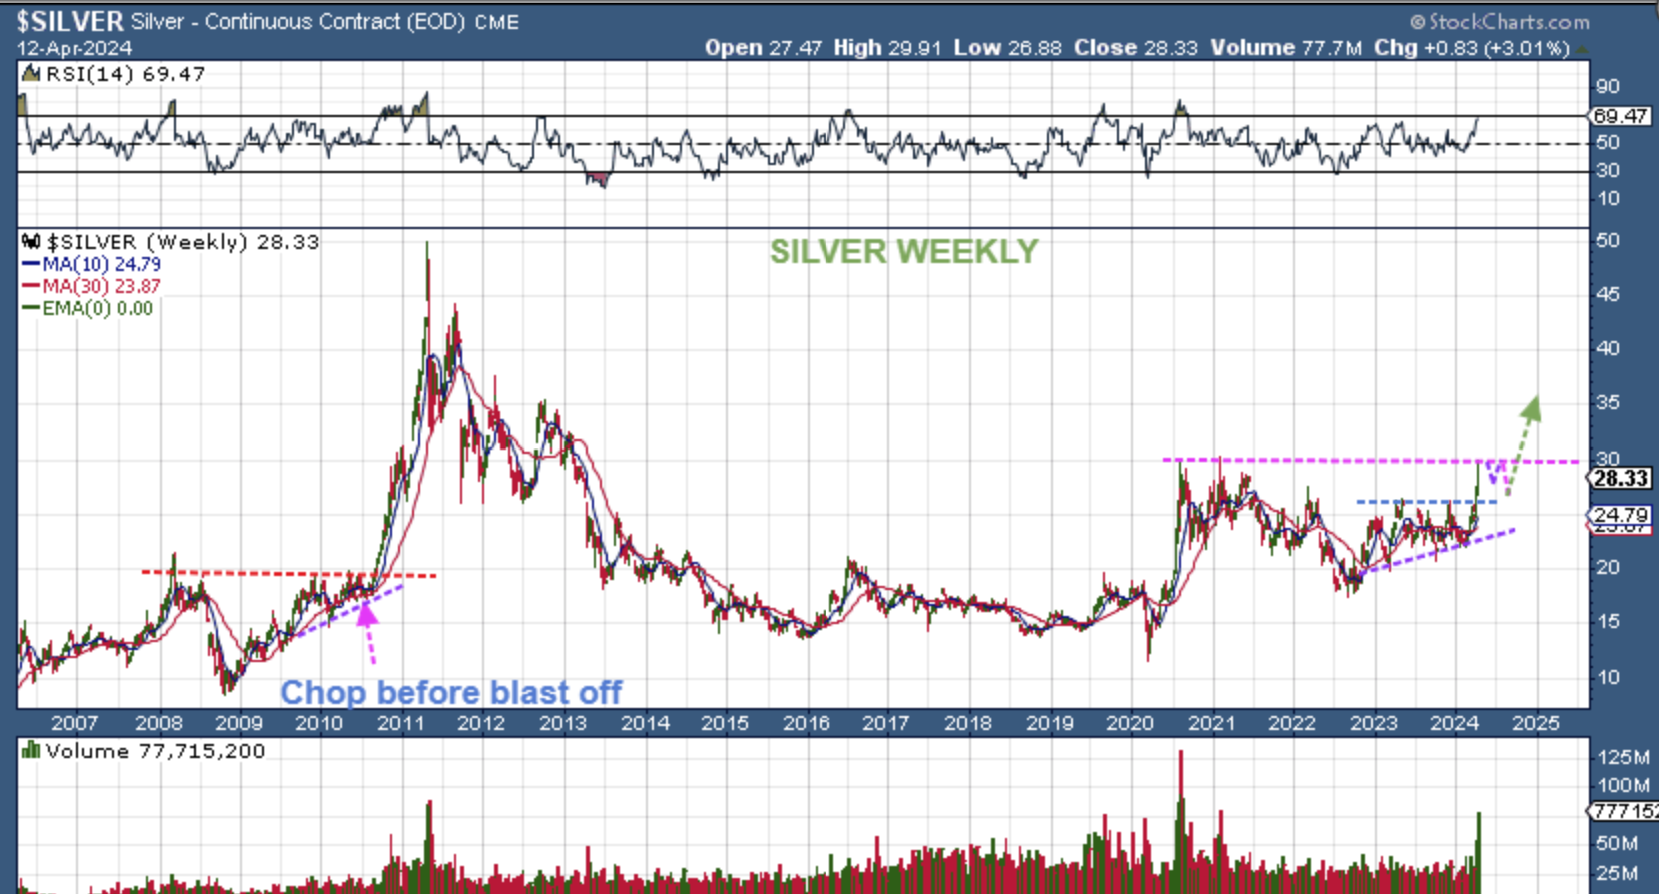
When I look at The SILVER WEEKLY Chart, I look to the left at that monster ramp up in 2011 and I think that that could repeat in 2024. So take a look at how the price action chopped and built steam before that breakout with my magenta arrow. I will not allow any choppiness to lull us to sleep, because we definitely want to buy this dip (especially in Silver Miners) if and when this breaks out from here! Many of the Silver miners that I owned already doubled in this recent run, can you imagine what they’d do then? …
.
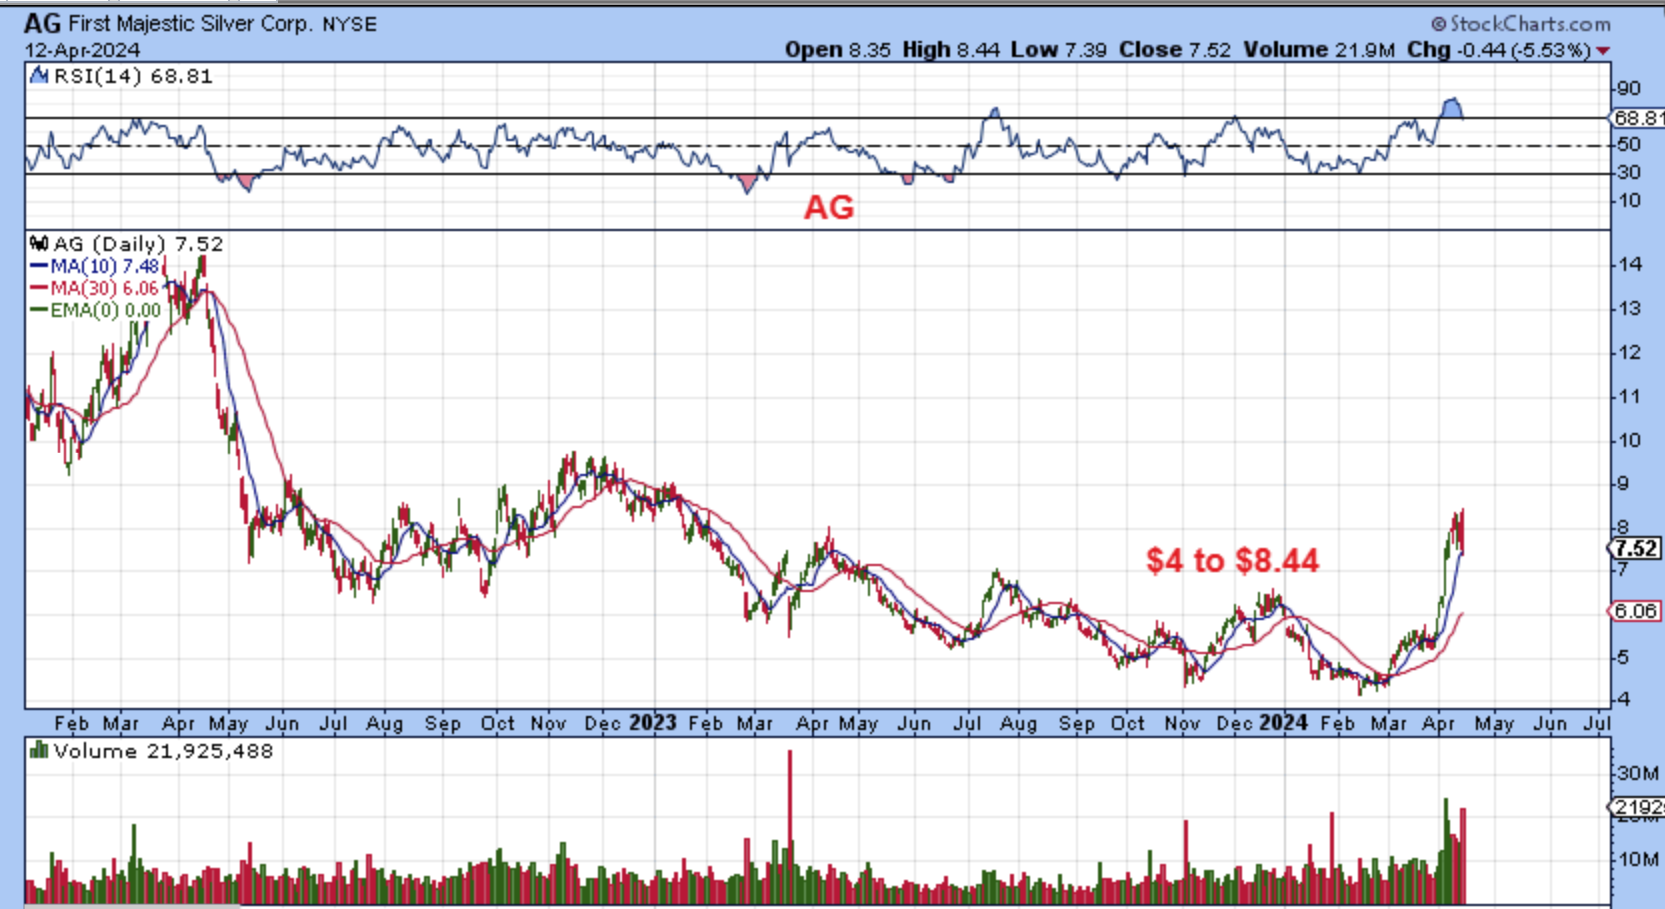
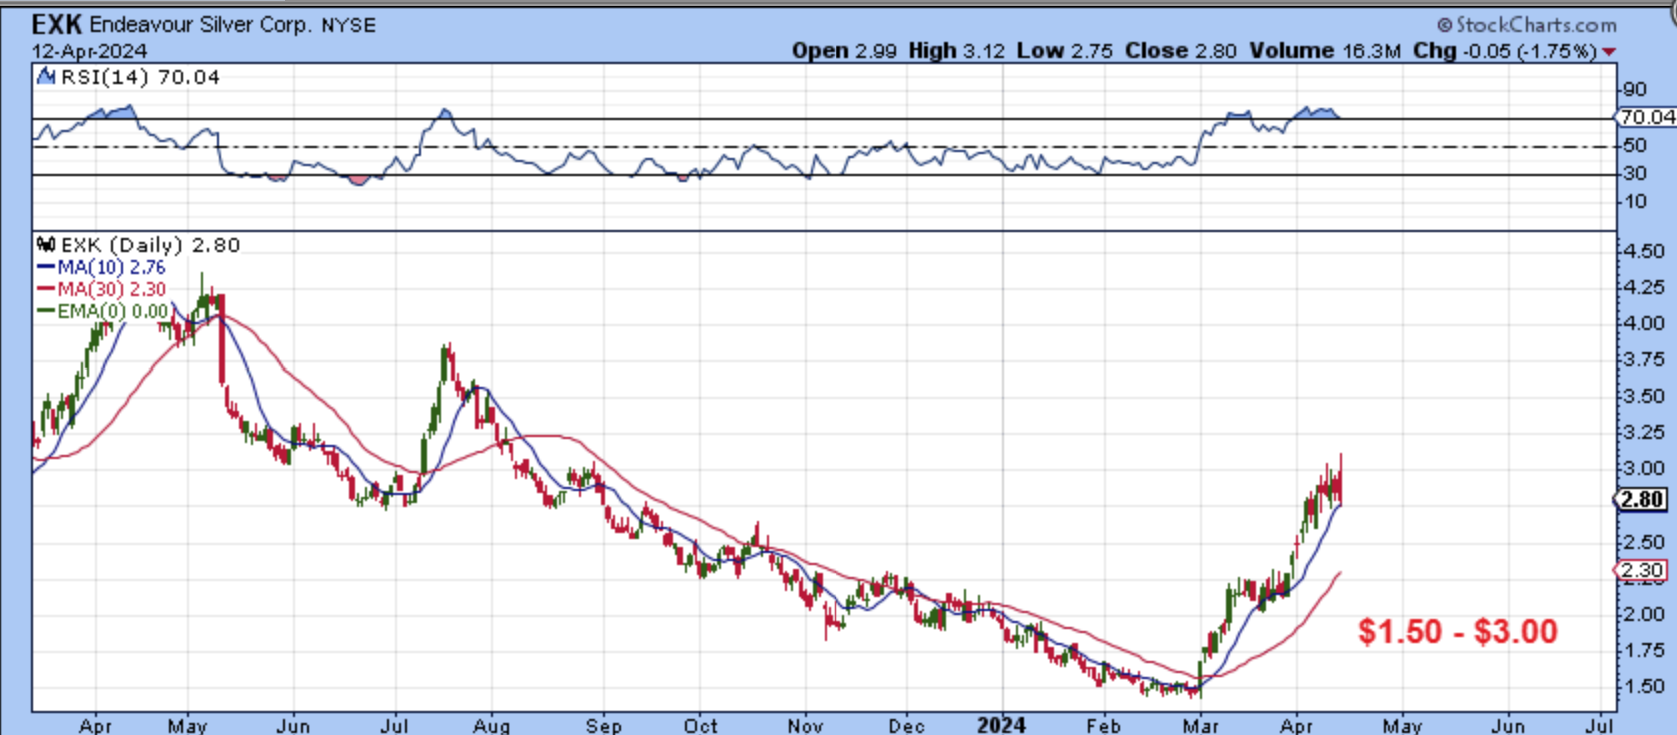
Many of the Silver miners that I owned (AG, EXK, CDE, HL, etc) doubled in this recent run of 2024. We do NOT want to miss the next one after a pullback in this sector.
EXK DOUBLED
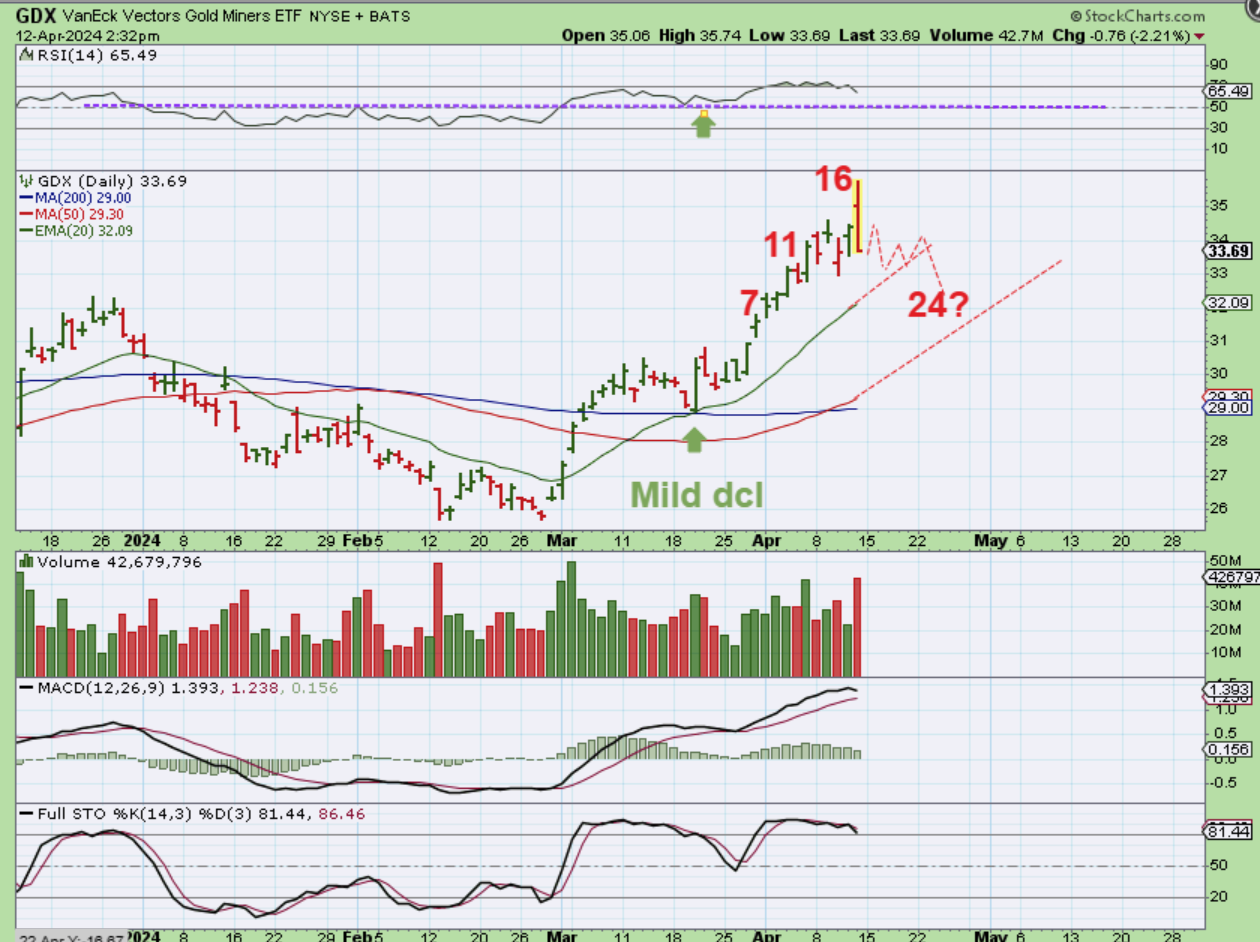
GDX looks to have peaked on day 16 and that should allow it to become a Right Translated Bullish daily cycle. A dip into the next dcl is to be expected, but it may chop around as buyers and sellers trade hands. Day 24 is written here, but as you know and as a reminder, it can extend beyond that. That is just to give you an idea of how things may play out.
.
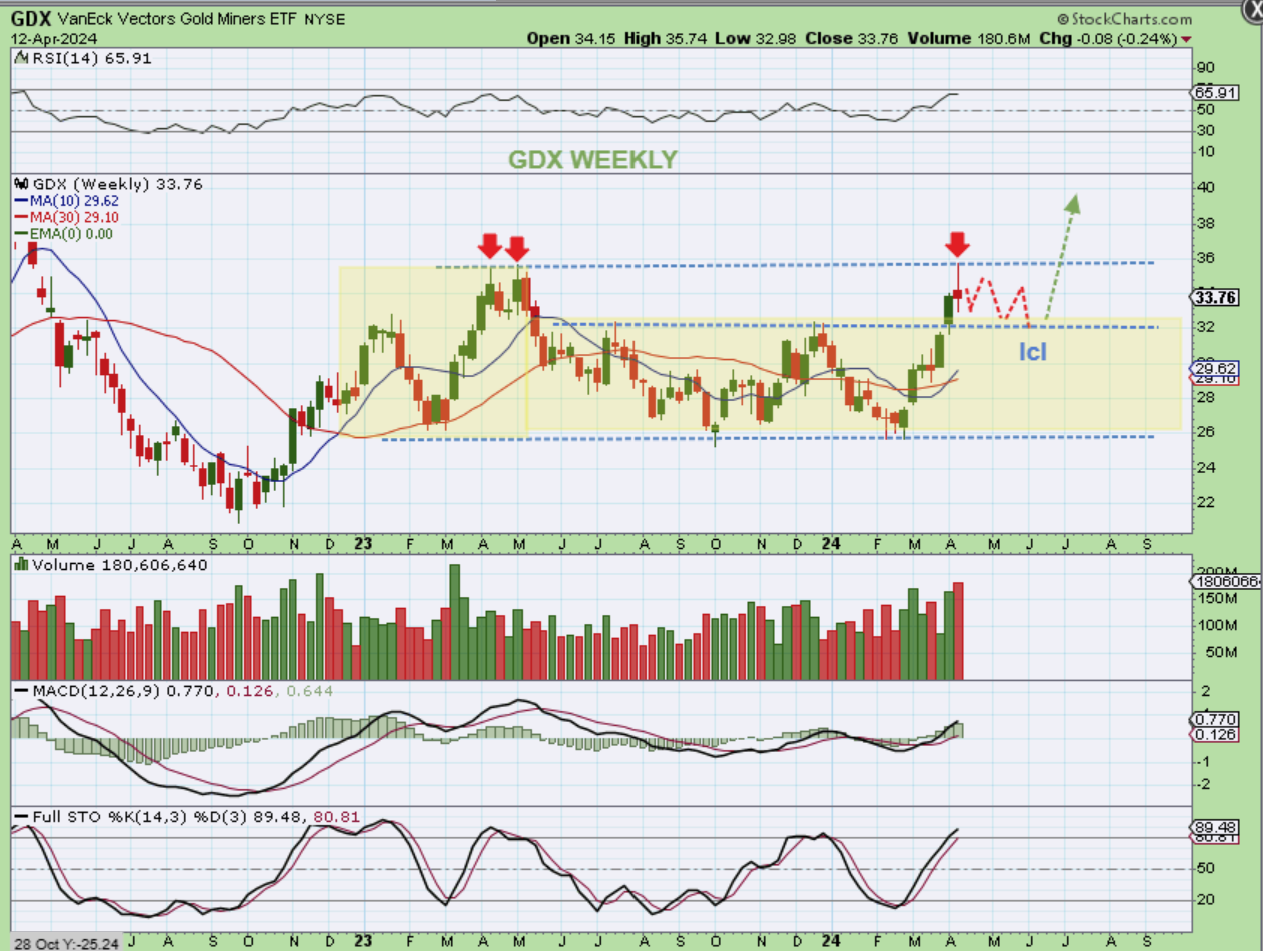
GDX WEEKLY – This has been a nice run out of the February lows right up to the 2023 former highs too. It now may need a rest and could chop or drop as shown here and with Silver. Again, you can sell and try to get back in or hedge Miners with JDST, but buying and holding JDST in choppy conditions does not work well with decay and slippage over time.
.
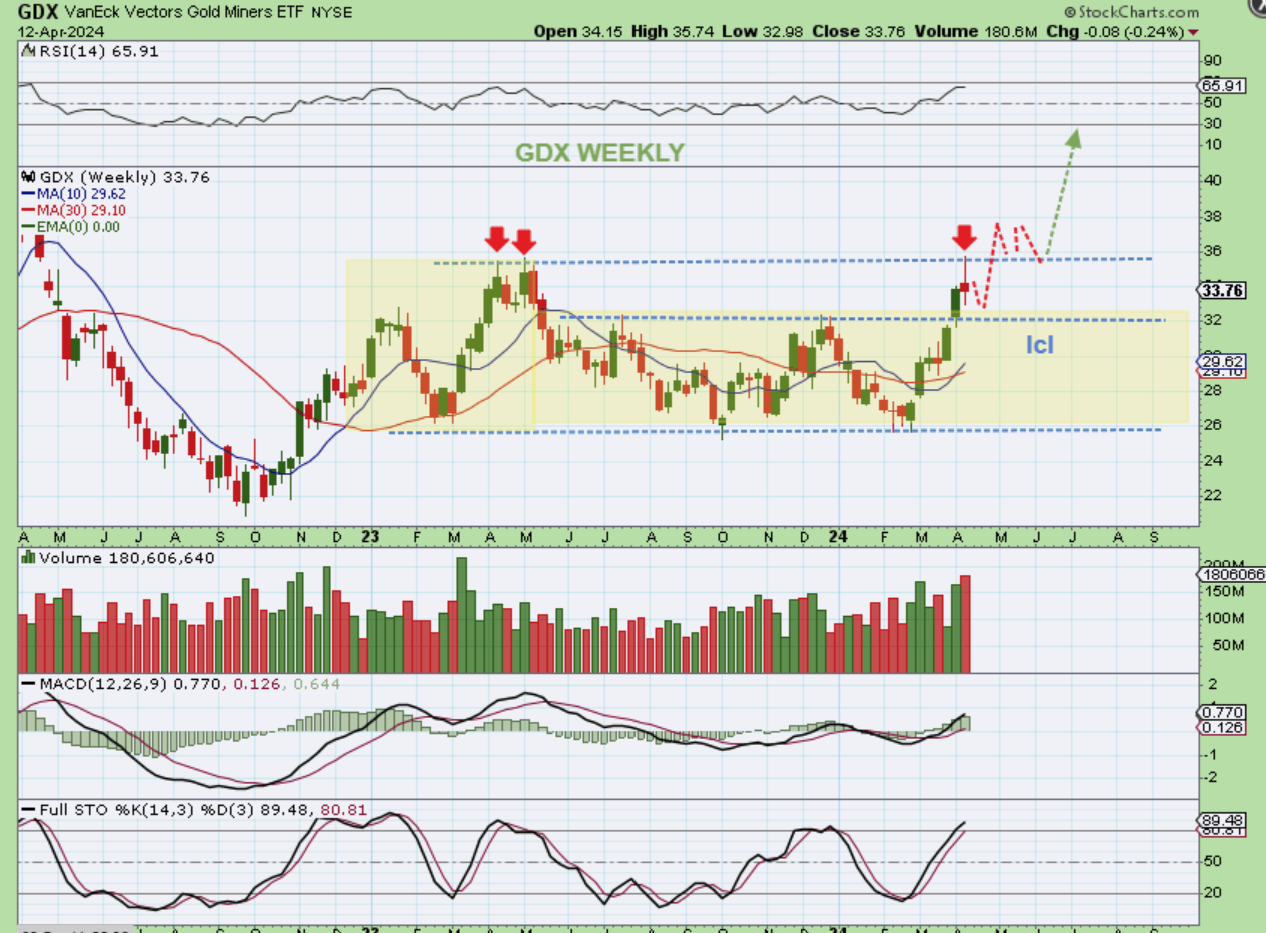
GDX WEEKLY- There is always a chance that the Miners could continue to outperform as Gold chops around, and break out and back test like this. That said, I honestly think that with the topping candles in Gold and Silver, along with the strong surge in the USD, it is likely that the Bull Run in most Miners will take a rest too. In other words…
.
In other words, this is the scenario that I favor. The GDX weekly candle is likely going to be the ‘peak’ for now as shown, even if we do see a bounce next week.
.
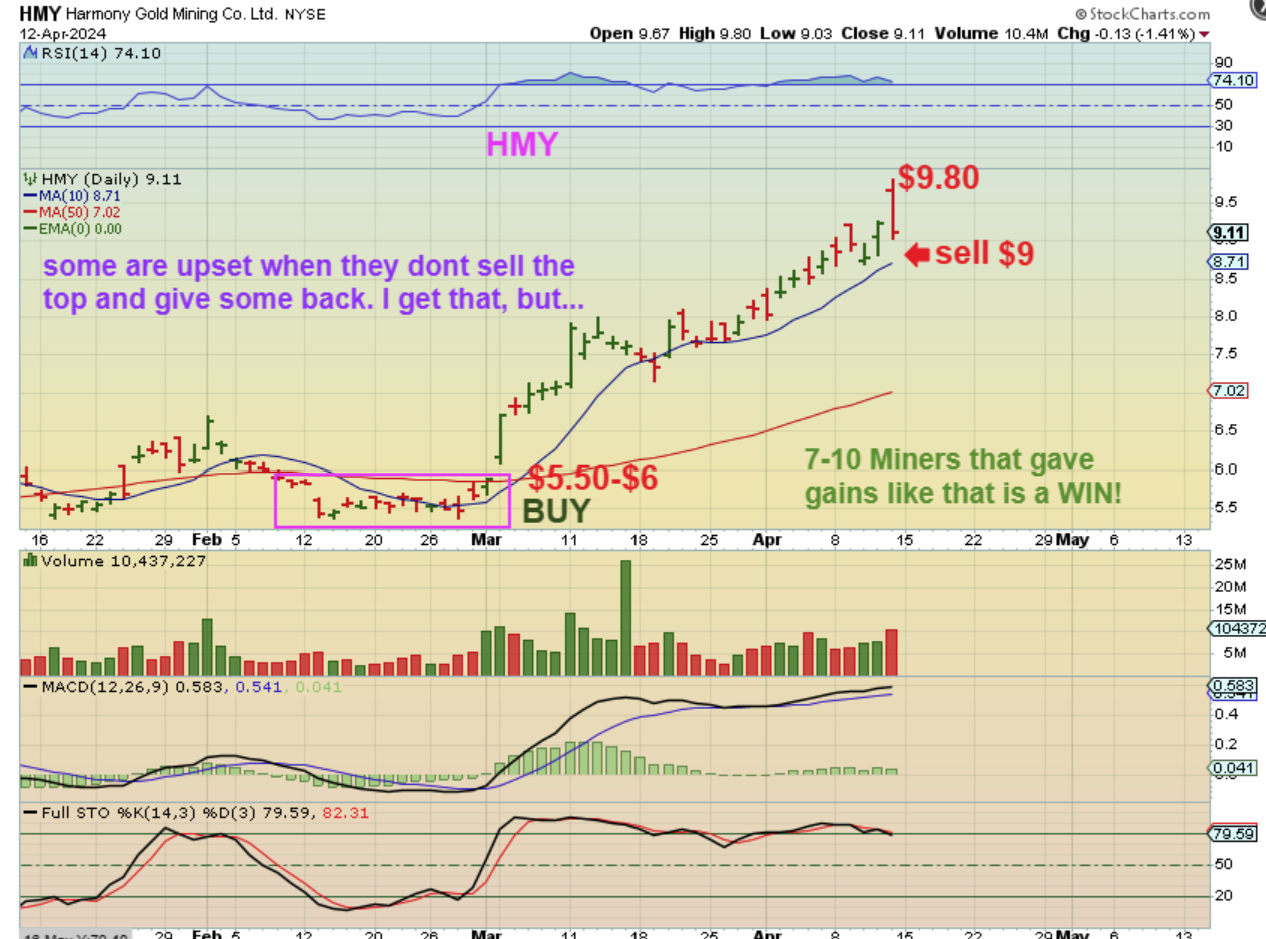
NOTE USING HMY:
I had someone say, “I work all day so I missed selling at the top, that’s a bummer.” To be honest, everyone probably missed selling at that very top, I know I did, but we are still at that top. We didn’t know it was a top until things really started to landslide Friday midday. However, remember the bigger picture of a BULL MARKET. We had Silver Miners double in 2 months, other stocks up 80-100% in less than 2 months! If you got a good chunk of that and sell Monday–you have a major win and can deploy those funds again when the time comes and the choppy drop stops. Or you can just ride it out and try to ignore the down days (that can be tough if you positions are still large). It’s your choice from here. I personally would pay attention to ‘Position size’ and try to reduce exposure to selling.
You can sell 25% and ride the rest.
You can sell 1/2 & ride the rest, trying to add lower.
You can lock it in and try to buy back lower too, but overall, this was a major ring of the cash register 🙂 I will discuss these things in the daily reports too.
.
So we have been making great gains in the General Market Bull Run, some have traded the run out of the lows in Oil and Energy Stocks, we traded Crypto stocks when they were hot, MJ Stocks came alive, and with our Precious Metals basket of miners from last years lows and the recent lows (ICLs), the gains came in very strong this time, with many silver miners doubling out of the lows recently. I sold most of my Miners on Friday because I want to hold on to my gains and do some smaller short-term trading, but if you are holding on to your miners and want to hedge, I will cover that briefly below and in the daily reports. I will also have Bitcoin below. Enjoy your weekend and thanks for being here at Chartfreak with me!
.
~ALEX
.
SIDENOTE: They say never short a Bull Market, and I agree since the surprises are to the upside, but I do use these inverse leveraged vehicles for short term trades at obvious times, or ‘hedges’ if I am holding on to some Miners and expect selling into a dcl.
JDST put in a bottom reversal when Miners put in a peak reversal Friday, so that was a buy with a stop under the lows. This could have some follow through when Miners sell down. In a choppy market, however, this may not do as well as expected, but it can help to hedge the selling in Miners if you are still holding your basket of miners.
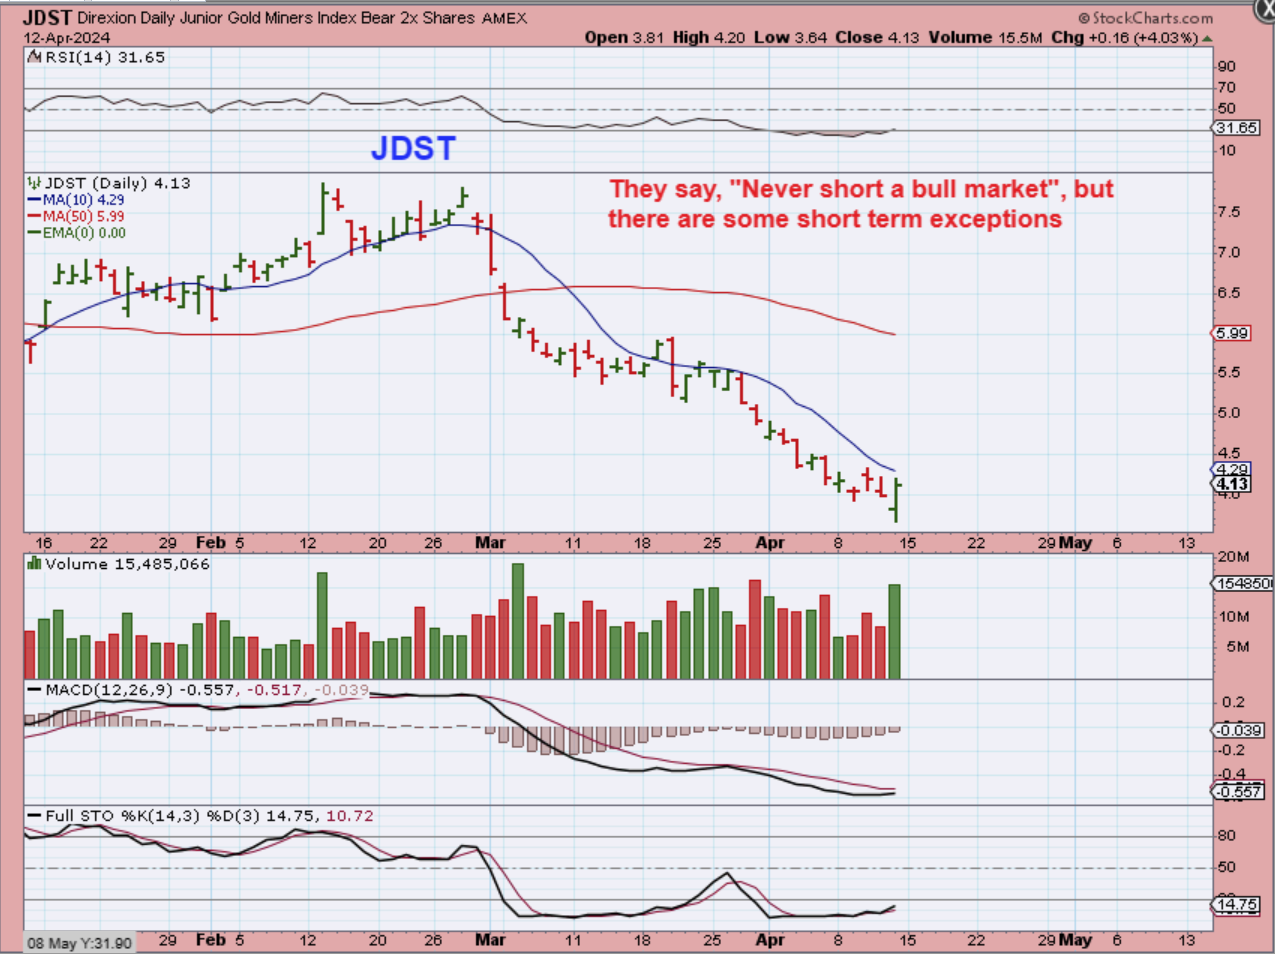
.
You can just buy and hold JDST for a couple of days at a time after GDX bounces, or some day traders may day trade it at times, especially in choppy times, but holding for long periods of time (Weeks) is not recommended. By hedging your miners with JDST, DUST, etc. you can neutralize some of the selling if you are still holding on to a small basket of miners.
.
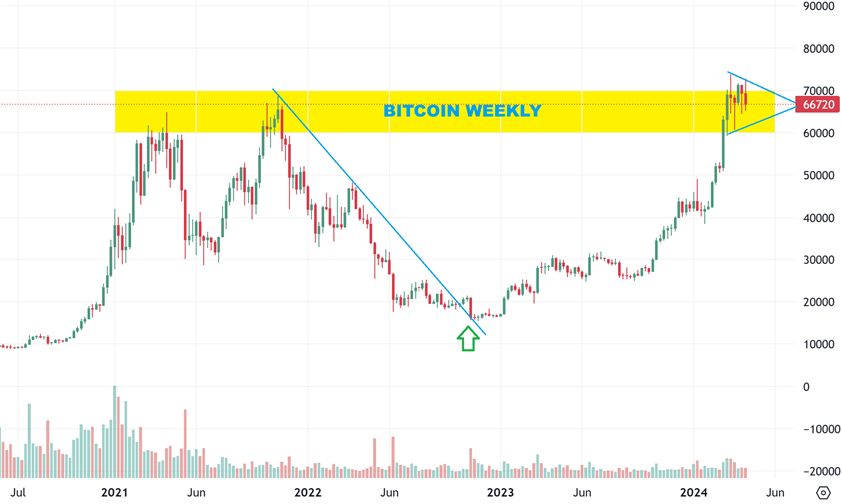
BITCOIN – I have been discussing this consolidation as a possible triangle, and we use 30 day dips and 60 day dips to help us with our ‘timing’ and buy entries, when the time is right. Day 27 here is obvious just an idea or a guess, and not a prediction, but we could see a low develop and then maybe a breakout. That said…
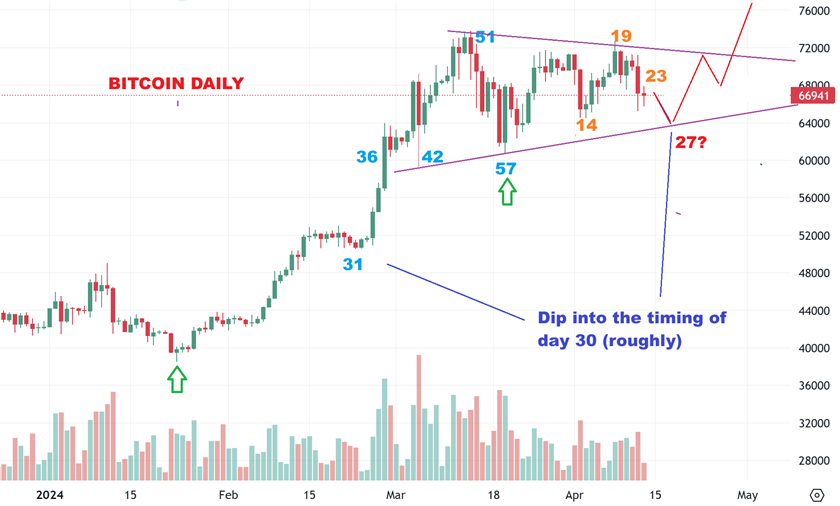
BITCOIN on April 2nd:
I also wanted to point out that this triangle could simply become a longer consolidation, similar to what we saw with the long consolidations at the Red Down arrows on this chart. That means that the entire 60 day daily cycle could be a sideways choppy consolidation, as shown here and not a triangle breakout. We have to wait and see, but the reason that I pointed that longer consolidation out was also due to the weekly chart…
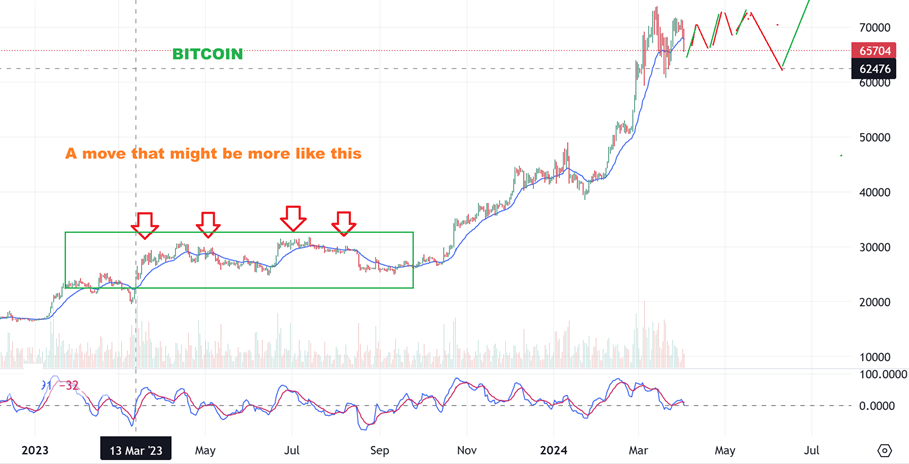
BITCOIN WEEKLY– You can see Bitcoin working around the prior highs and that is often resistance to a breakout, so we could easily see a longer consolidation here, rather than a shorter triangle breakout. This kind of looks like it does need more time, right? Either case is valid, so we’ll just continue to watch for signs on a day to day basis. The Crypto-related Miners like MARA, RIOT, WULF, CLSK, CIFR, etc are also not showing any upside strength yet, so that will be another clue that I’ll be watching for over time.