Friday April 5th – Even Bulls Need Their Rest
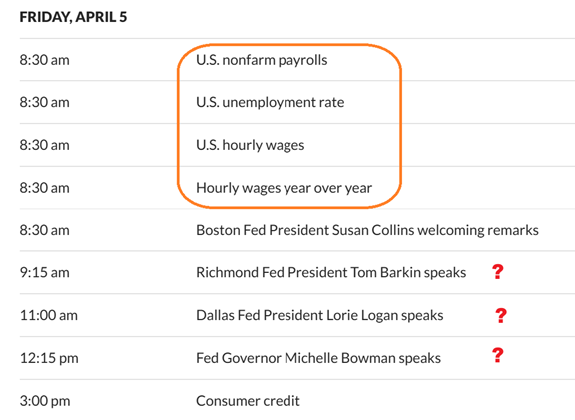
DATA – Yesterdays Jobless Claims moved the markets. We saw a large gap open higher, however we also saw a 2 p.m. sell off that looked very real, so todays 8:30 a.m. data could cause more selling. Yes, Our General Market Bulls may be ready to take a rest and the charts will help us to see why I say that…
.
Our General Market Bulls may be ready to take a rest…
.
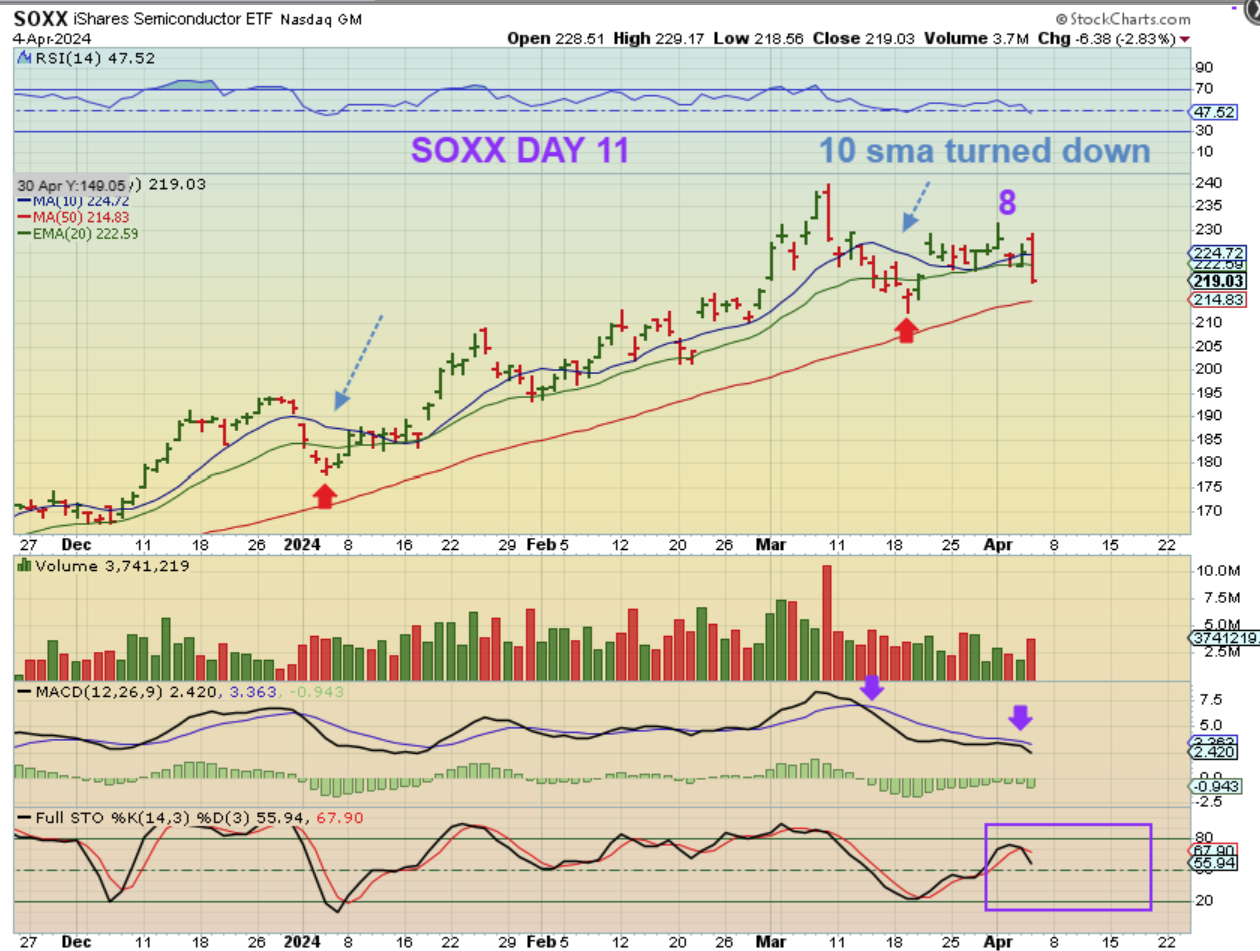
I used the SOXX to identify a dcl. It was late in the daily cycle and this dip into the March 19th lows looks like a dcl. Now look at the last candle from yesterday. We gapped open higher and then suddenly sold off in the final 2 hrs, so there is a chance that the markets have ‘peaked’, and the SOXX & Biotech were leading the way. LOOK AT THE MACD.
.
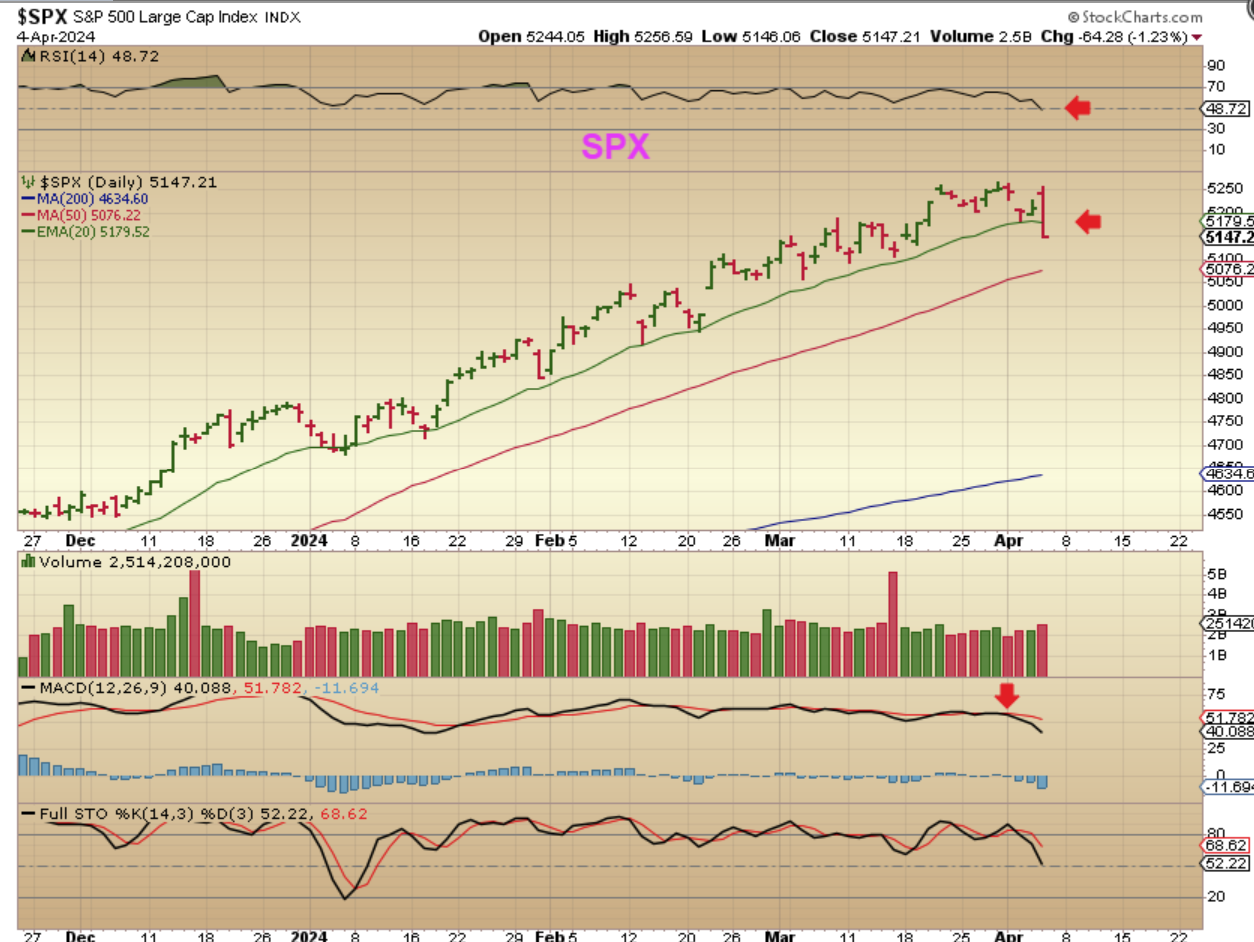
THE SPX didn’t ‘peak’ until a few days ago. The dcl is hardly noticeable here, so some may wonder if THIS is just the real dip into a dcl, but I think that we saw the DCL clearly with the SOXX, Dow Jines, and Biotech. If you think that THIS may be the drop into a dcl, then just let it play out, but the SOXX (semiconductors above) are showing real weakness in that MACD now..
.
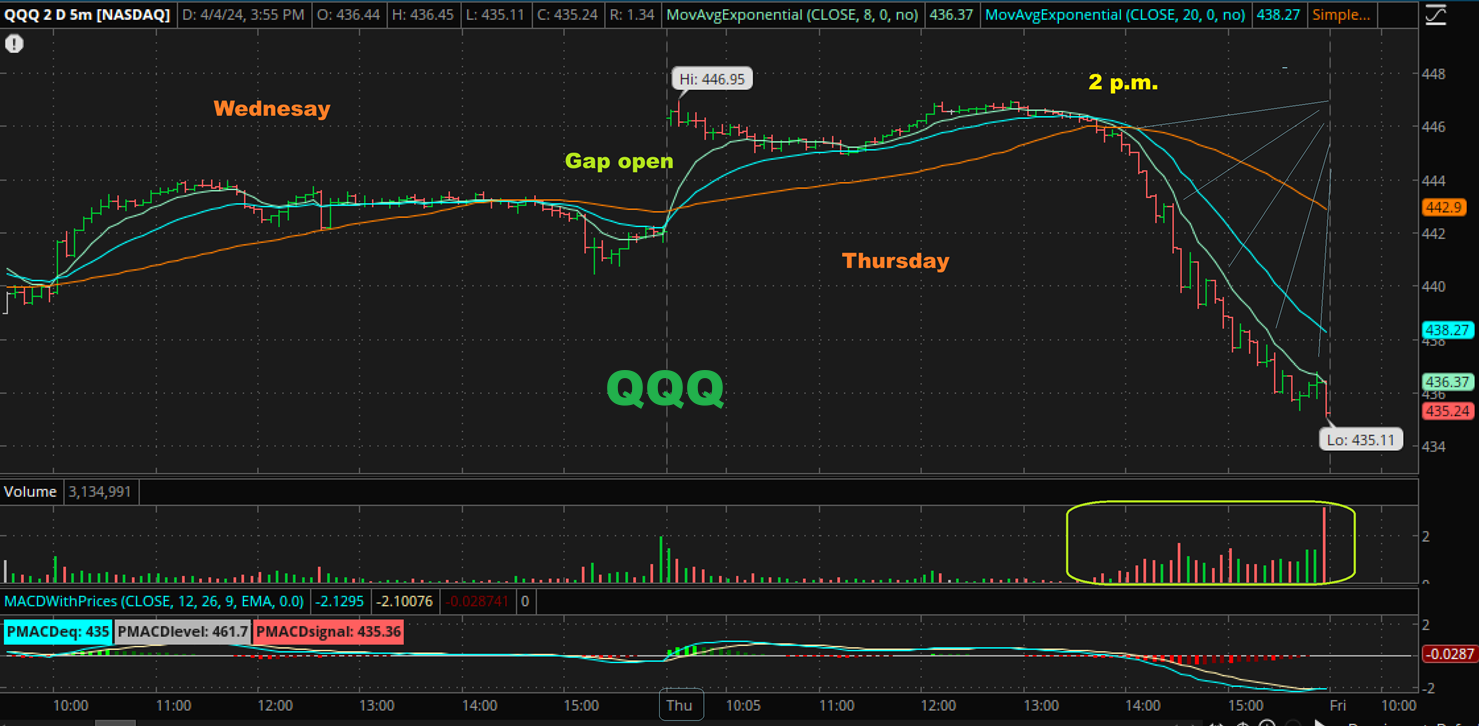
I just wanted to show you how things actually looked quite bullish yesterday after the jobless claims report. I’ll use the QQQ (Nasdaq).
.
QQQ INTRADAY –
1. You can see that the markets gapped open higher with the Jobless Claims.
2. It then did a slight gap fill attempt, rallied again, but …
3. At 2 p.m. things not only started to weaken and break down, but it looked more like a relentless market flush. Buyers (bulls) completely lost control.
.
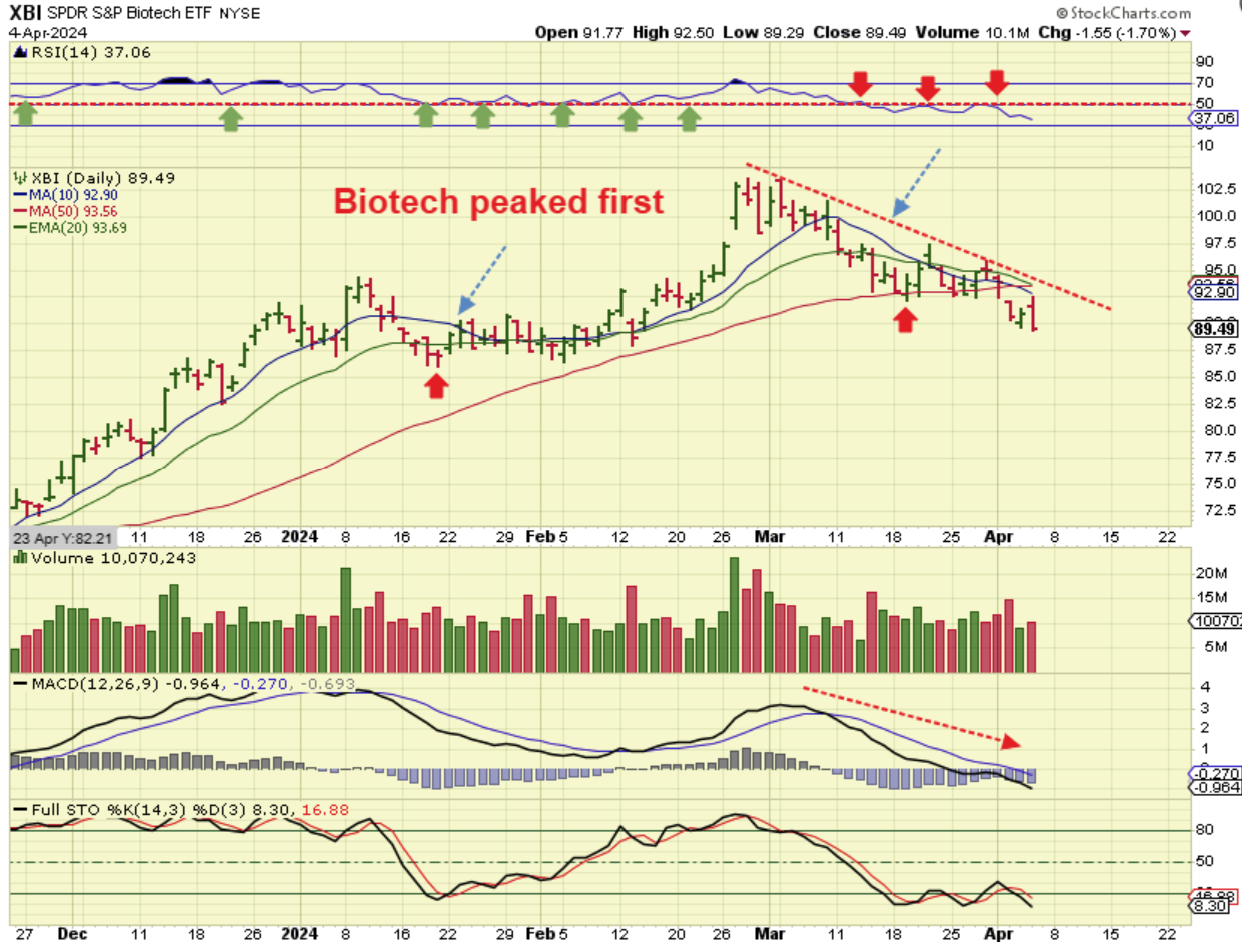
And I also want to show you what many of us already were seeing and that is that the LABU trade was not showing strength anymore.
.
THE XBI peaked at the end of February. It fell into that dcl with the SOXX, but it could not even bounce out of that low and it recently sold off under the 50sma. Look at the Biotech RSI. All of those green arrows are the bullish time period, but once it lost the RSI 50, it remained weak. Now look at this MACD.
.
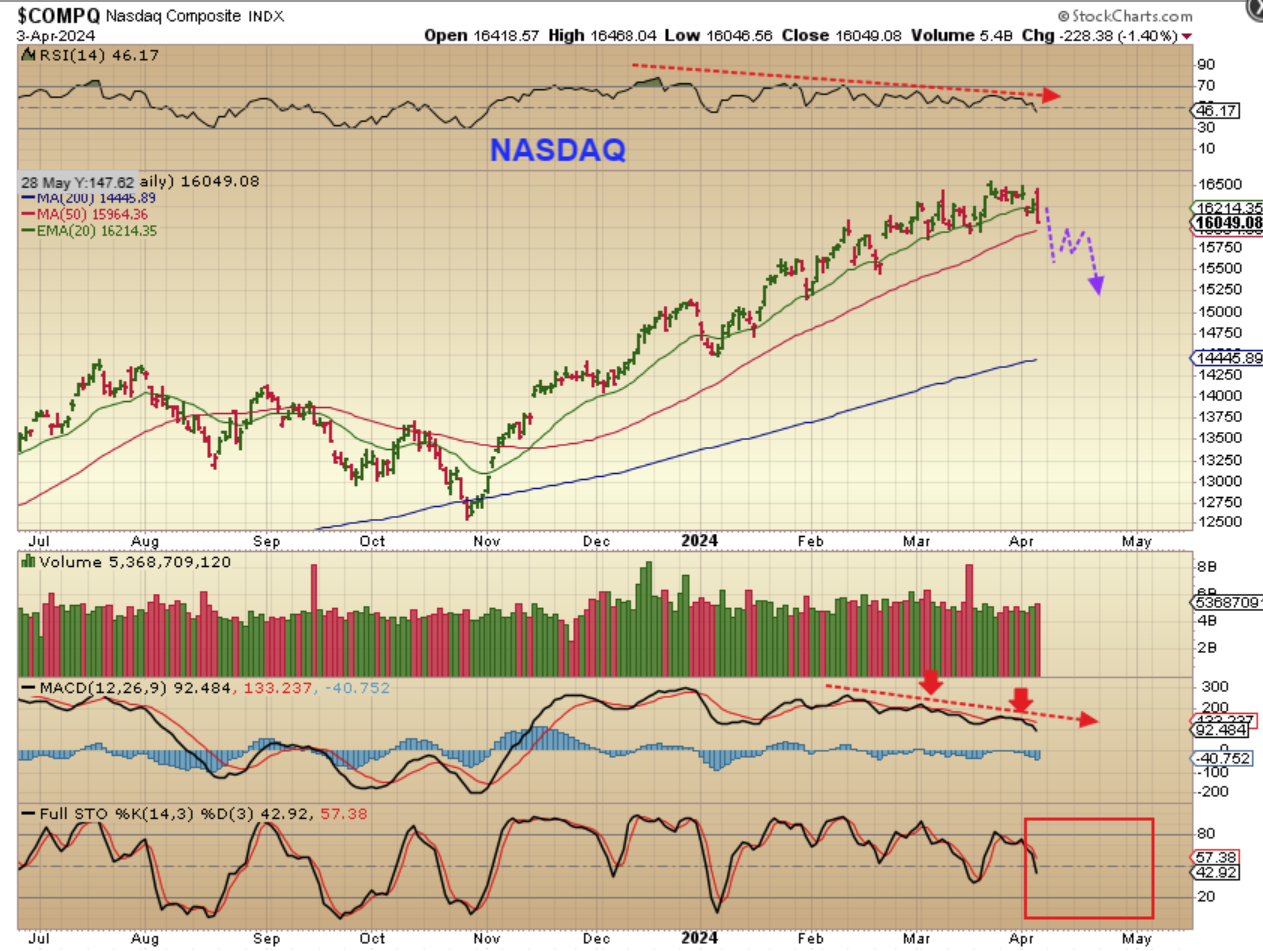
THE NASDAQ – So from my analysis using several different charts related to the General Markets, I would have to say that all signs point to a deeper sell off coming up. This Bull is about to take a rest.
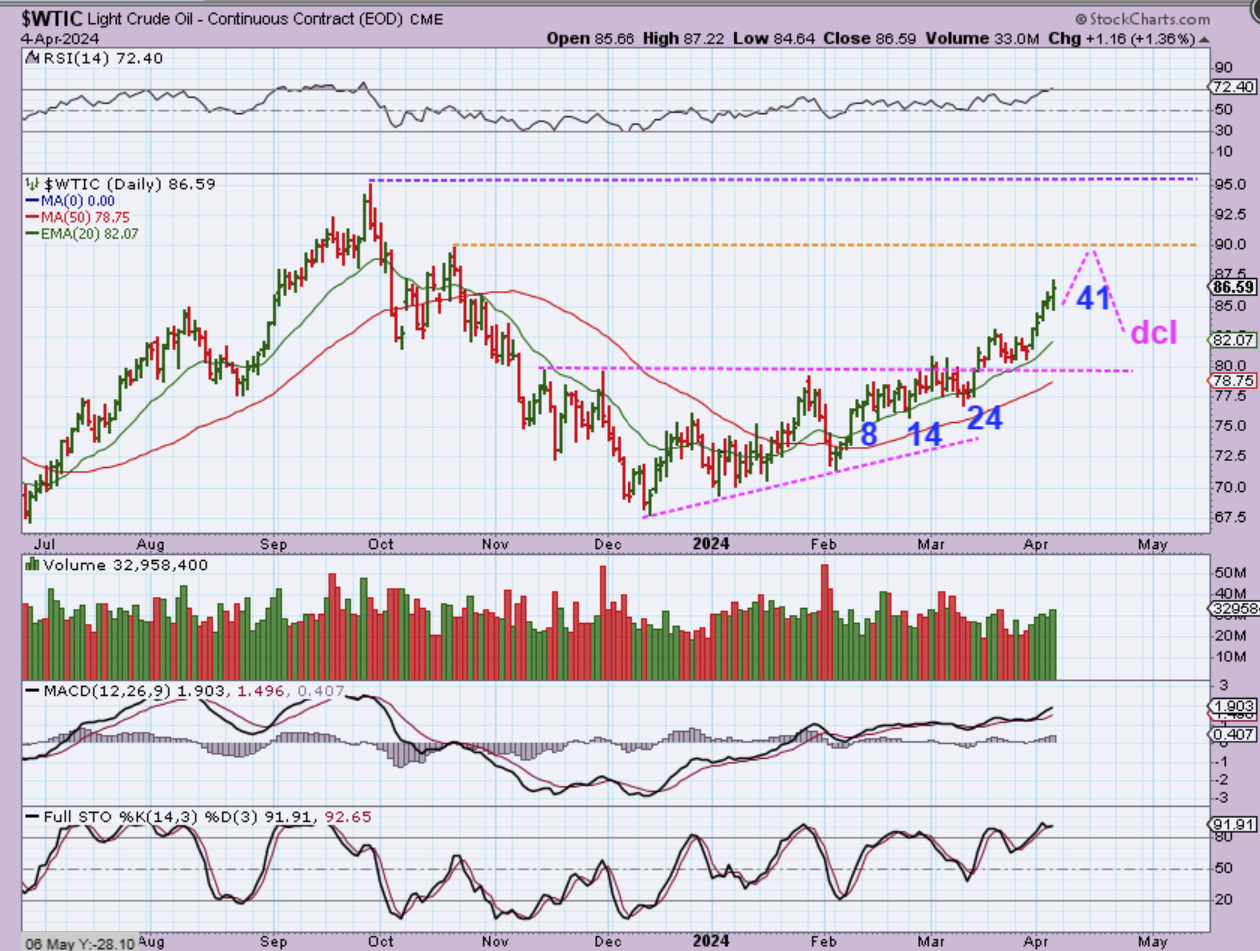
WTIC – Oil is chugging along and I had this target draw a while ago. So far we still have time to get to $90 and then drop into a dcl. The ‘Time’ is arriving for that dip to start soon.
.
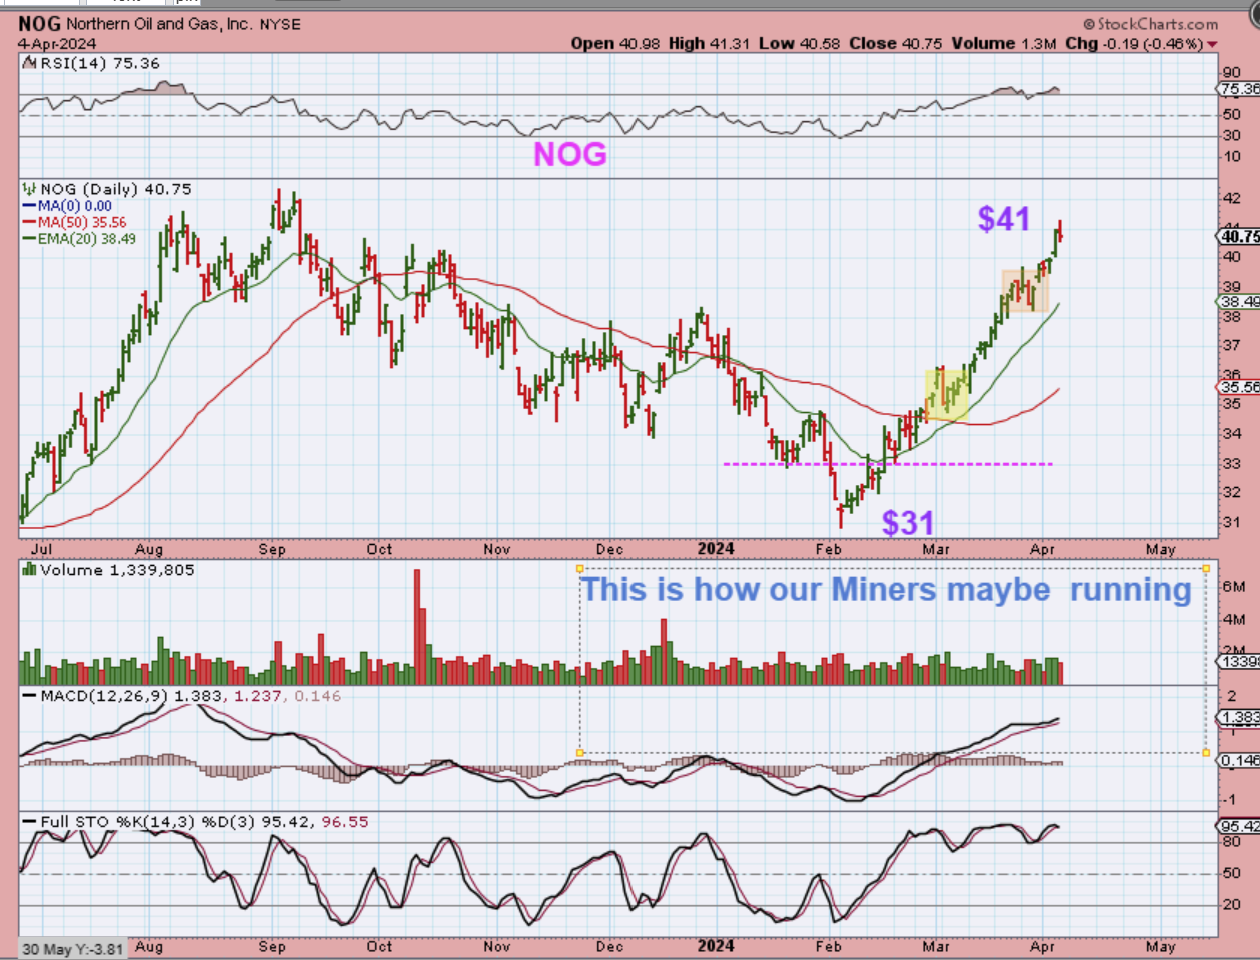
I wanted to show you NOG for 2 reasons: 1. This is one that I mentioned as a buy along with APA, OKE, ERF, MRO, VLO, etc. They are running well, but also…
2. We have our Gold & Silver Miners running strong now too. I will use this chart later in the report to discuss the current run.
..
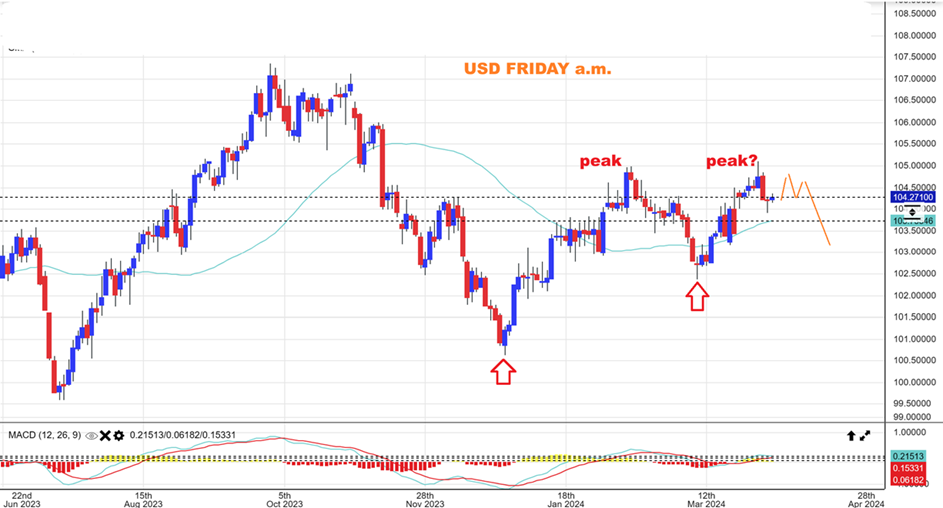
THE USD ran up and out of a low recently and then dropped suddenly this week. It is hard to say if it has peaked or not, but it is day 19 and that is late enough for the USD to start seeking out a dcl. I have drawn that possibility here. One thing that I’d like you to notice is that Gold has been running straight up for the past 7 days, so that would overlap with the USD rising up at the same time. They ran higher together. Let’s look at Gold.
.
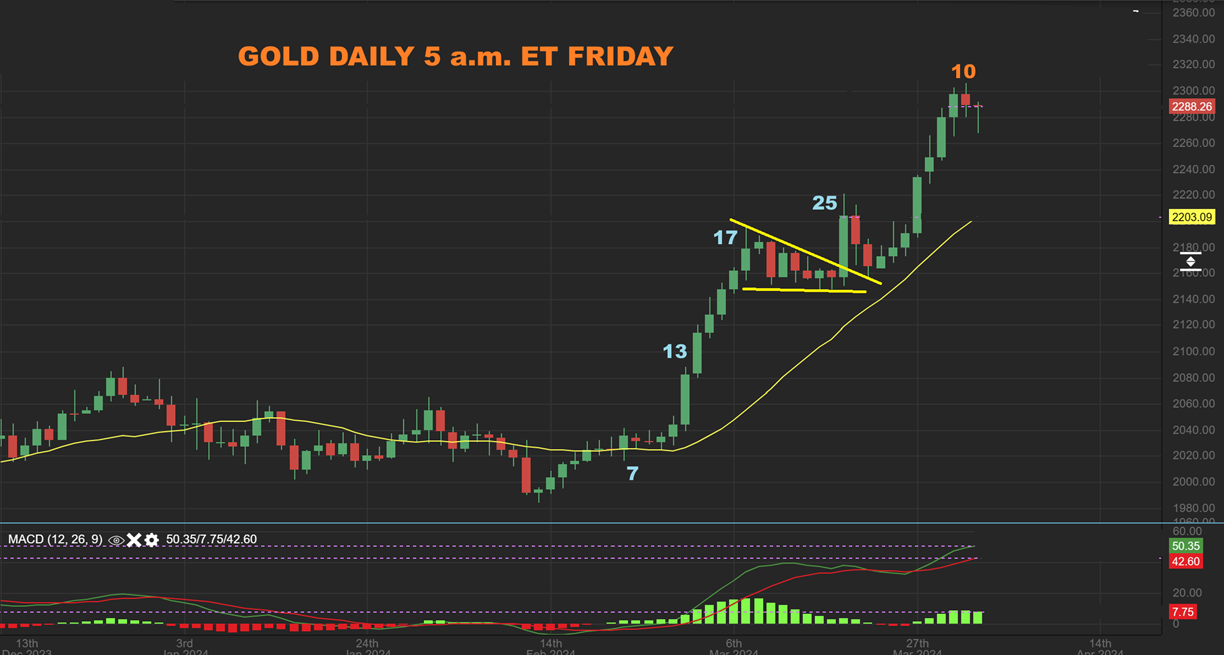
GOLD has a reversal candle as of 5 a.m., but that can change. What we have here is a strong bull run with a midpoint pennant. With this strength, Gold can keep running or it also may ‘pause’ and give us another mini pennant as a 1/2 cycle low/dip. Gold remains bullish.
.
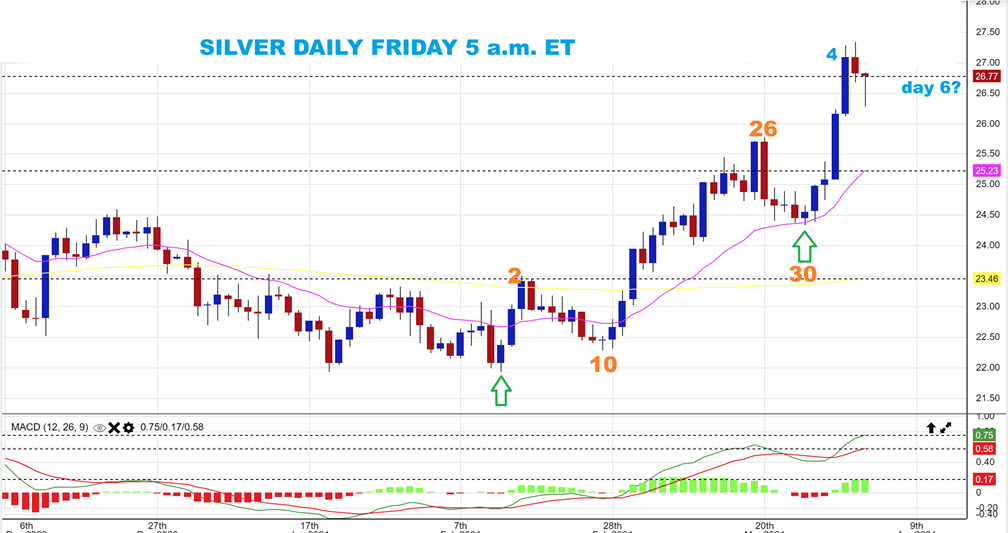
Notice that SILVER has a slightly different count than Gold. That is because it continued to drop to new lows into day 30, even after Gold back-tested the pennant and started to run higher. So Silver has a strong 4 day run and a ‘pause’ as of Thursday and this morning (so far). Silver remains bullish too.
.
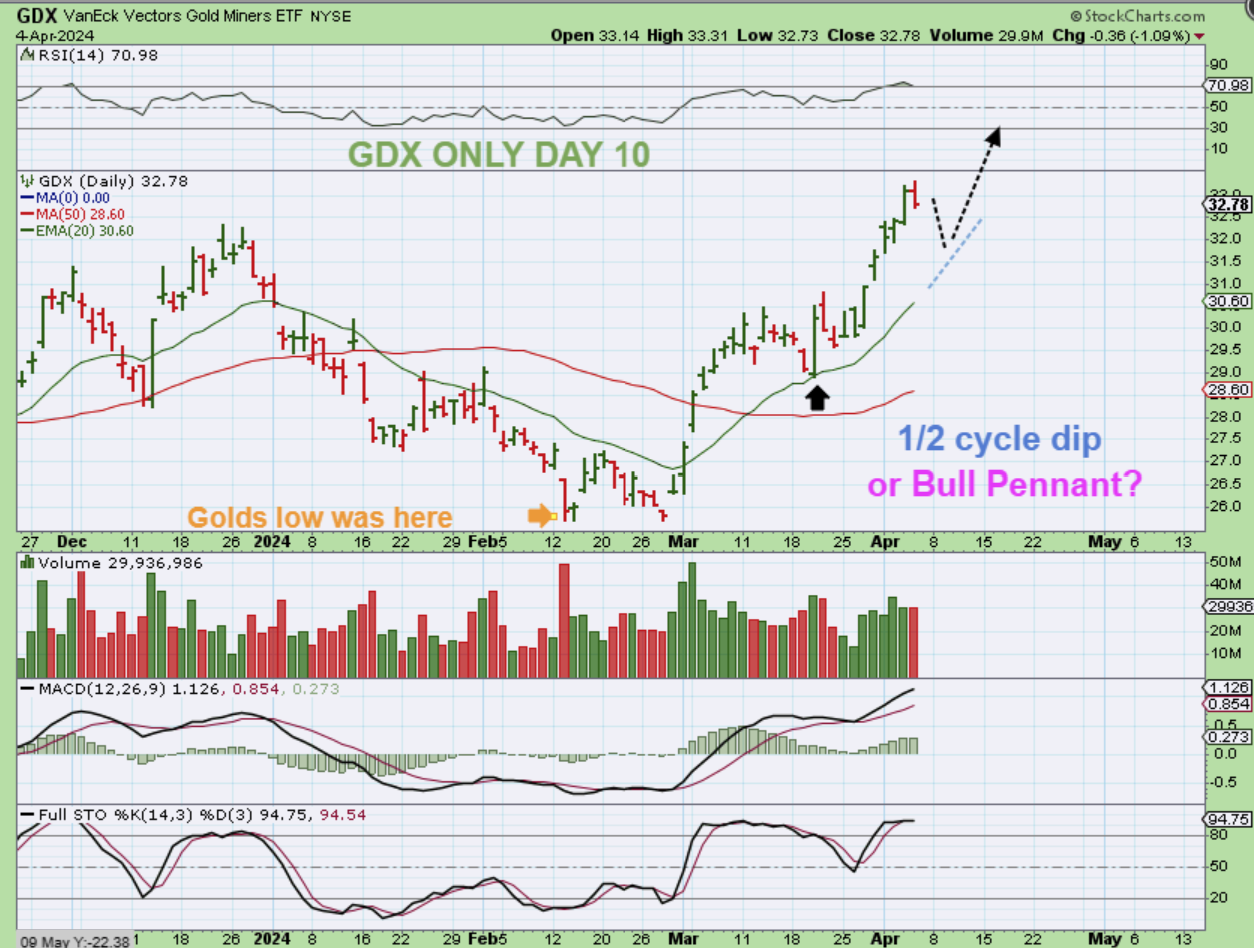
I’m going to draw up the possibility of a normal pause or 1/2 cycle low with the GDX, but just remember that in a Bull Market, surprises are to the upside. Anything that starts to look like a dip can quickly get erased when buyers step in.
.
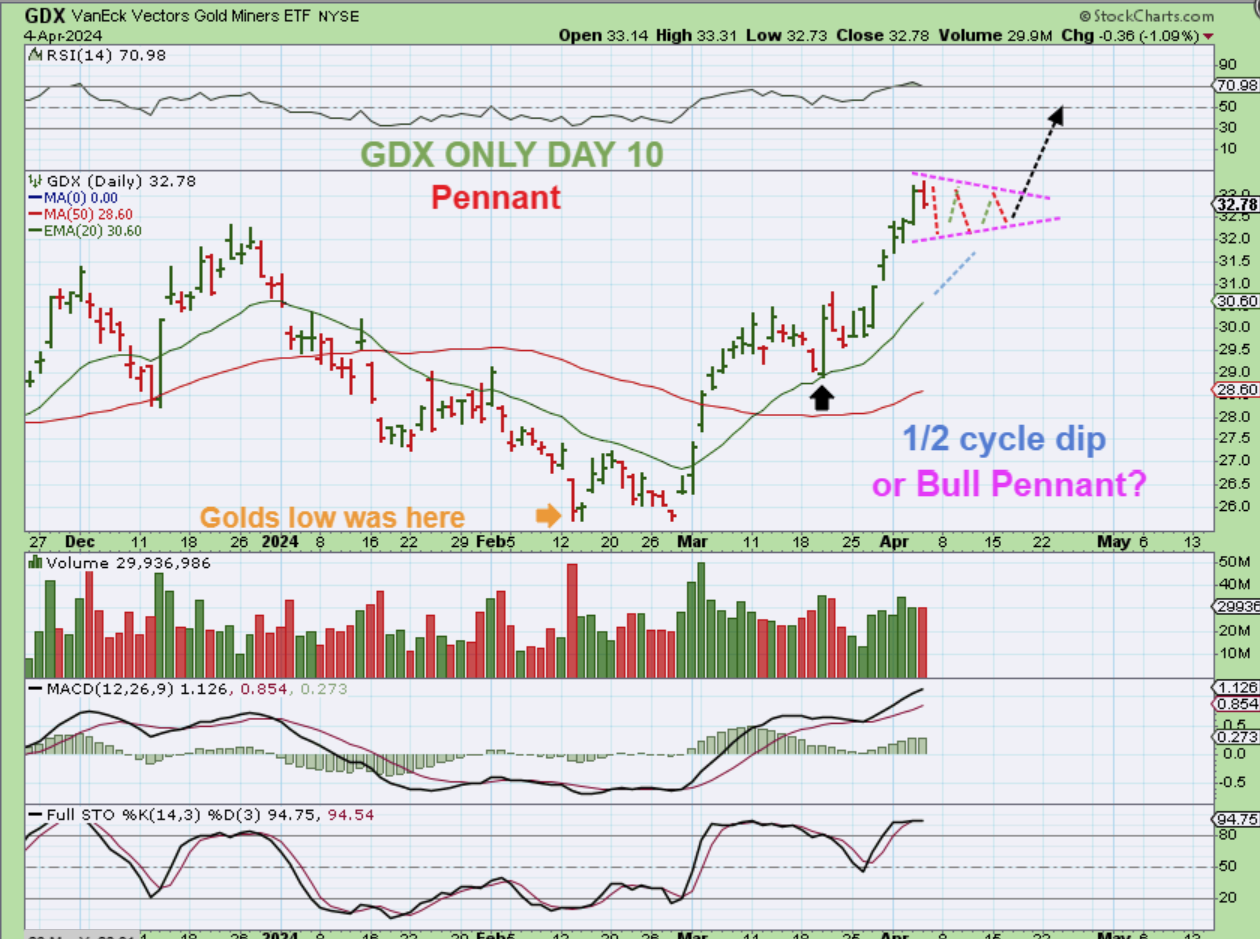
So here we have GDX and using the count from the Gold reversal, GDX would be on day 10. That IS time where we might see a ‘pause’ or dip into a half cycle low.so I simply drew in a small dip and then we’d continue higher. Also…
.
We could see a small pennant form as price worked over to the 20 ema, and this MIGHT only happen if the USD bounces. I just want us to be mentally prepared for a pause, but it may or may not happen. Why?…
.
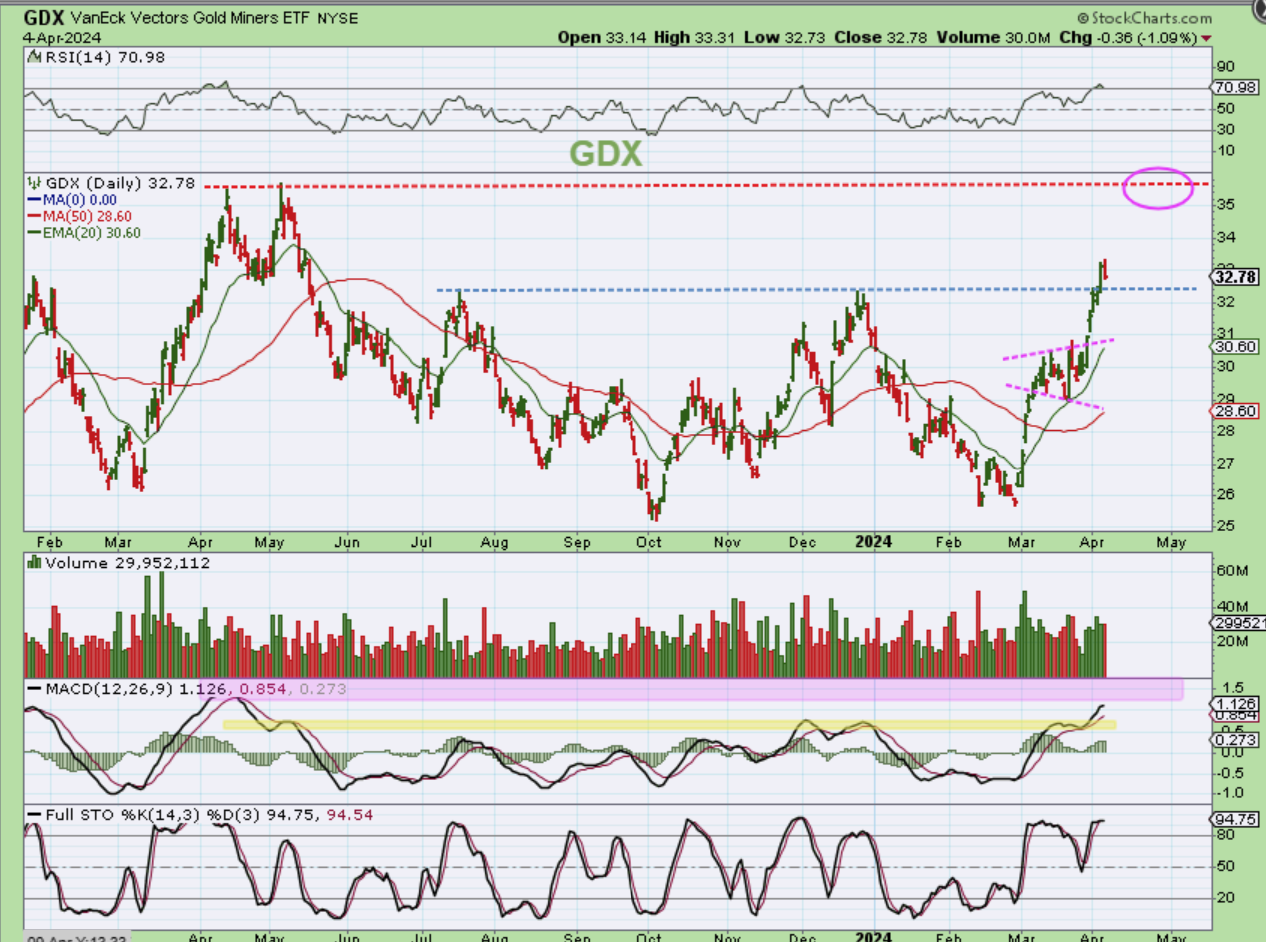
The GDX ETF broke above the target price and may just continue on to the next target, especially since this is only day 10 or so of the second daily cycle. I will continue to say this:…
.
I will continue to say this:
.
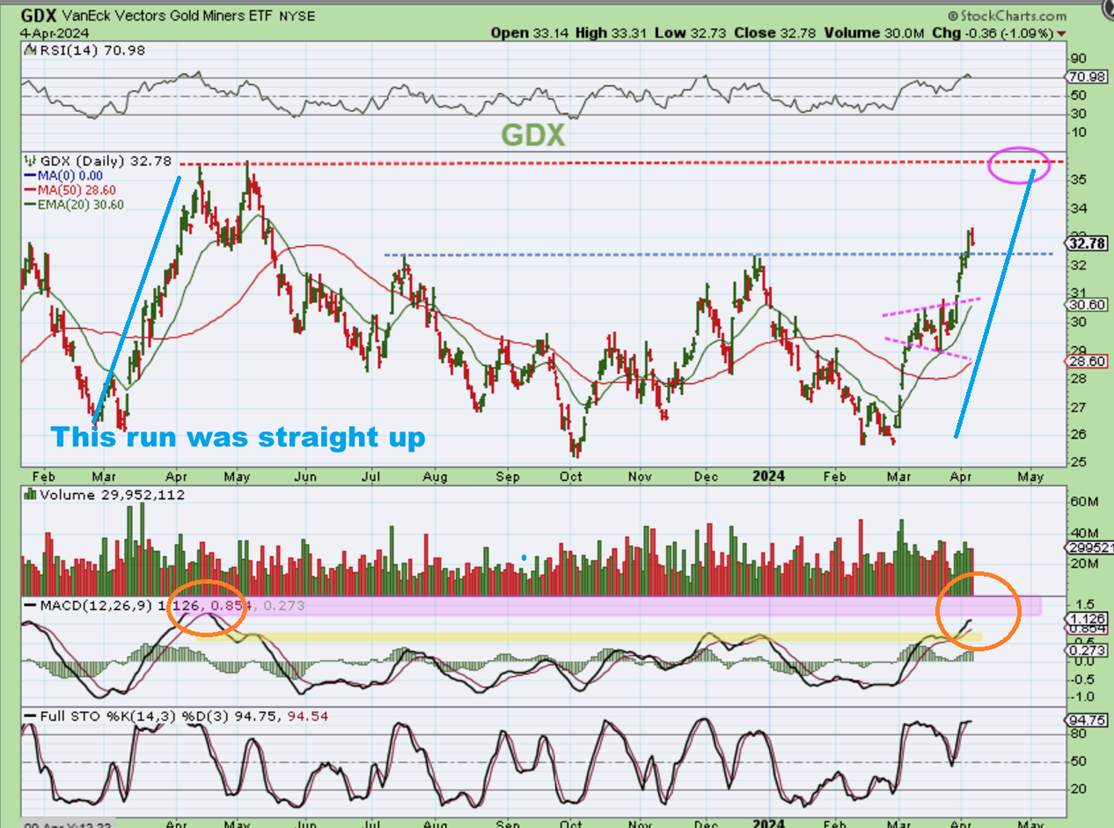
Take a look back at that March 2023 run and we saw the GDX ETF run from the same lows and it was a straight up run. Anyone that sold during that run to ‘buy a dip later’ was not able to get back in. We could just do a running correction and keep going.
.
NOG LIKE OUR MINERS? We also may see our Miners run in a similar way that NOG has been running. I see small pauses along the way, so I highlighted 2 of them, but those drops were erased quickly. This just highlights that even though I’ve discussed a possible half cycle dip, I would say that you still want to at least hold a basket of miners, and any pause or dip along the way should be erased over time.
.
So the Bulls are still running, but I am now starting to see more and more evidence that the General Markets are starting to weaken. We may get choppy topping price action, but I think that a rally to new highs is not in the near future. Oil and The Precious Metals Sectors do still look bullish and Gold , Silver, and the Miners are only early is the 2nd daily cycle, so that allows more time for upside. Enjoy your Friday trading.
.
~ALEX
.
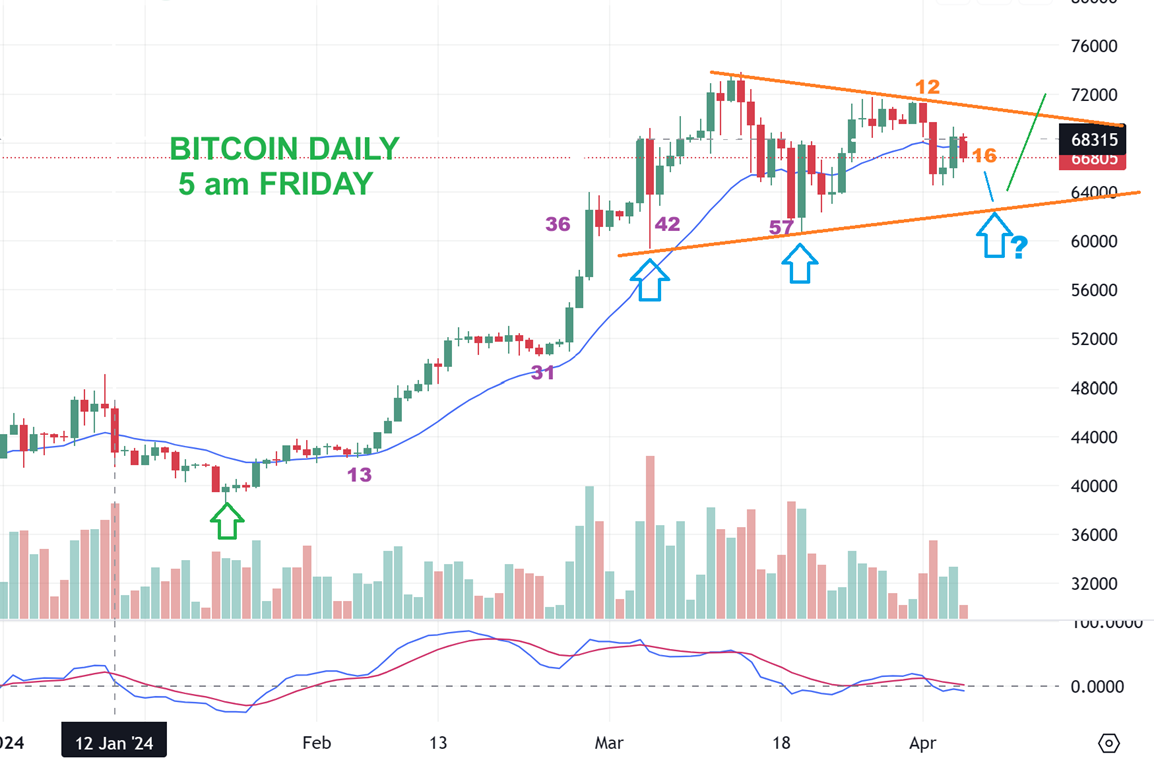
As mentioned before, BITCOIN may be forming a large triangle consolidation.
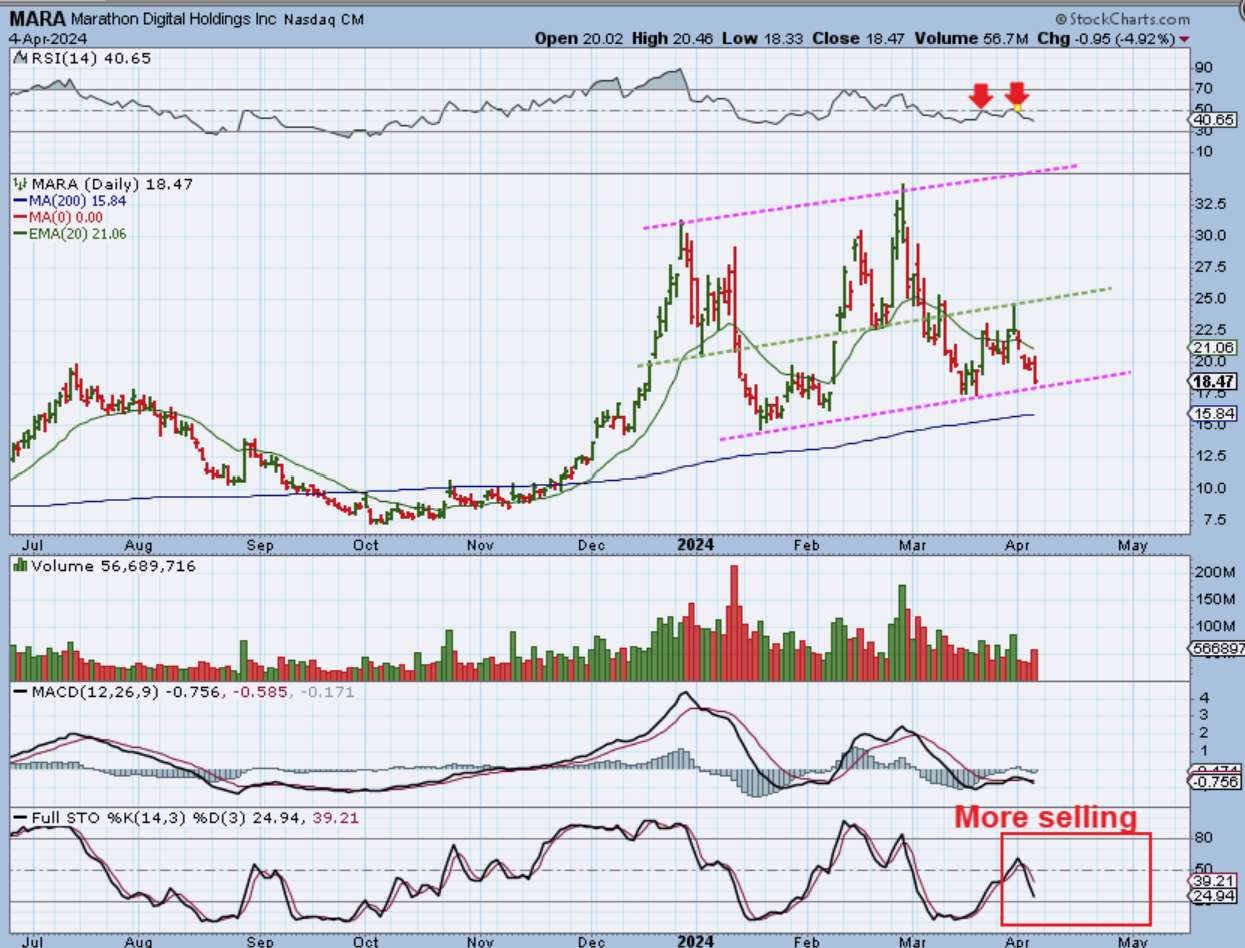
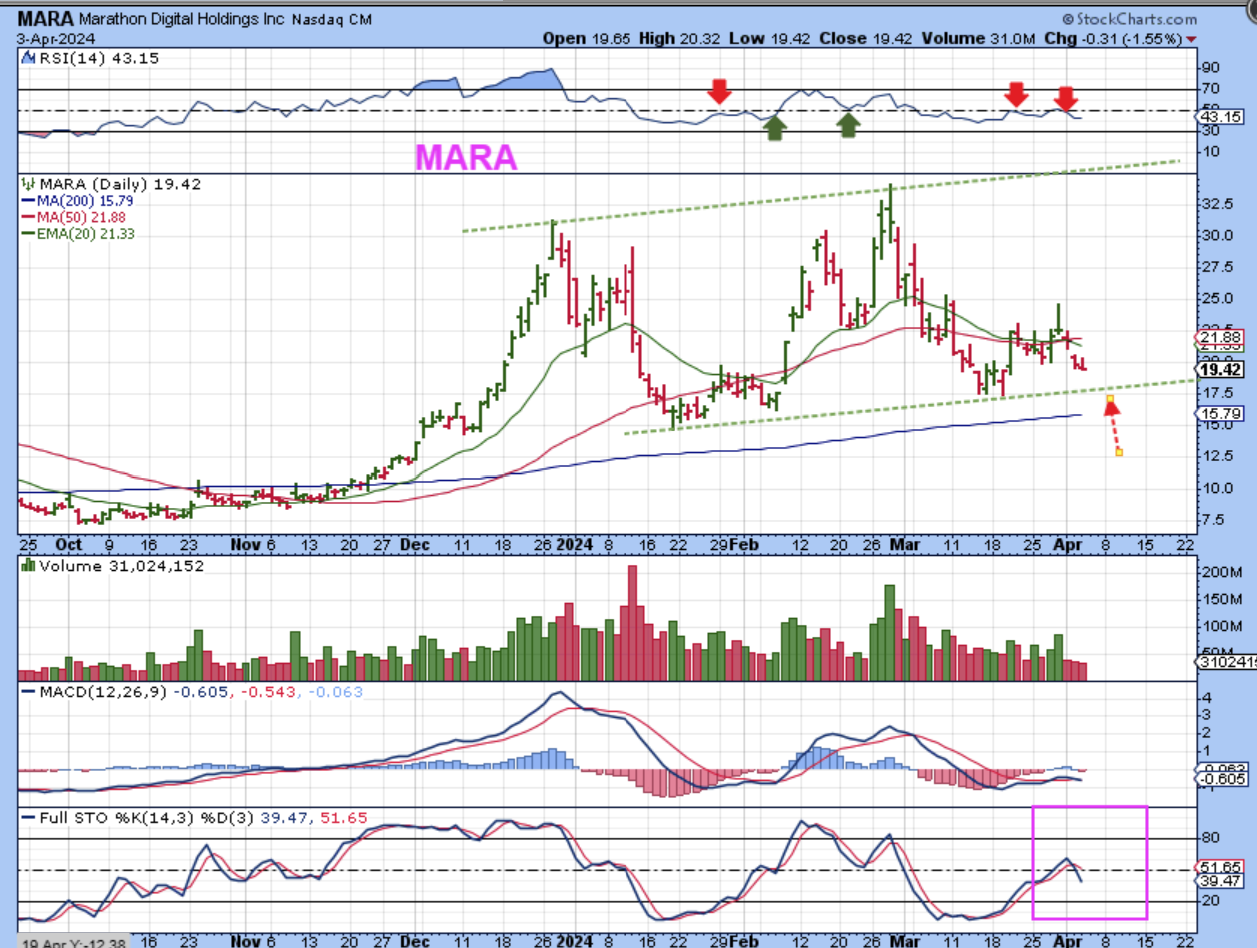
I discussed yesterday that MARA, RIOT, CLSK, CIFR, WULF, etc are not looking ready for the next run yet. If they do run again, they run FAST, and we want to catch it. January to February saw MARA run from $15 to $33 for example. MARA could drop down to the $17-$18 area.
.
MARA dropped yesterday while Bitcoin was green, and the stochastics actually makes it look like it may fall to the 200sma. I tried a trade in HUT, because it had reversed at the 20ema, and it popped higher and sold off quickly. They just don’t seem ready yet.