Tuesday March 26th – Still Looking Great
DATA – The data that is being released today does not appear to be a big market mover.
.
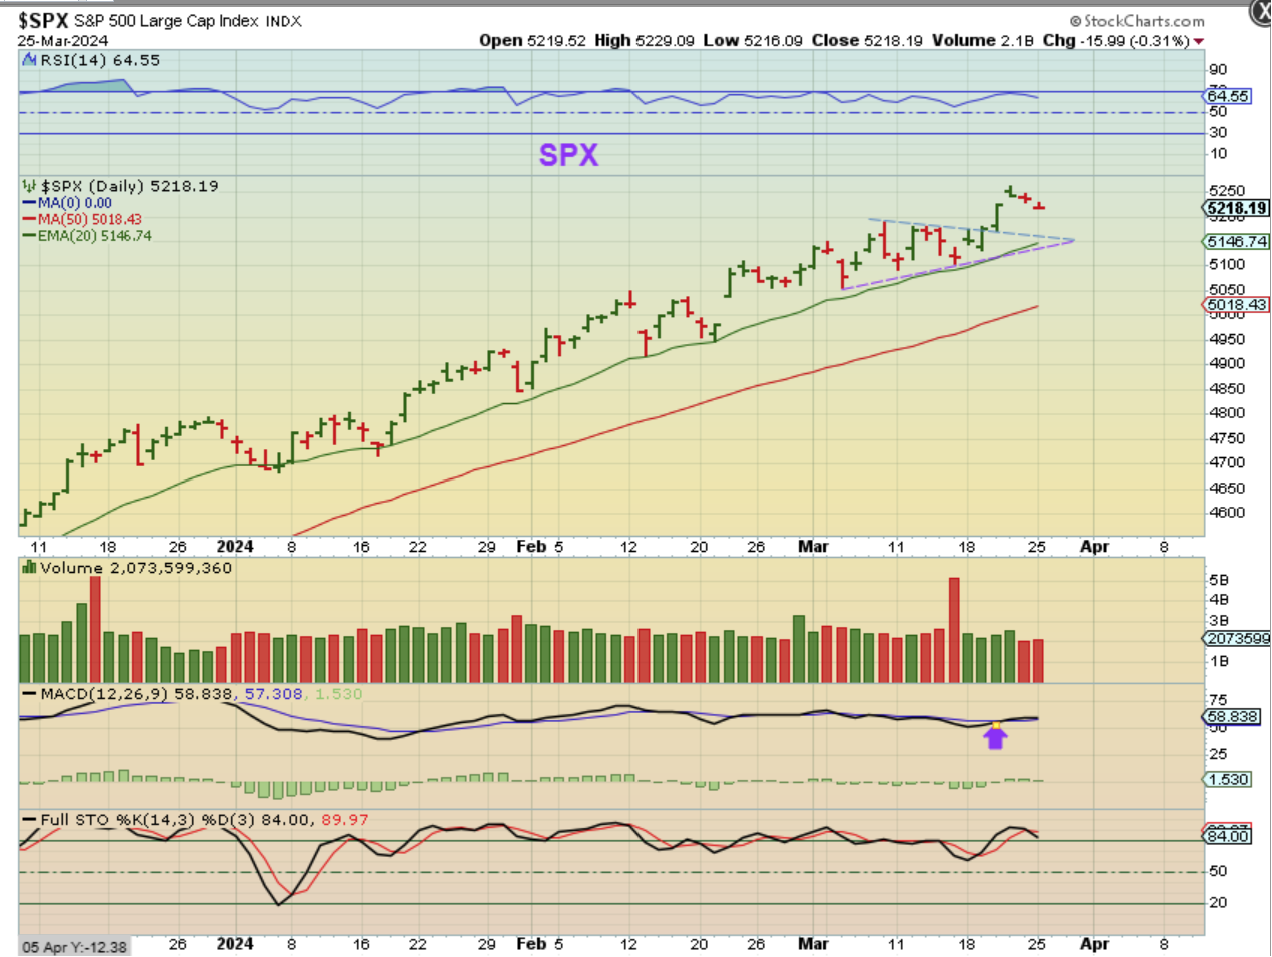
THE SPX – On Monday we saw the markets drift a little lower. I have mentioned that when I look at…
.
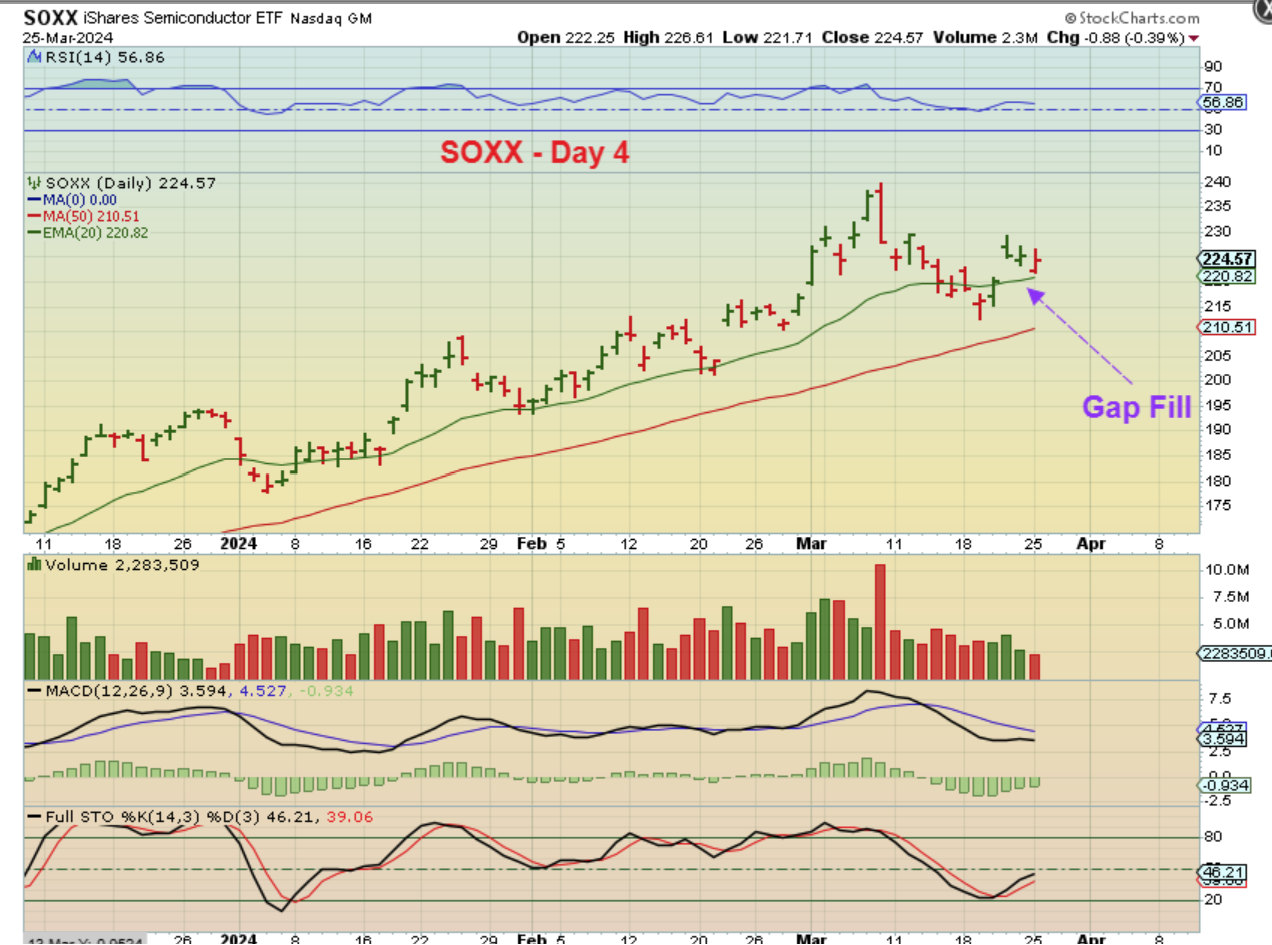
SOXX DAY 4 – I have mentioned that when I look at The Dow or SOXX charts, it looks as though we have a dcl in place and that we have now started the 3rd daily cycle. Yesterdays dip looks to be a gap fill to the 20 ema, so far.
.
We want to keep in mind that these markets have been VERY strong, but they could ‘peak’ sometime within the 3rd daily cycle. That peak could come later with a spike-like peak, or things may start becoming a bit choppy as it begins to form a top. Only time will tell…
.
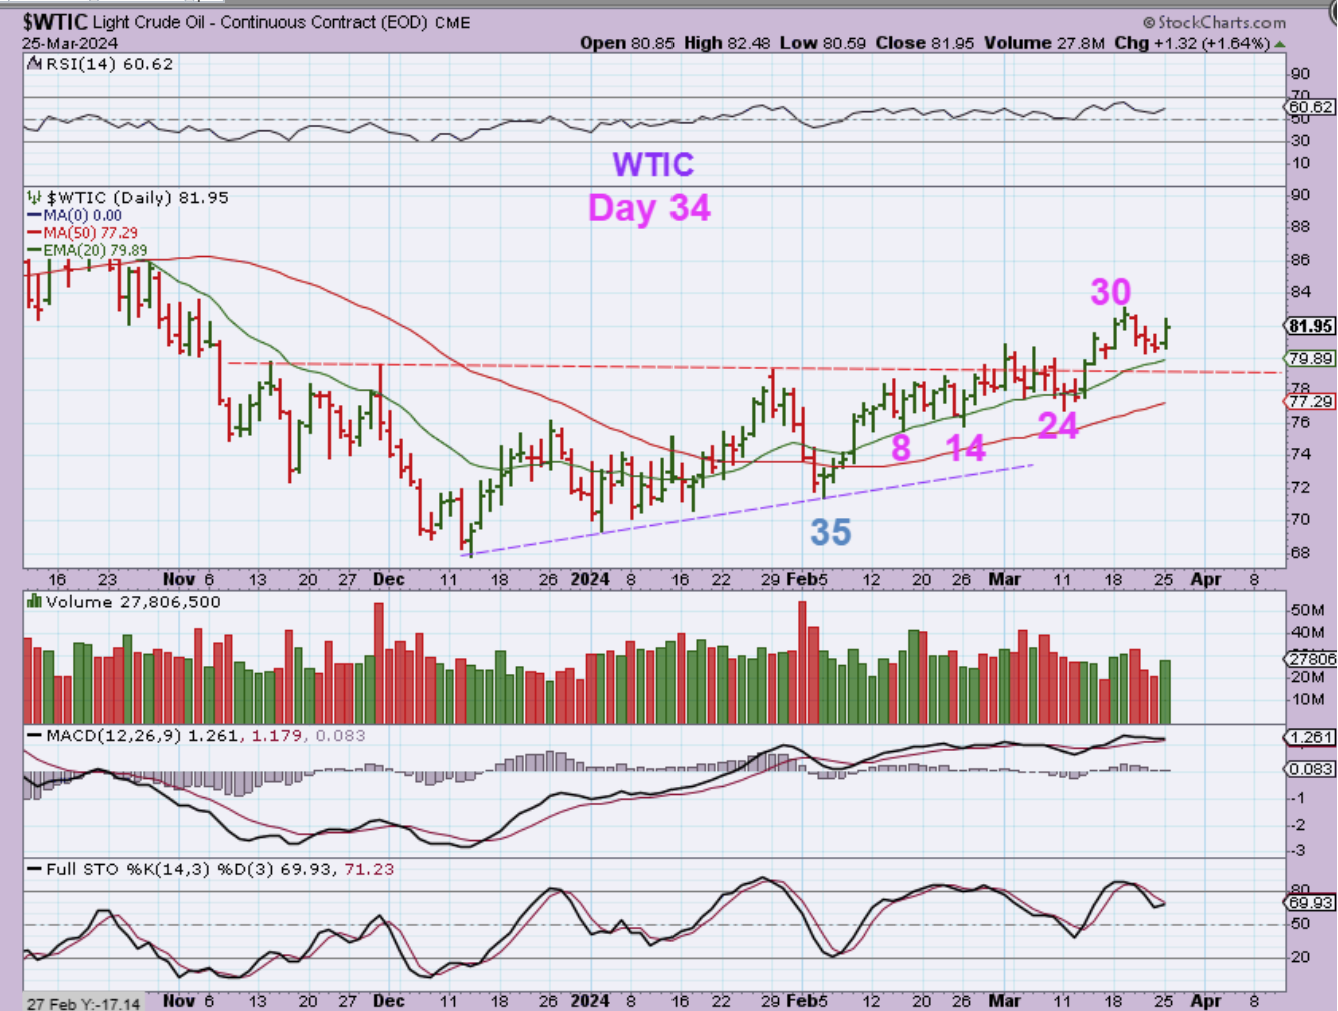
WTIC – Oil has a peak on day 30 a this point, and that would make this a r.t. daily cycle, but it also reversed higher on Monday, so it may put in a peak after day 34 too. Oil is bullish, but it has been a bit more of a choppy sideways move higher, and not a strong ramp up higher.
.
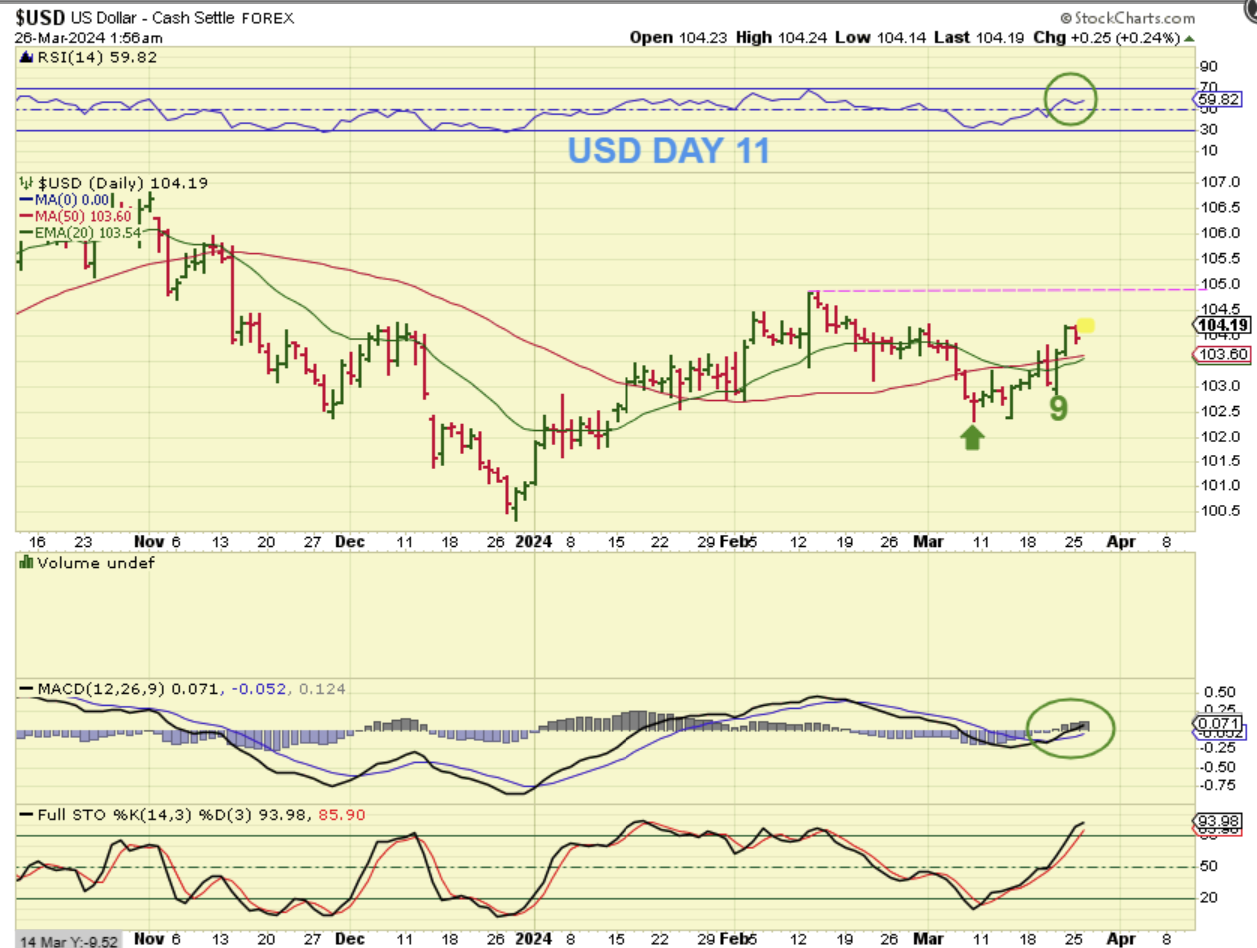
THE USD broke out above the 50sma on Thursday and Friday, and it dropped back lower on Monday. It may do a back test. I am hoping that it becomes choppy and doesn’t break the prior highs (magenta line) near 105 again.
.
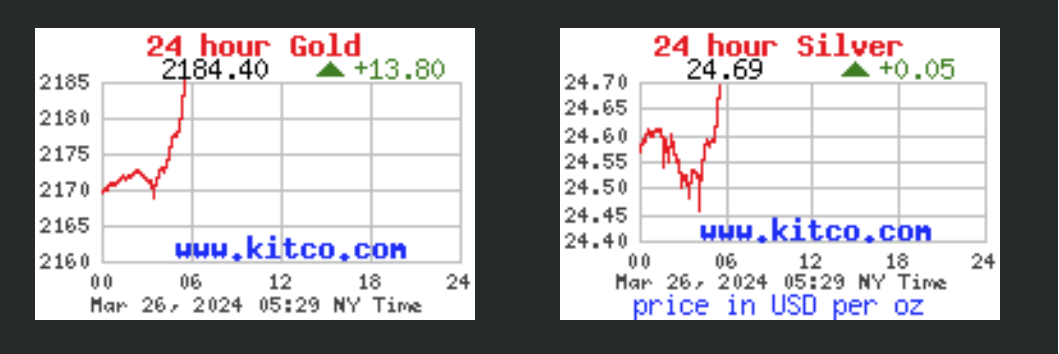
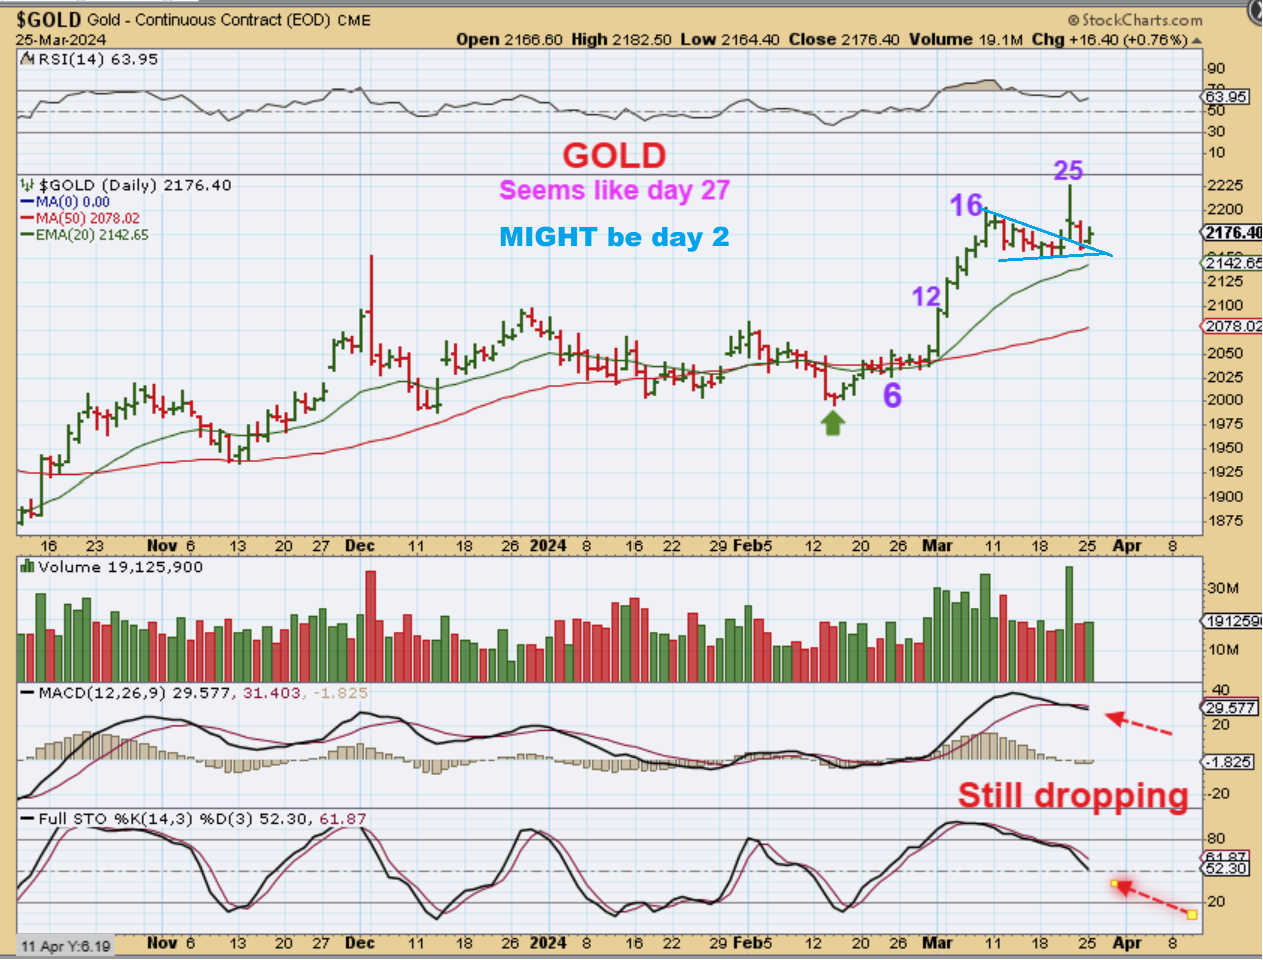
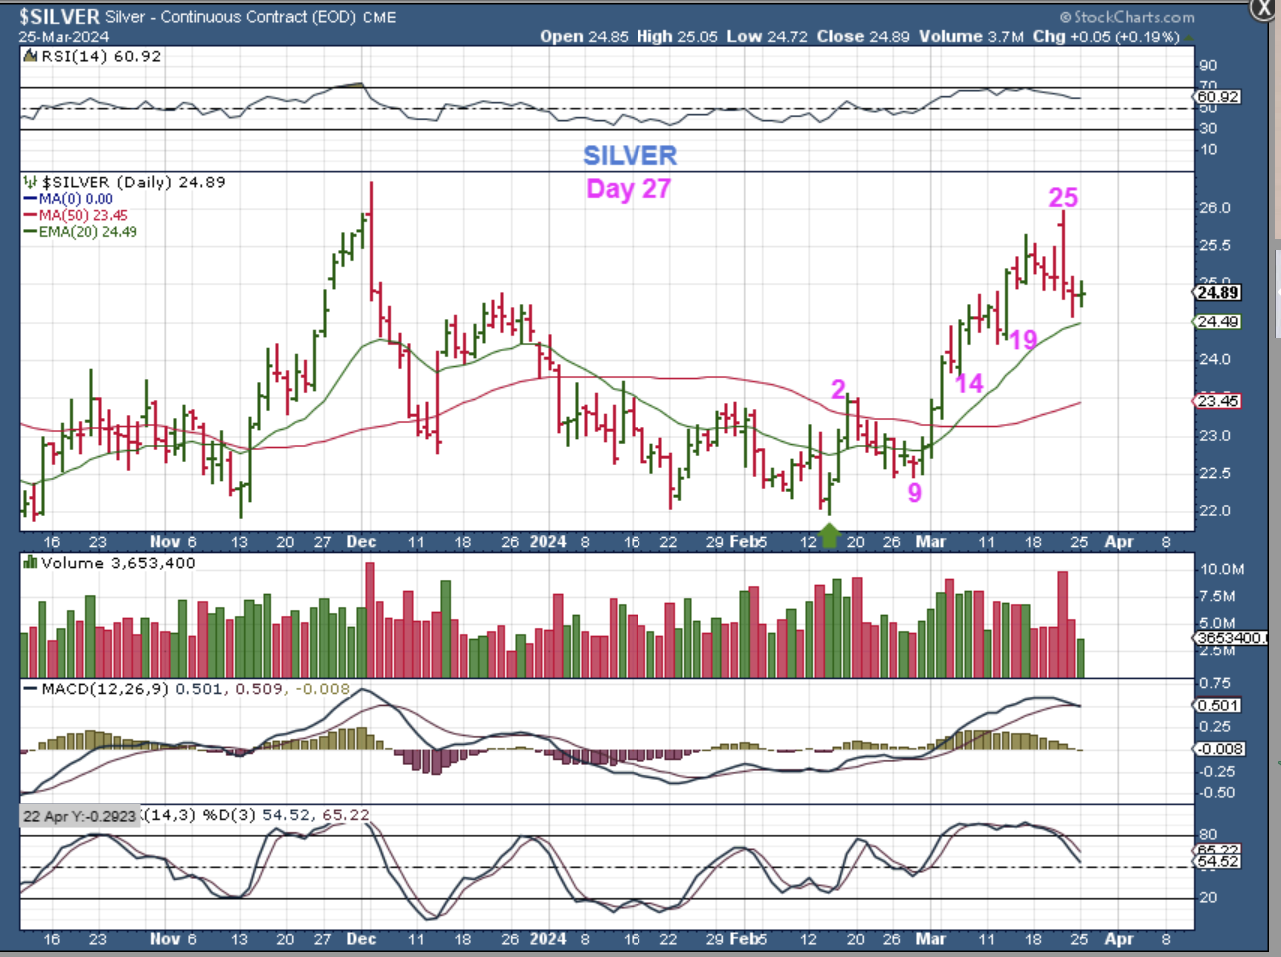
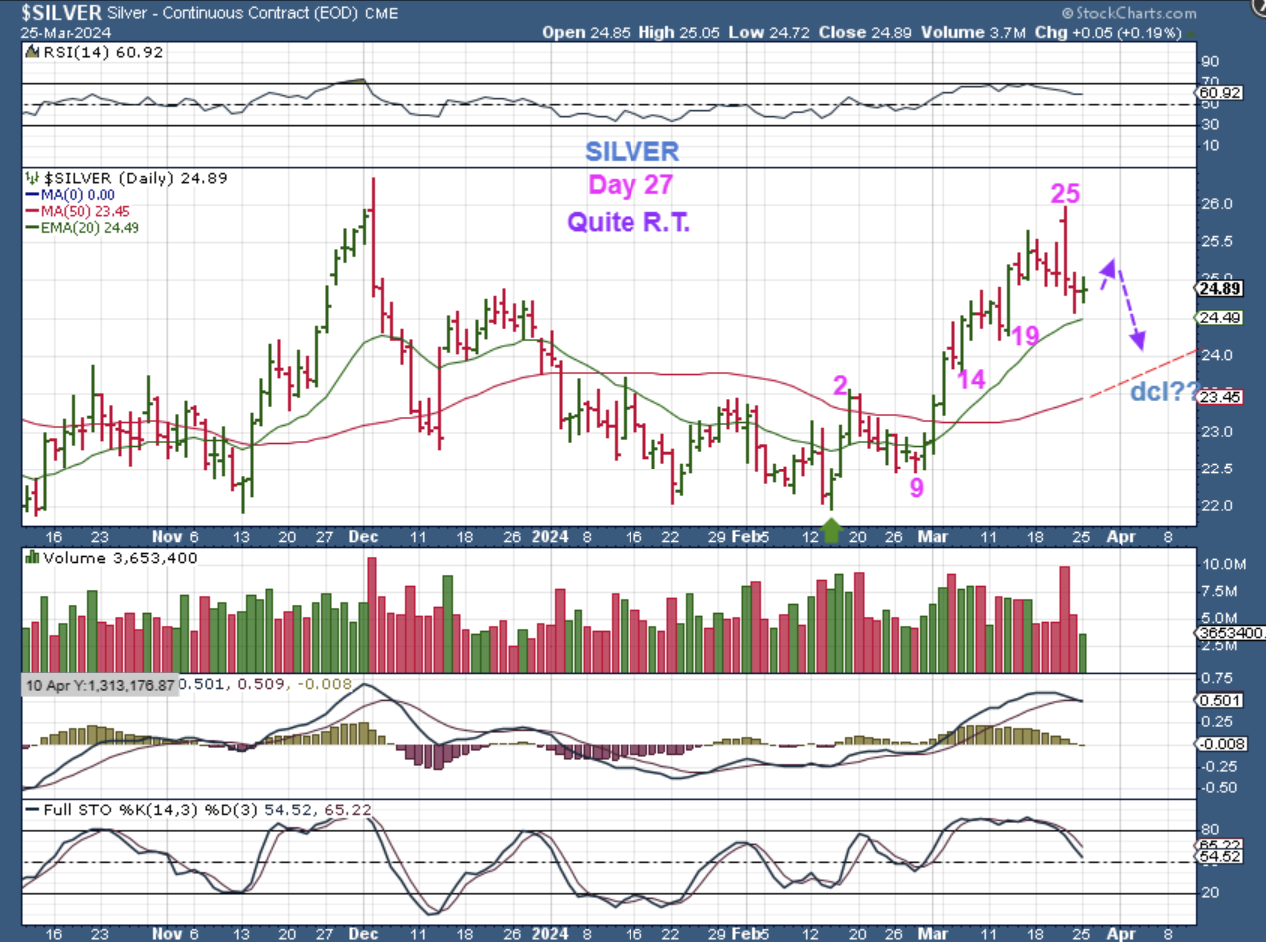
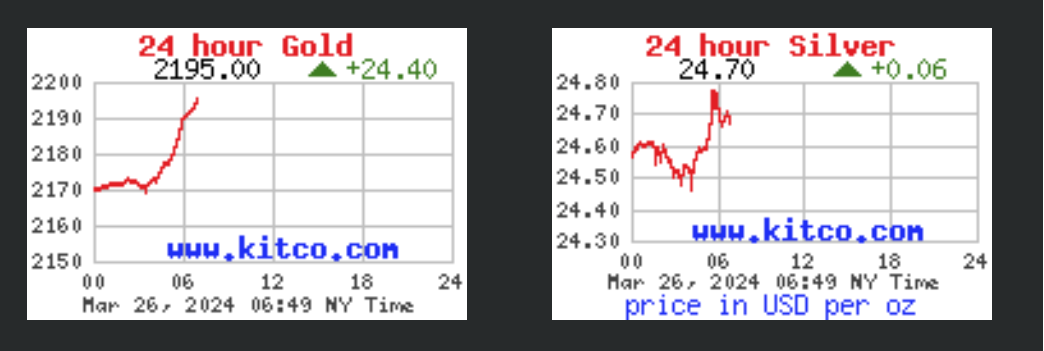
GOLD & SILVER LIVE 5:30 a.m. ET – Gold popped a little yesterday with the USD dip and it is up this morning. Let’s look at the charts…
.
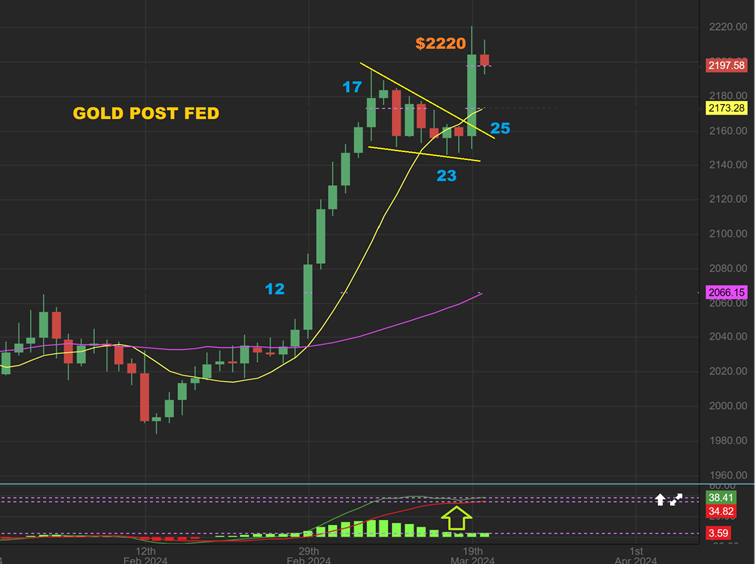
GOLD – We have discussed the idea that Gold may have a dcl at day 25 as it broke from this triangle on Fed Wednesday. This was a tough call, because when I looked at Silver, I did not see a dip that resembled a dcl. Next Gold started to pull back after the Fed Wednesday, so let’s go to a Monday chart of Gold…
.
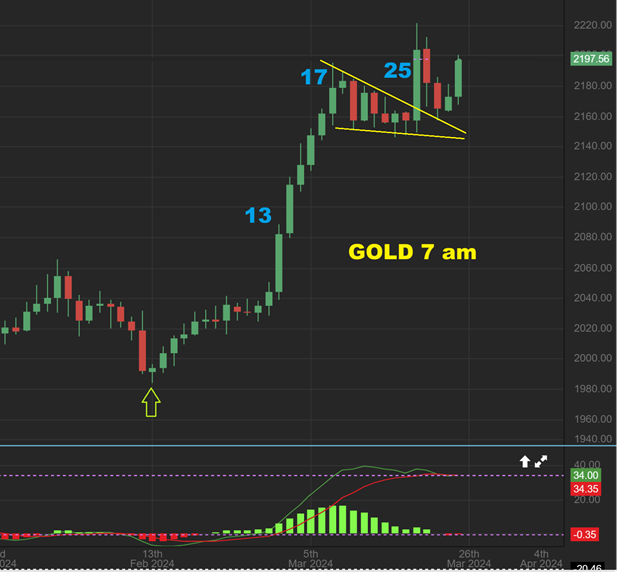
When I look at GOLD here,
1. It looks as though we are on day 27, but this still could be a dcl for Gold on day 25, and a back test that followed.
2. I am looking for a dcl to form with Silver to help identify a dcl mark.
3. SO AT THIS POINT–This could still be a dcl on day 25 for Gold and a back test on day 1 & 2, or we may see a dcl soon. I feel that a drop into a dcl from here may be very mild, maybe even just a tag of the 20 ema. Let’s look at Silver for clues though…
.
SILVER did NOT look like it had a dcl around day 25, and that is what made me feel that Golds pennant break out may not be a dcl. Take a look at Silver now though. If Silver turns higher here at the 20ema, it may give us a swing low and that could be a more visible DCL.
.
SILVER – Whether it is day 26 dcl that forms here, or if we drop a bit more over time into day 33 or so, this is a very R.T. Daily Cycle and we would expect a run above the highs in daily cycle #2.
.
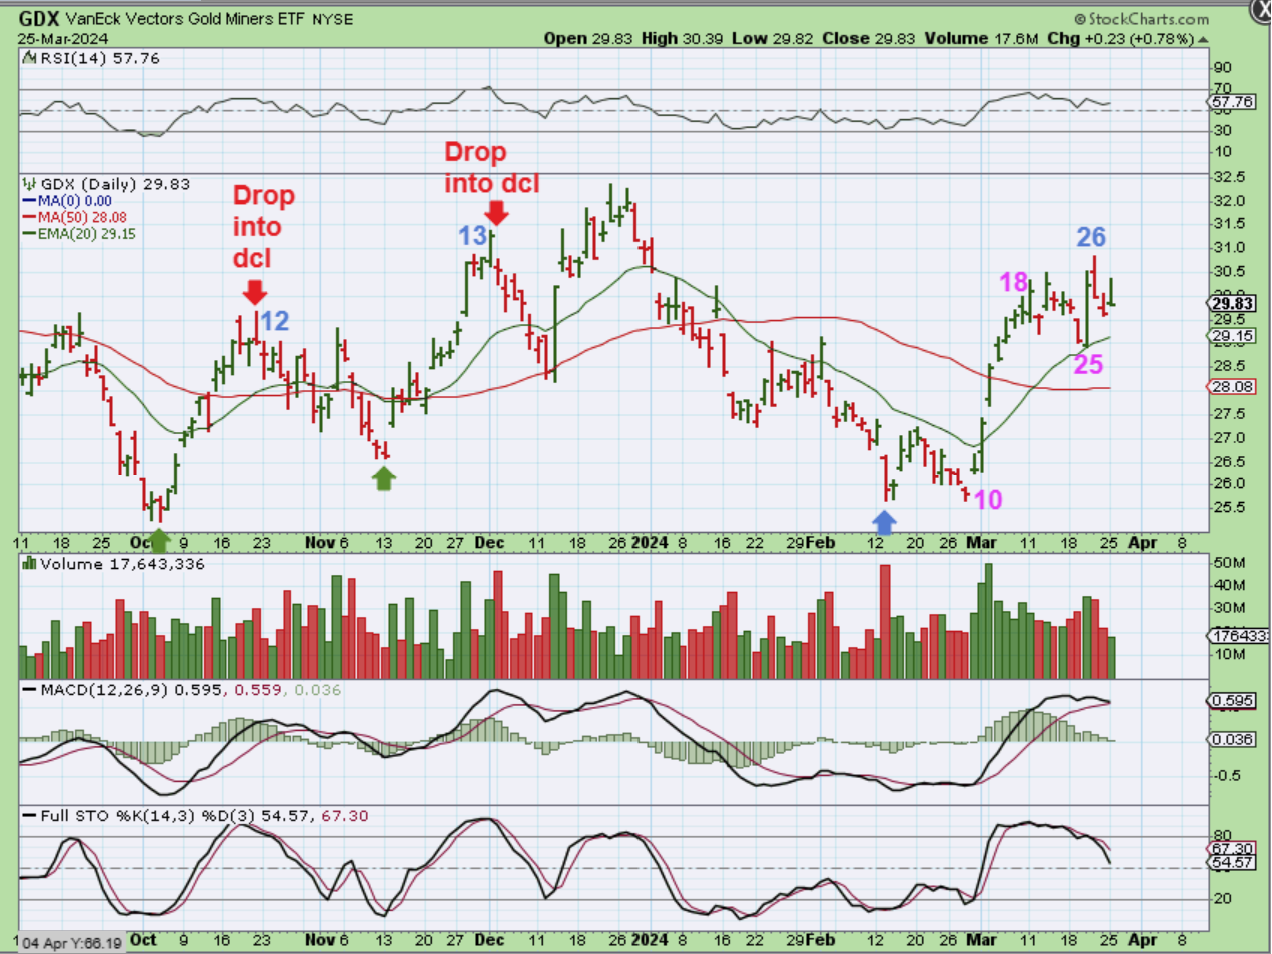
THE GDX ETF is holding up a bit better than both Gold & Silver. It is not down at the 20emaa, it is still trading up near the highs. It did do a bit of a pop and drop on Monday though. I was looking at the prior dips down into a dcl and if the dcl is ahead at day 33 or so, we may just drop to the 50sma. This would be day 28 or day 3. Either way, miners should be higher above day 26 over time.
.
UPDATE AT 7 a.m.
There is nothing long term bearish about any of these set ups. We know that at times price will chop around before breaking higher and we seem to be seeing that in all sectors. Individual stocks in each sector are also showing some strength, so I think that it is just a matter of time before we run up higher. If you are holding your basket of miners, it has been a little bit bumpy, but I expect higher prices in the second daily cycle, so if we ride down a dip into a dcl for day 33 or so, that may be the place to ‘add’ if that is your plan. If we already have a day 25 dcl, then you would go in heavier as it breaks out higher.
.
As a sidenote: This is a shortened week for the US Traders, with the Markets closed on Friday. Enjoy your Tuesday trading!
.
~ALEX
.
GOLD 7 am: Gold is continuing to climb here, and it’s almost back up at the day 25 highs. Impressive.
.
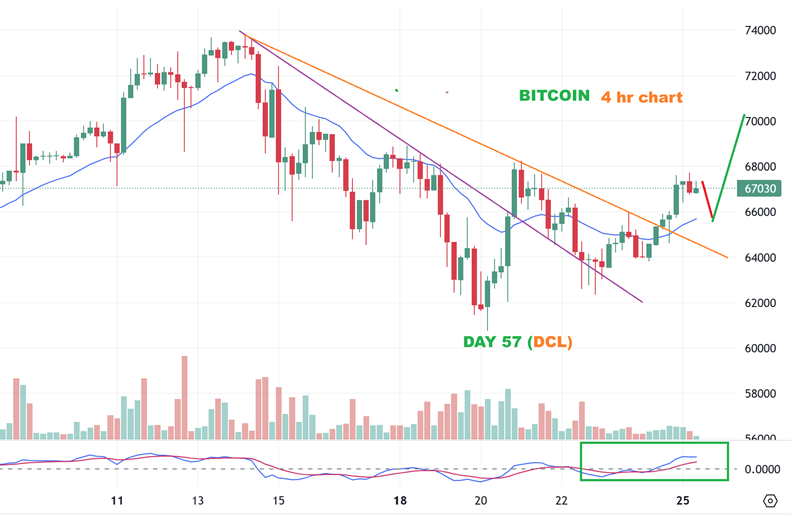
BITCOIN – Using a 4hr chart yesterday, I drew this up as a bullish base for Bitcoin, and the day 57 lows looked to be a dcl. Even if this dipped, it would be bullish.
.
BITCOIN – I drew this up yesterday to show that we have Railroad tracks at day 57, and I see that as a dcl. We were slightly red when I grabbed this, but that was about to change.
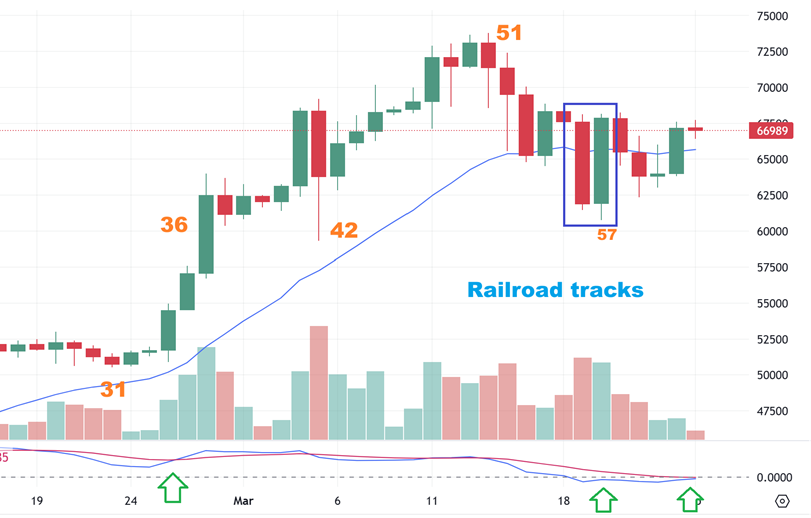
.
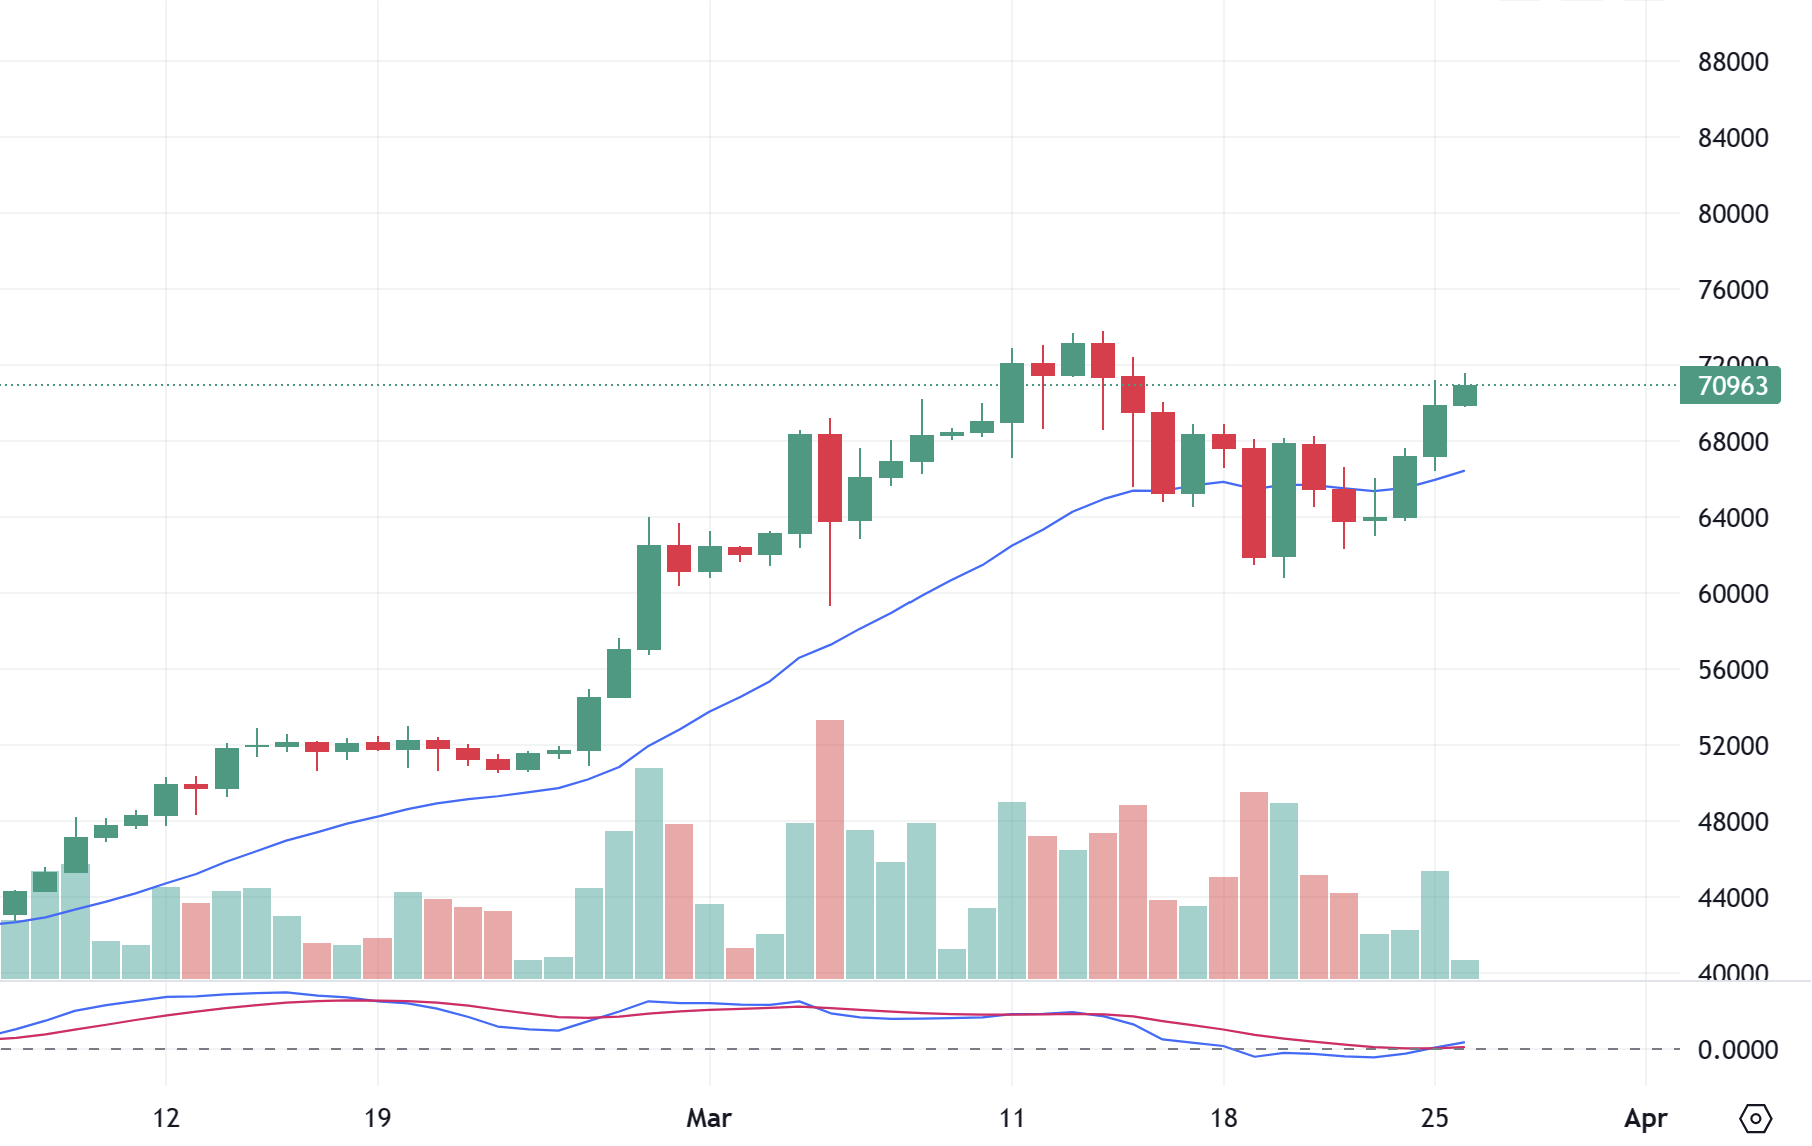
BITCOIN started to go from red to green and started to really push higher here. I called yesterday day 5. Bitcoin went on to run up back over $70,000 as the day went on!
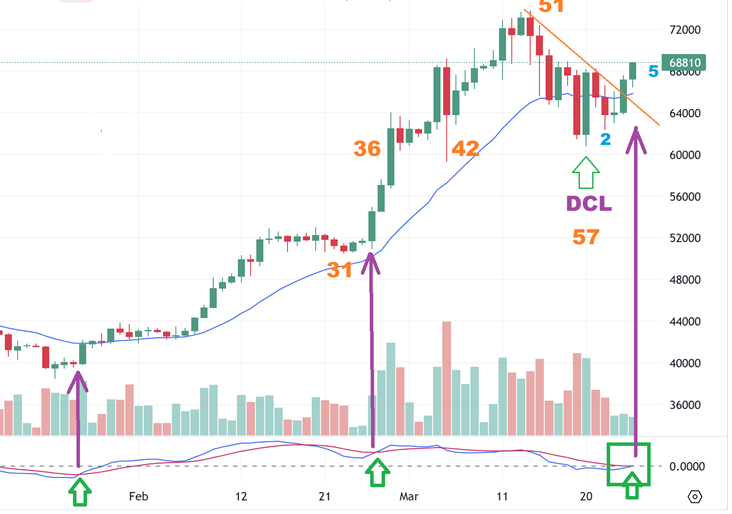
.
BITCOIN LIVE 7 a.m. : This is now on day 6 and this is a very bullish set up. It could just run to $100,000, or it may run up, form a cup, and then a handle. We’ll see.
.
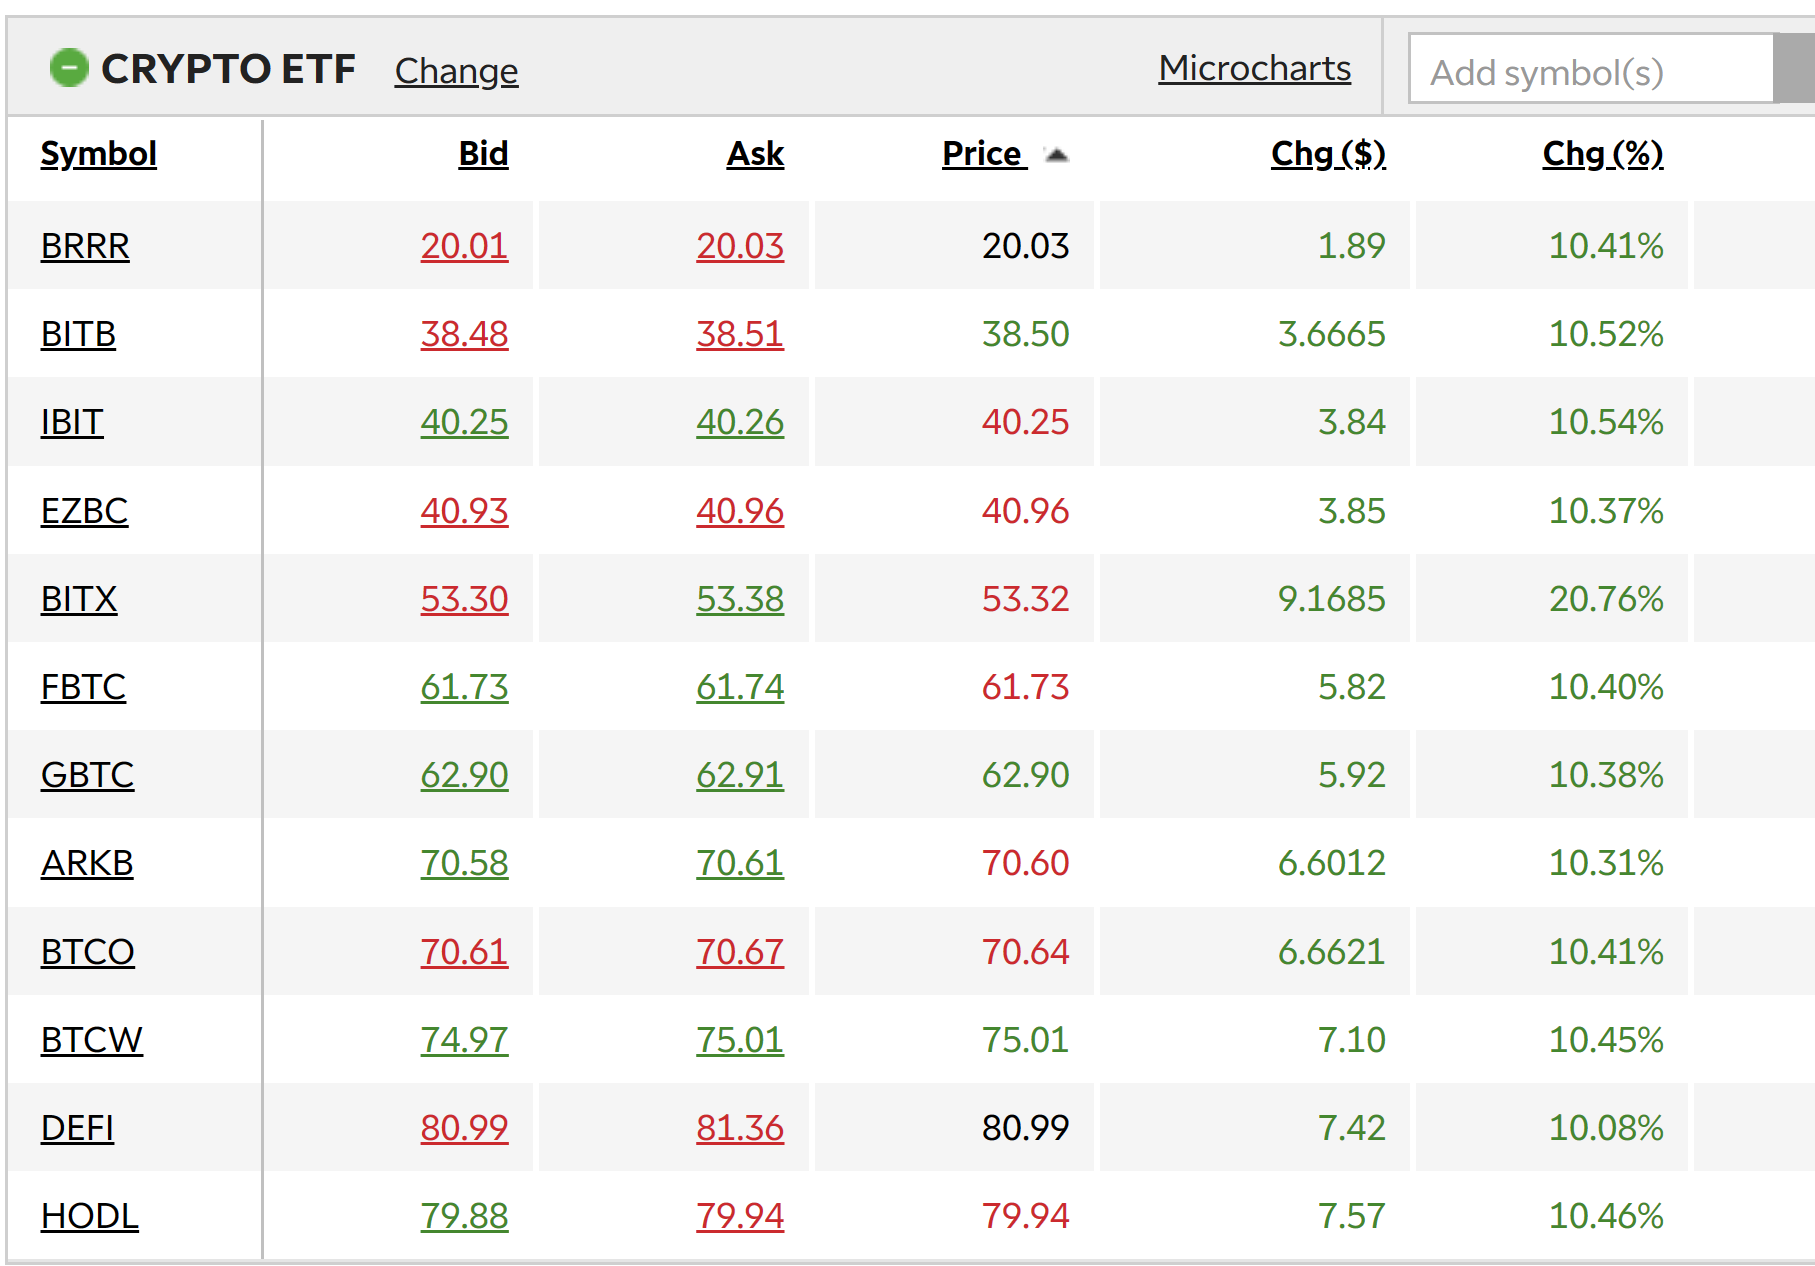
BITCOIN ETFs – I wanted to share my watchlist of the Crypto ETFs. These were all up 10% yesterday and BITX was up 20%. You may choose to play these as a buy and hold. The charts are bullish, but just remember that during a pullback, these can also drop 10%. This sector moves FAST and is simply not for everyone. Start small if you are new to the sector and just want to try to buy and hold. I want to talk about the crypto stocks too however…
.
I want to talk about the crypto stocks too however…
AS AN IMPORTANT OBSERVATION: I AM SEEING SOME CRYPTO-RELATED STOCKS ACT STRONGLY, BUT SOME POPPED AND DROPPED ON MONDAY WITH BITCOIN AT THE HIGHS?? The first thing that I thought of was, “oh no, not THIS again’.
IS THAT A PROBLEM? NOT YET, BUT IT IS SOMETHING THAT I WANT TO KEEP AN EYE ON, ESPECIALLY WITH WHAT HAPPENED AT THE END OF THE LAST 60 DAY RUN. WE SAW SOME BIT-MINERS SELL OFF AS BITCOIN FINISHED THAT 60 DAY CYCLE.
.
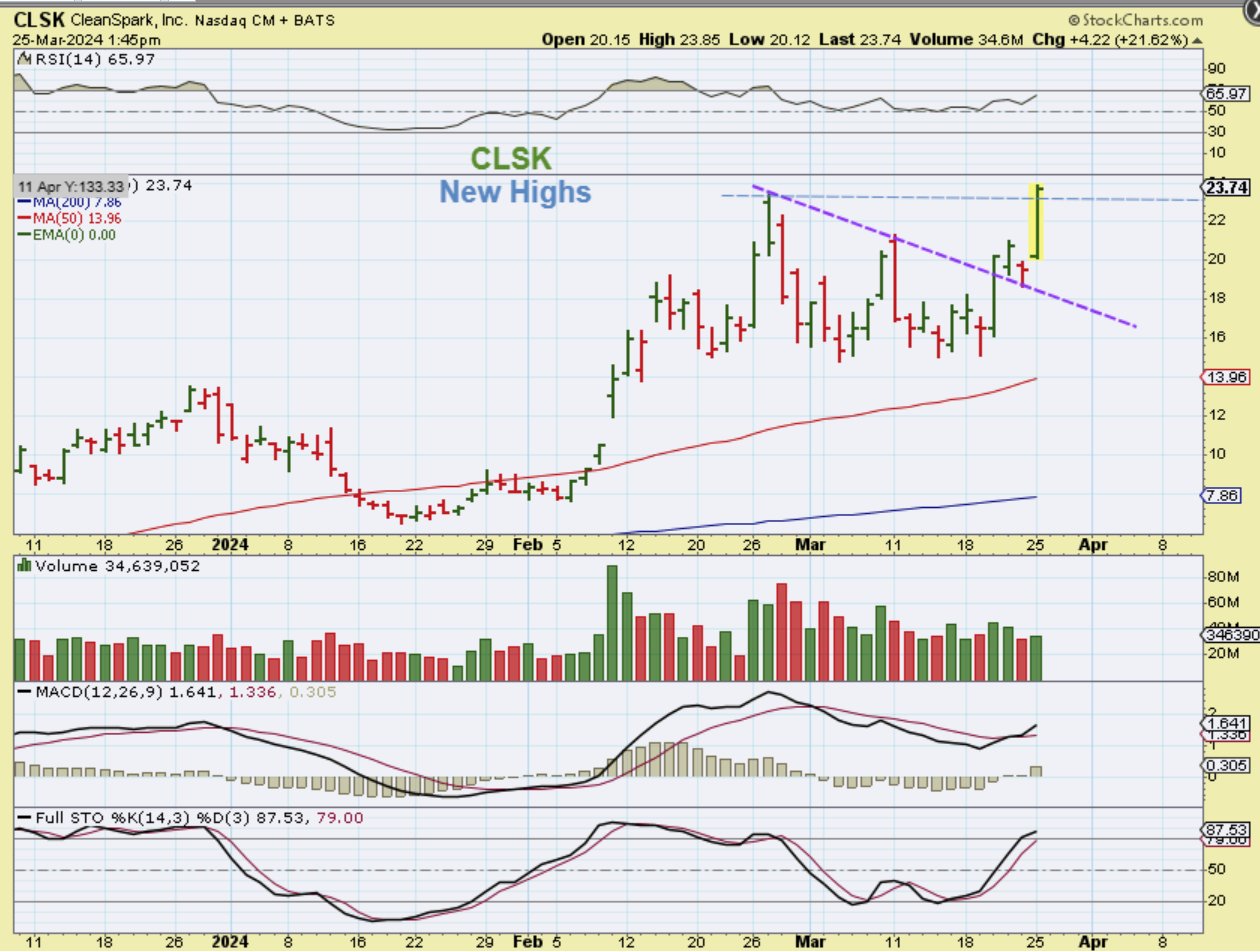
CLSK – On Monday we saw follow through with the CLSK Triangle breakout. I showed it here continuing as it was now likely to head back to the former highs, so I posted this in the first 1/2 hr.
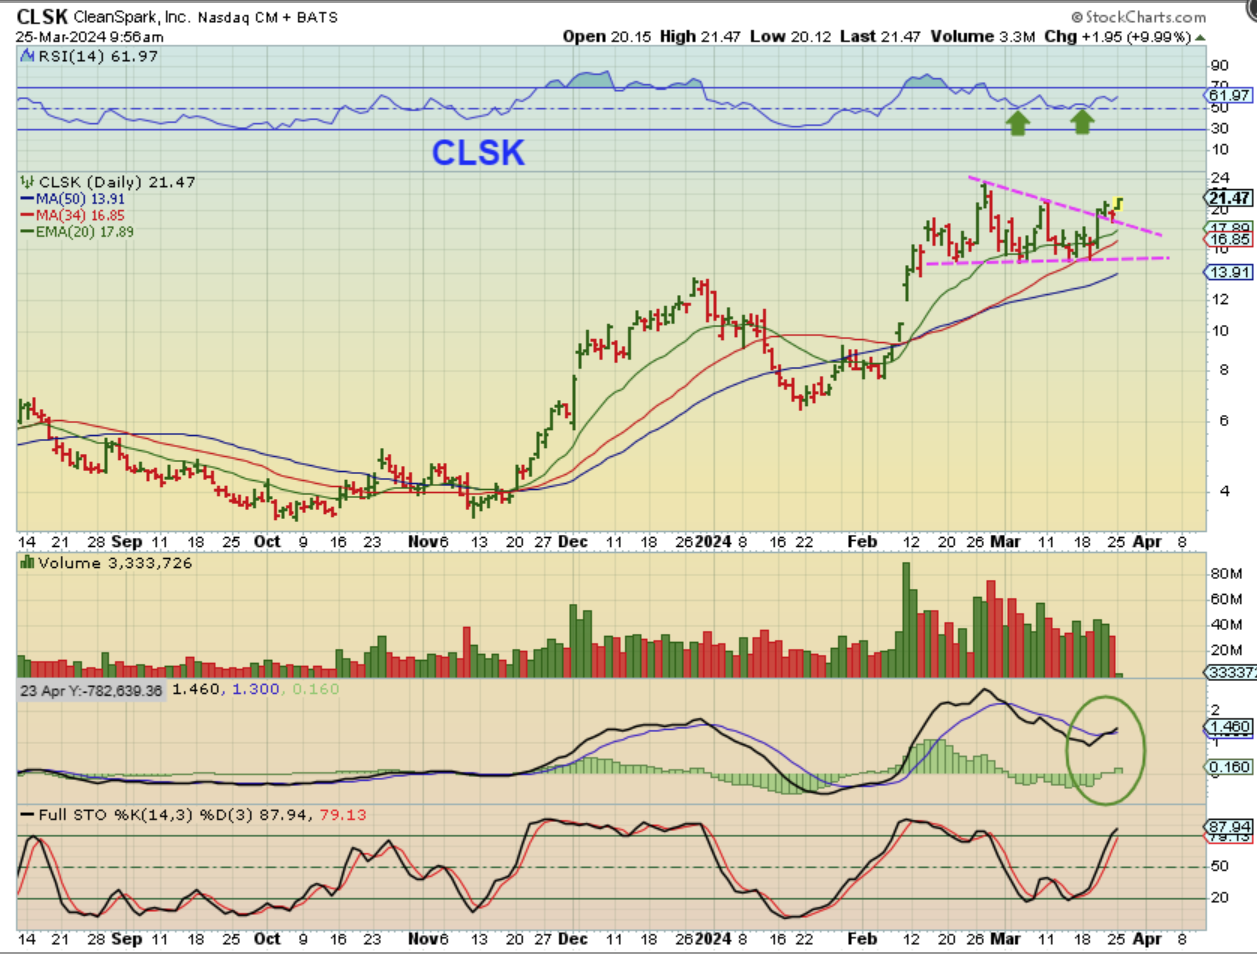
CLSK made new highs and was up almost 22%. It closed near these highs. CLSK is definitely one that is responding bullishly to Bitcoins run.
.
HUT also broke from a downtrend and is a bit more of a ‘lagger’, so I posted this when it was up 5%. I think that it could run to the 200sma as a first target, and that is a $7 to $11 run. It can also continue higher over time.
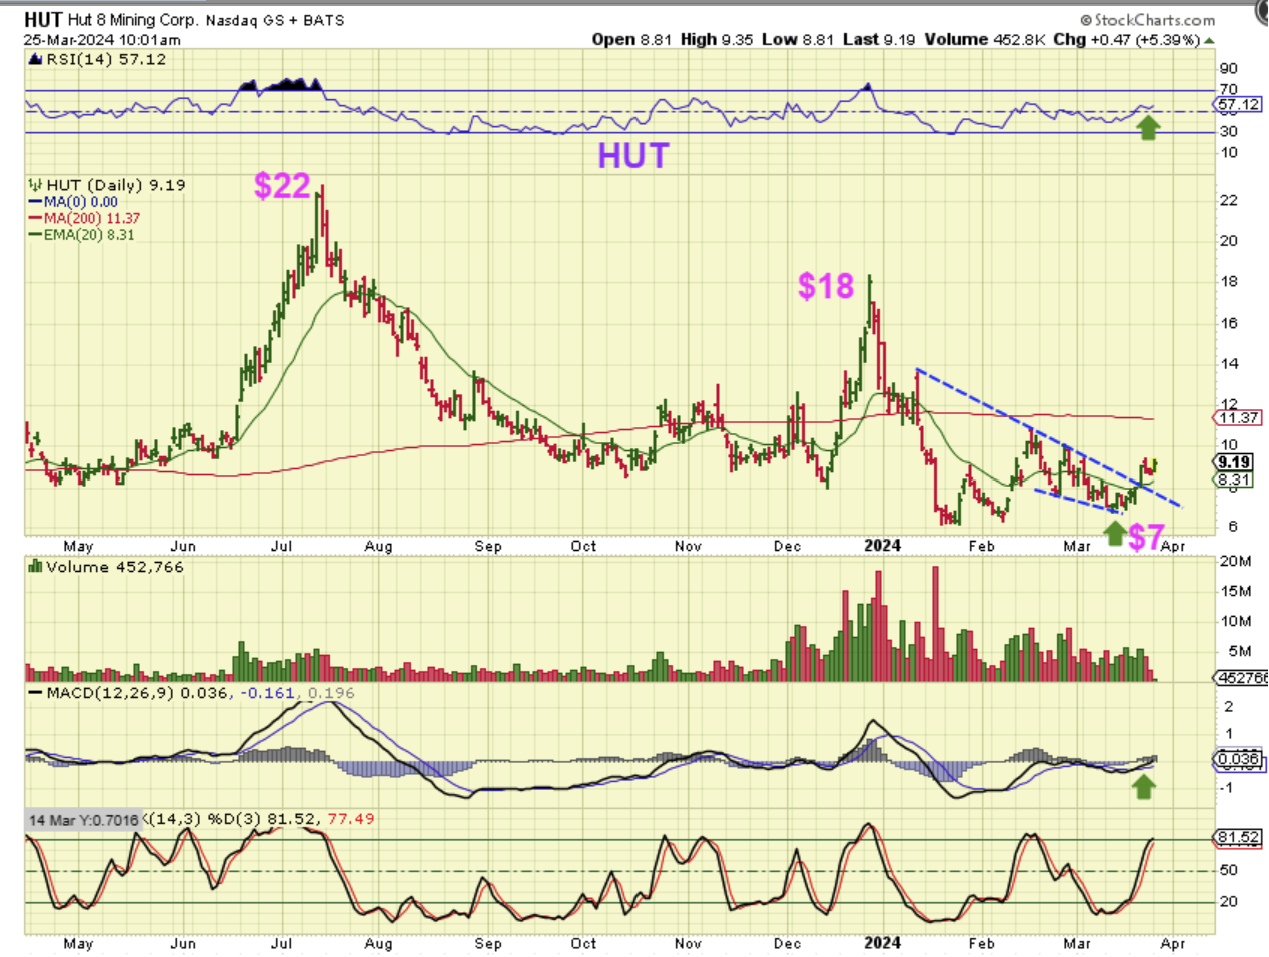
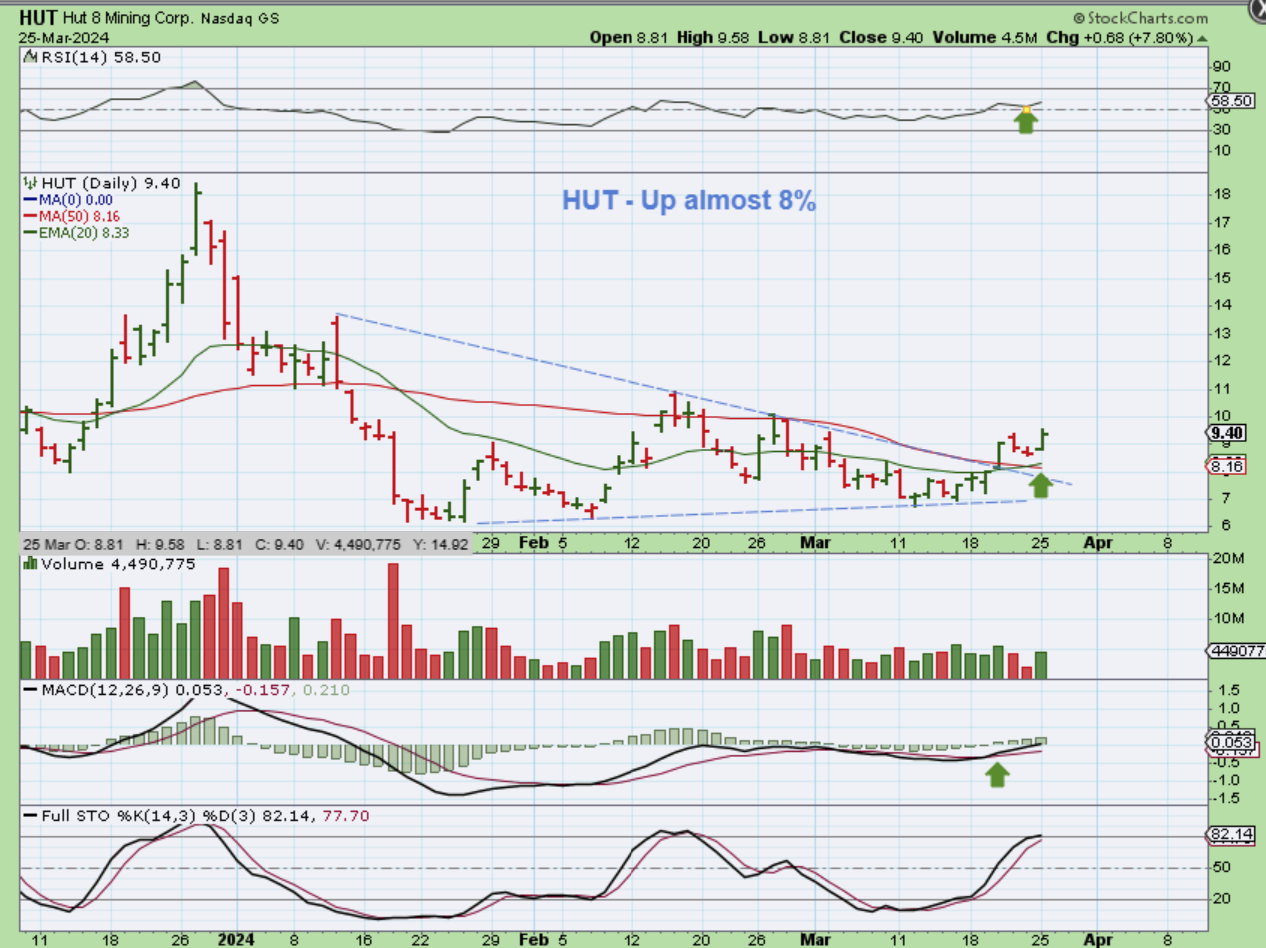
HUT was up 9%, but pulled back a little into the close. This still remains bullish at this point, but I would have expected this to be up 14% or so, like it has in the past. Bitcoin was at the days highs.
.
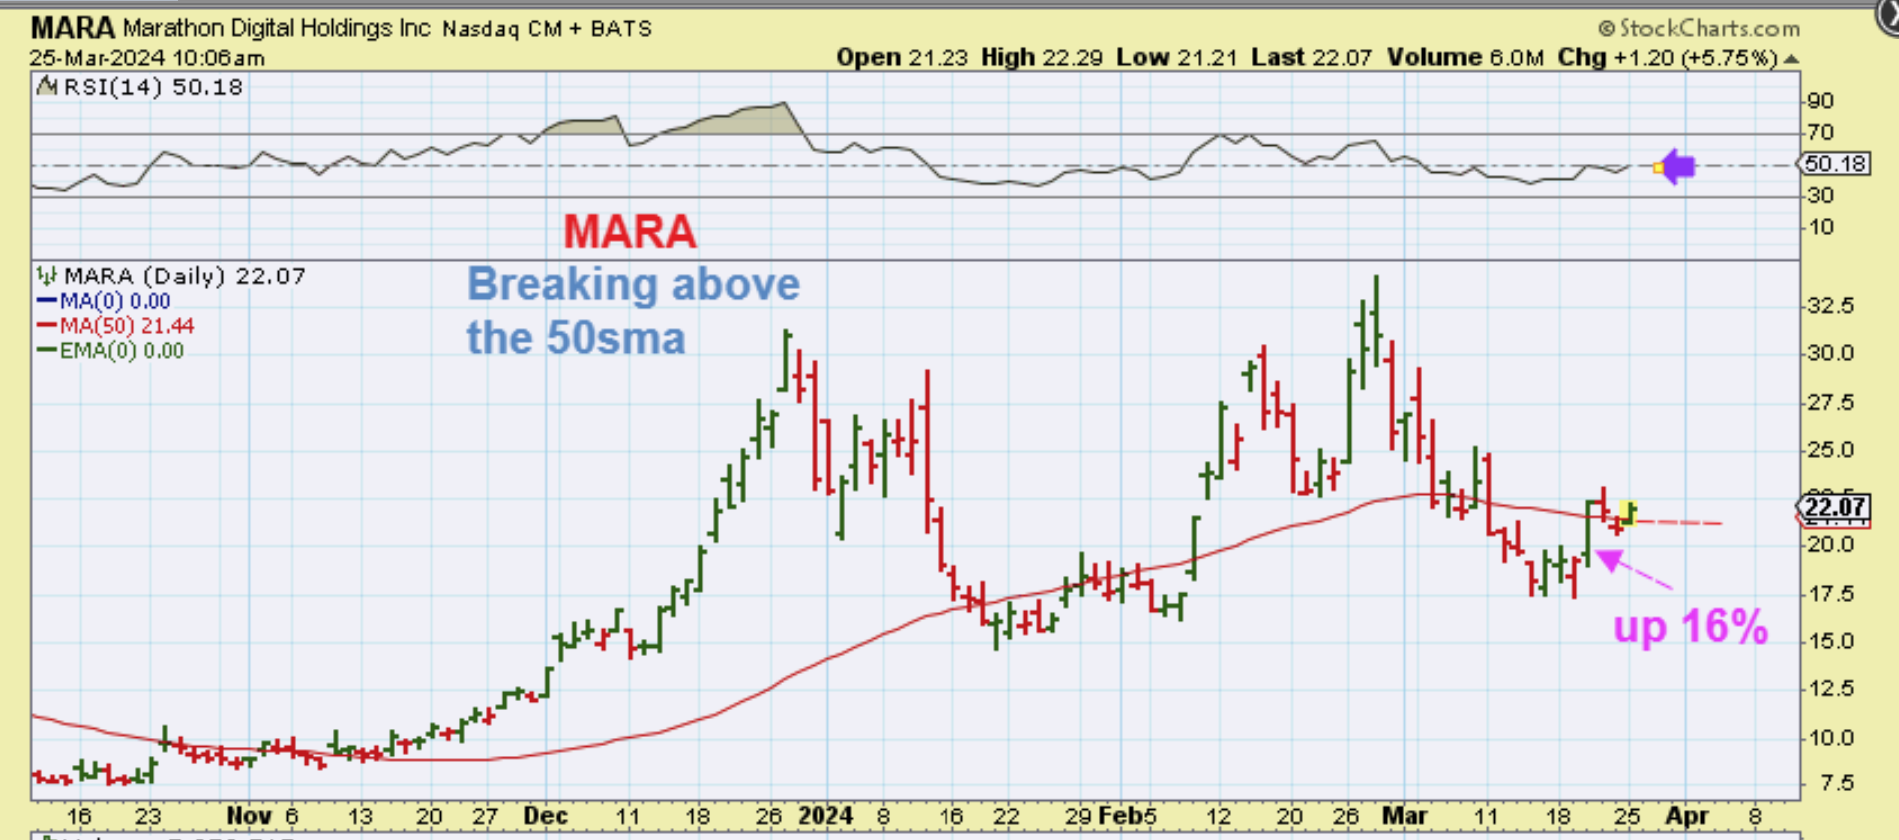
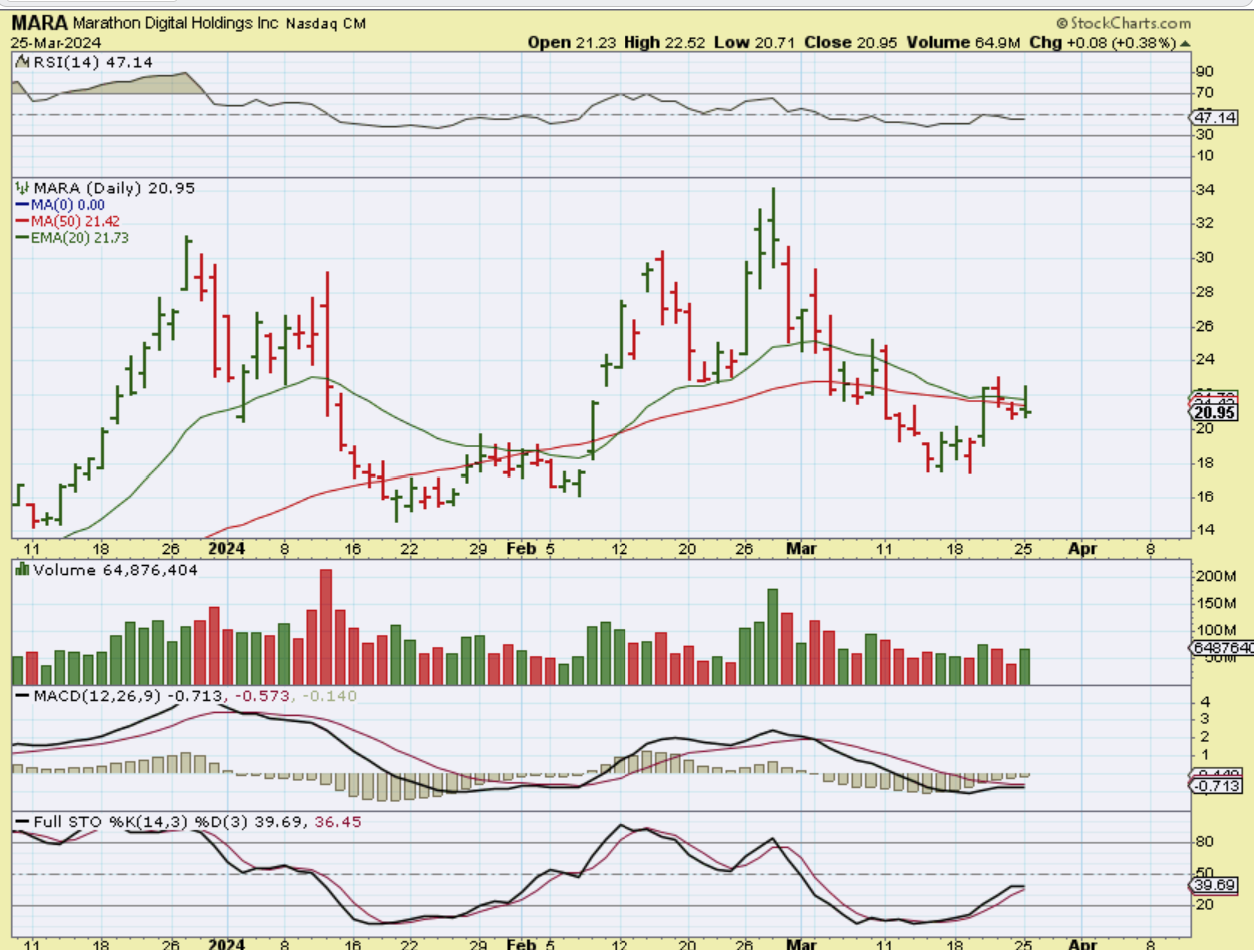
MARA was breaking out above the 50sma, and so I grabbed this chart. Notice that it was $22 at 10 a.m.
.
MARA was at $22 in the above chrt and it ended up selling down into the midday and close. This was a bit concerning to me, because it is not ‘extended’ by any means and Bitcoin was up at the highs and back above $70,000. I cannot explain why this happened, but it has me cautious and reminded me of that last run up. Again, Bitcoin was at $70,000, Mara was up less than 1%?
.
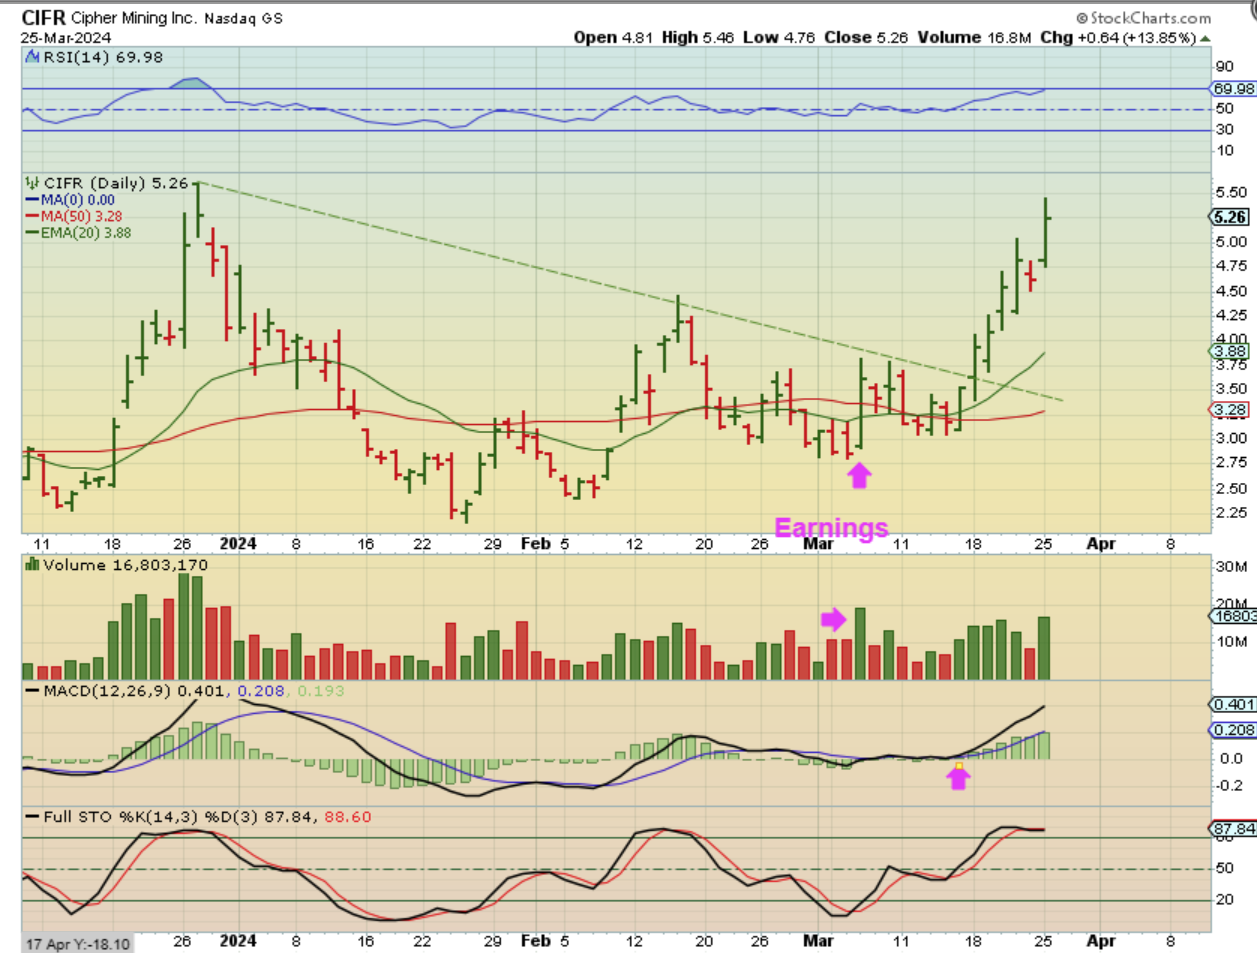
CIFR, IREN, and several others remained bullish, so right now I am invested and keeping an eye on things going forward. I do not want to see ‘weakness’ when Bitcoin is running up. If that continues those ETFs are the way to play it.
.
CIFR was up about 16% and sold off a little into the close, but it is still bullish and may simply be seeing some profit taking after a nice run from under $3 to $5.50.