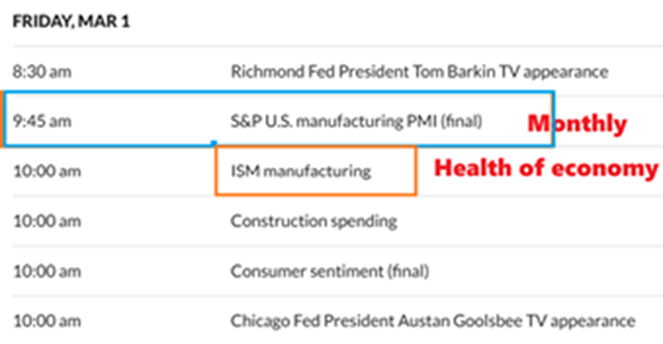
Friday March 1st
Thursdays Data caused the futures to rally, so the markets continue to show that bullish Bias, even this late in the 2nd daily cycle. Fridays data is important, but it doesn’t seem like it would cause a bad reaction. We’ll see.
.
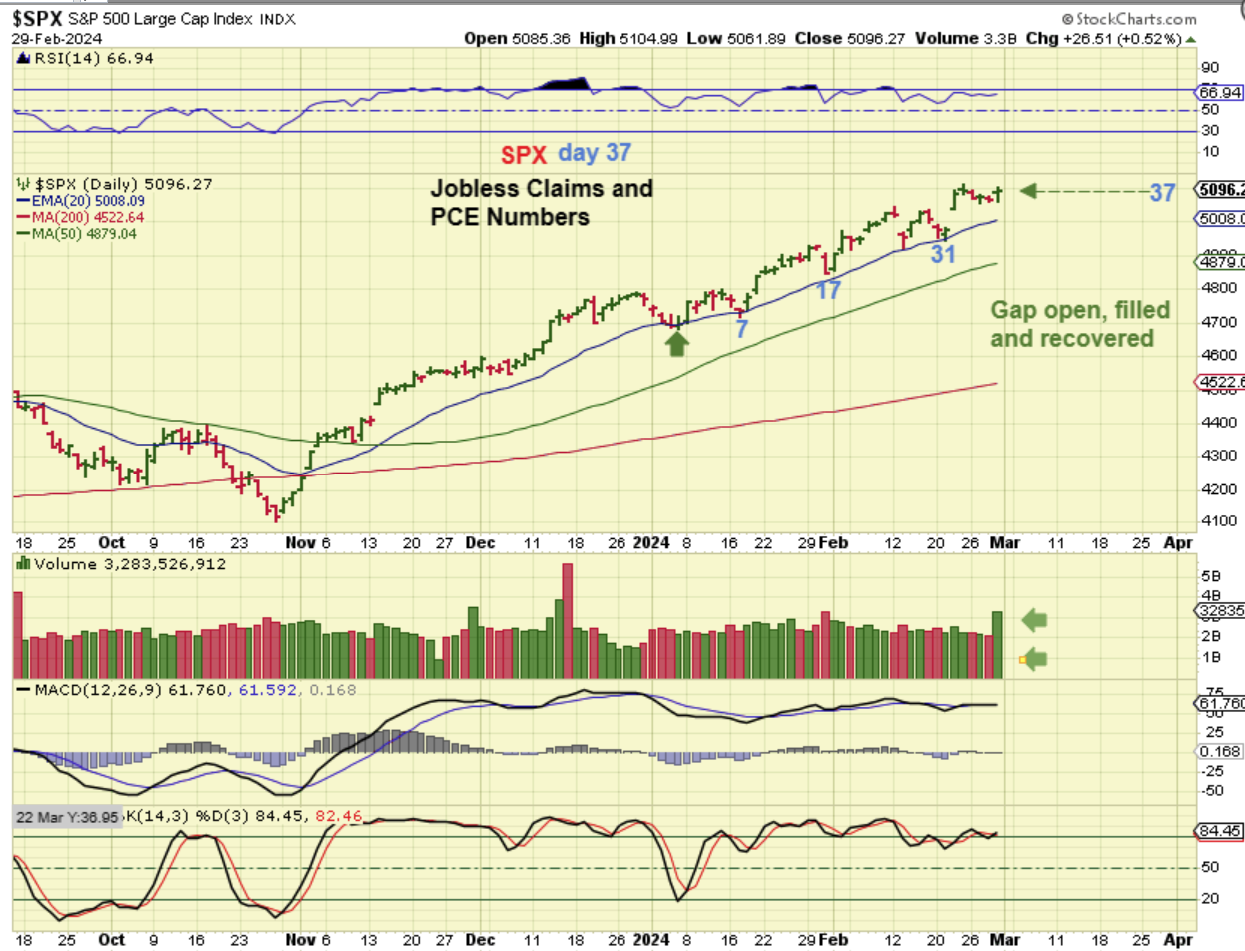
SPX – With the release of the morning data, the futures climbed and the markets gapped open. The markets then dropped down to close that gap, but still recovered and closed near the highs of the day. We now have day 37 almost breaking to new highs, so Friday may even see this 2nd daily cycle make a new high on day 38. Very strong and very right translated.
.
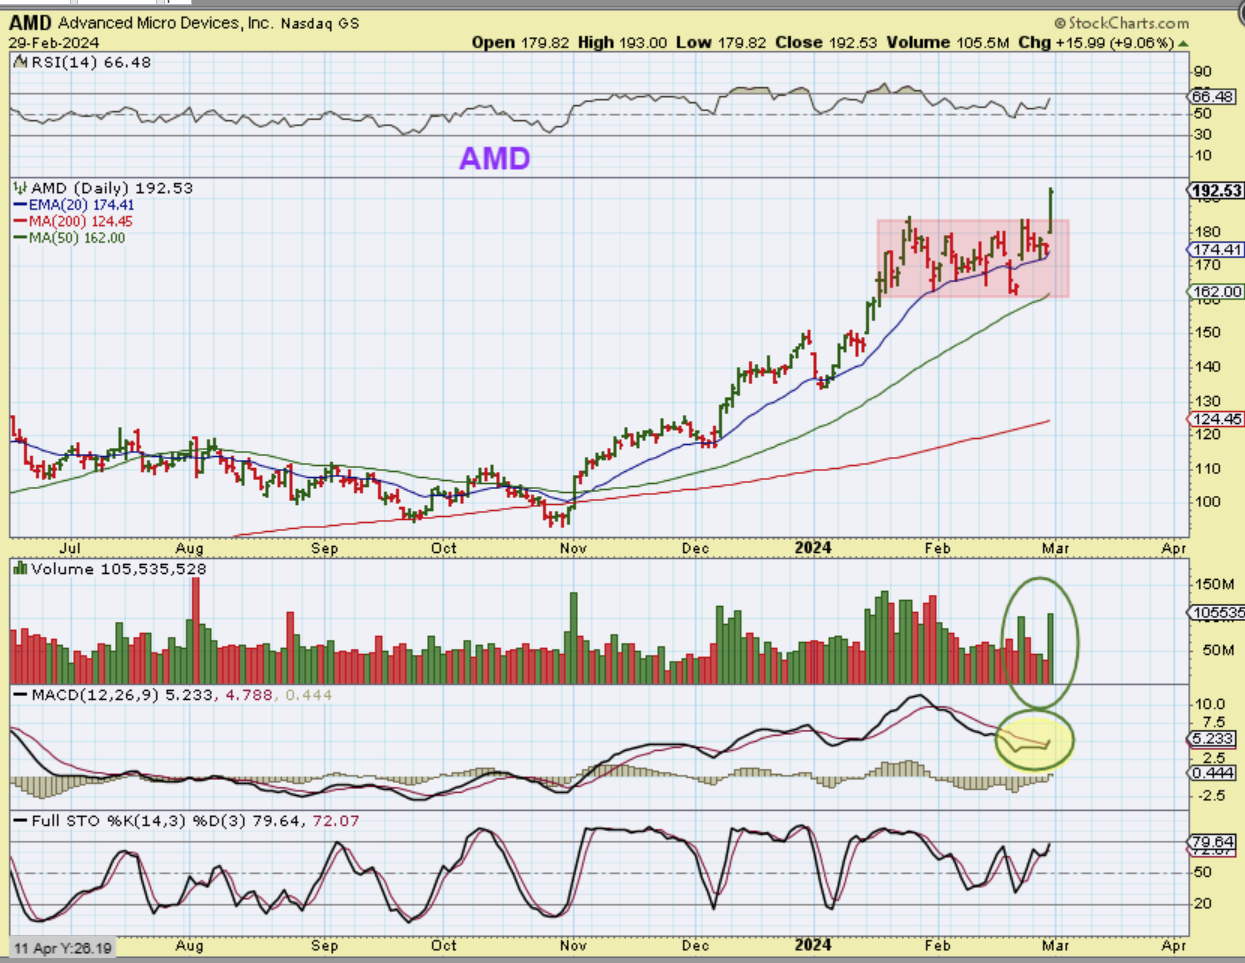
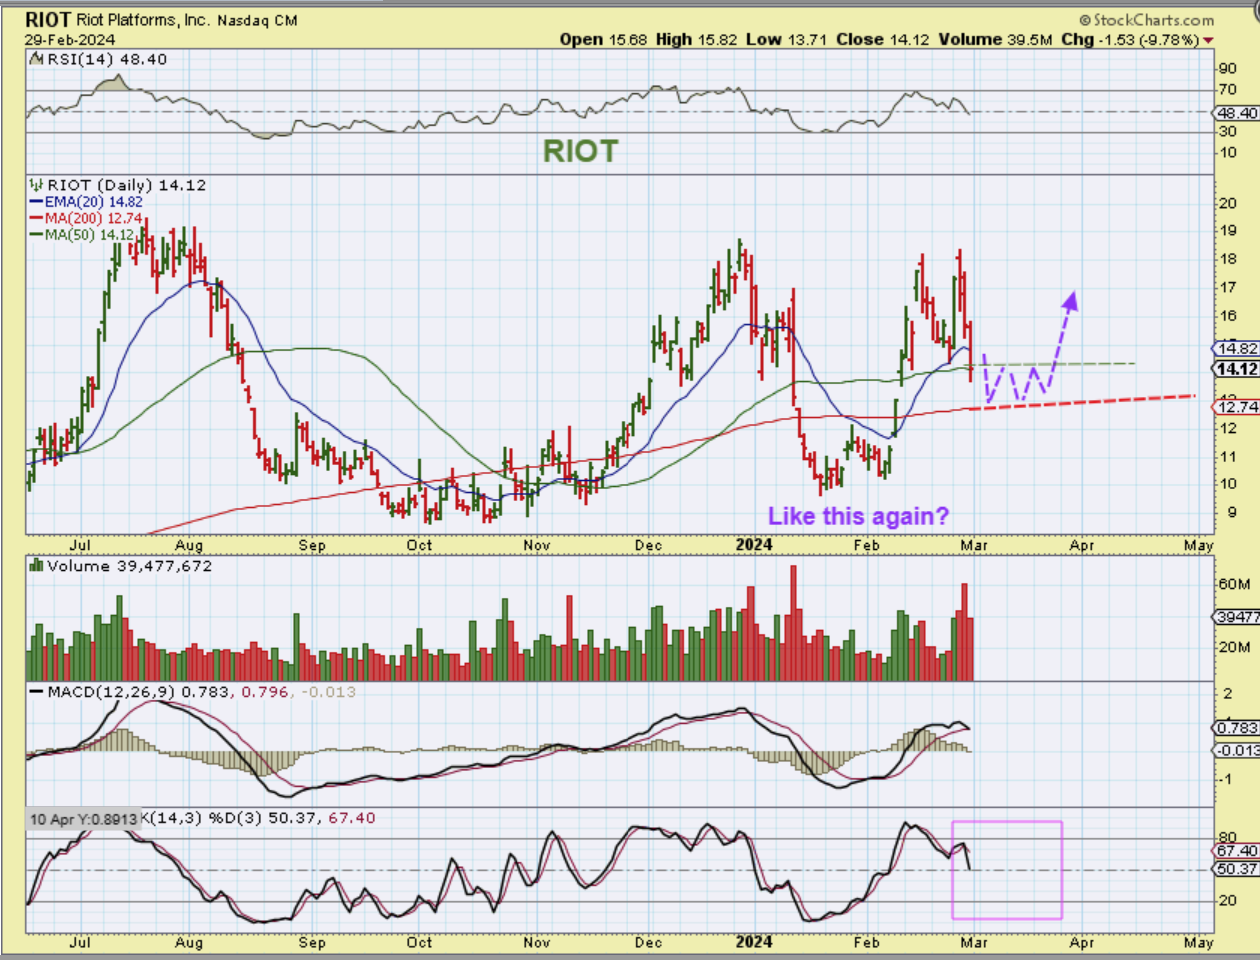
AMD broke out from a multiweek consolidation on increased volume. This is a bullish breakout, but with a dcl in the near future, I feel that it may back test at that time and offer another buying opportunity. P.S. I also hope that this large consolidation at the top of the rally is what MARA, CLSK, RIOT, etc do, now that they’ve started to sell off.
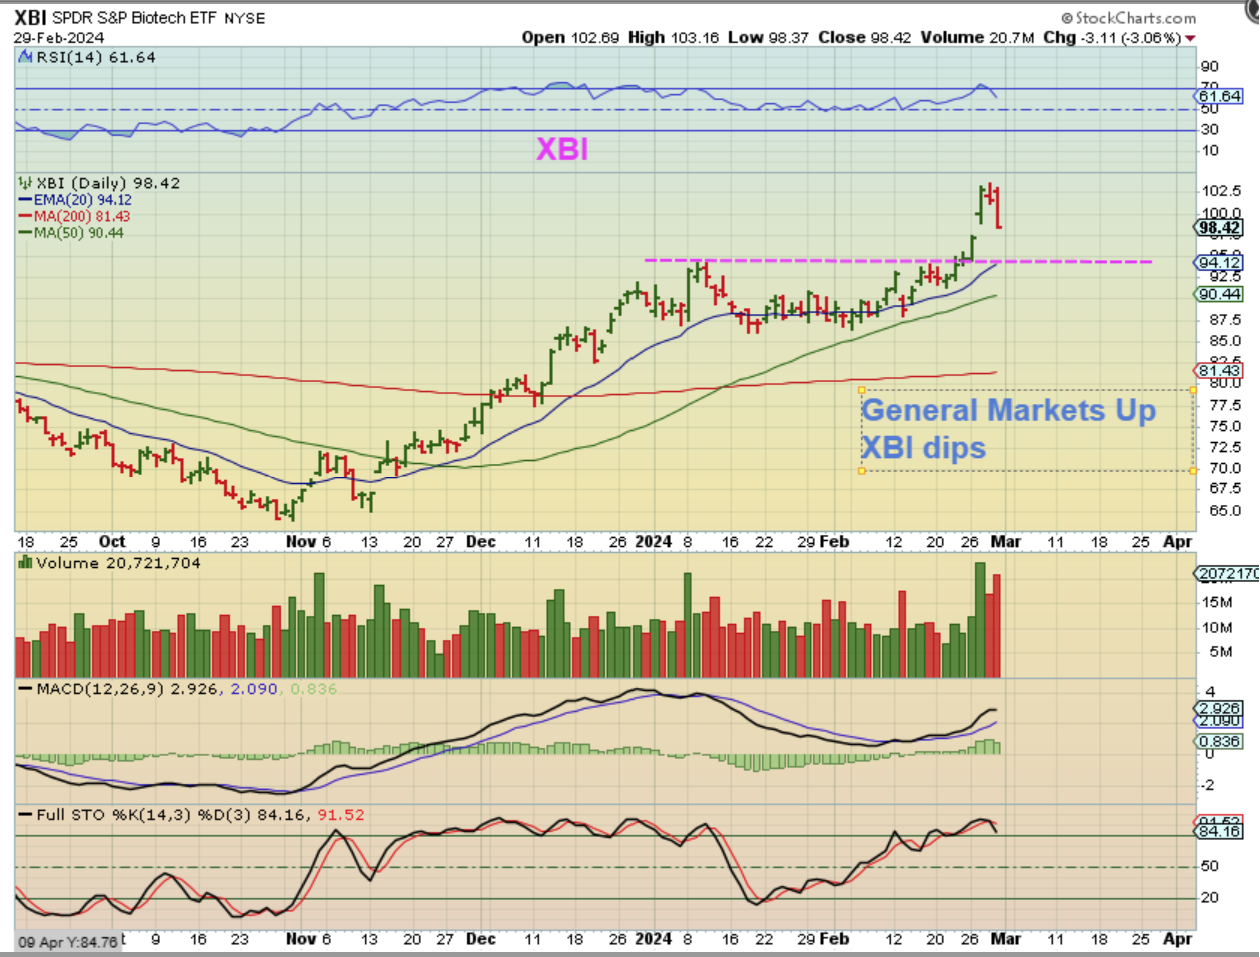
XBI – Interestingly, I mentioned that Biotechs might pull back to close the gap or back test the breakout. On Thursday the General Markets were green, but the XBI was down 3%. Also interesting is that while many of the bigger biotech companies pulled back ( see charts of TWST, NTLA, CRSP for example), Many of the smaller biotechs were actually still up nicely Thursday. See TSHA, VAXX, RNA, AHT, SENS, PDSB, TENX, etc.
.
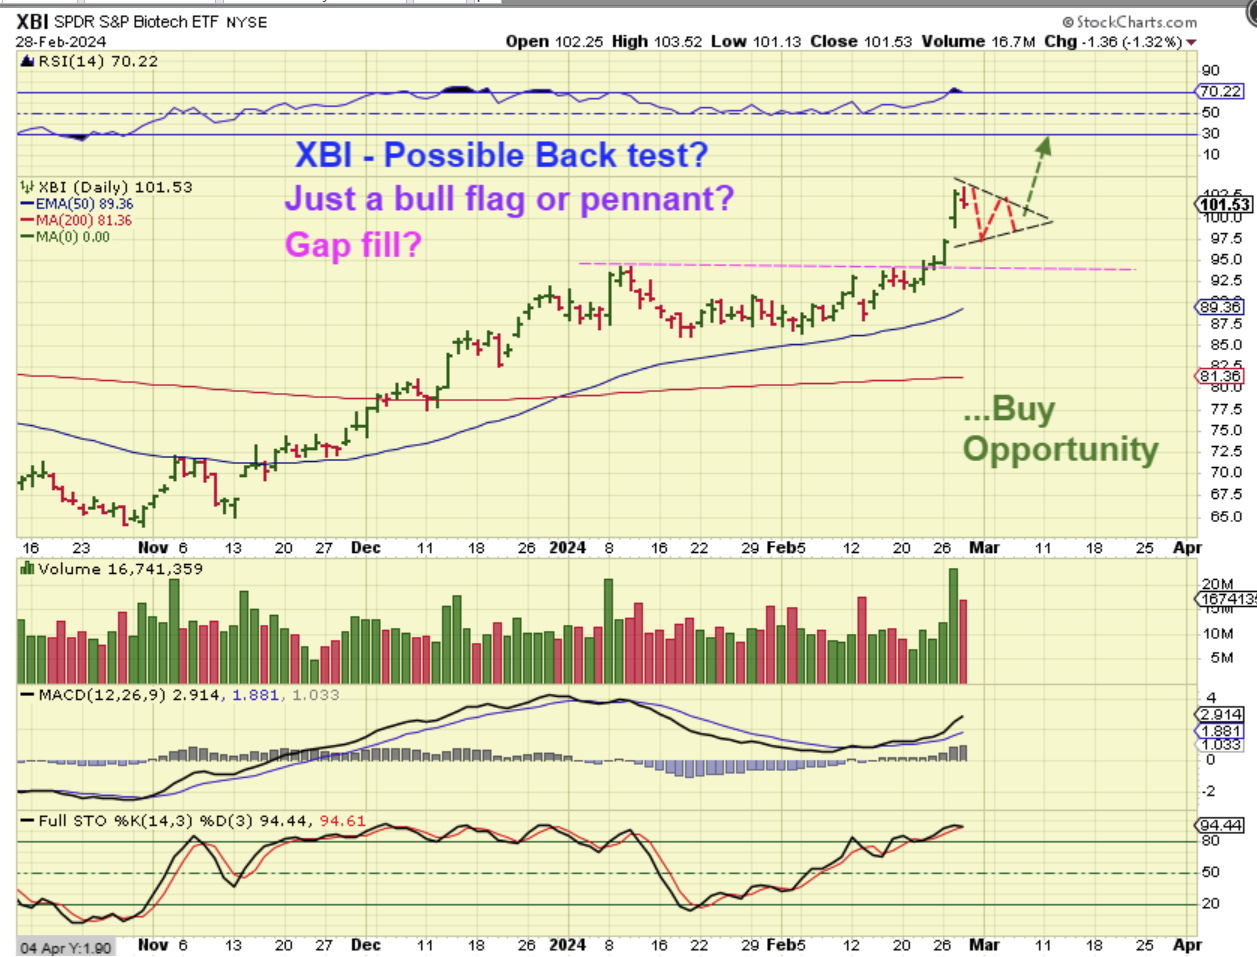
Yesterday I mentioned with The XBI: I’m watching for a back test or a pennant, as drawn here. This would be a buy for LABU or some of the Biotech stocks that pull back, so I want to watch how this plays out.
.
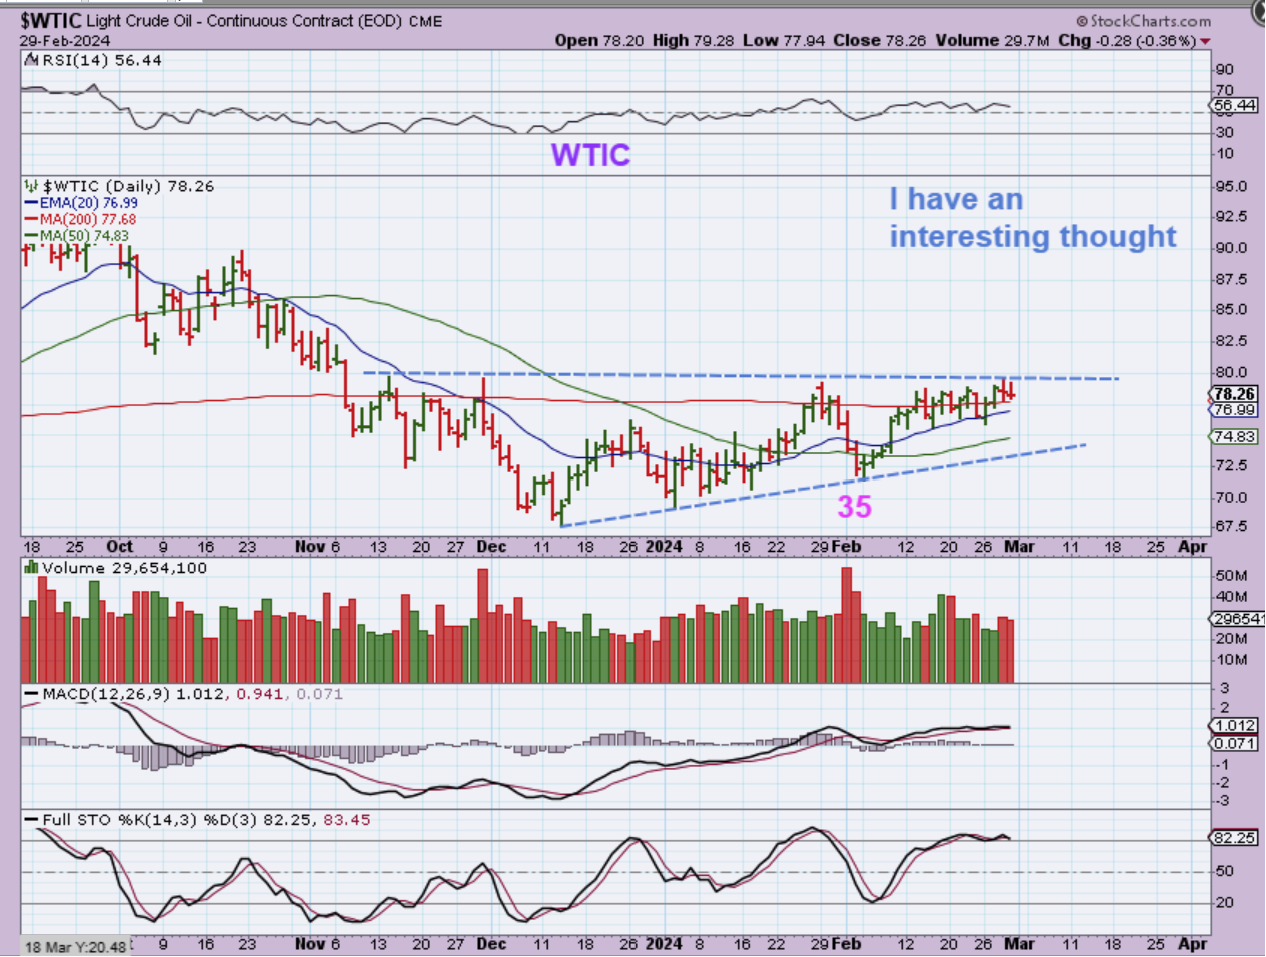
WTIC – Oil is still chopping sideways and I started to wonder something yesterday.
1. What if day 35 was NOT the dcl, but sort of a half cycle low? If so, this won’t break out, because this would be day 52 and it would drop into the real dcl next. A quick 3 day drop would be similar to the drop that gave us day 35.
2. I will say that I DO still favor the current idea that day 35 was the dcl, because this looks too strong to be day 52. I still think that we are seeing Oil bullishly ‘crawl’ sideways on day 17 above the 200sma, so it could break out higher at any time. Also, the XOP & Oil Stocks look good and also seem to have a dcl.
.
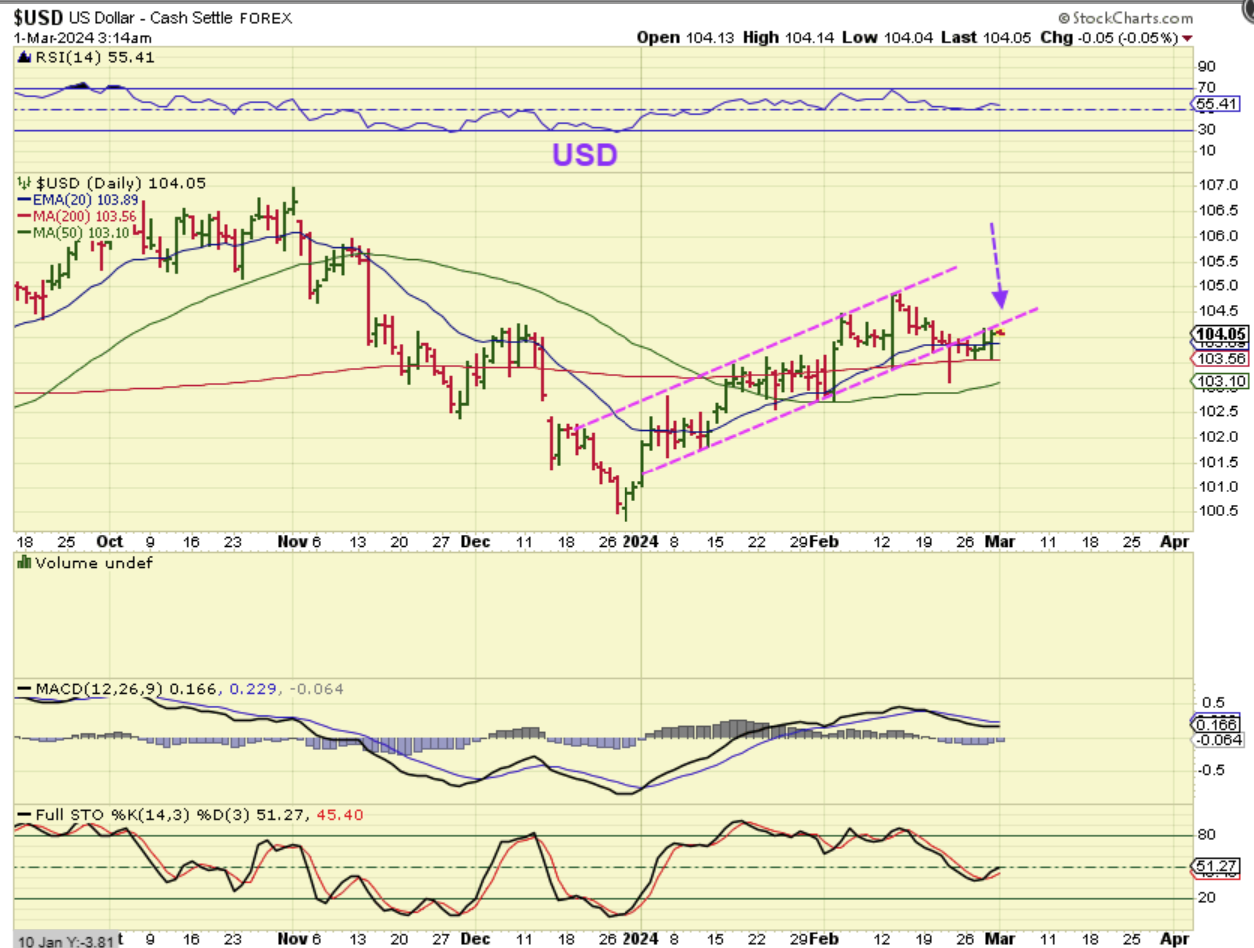
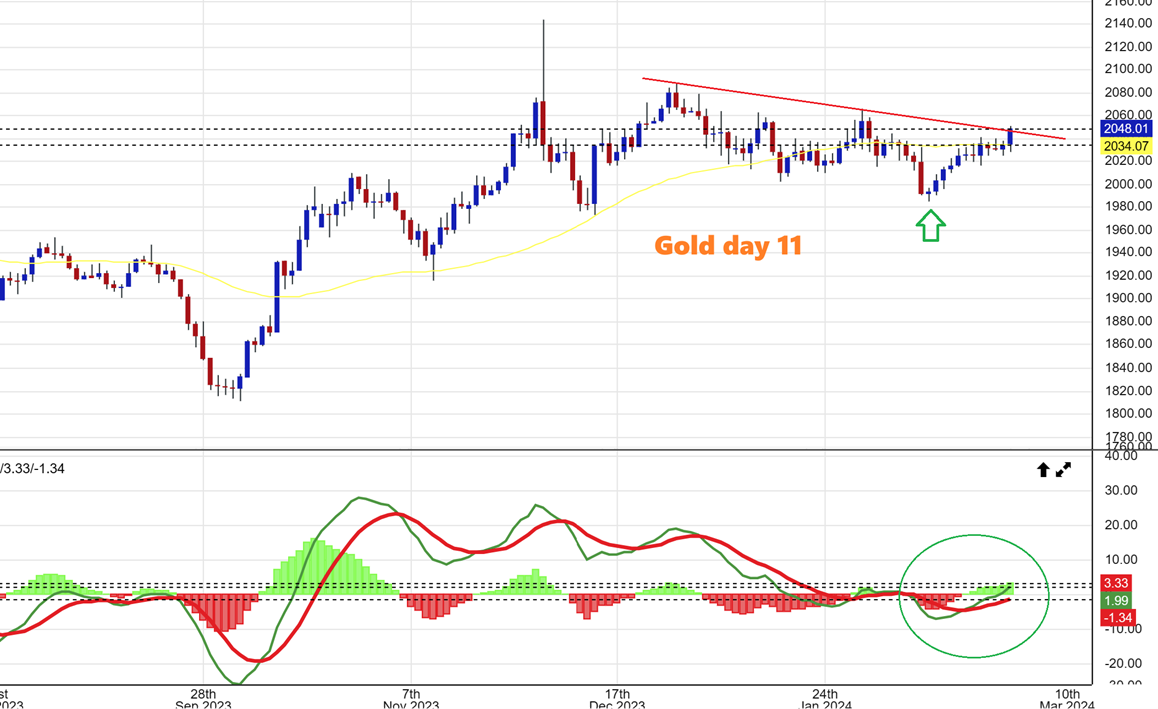
THE USD is still chopping sideways along the 200 sma. It Popped on Thursday and kind of back tested the channel that it fell from, but Gold and Silver Popped too.
GOLD popped up to the downtrend line and looked ready to break out or like it had already started to break out, but it did pull back as the day went on. This is day 11 for Gold and it looks really bullish actually, NOT like it is in a 4th or 5th daily cycle.
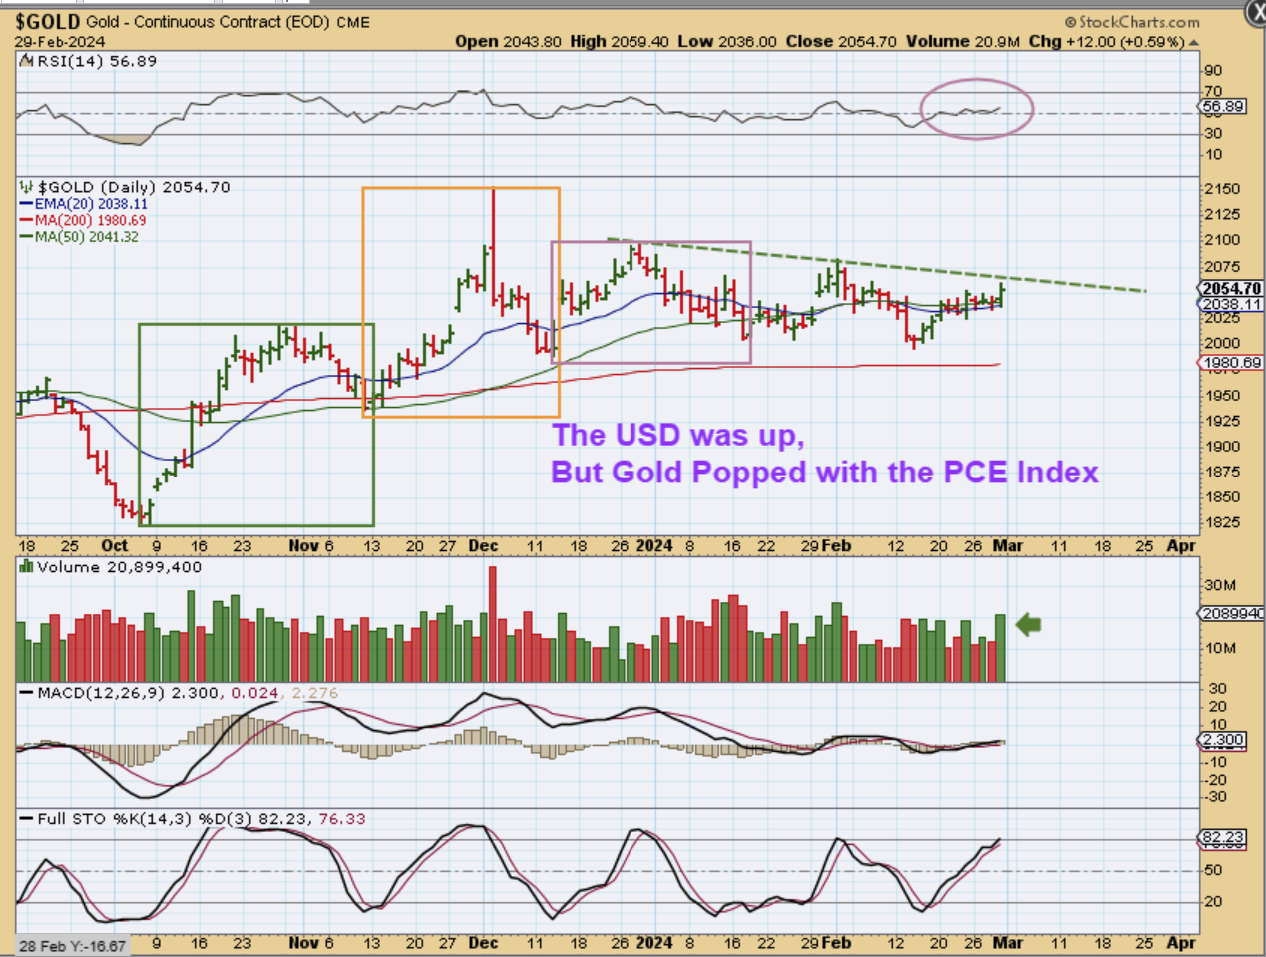
GOLD – Using Stockcharts you get a slightly different look than with Spot Gold, and it didn’t breach the trend line on this chart, but it did go $12 higher on strong volume. This really looks more bullish than bearish and I have been wondering if we have a stealth ICL in a triangle. In fact, take a look at Gold on this chart and…
.
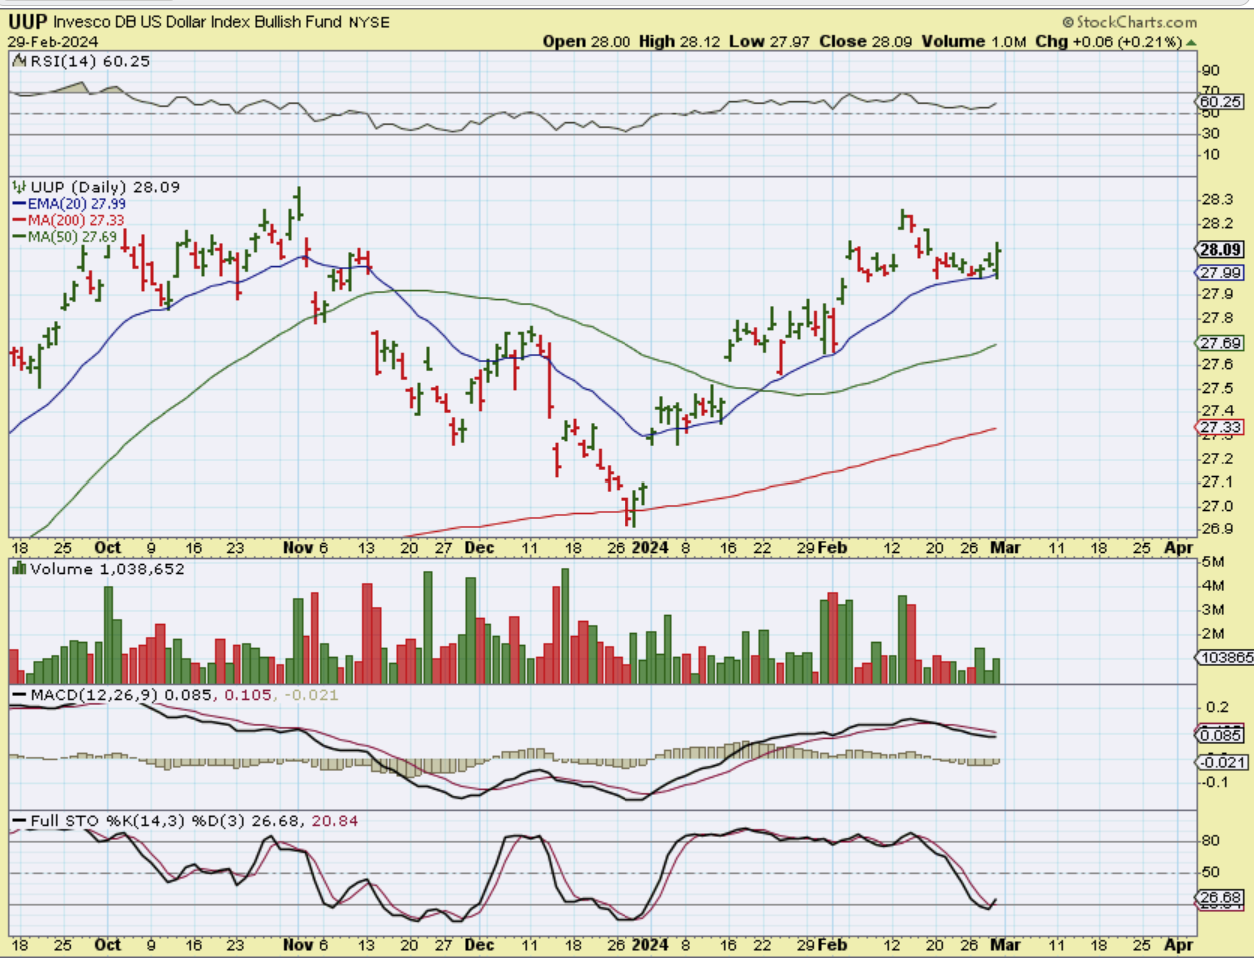
UUP – Take a look at the UUP. So Gold, Silver, The Miners were green and the USD was too, so they all moved higher together. Gold feels like it wants to move higher.
.
SILVER was up over 1% with the USD up too. The MACD is bullish on Silver and it made a higher high when it tagged that 200sma.
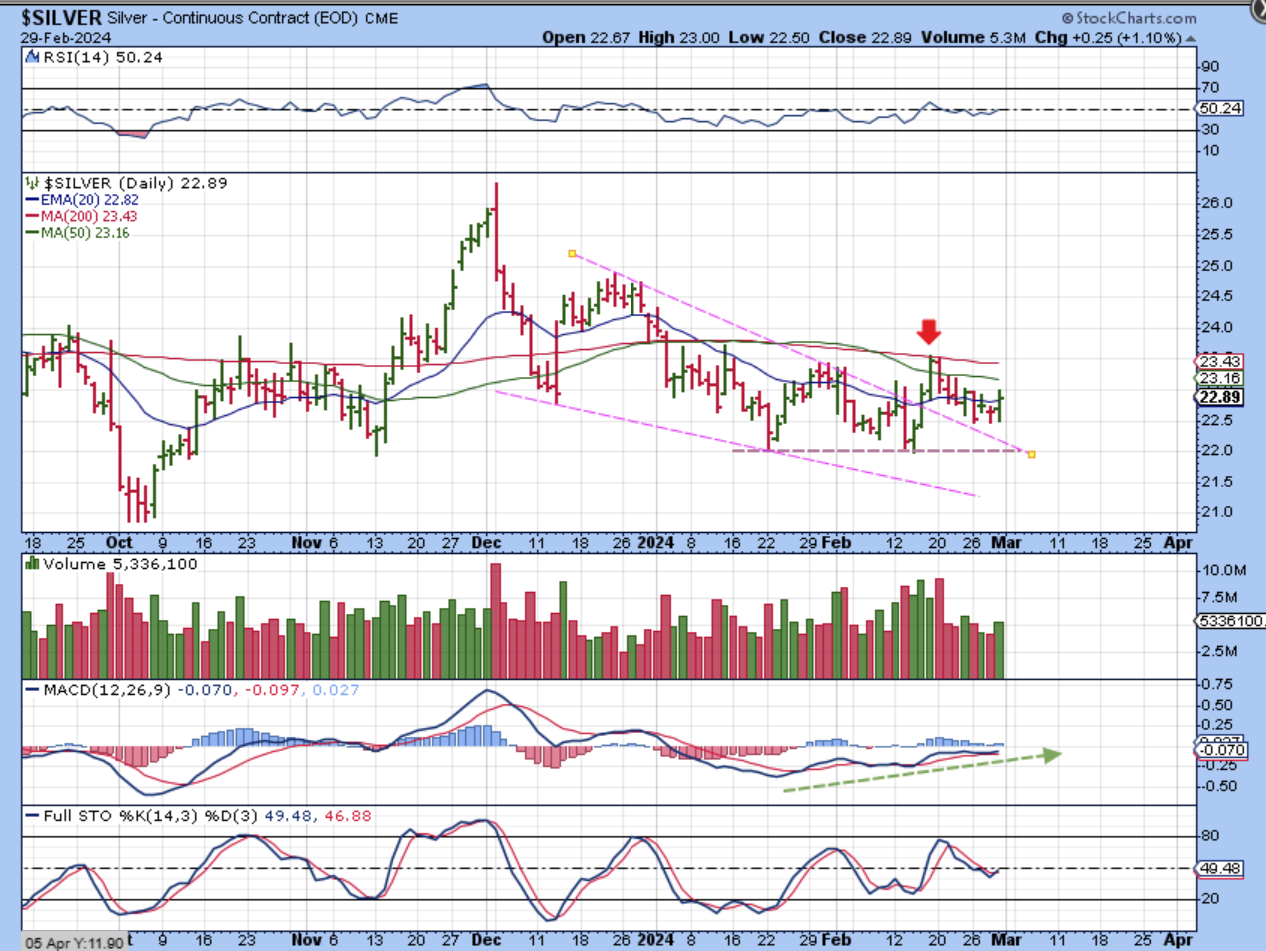
The Good news is that the Miners are still right at their lows and you haven’t missed a thing if the lows are in place for Gold and Silver:
.
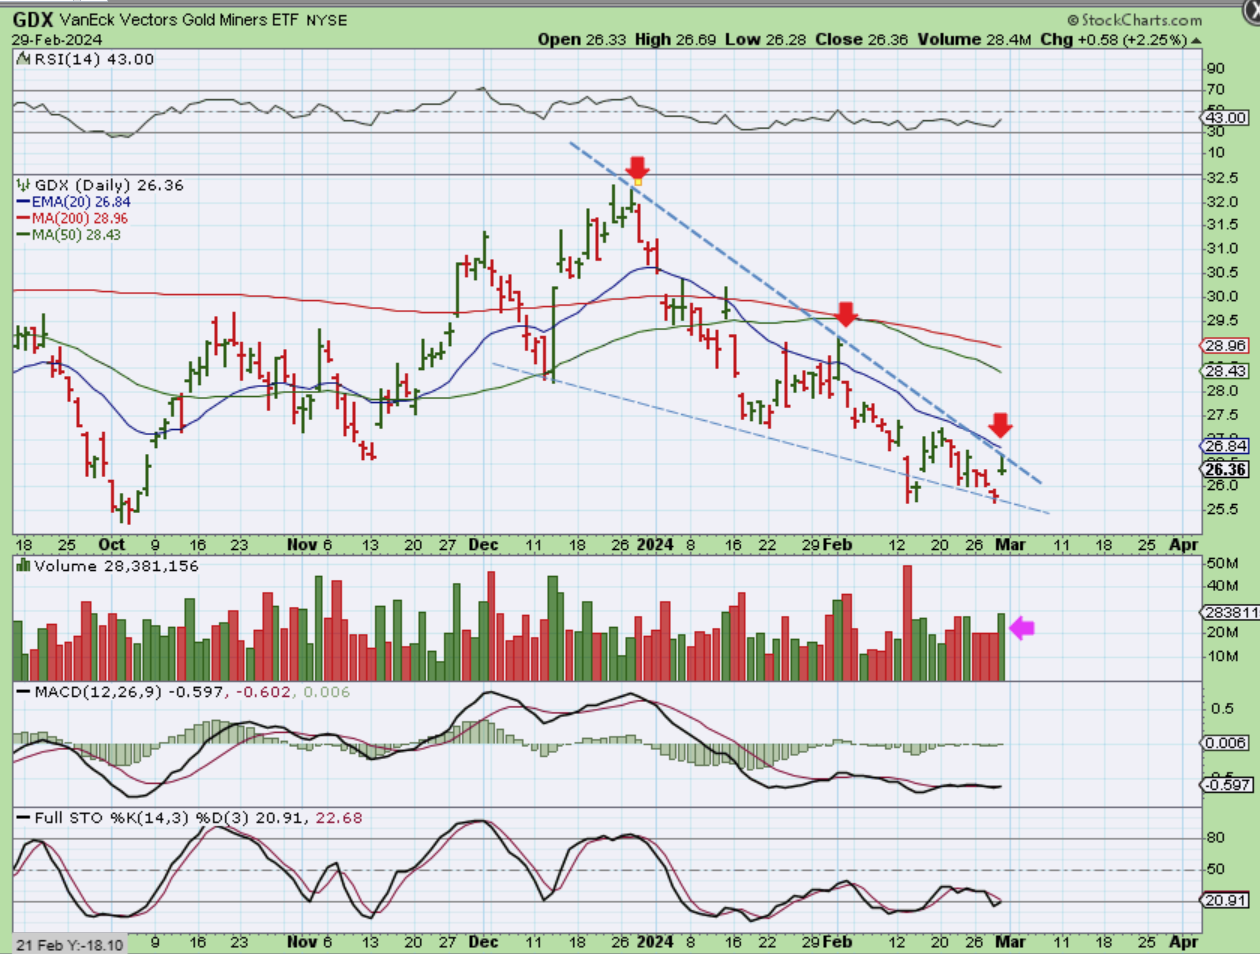
THE GDX was up over 3% at one point and then dropped a little after tagging the 20 ema area and the downtrend. I pointed out the capitulation low and level MACD as possibly being the lows for GDX. A break above the 20 ema or downtrend would have to be viewed as quite bullish at this point.
.
Unfortunately, I have to leave around 8:30 a.m. for the entire day (& Night) on Friday.
We have bullish markets that just won’t sell off, and I cannot ignore the strength that I saw today in Gold at a time that should be late in the intermediate cycle. It is acting like a stealth ICL is in place and I don’t say that just because we have 1 or 2 signs of strength, I see a number of bullish hallmarks. We had that new higher high in Silver too, and a capitulation low in The GDX while Gold was holding up. Add to that the fact that we saw the UUP up, but Gold, Silver, and The Miners were looking strong? You really don’t see that when Gold is ready to drop into an ICL, so I really want to mention again that Gold may not need to drop any further. It may be preparing to break out to all time highs, so let’s stay frosty. I am actually thinking of starting a small basket of Miners before I leave in premarket tomorrow morning. So I will be away, but I can afford to start a basket with stops, I’ll show you why at the bottom of the report. Enjoy yor Friday trading & your weekend.
.
~ALEX
.
Everything that is happening with BITCOIN Vs the Crypto stocks is still a bit perplexing, so I just want to point out a couple of ideas with Bitcoin itself.
.
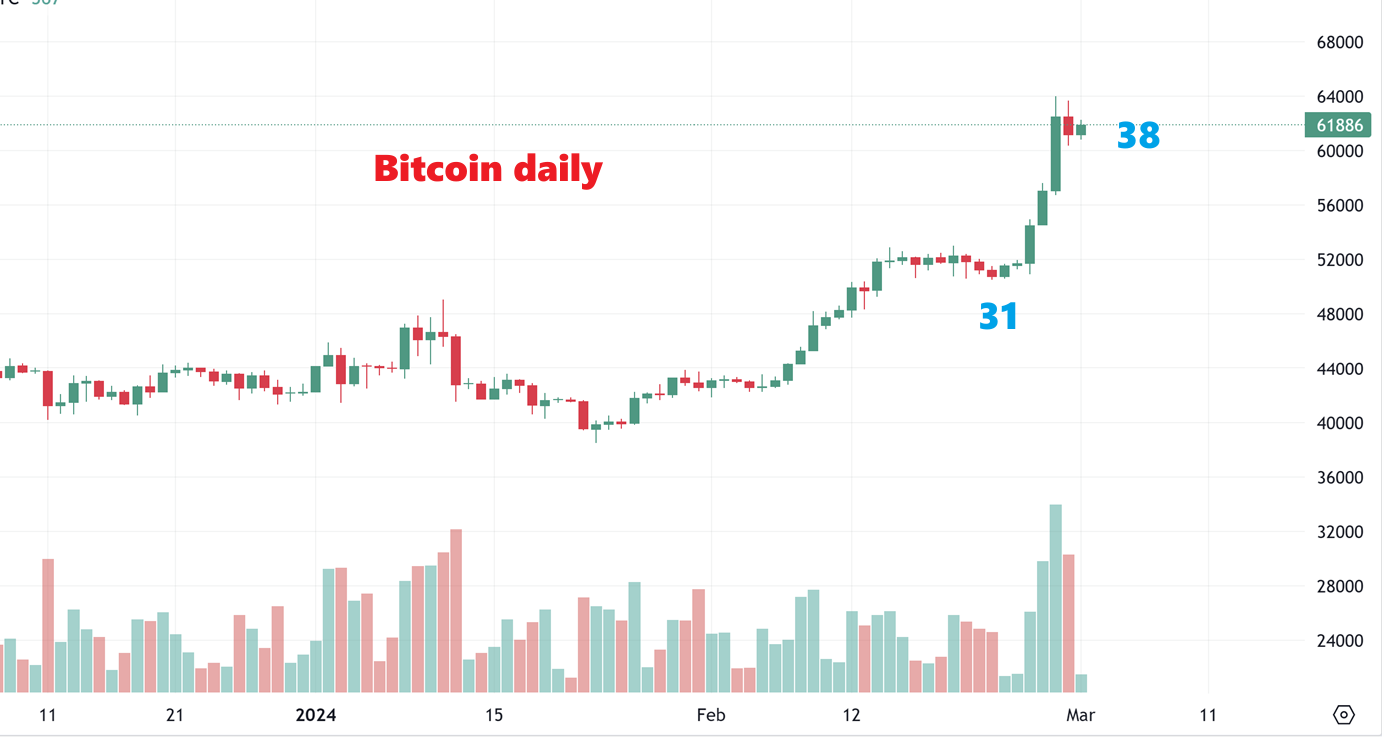
Bitcoin: This is Bitcoin on Friday morning. This tends to look like it wants to form a bull flag and make another run, even though I have been counting 5 waves and that would look complete. Well, a bull flag and continuation is not out of the question due to the cycles timing. It is only day 38 of roughly 60. So…
.
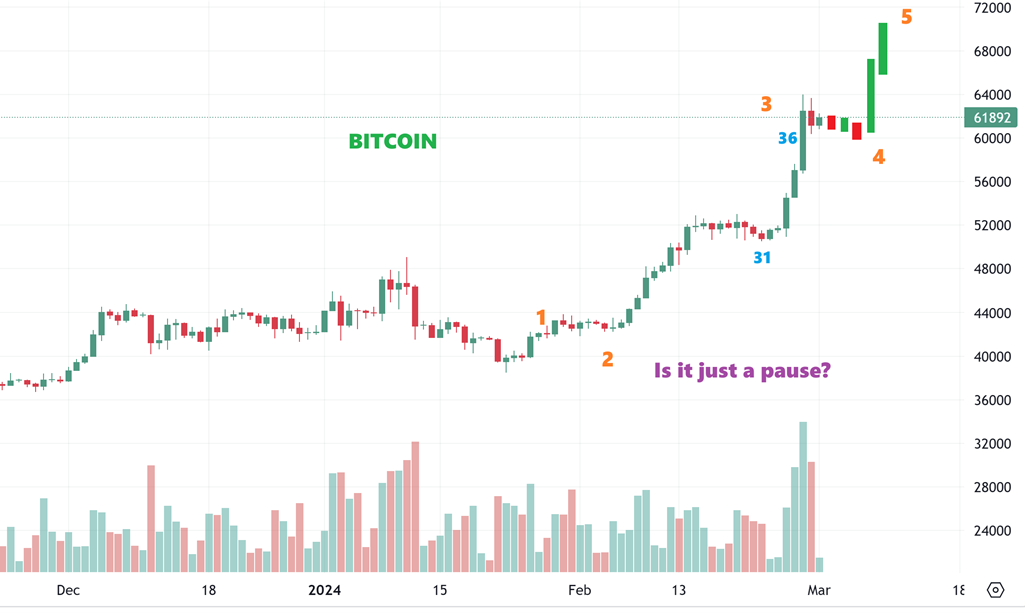
Bitcoin #1: We could extend the middle wave? In this case we could see Bitcoin simply ‘Pause’ here and then continue to run. If THIS happens, I have to wonder if the crypto related stocks pulling back (MARA, RIOT, ETC) simply matches Bitcoins pause, and then they make another run too. This PAUSE could last for a week or so, and those stocks would likely stabilize rather quickly and maybe bottom at support levels. I’ll discuss that next week if I see this playing out. This ‘pause’ also may only last for a couple of days.
.
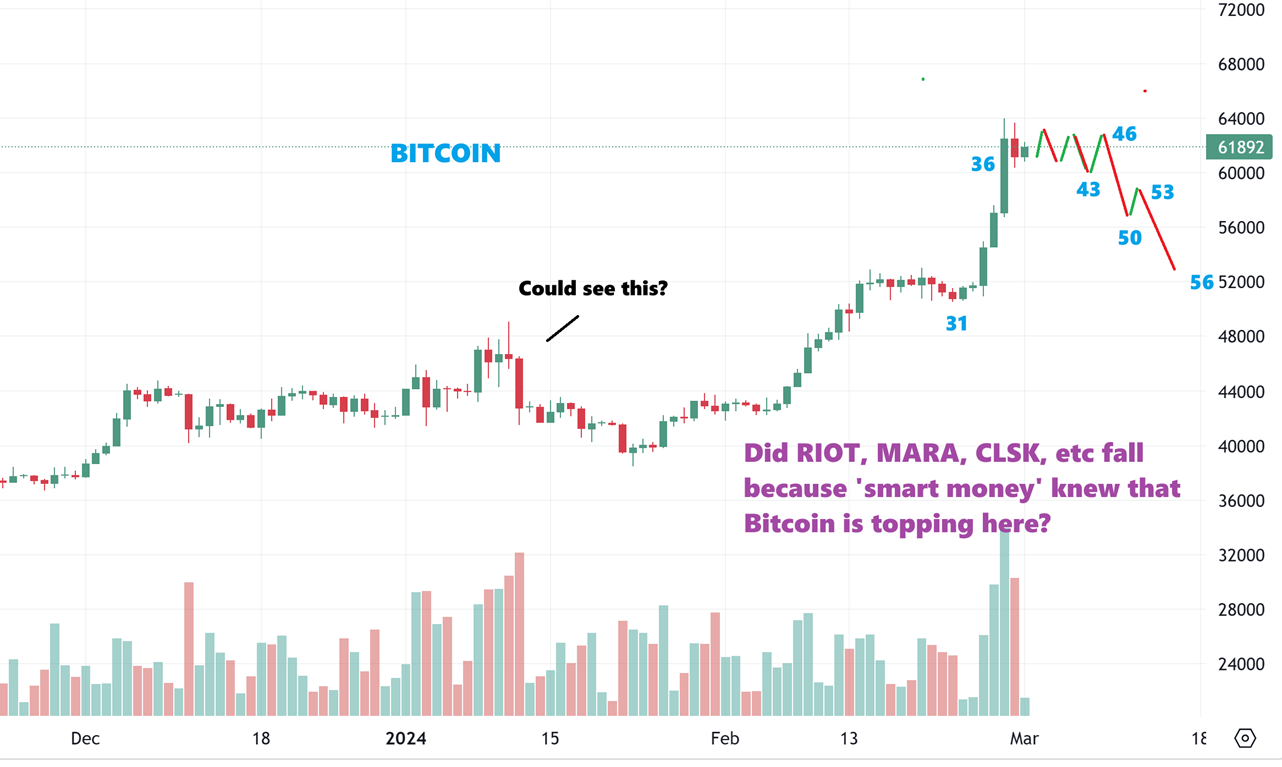
Bitcoin #2: The next scenario is that Bitcoin makes a choppy top in this area and then drops down into the next low around day 60. If THIS scenario plays out, the crypto stocks would settle down later and we’d have to just monitor that situation for support levels over time.
.
RIOT: At this point, all we can do is monitor the support levels and price action, but we could see something along this idea.
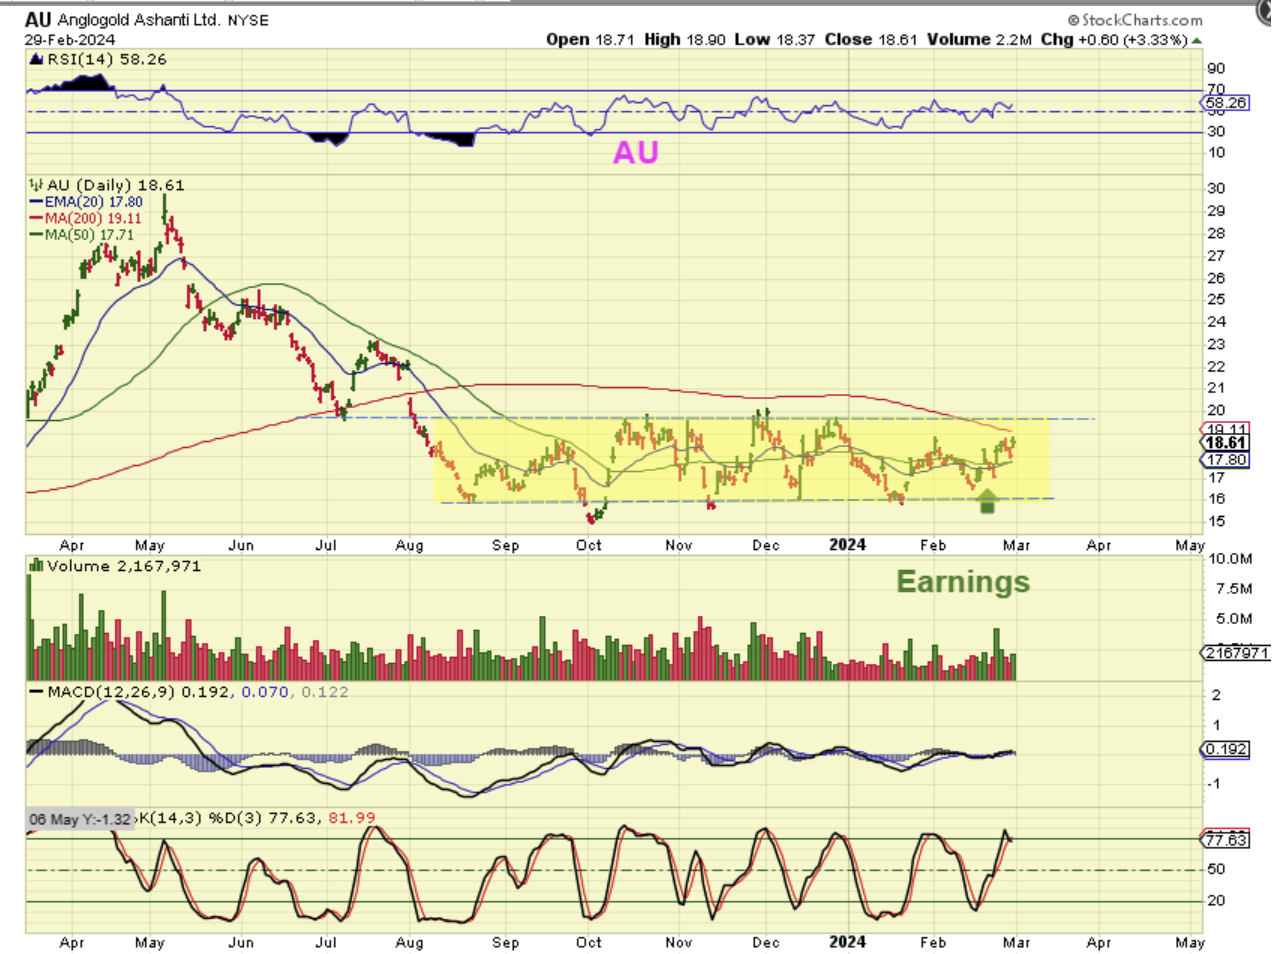
I mentioned that it probably wouldn’t hurt for me to start a small basket of miners. Why? Take a look at how well they are holding up. I can always just buy a few with stops in place, since I wont be in front of my screens all day. I will give you 2 ideas of 2 companies that released earnings recently and they did NOT sell off.
.
AU looks like a LONG base. A breakout above the 200sma will likely lead to a trending move, but they also did already release earnings and the stock has moved higher. The MACD and RSI are bullish. IT CAN CONTINUE TO CHOP, but this base may be the lows and Gold might have a stealth ICL.
.
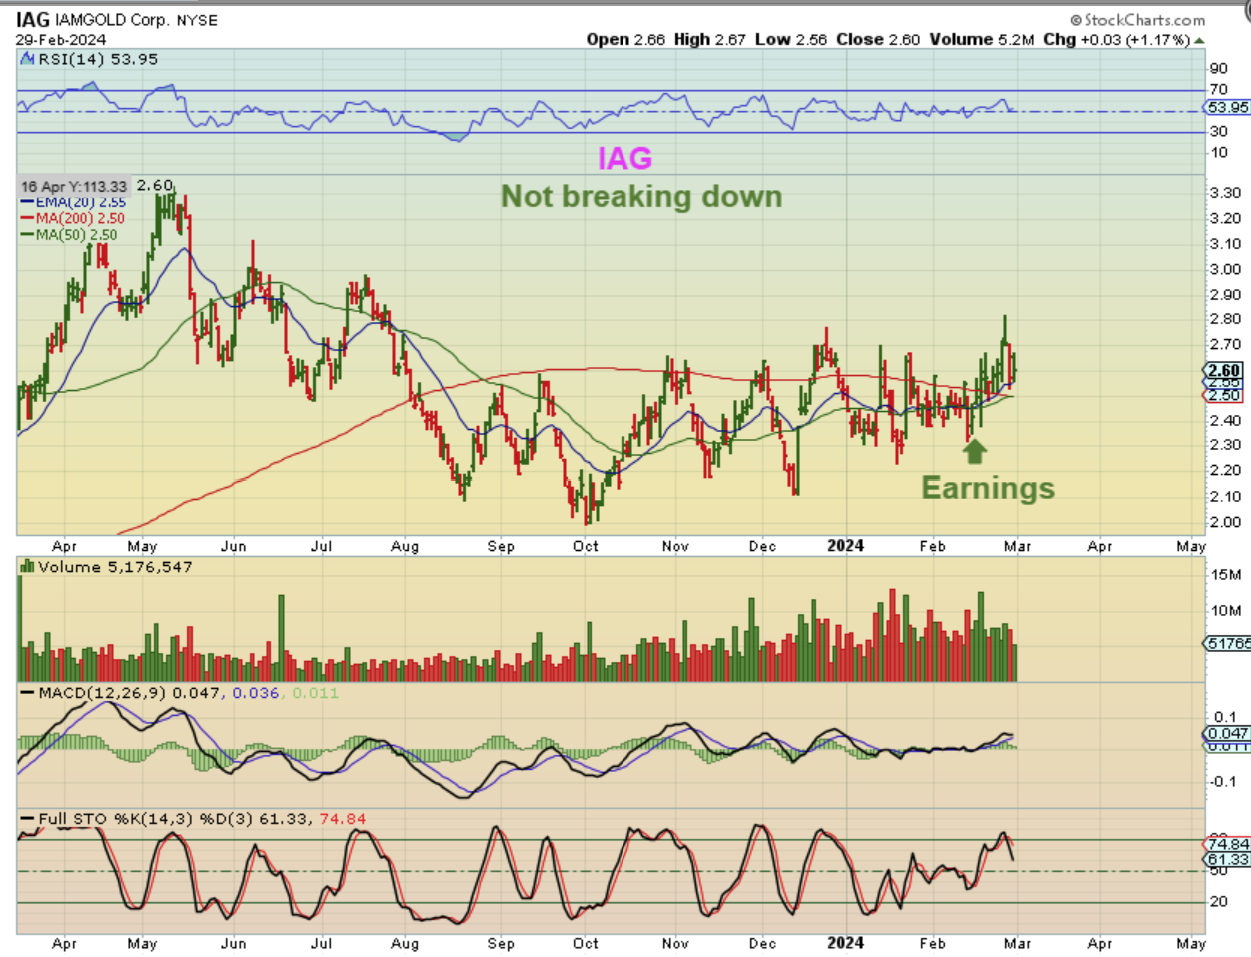
IAG is another company that released earnings (Feb 15th) and price has ‘chopped’ higher. IAG did already break above the 50 & 200sma, so even though this is horribly choppy, it could start to trend higher when the time is right. I want to buy it with a stop at the 50sma & 200sma (Both are at $2.50, so maybe a little wiggle room).