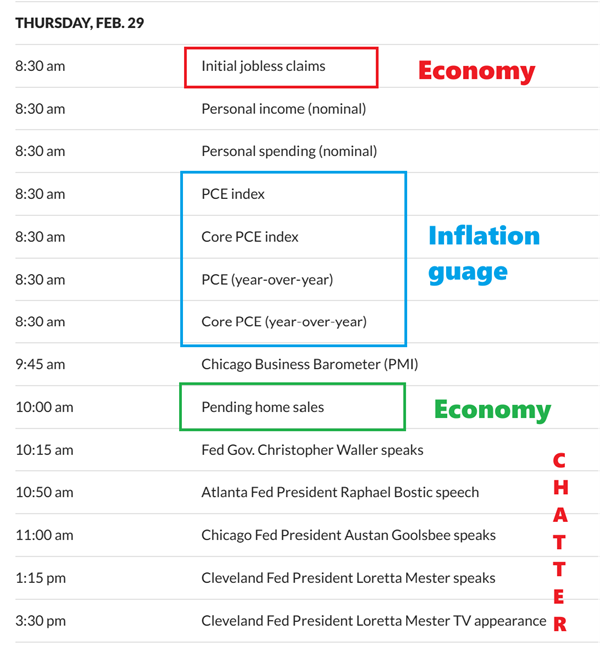
Thursday Feb 29
Data Release on Thursday: Well, let’s throw all of this at the markets and see if we can start that drop into a dcl?
.
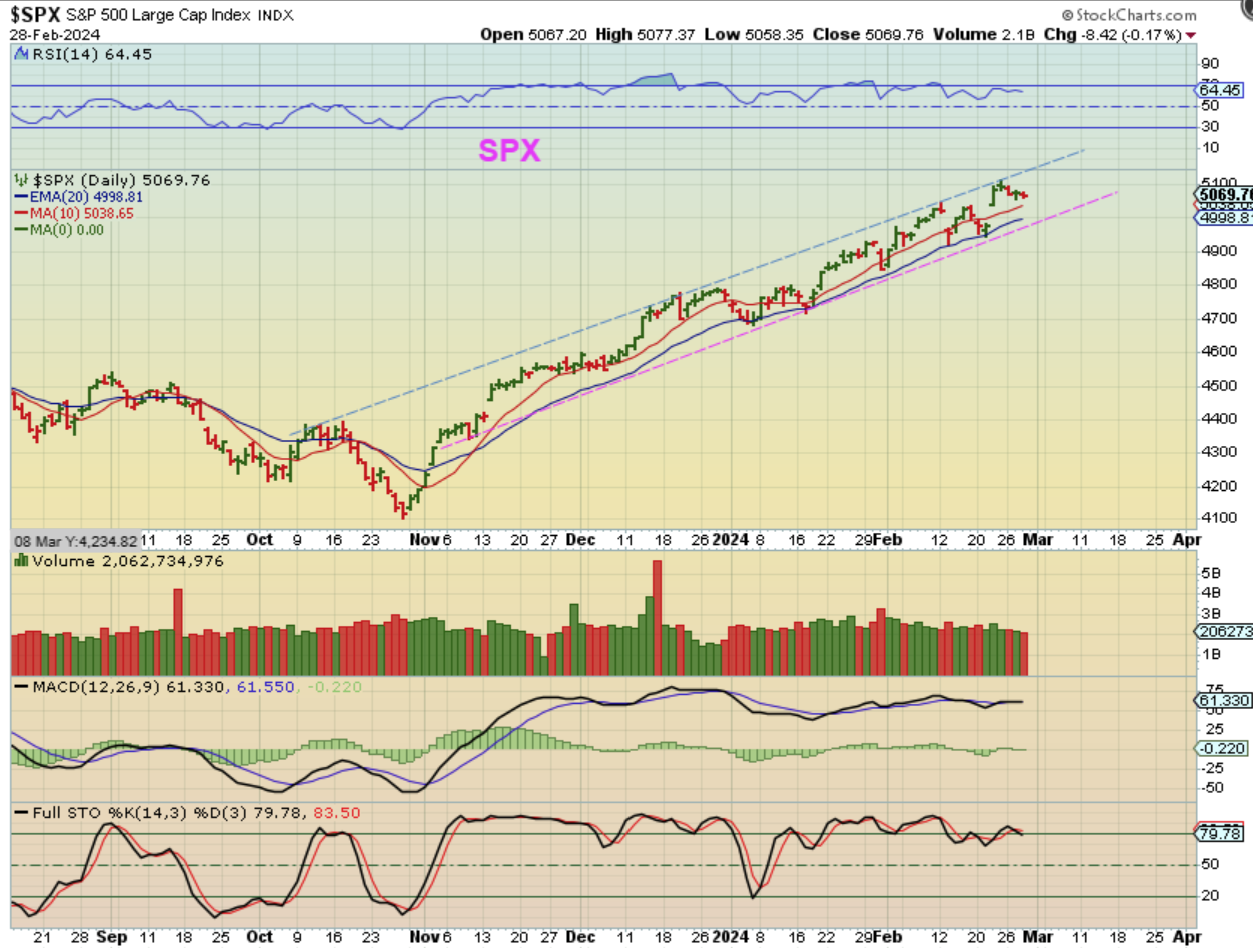
The SPX and the General Markets are strong and this second daily cycle has been strong in this bull run, but on day 36, we should be close to the time that we could dip into a dcl. Todays data MIGHT BE the catalyst that starts that drop, but I don’t think that I’d go short here. We could see a rally Thursday & Friday and then drop next week.
.
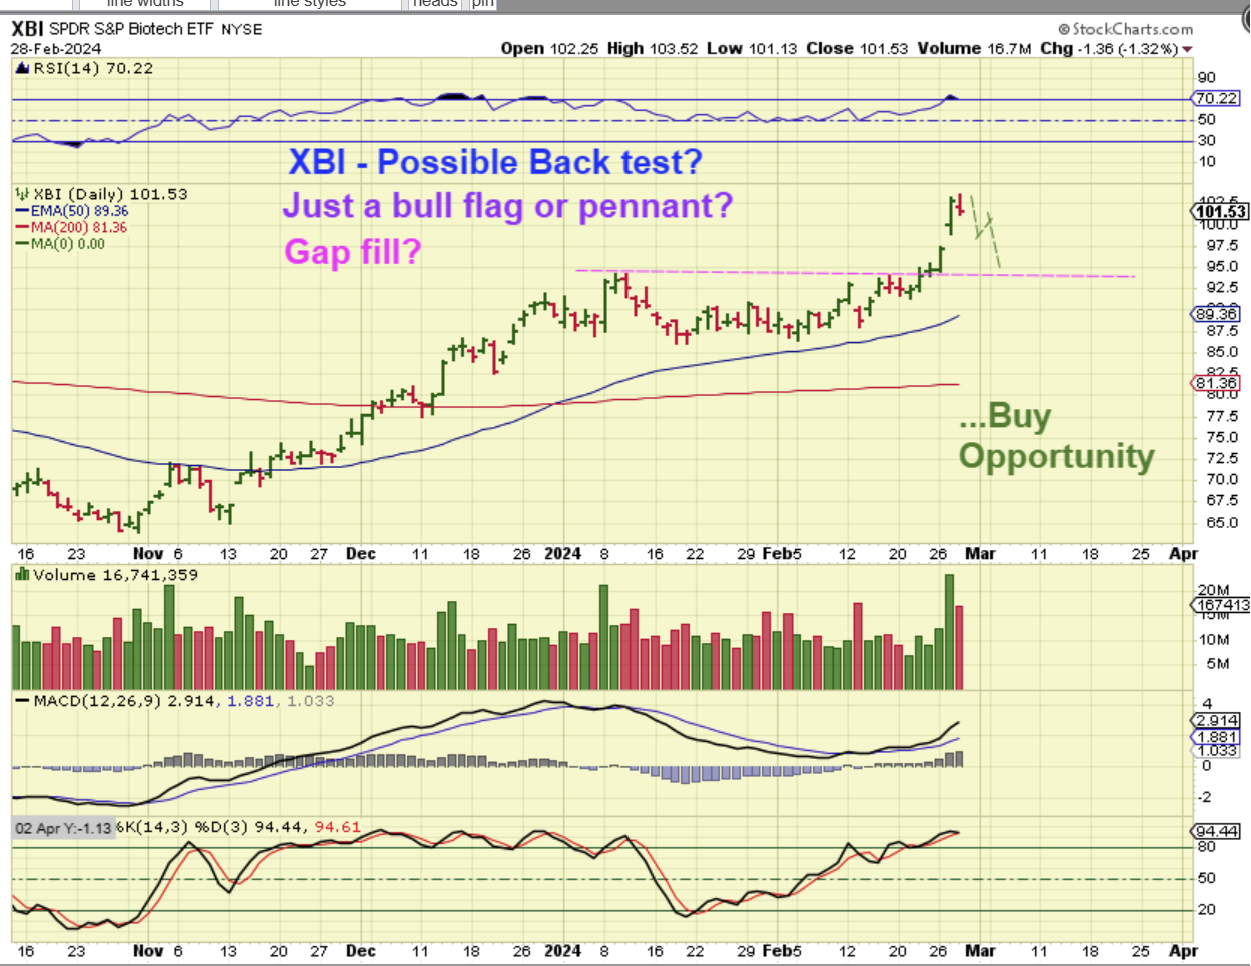
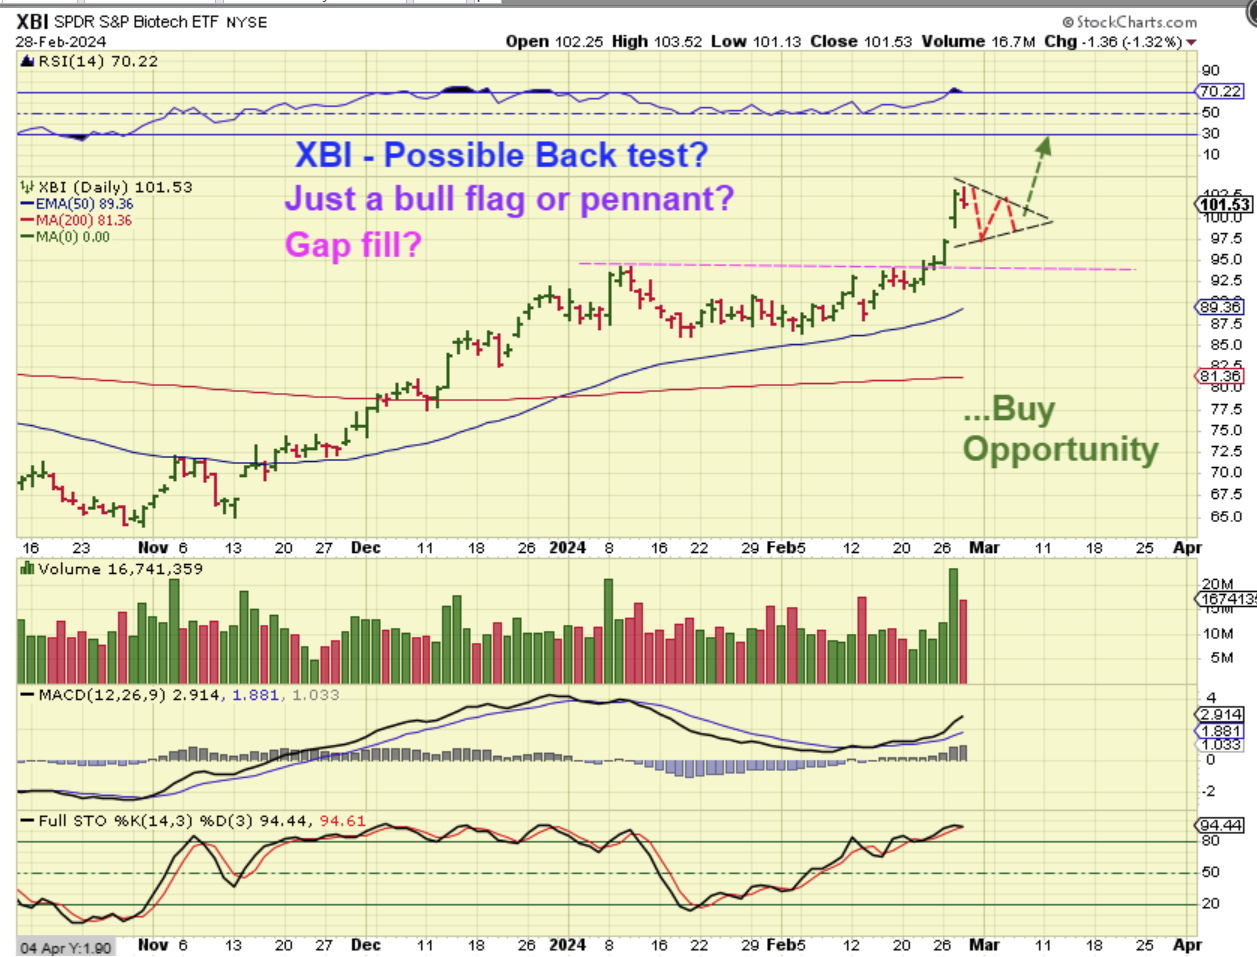
THE BIOTECHS PAUSED, and I got to thinking that it is possible that we get a mild dip here when the General Markets drop into a dcl, so let’s talk about the possibilities, since they would be a nice buying opportunity. I also want to add that some stronger Biotech stocks may not dip if this happens. They can churn sideways.
.
XBI #1 – The Biotech’s paused and it got me thinking that MAYBE when the markets drop into a dcl, we may just see a small dip or bull pattern form, that fills that gap. This would be a simple back test, and they are not uncommon. Even more bullish than this would be…
.
XBI #2 – A pennant. A pennant is still capable of just doing a gap fill and holding up on maybe the 10sma (not shown, but it is currently right under the gap). These are bullish buying opportunities for LABU or some of the Biotech stocks that pull back, so I want to watch how this plays out and if we do get this dip when the General markets put in a dcl, it will be easy to find some of the more bullish Biotech stocks pulling back to support for a buy opportunity.
.
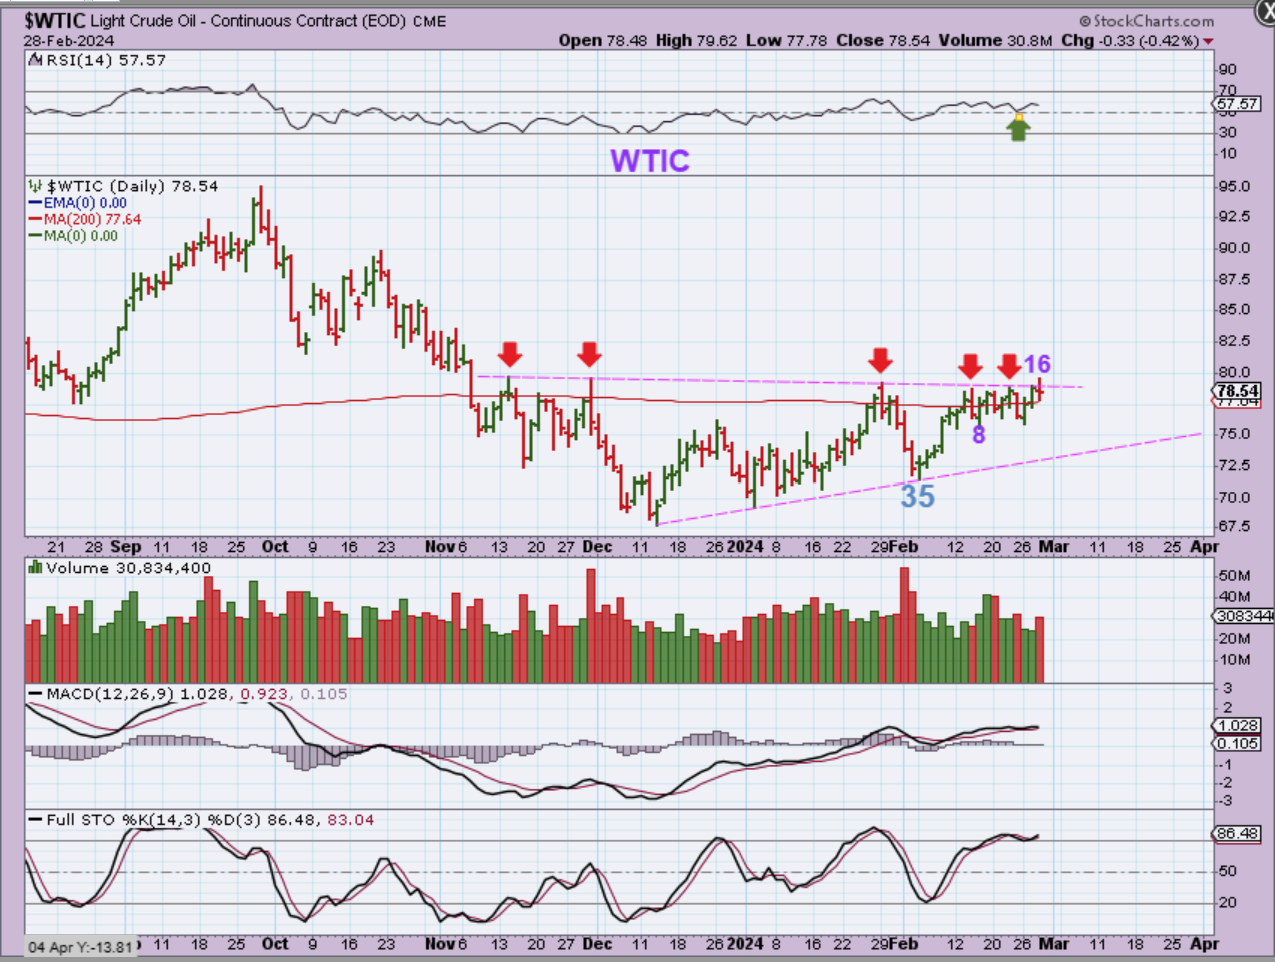
WTIC – Oil continues to try to break out above the 200sma with some follow through. This is day 16 of a possible 45+ days in a daily cycle.
NOTICE THAT PRICE HIT THE $79.62 area AND WAS REJECTED. Even though it is above the 200sma on a daily chart…
.
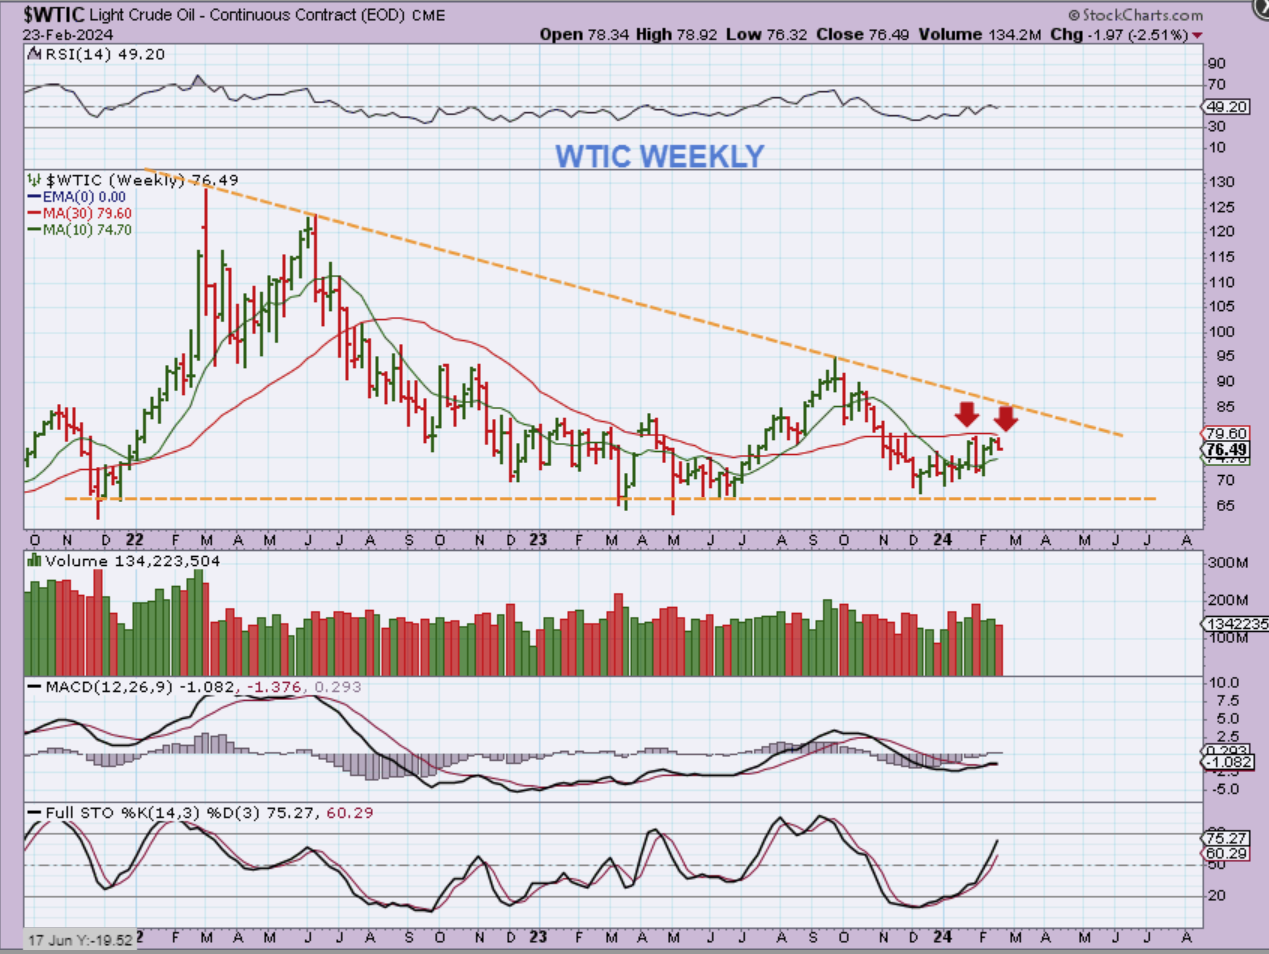
Even though it is above the 200sma on a daily chart, I pointed out the 30 week ma on the weekly chart as resistance too.
.
WTIC WEEKEND – This chart is from the weekend report, but above I said to ‘NOTICE THAT PRICE HIT THE $79.62 area AND WAS REJECTED’. That is where that 30 week ma is.
.
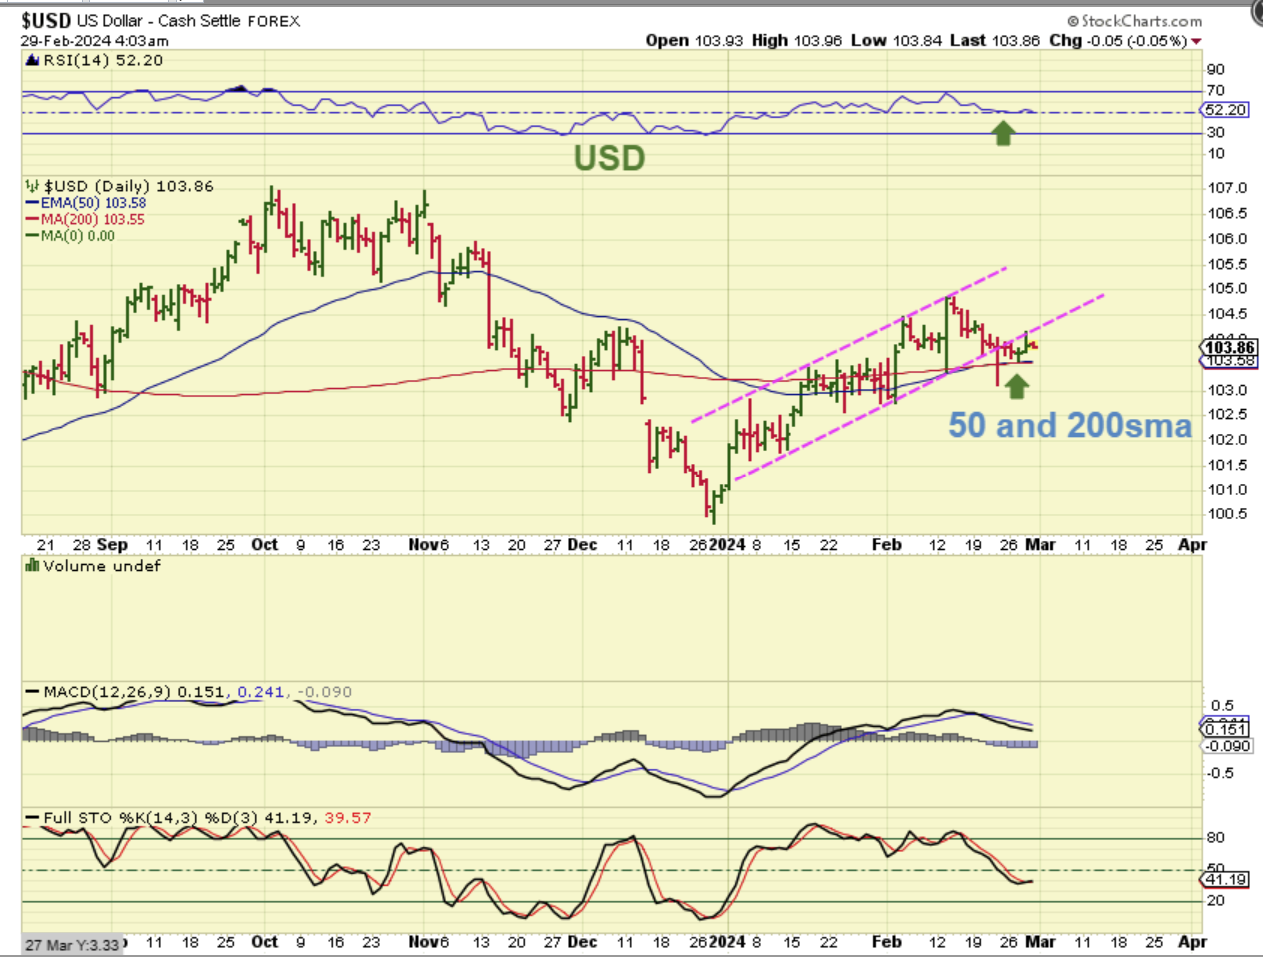
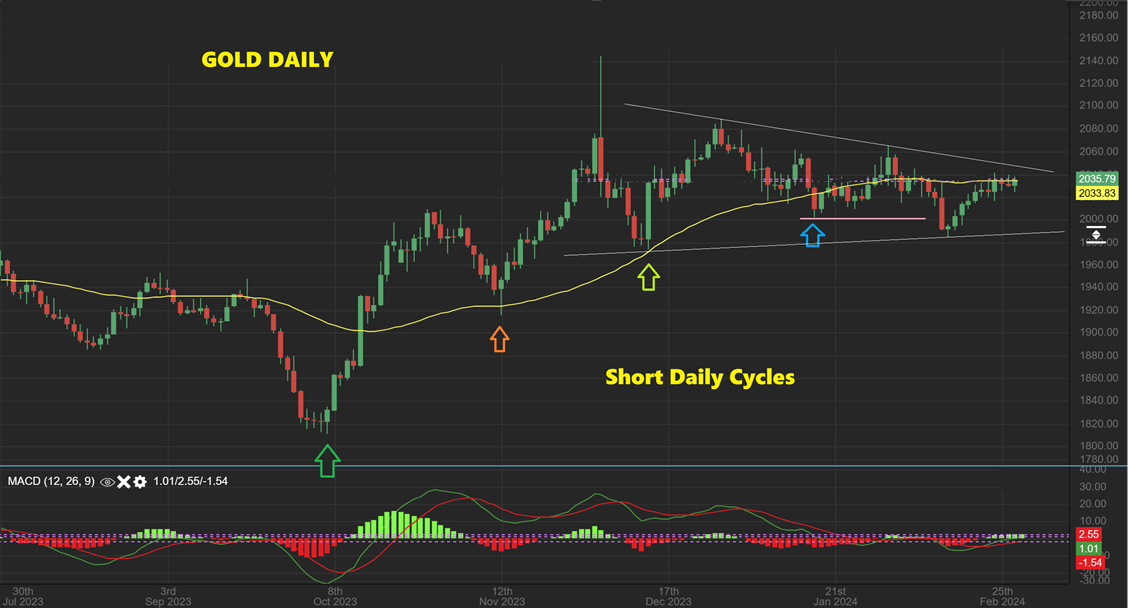
THE USD is sitting or chopping along the 200sma this week. It was Popping and looking strong coming out of the lows recently, until the Fed Minutes were released. It has been weaker since last Wednesday. As it churns sideways, Gold churns sideways too.
.
GOLD – I have been saying that Gold just doesn’t look weak, especially for a 4th or 5th daily cycle. IF THIS BREAKS OUT HIGHER, then we must have a stealth ICL in place, formed within a triangle, but that would be very uncommon. That said, it also matches what we see with Silver and GDX, so let’s take a look…
..
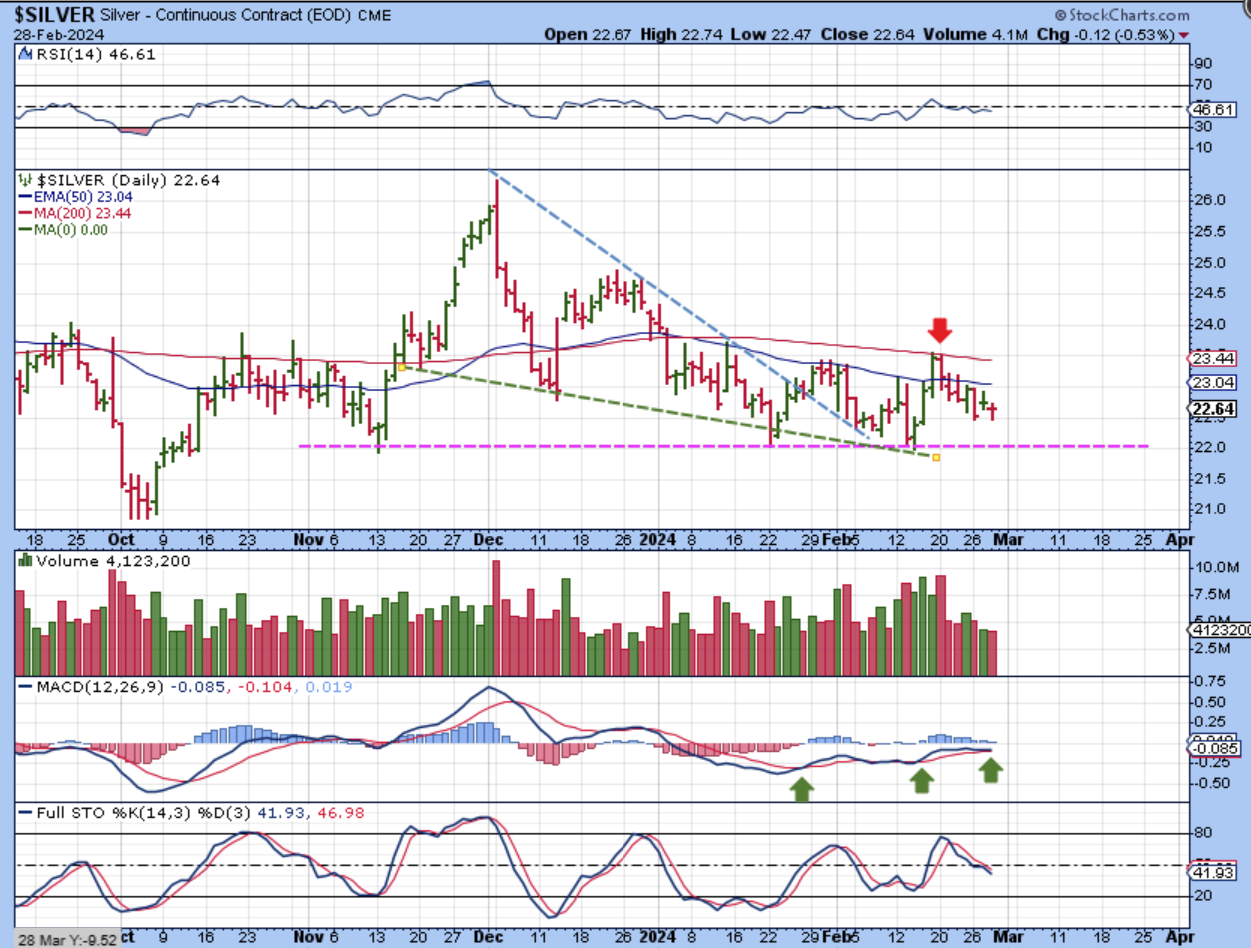
SILVER:
1. Made a new low on Feb 14.
2. Made a new high as it tagged that 200sma
3. It broke from a bull wedge and back tested it with divergence (That MACD is rising).
4. So the chart is set up bullishly, but I don’t trust it yet (because we should be waiting for a sharp drop into an ICL).
.
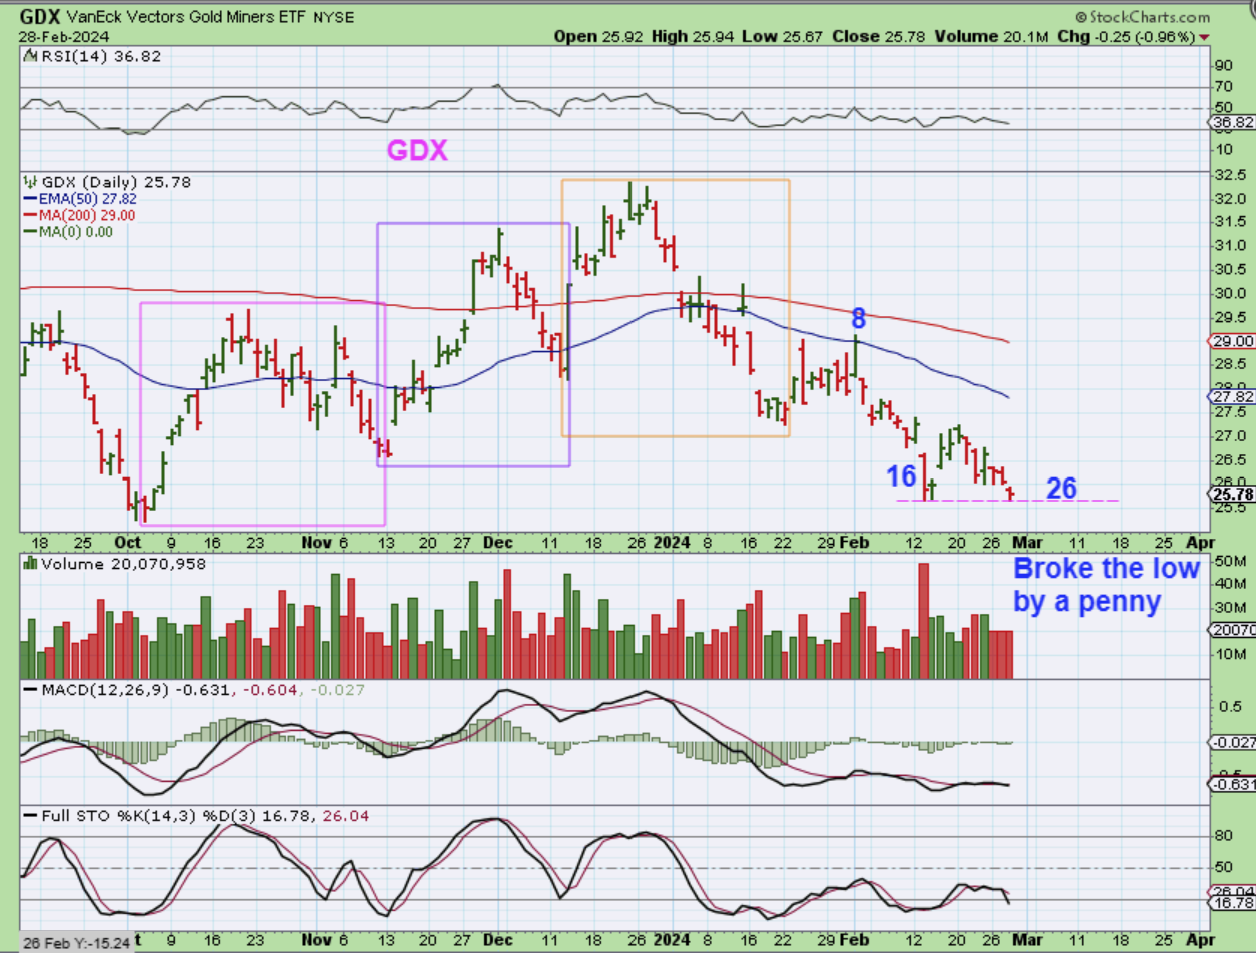
THE GDX ETF broke the lows today, so while I was wondering if that other low at day 16 or 17 was a very short daily cycle, I would now be more comfortable saying that we are on day 26. The MACD is not a lower low.
.
Today we have a good amount of market moving data to be released, especially at 8:30 with the Jobless Claims and The PCE numbers, so we’ll see how that affects things in the premarket. Below I will discuss Bitcoin and the Crypto Miners. Enjoy your Thursday trading.
.
~ALEX
.
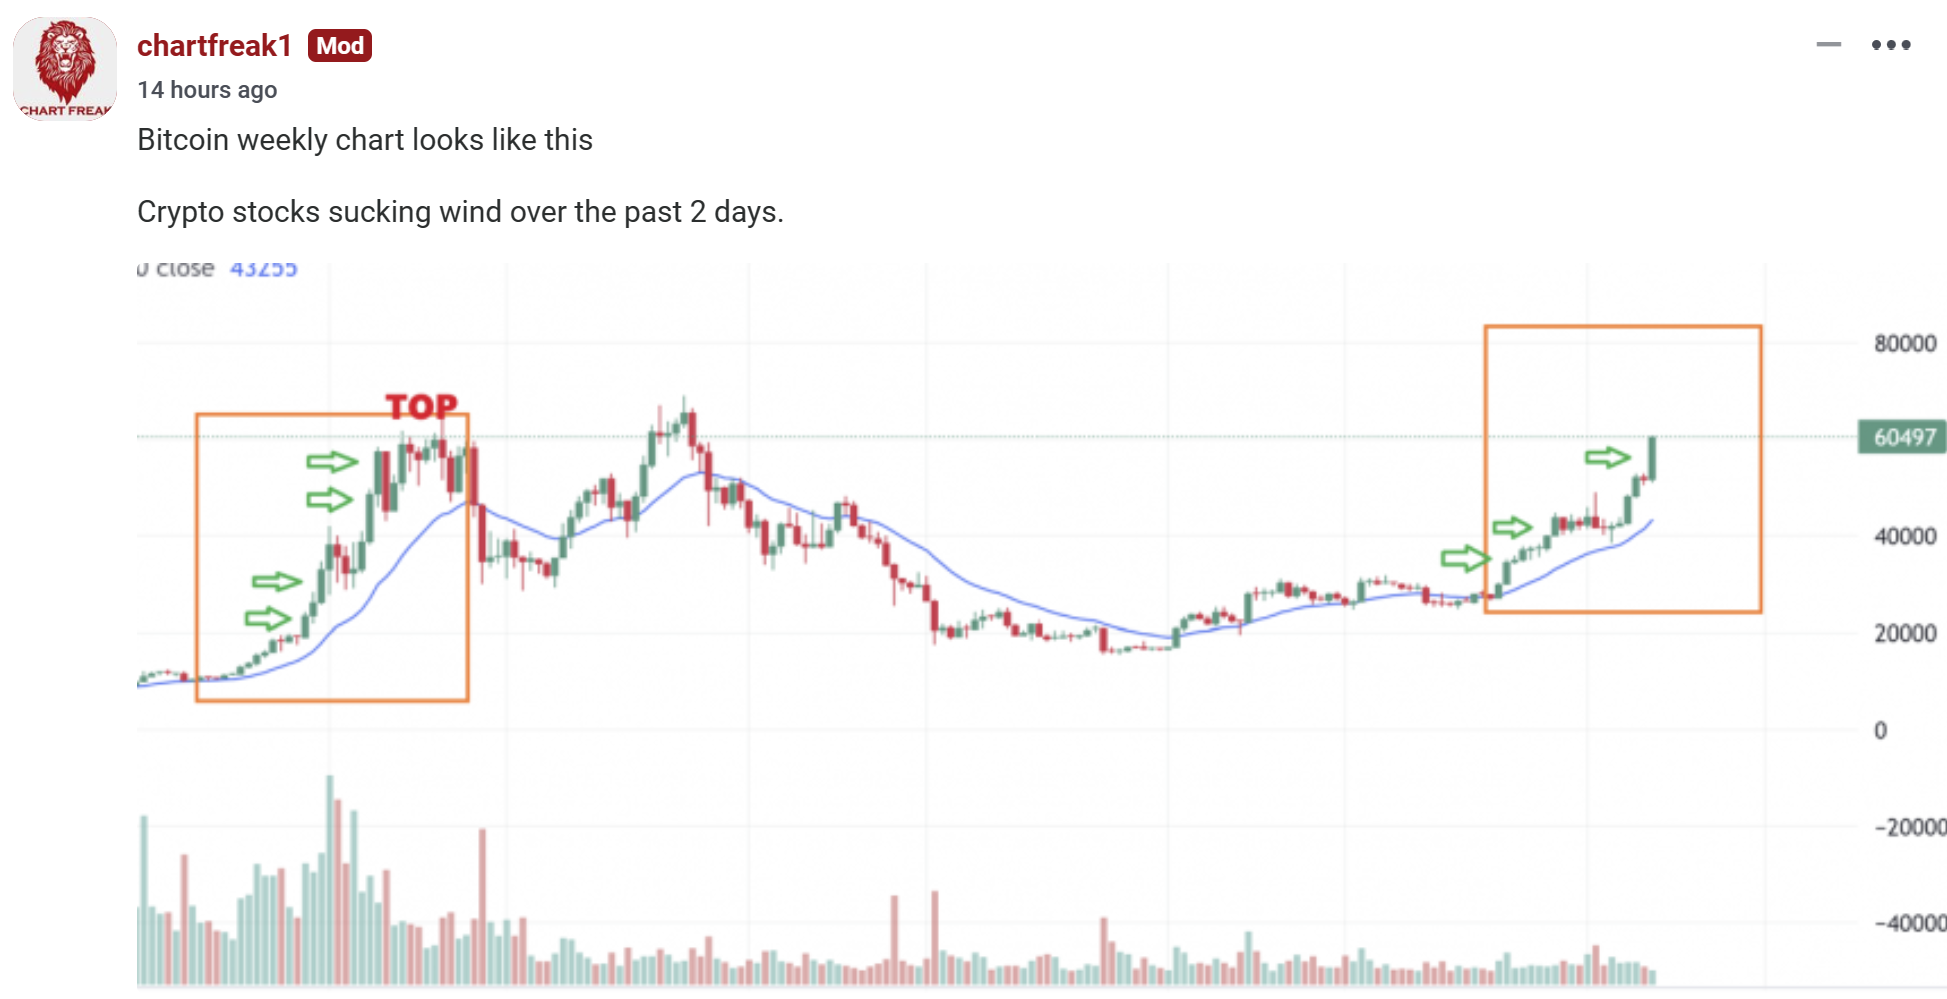
I want to start this section of the report off by sharing my disappointment and even frustration with how things started to play out on Tuesday and Wednesday of this week. I also feel bad for others that may have just now decided to start trading in this area, because they were seeing Bitcoin rally day after day. This week the Crypto Miners gapped open and then pulled back twice as Bitcoin surged higher. I actually did very well in this sector in October to January, and now with this leg up in Bitcoin, I have chopped into those gains and given a chunk back, so I will discuss that when we get to the Crypto-Miners part of this report.
.
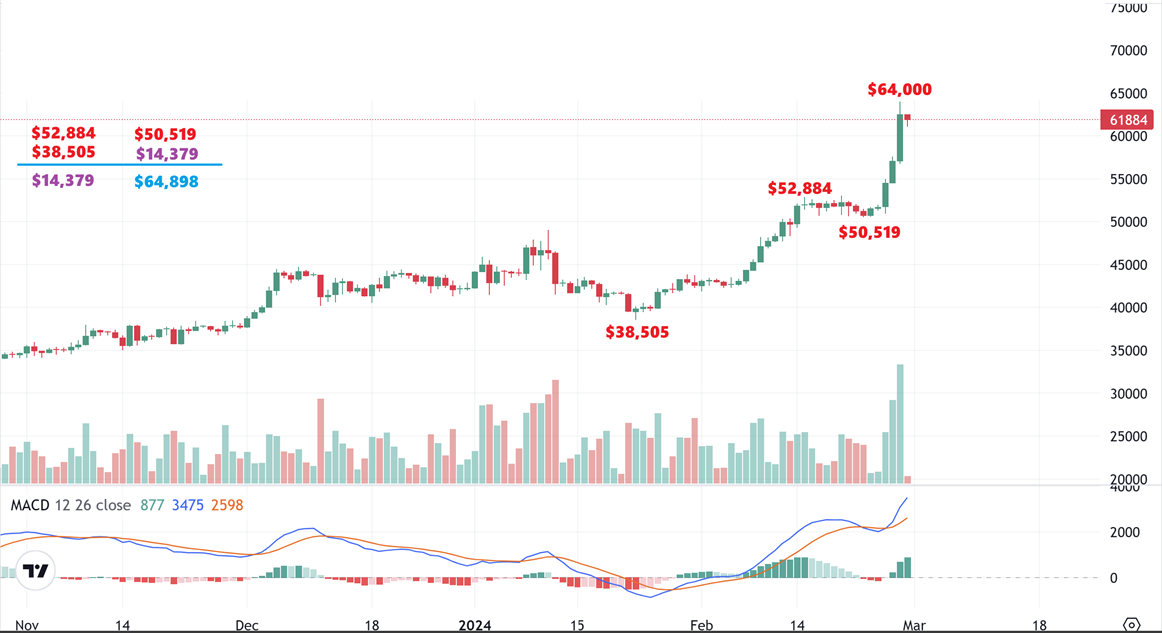
BITCOIN has actually almost reached a target that I had at roughly $65,000 ($64,898). This target, however, is what I call a ‘One to One’ target or a 1X1 move. I didn’t mention this target earlier, because you can see a Fibonacci extension making the move 1 x 1.382, or 1 x 1.5, etc., and that would put it much higher. So let’s just say that one of my initial price targets has pretty much reached.
.
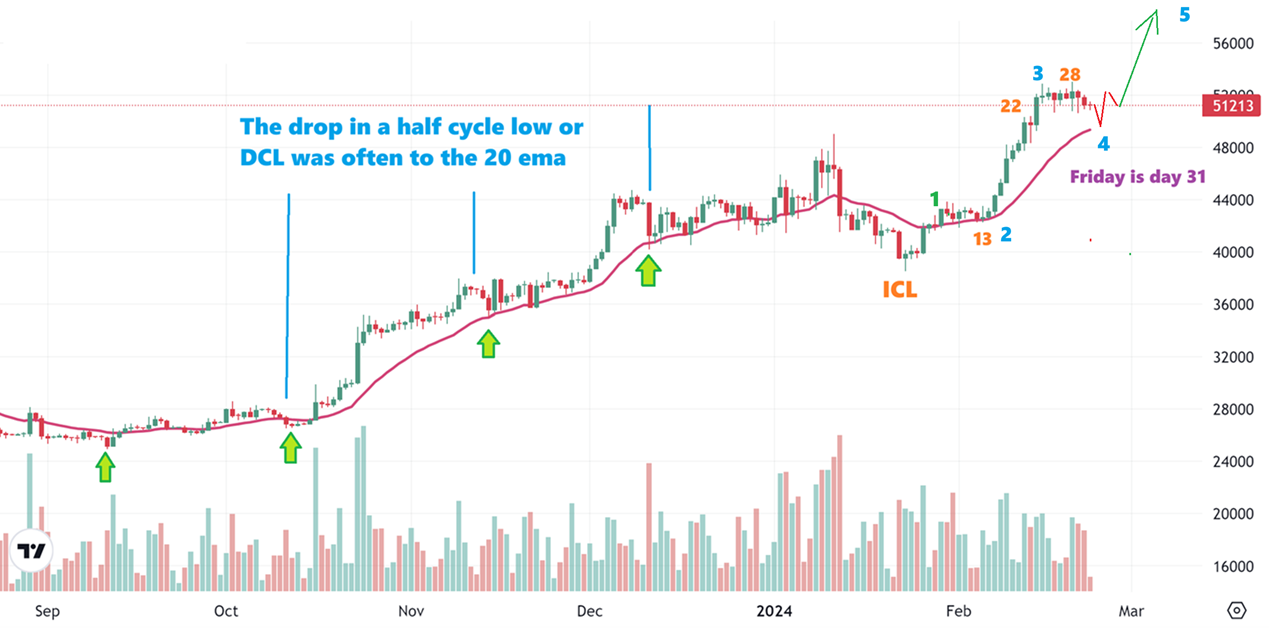
I showed this view of a WEEKLY BITCOIN CHART to show a couple of things.
1. We are now almost at the all-time highs
2. I have heard people say that the current move is MUCH STRONGER than any other time that bitcoin rallied, but here you can see that we have seen very strong surges in the past too. I have compared this to the post having rally in 2020. This kind of a move is actually where it topped.
3. This is a strong push to the former highs and yet HUT, WULF, CLSK, etc were down for the day at this point. They also are not even close to their prior highs, and that is Extremely frustrating. I honestly cannot give you the real reason why they dropped on Tuesday and Wednesday. I think that you will hear many ‘guesses’ and people will try to explain it away, “They may be predicting Bitcoin is going to top’ – or – “Everyone is buying the ETF or Alt Coins now instead’, etc, but that doesn’t fit what was happening leading up to Tuesday and Wednesday. Also, these companies that own & produce Bitcoin can make excellent gains from a higher bitcoin price. Really, no one would have predicted that with Bitcoin running like this to prior highs, the stocks would be dropping. It’s simply frustrating.
,
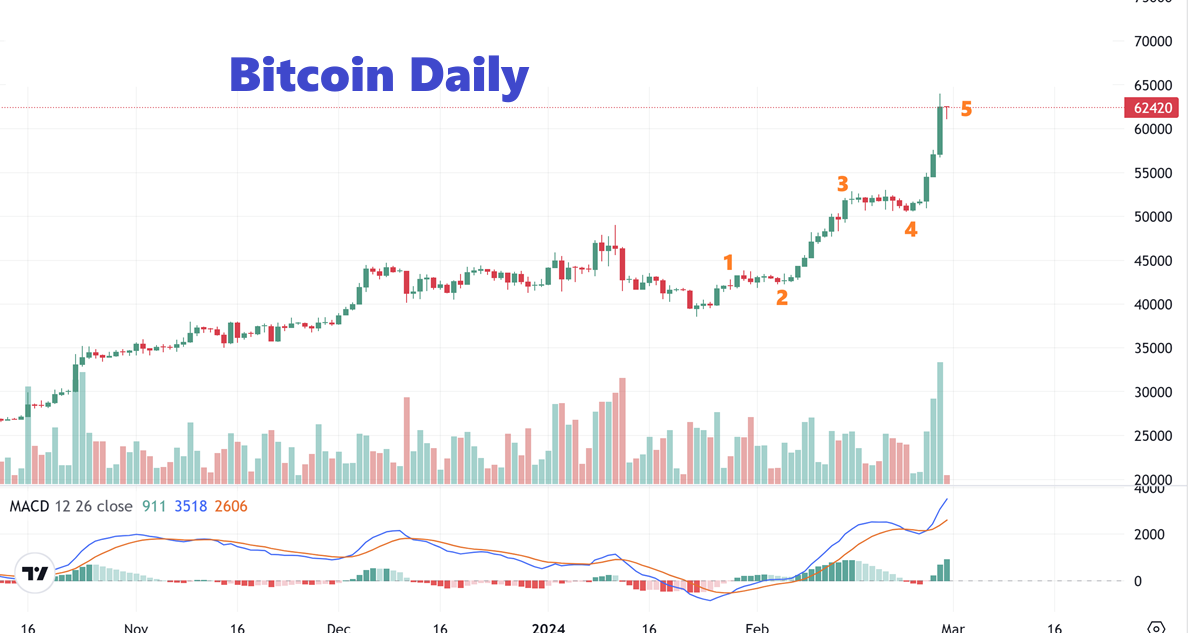
So recently I drew Bitcoin as putting in a 5 wave rally higher too, not to really give us an upside target, but just to give us an idea of what BITCOIN might do on that next leg higher. This is where that measured move was $64,898 (not drawn on the chart).
,
At this point, Bitcoin has done a nice 5 wave move so far (again, this can extend). Are the Miners predicting that Bitcoin tops here, and is smart money ‘profit taking’ each morning gap open? I tend to think so, but I cannot prove it. I want to continue to watch and learn from what we see now and apply it in the near future.
.
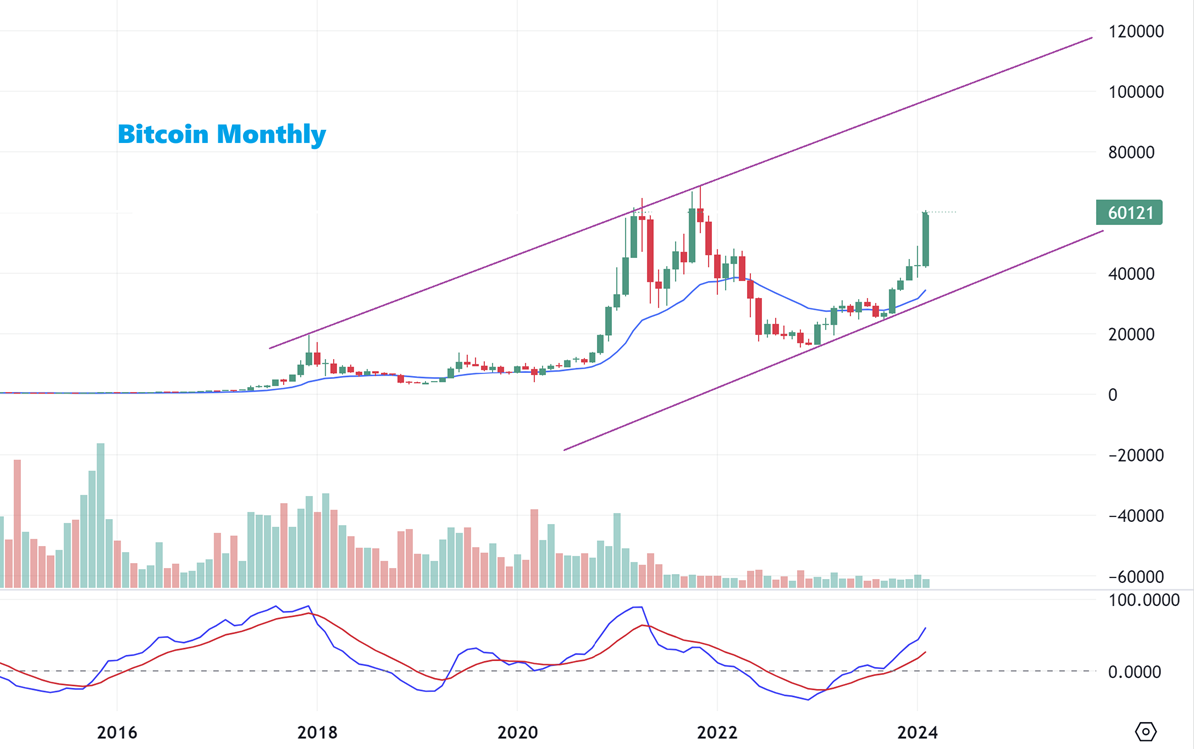
Someone asked me if I really thought that Bitcoin could run to $120,000 in 2024, like I had mentioned in one of my reports.
.
I drew a BITCOIN Monthly Chart like this for you, to show you that it would not look all that ridiculous at all if it were to happen. Yes, I do think that it can happen.
.
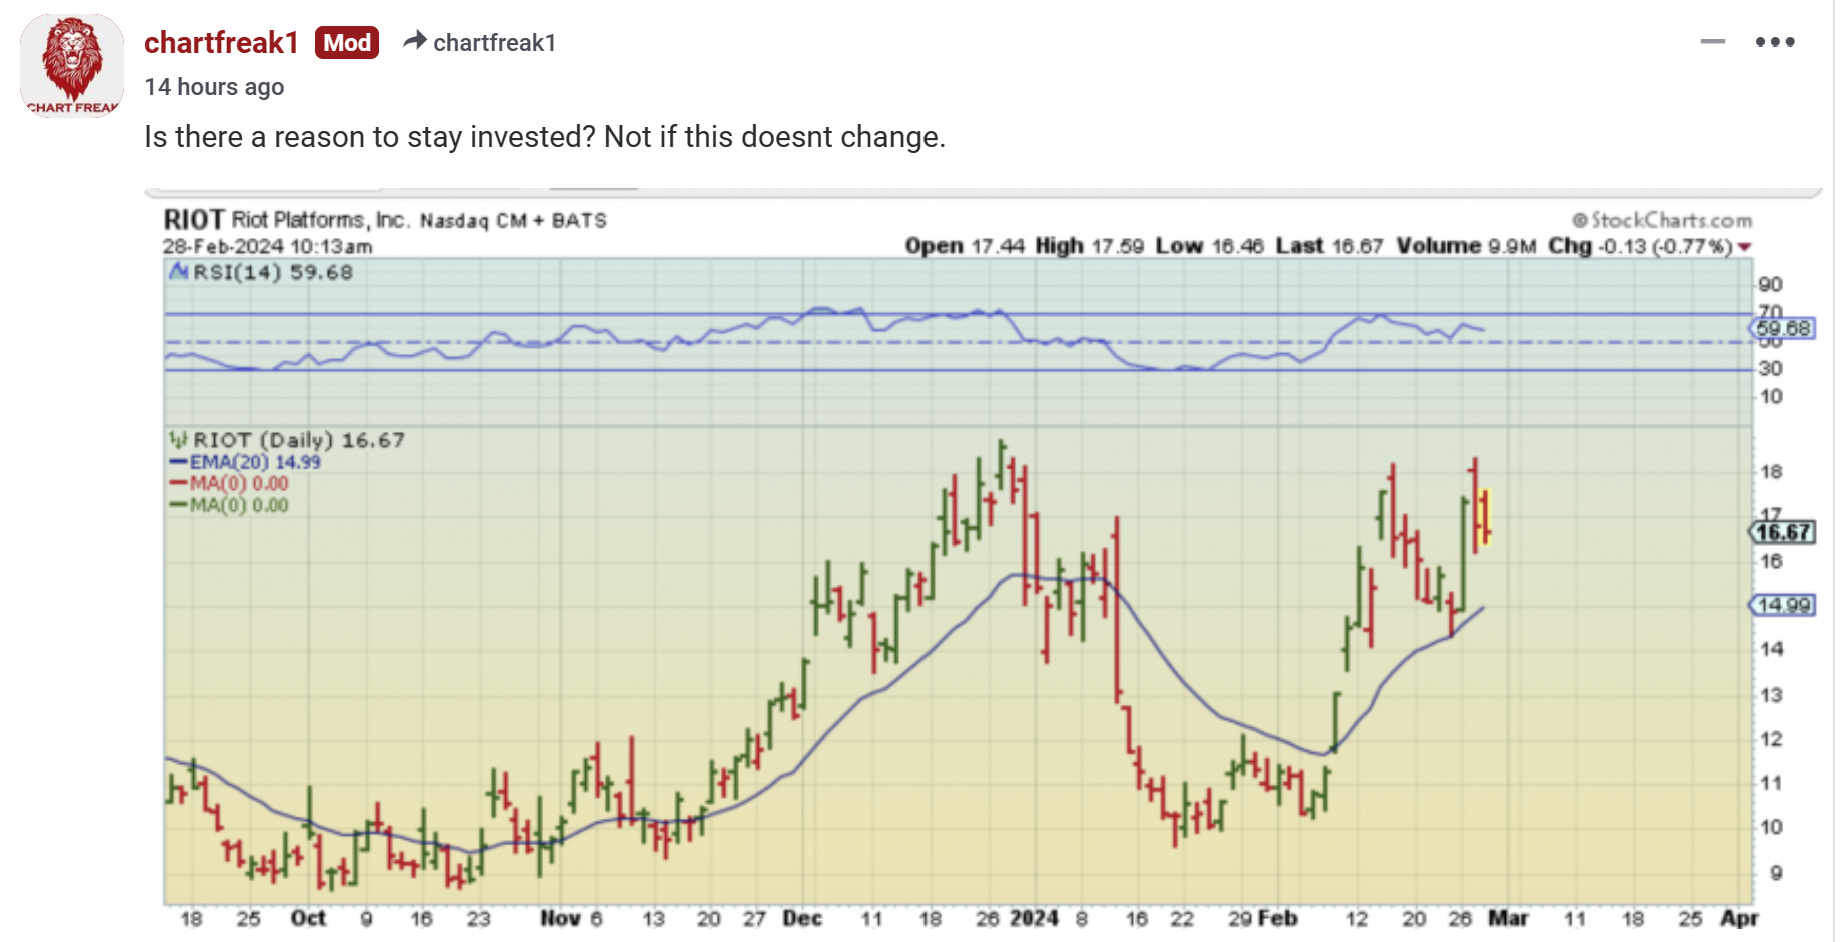
I saw that ‘Profit Taking’ happening Tuesday and Wednesday, so I posted this chart of RIOT and asked if it is worth being in these anymore (until later). Bitcoin is racing to all time highs, and the stocks would be up 10% in premarket, and then sell off all day? So…
.
Now for the recent drag on Crypto-Stocks. I have to say that I think that it is reasonable to believe that these companies that produce, own, and sell Bitcoin would benefit greatly from that Bitcoin rally, since it would also be increasing the value of their business and product greatly. In October to January, they rallied with Bitcoin as it ran from $25,000 to $48,000 in anticipation of the ETF approval. Many doubled or even tripled, and then after a small pullback, Bitcoin added another run from $38,000 to $64,000, and they rallied again. This time, however, they ran up and started to stall, double top, and drop over the last 2 days. It is very frustrating and I’ll just quickly tell you how it hurt me, so I know that it hurt newer traders to this sector.
.
Everyone develops a trading style that work for them, right? Well, with these Crypto stocks, my personal trading method recently was This:
.
1. I would BUY & HOLD a good basket of a few Miners, like a basket of MARA, RIOT, CLSK, IREN, WULF for example. I would also trade positions. Just for the sake of this conversation, let’s just say that I owned 2000 shares of RIOT as part of my basket…
2. With the recent run, we often saw higher pre-market prices and after a gap open, it would try to do a gap fill in the first hr. I would see a gap open and then the attempt to ‘gap fill’, and I would then double my position when the price dropped. So if I had 2000 shares at the open, I would add 2000, ride 4000 shares up and then sell that 2nd addition (2,000) near the end of the day. Even if I got in when Riot was up 2-3%, it could close up 13-17%.
3. Tuesday and Wednesday saw Bitcoin very strong. Crypto stocks were much higher pre-market, so I added after the open and they started to dip lower. The problem? They didn’t reverse higher as Bitcoin rallied strongly. I added and the price continued dropping lower?? Puzzling. So I stopped out my new position with a loss. 4000 shares down $0.50/share is still $2000 taken away.
4. So even though I did very well in October to January just riding these baskets up, and then also coming up with that method of trading later in that rally from Dec to January, I got slapped this week by going in heavier on all positions and having it back up on me…twice. This took a chunk out of my gains when Bitcoin was rallying above $60,000, and THAT was very frustrating. My acct would be up Thousands premarket, and down thousands until I stopped out, cutting into my gains. So I imagine that some here just started trading them and experienced the ups and downs too. Let’s look at the stocks.
.
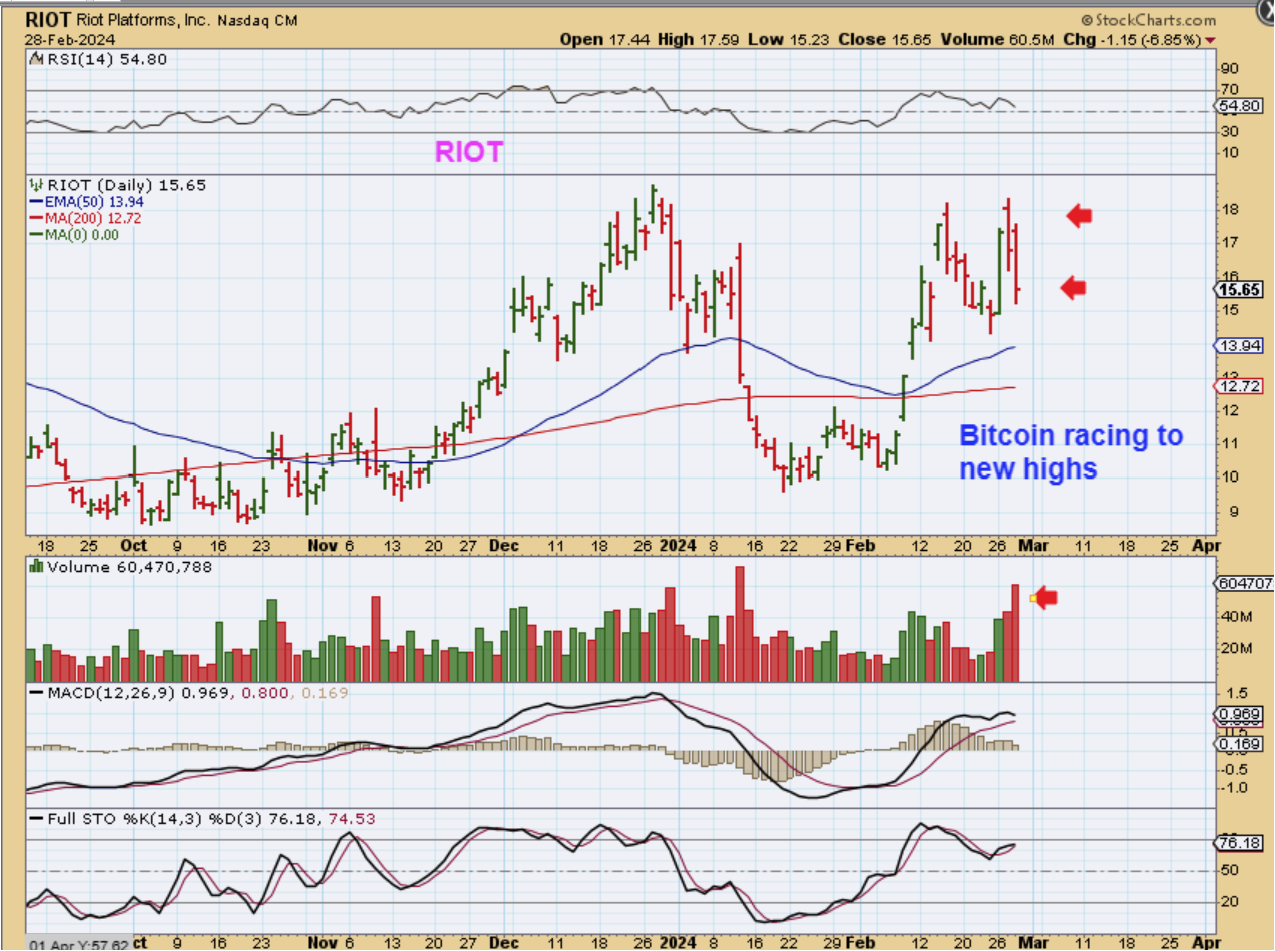
RIOT – You can see that RIOT gapped open higher Tuesday and sold off, and then yesterday when I saw it happening again, I grabbed RIOT down 13 cents and I said, “Is there any reason to stay invested”, (Basically when these are dropping as Bitcoin rallies 10% 2 days in a row)? I sold my entire position.
RIOT CLOSED DOWN 7% with Bitcoin up at $64,000? –
Note: We see the stock doubled in Oct to January, then the pull back after the ETF Approval. It DID rally post ETF, so I do not believe that it topped simply because there are etfs now. RIOT ran from $10 to $18 after the ETF approval, so these aren’t selling off because everyone is choosing the ETFs in my opinion, but the rally became a double top with Bitcoin continuing higher. I think it is profit taking.
.
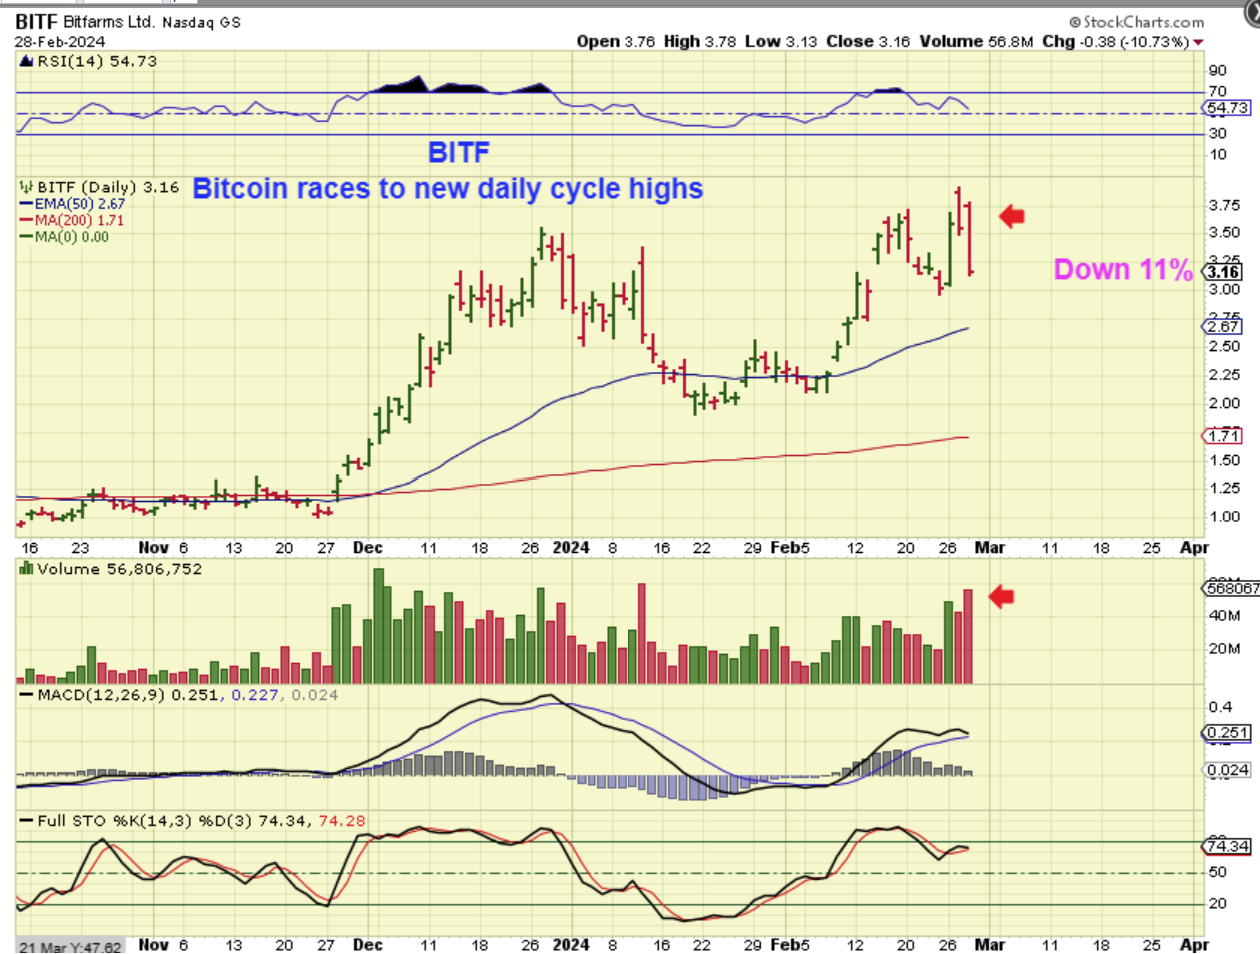
BITF rallied from $1 to $3.50 with Bitcoins $25,000 to $48,000 rally. Post ETF approval it ran from $2 to almost $4, but it also started to gap higher in the premarket and sell off during the Bitcoin surge Tuesday and Wednesday. Weakness with Bitcoin near all time highs? Down 11% with Bitcoin near $64,000? Frustrating and it is not clear to me yet why this happening, unless profit taking is happening predicting a top in Bitcoin soon.
..
.
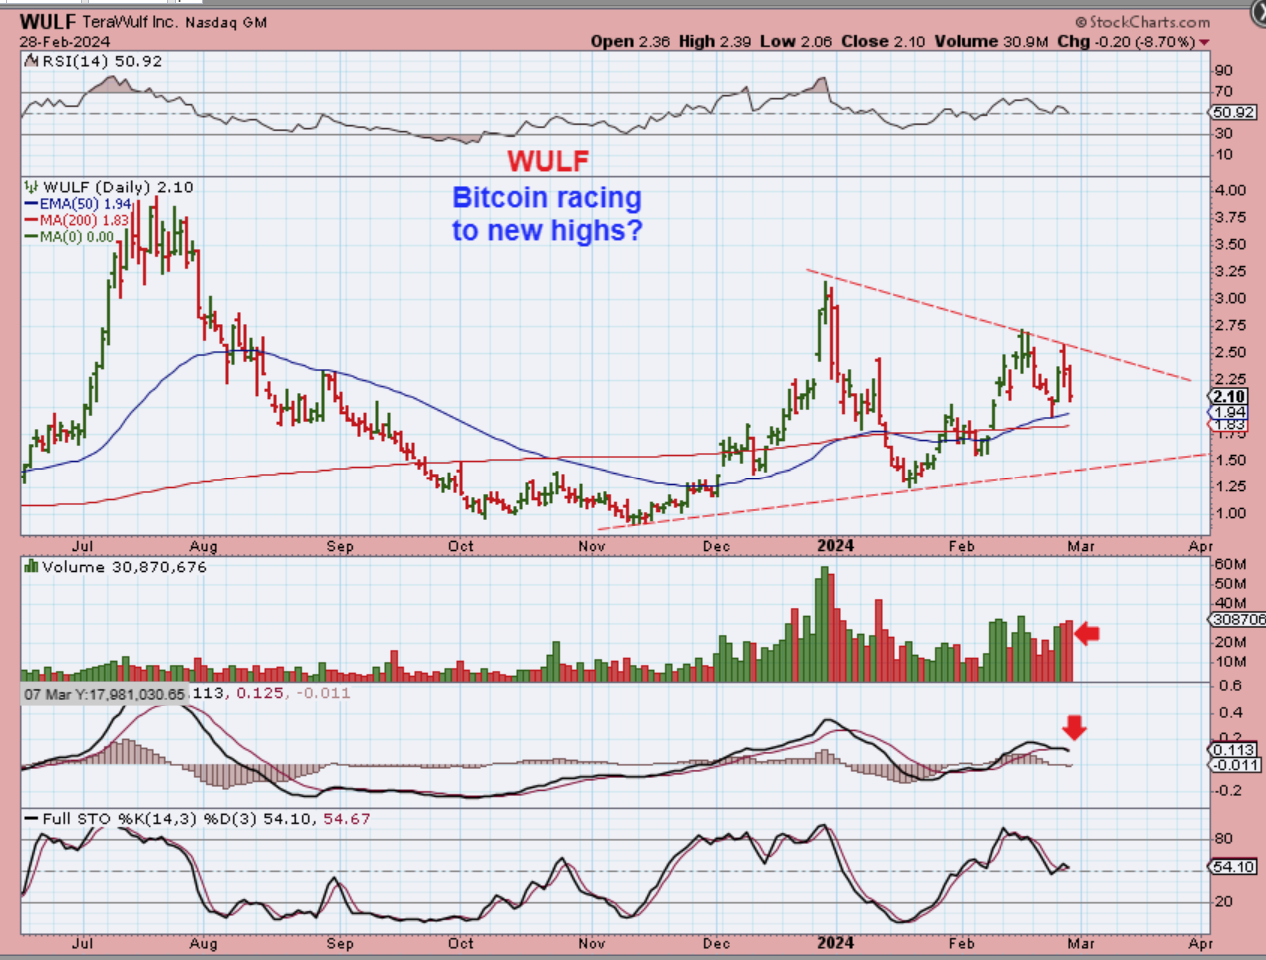
One more example for now:
.
WULF tripled from Nov to January with Bitcoins $25,000 to $48,000. Then the ETF approval pull back. Bitcoin started to run and WULF ran from $1.25 to $2.75 ( more than a double post ETF approval) yet it started to stall and drop Tuesday and Wednesday as Bitcoin made new highs.