
February 25th Weekend Review
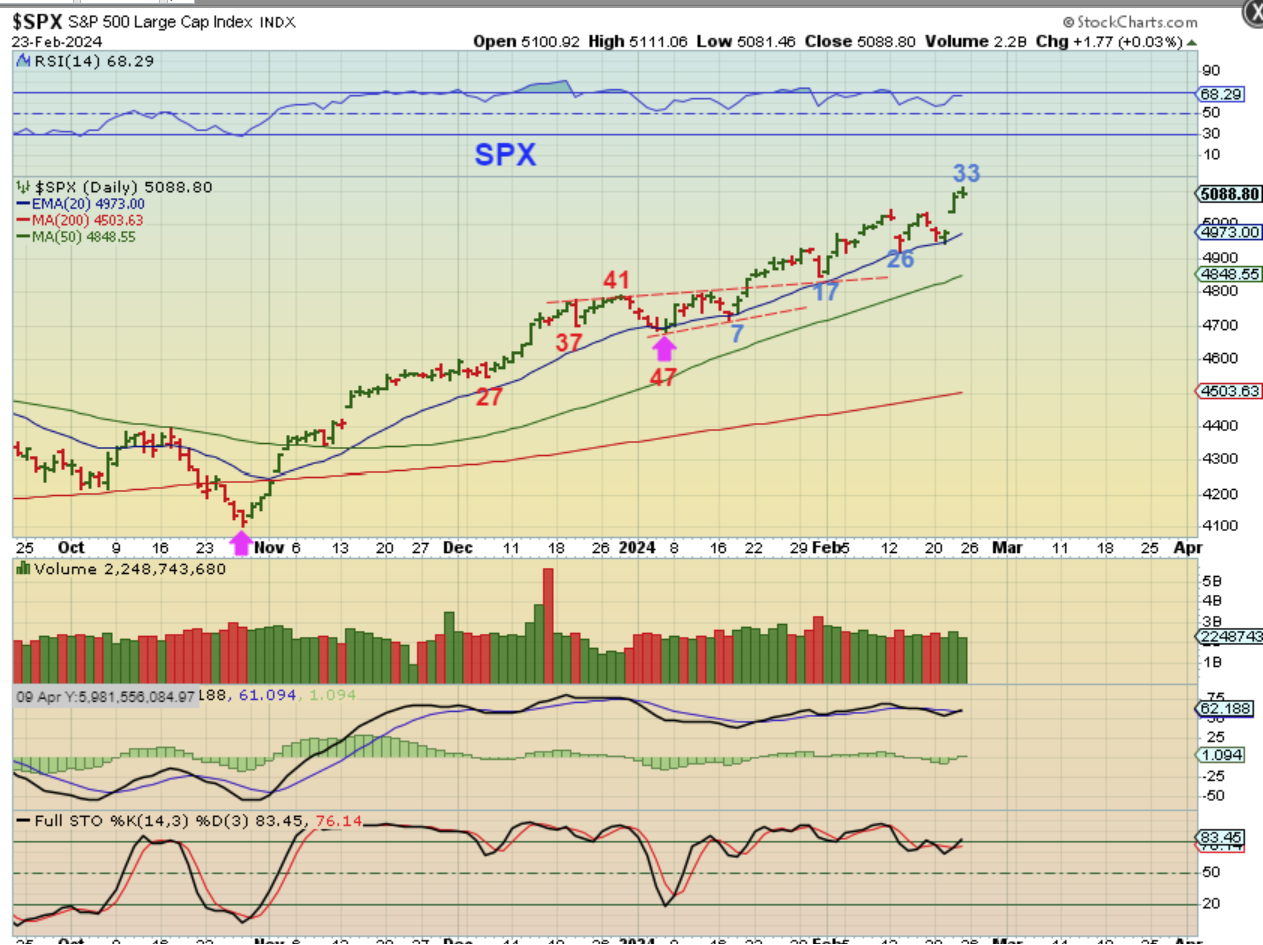
SPX DAILY – Following the Post Fed Minutes release plus NVDA earnings blow out, we got a blast higher Thursday and then a ‘pause’ or a ‘doji’ on day 33 Friday. This second daily cycle of the Bull Market recovery has been as rewarding as the First daily cycle, but we do have to start to expect a sell down to start in the near future to give us a normal dcl.
,
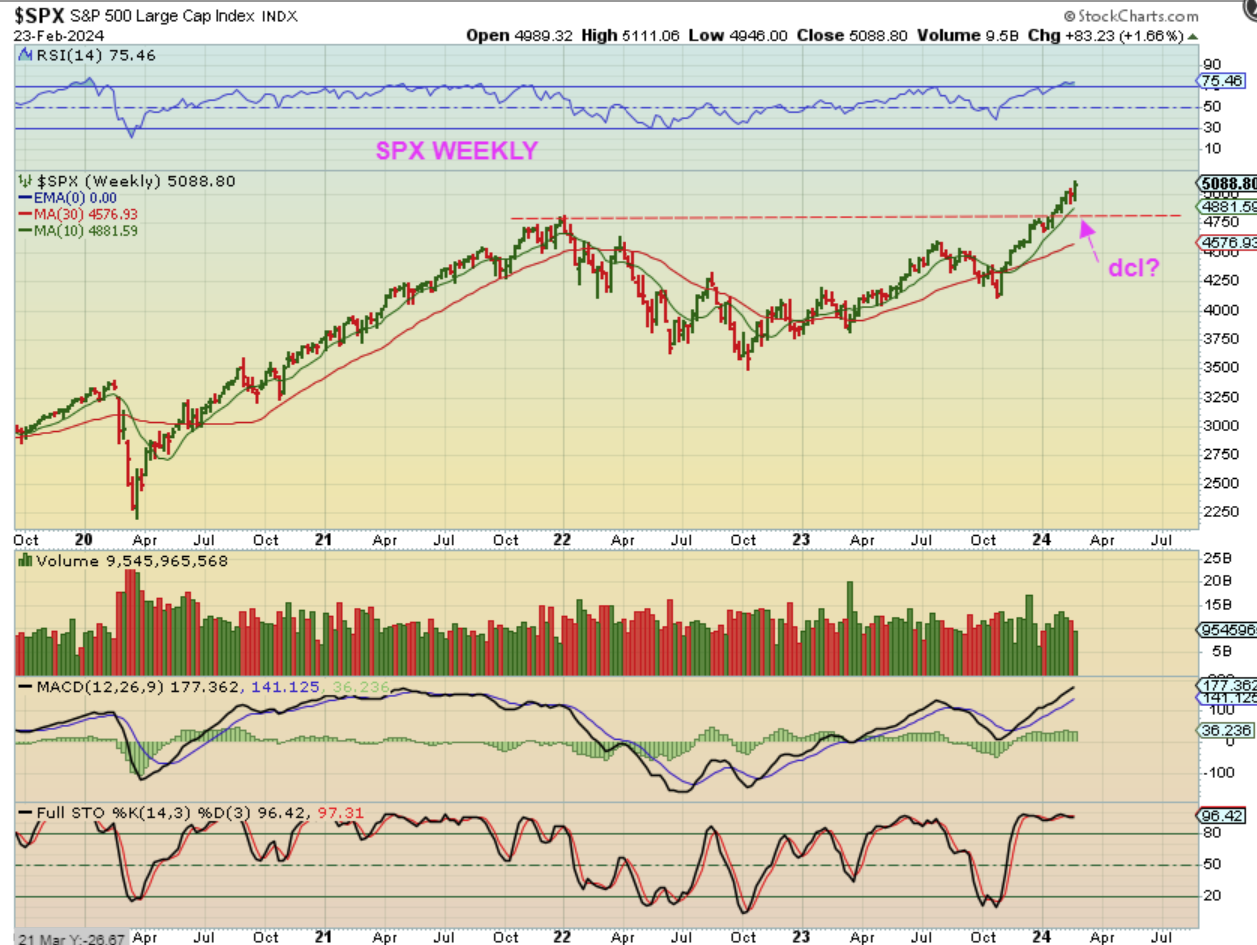
SPX WEEKLY – The next DCL could drop down to the green 10 week ma, and then later on (with 4th or 5th daily cycle) the ICL might give us a back test of this break out area.
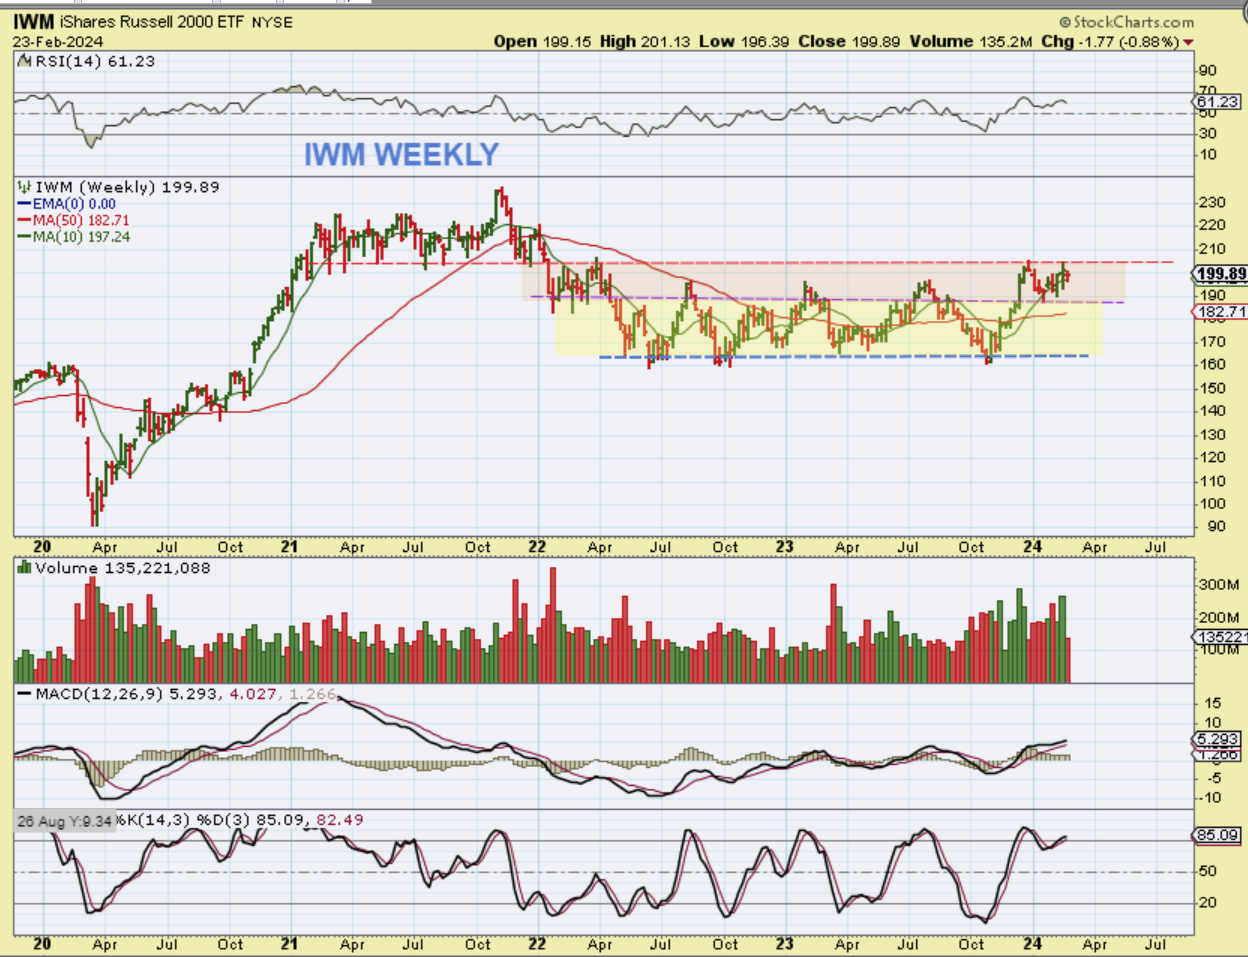
IWM WEEKLY – The Russell 2000 has been very congested and it has been trying to breakout from this base as the SPX, DJIA, SOXX, & NASDAQ have been rallying to new highs. It was off to a good start in Oct to December while rallying out of the lows with strong volume, but it has stalled at this resistance area in recent times. Solar Companies, MJ Companies, Clean Energy and EV companies were once leading the way, but now they are struggling.
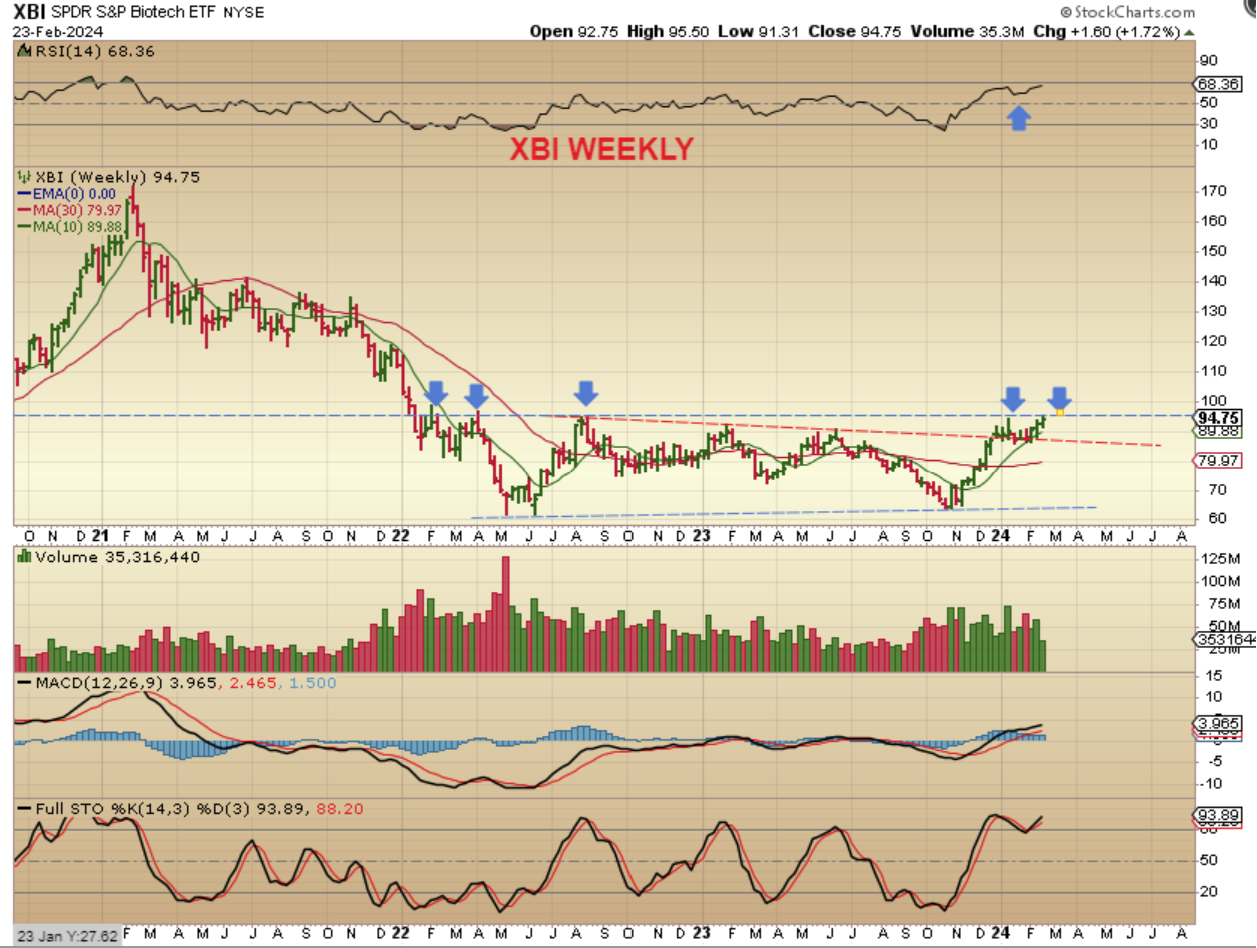
XBI WEEKLY – Biotechs have been doing well lately, and now many of the smaller companies are perking up and breaking out of their bases. Here we see a rally out of the lows, a bit of a bull flag, and a push higher last week, so this MIGHT be attempting to breakout, and..
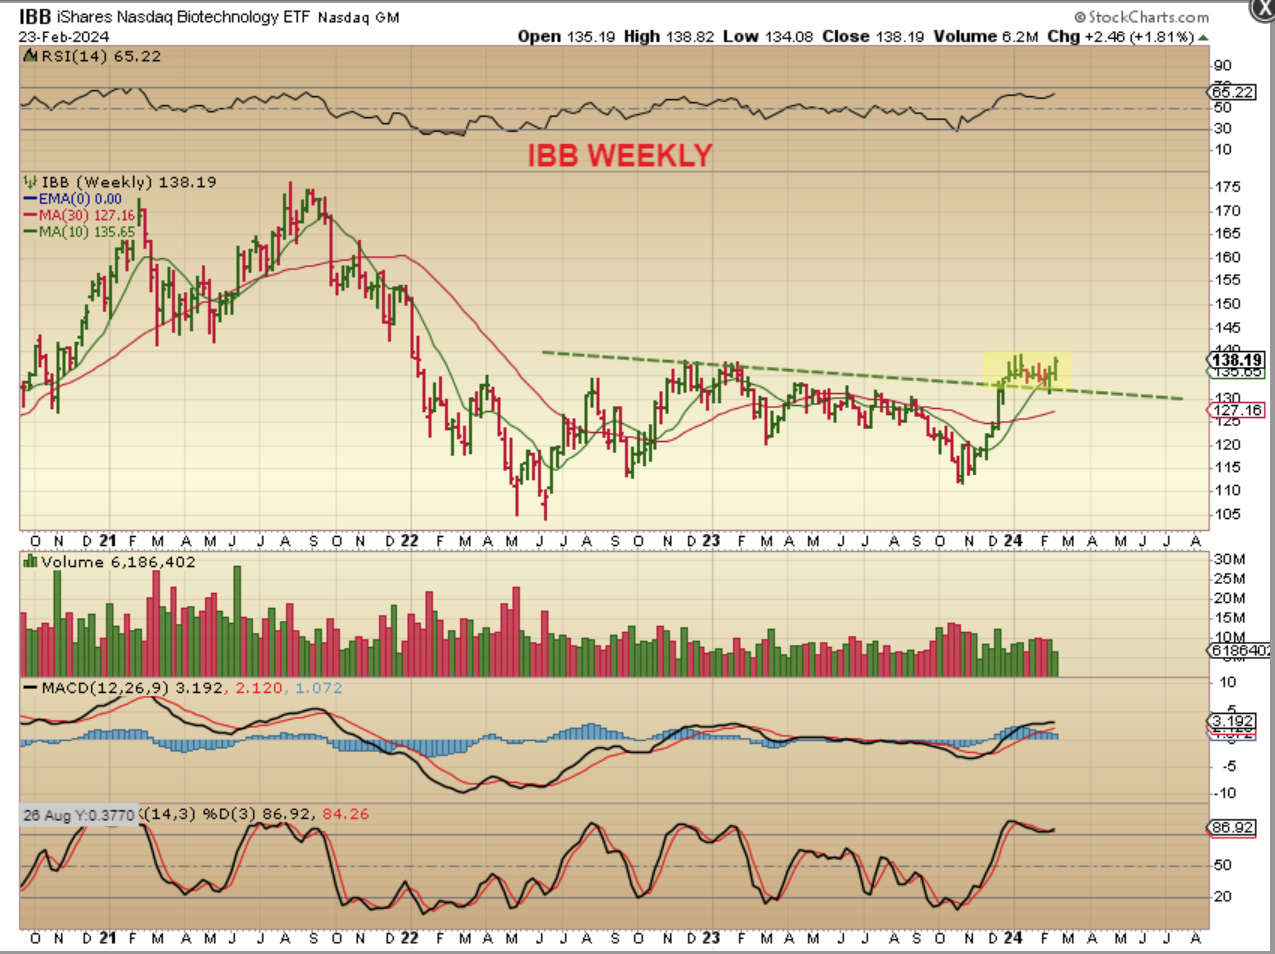
THE XBI WEEKLY looks like it may be breaking out too. So while the general markets ran higher, this chopped sideways. Is it possible that when the General Markets dip into a dcl, this can run ahead without the Markets? It could. I’m keeping an eye on this sector.
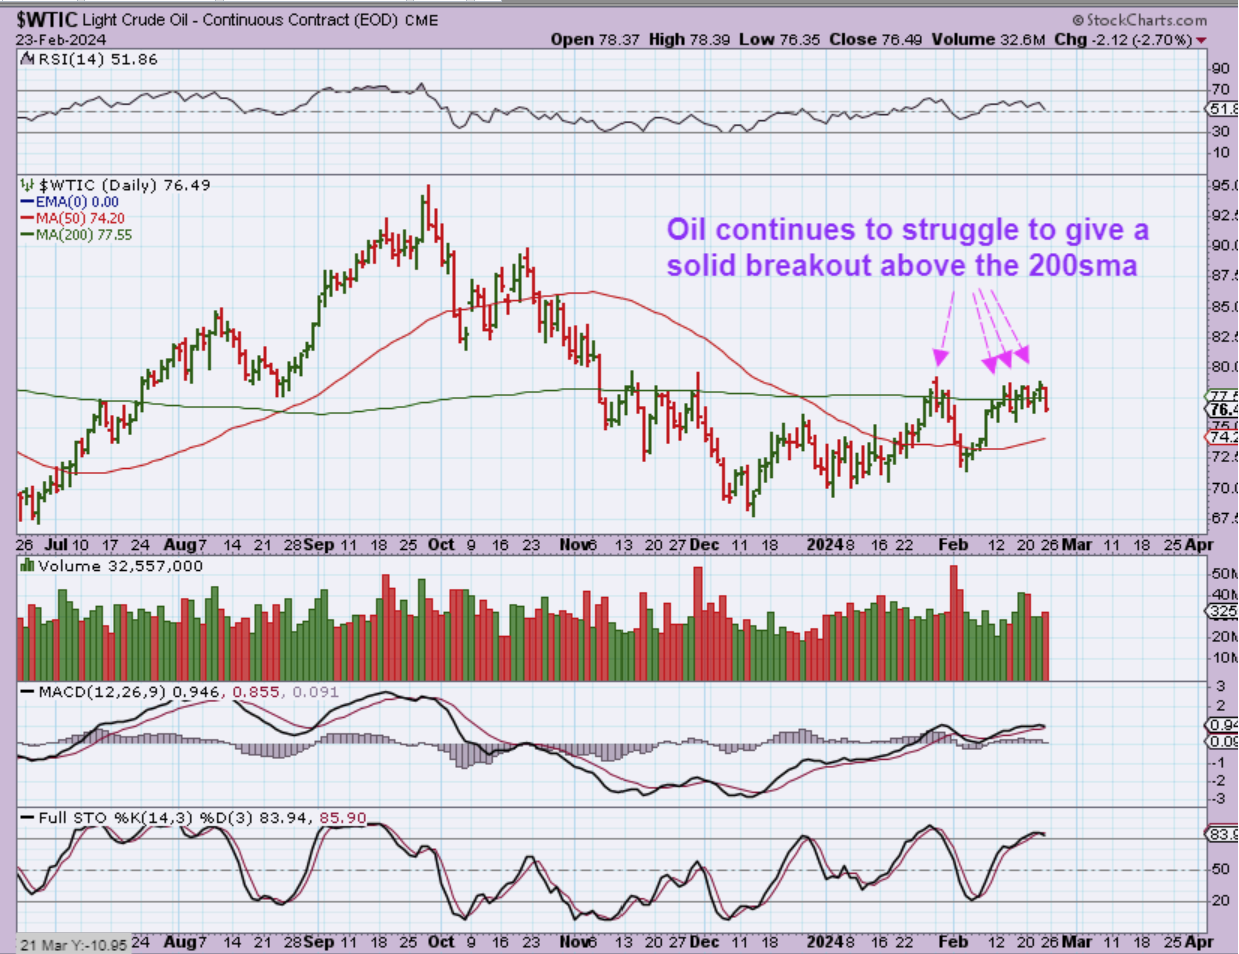
WTIC DAILY – Oil is a bullish set up, but it has been having trouble breaking out above the 200sma and then running or trending higher. The weekly chart may give us another clue to this puzzle…
.
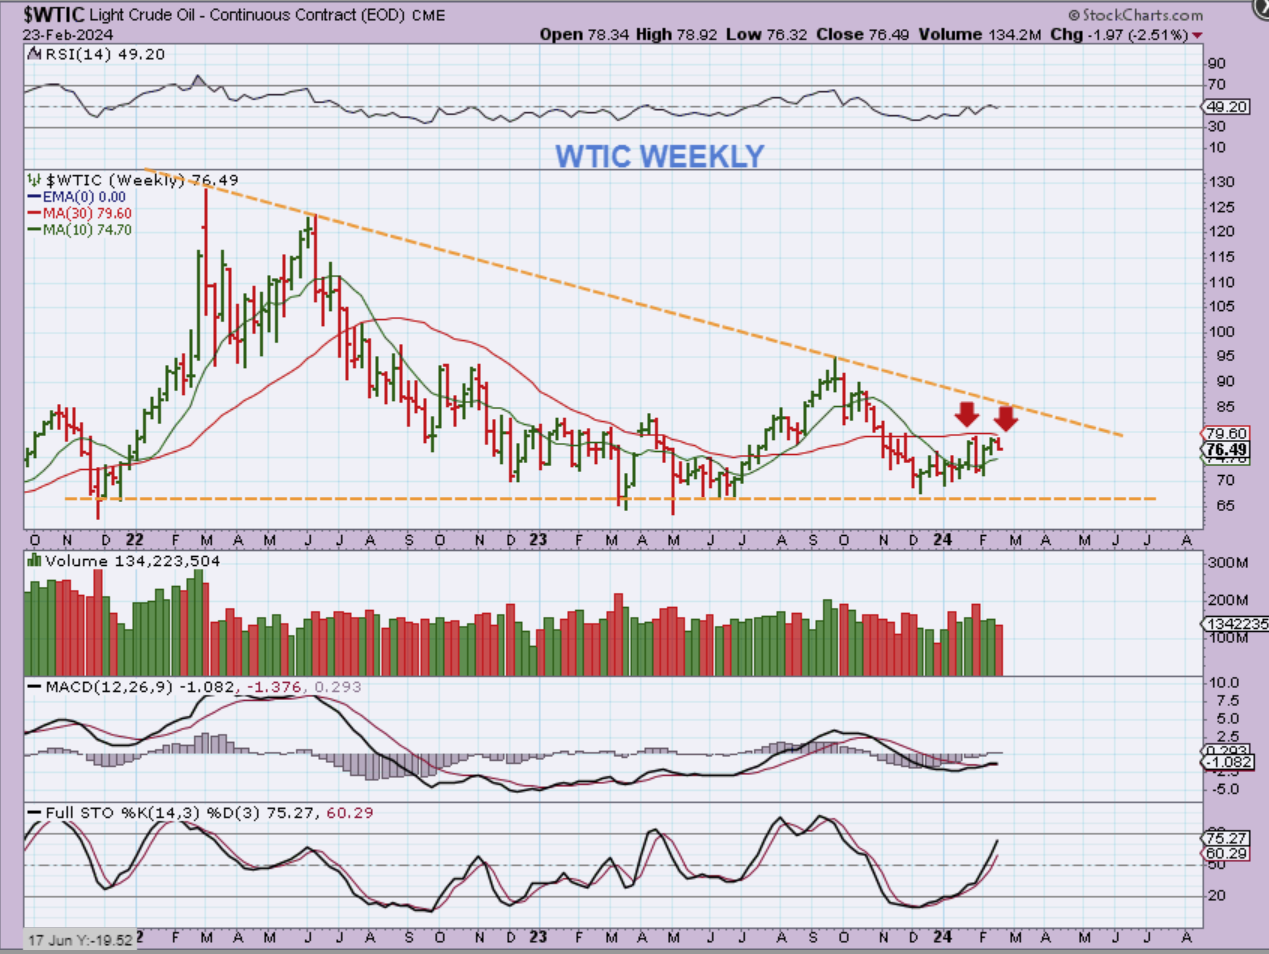
WTIC WEEKLY – The weekly chart of Oil shows that the 30 week ma, which is a common support or resistance line in weekly charts, has been holding price back. It looks like Oil needs to break above the $79.60 area to gain some more buyers and some traction. Oil is only on The 2nd daily cycle, and it has plenty of time left and the weekly MACD has crossed higher, so Oil remains bullish.
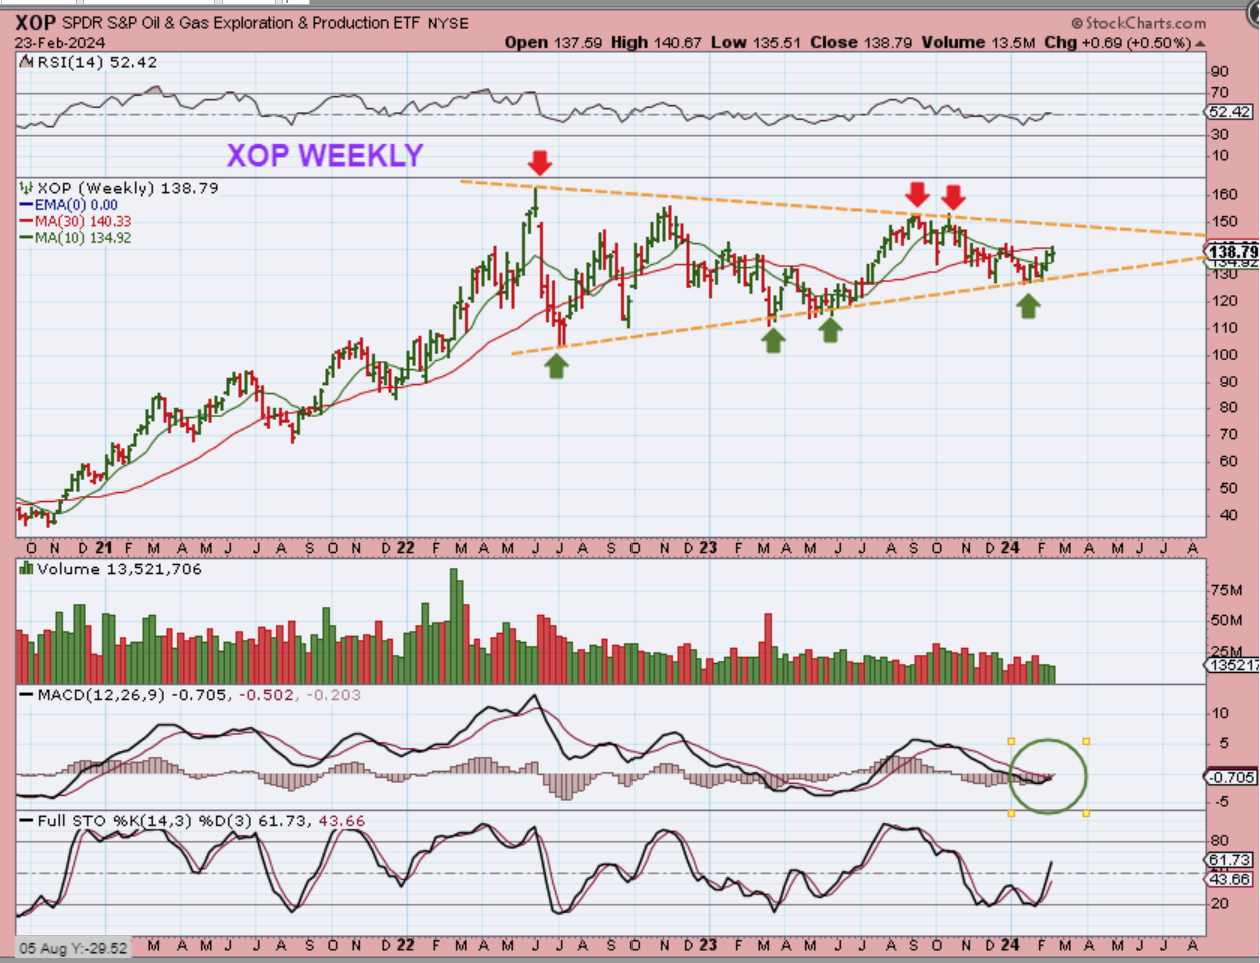
XOP WEEKLY – Oil stocks are coming up off of their support, the lower trend line. This looks like a long triangle that I have been pointing out for a while now, and a breakout from this could lead to a solid push higher in Oil stocks. That being said, in the big picture this can run higher, but we also have a lot of Apex left, so it may or may not ‘break out’ until the end of 2024, we’ll just have to wait and see.
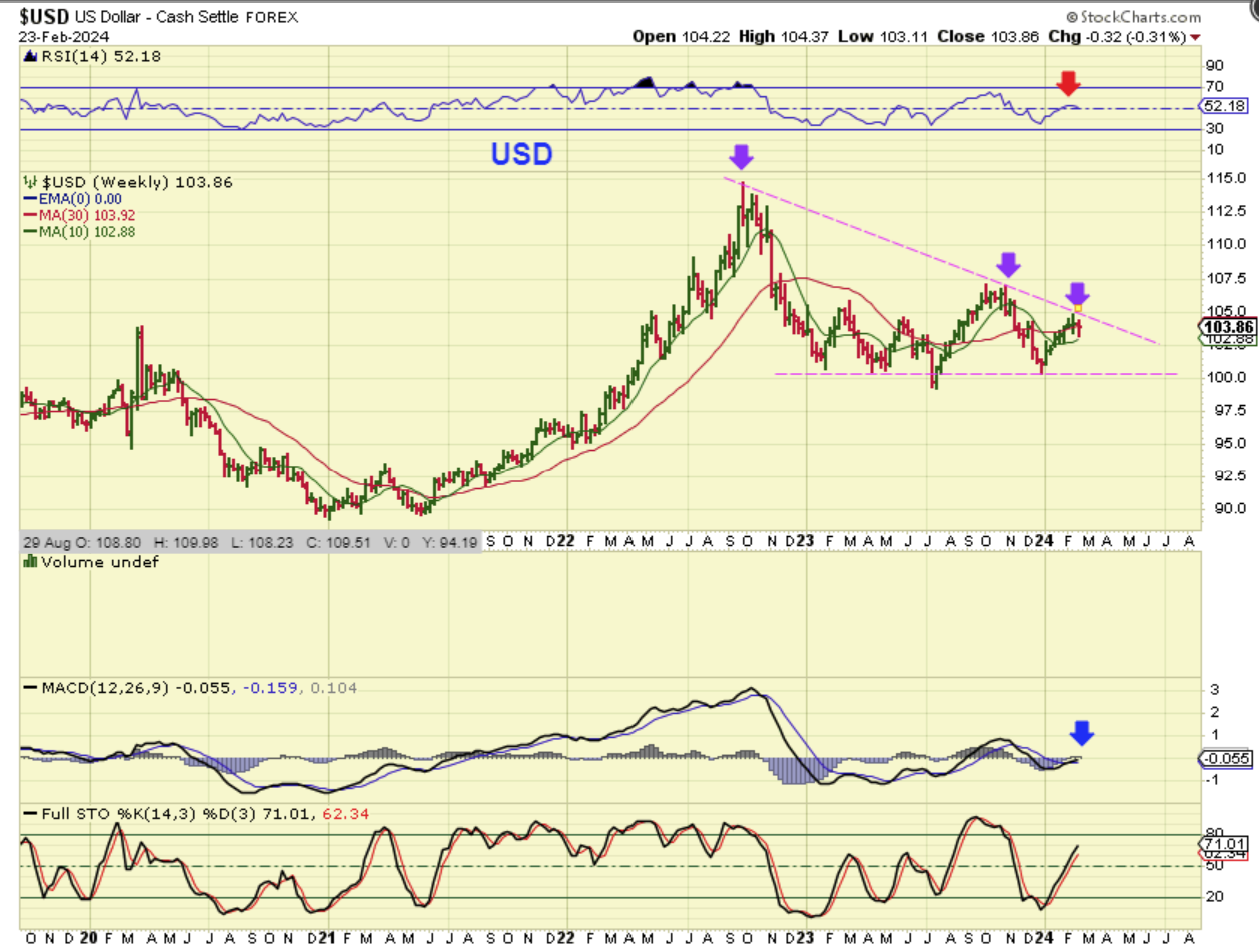
THE USD WEEKLY hit that $105 area that I have been discussing & pointing toward for many weeks as a resistance area and as a target area for (hopefully) a pullback. So far it pulled back and now we just need to wait and see if this is the time for the USD to begin to drop down into that 3 yr cycle low or not. It is also not uncommon to get a false breakout, and we could get a break higher in the next daily cycle and then it fades as we get closer to possible rate cuts or rate cut discussions by the Fed.
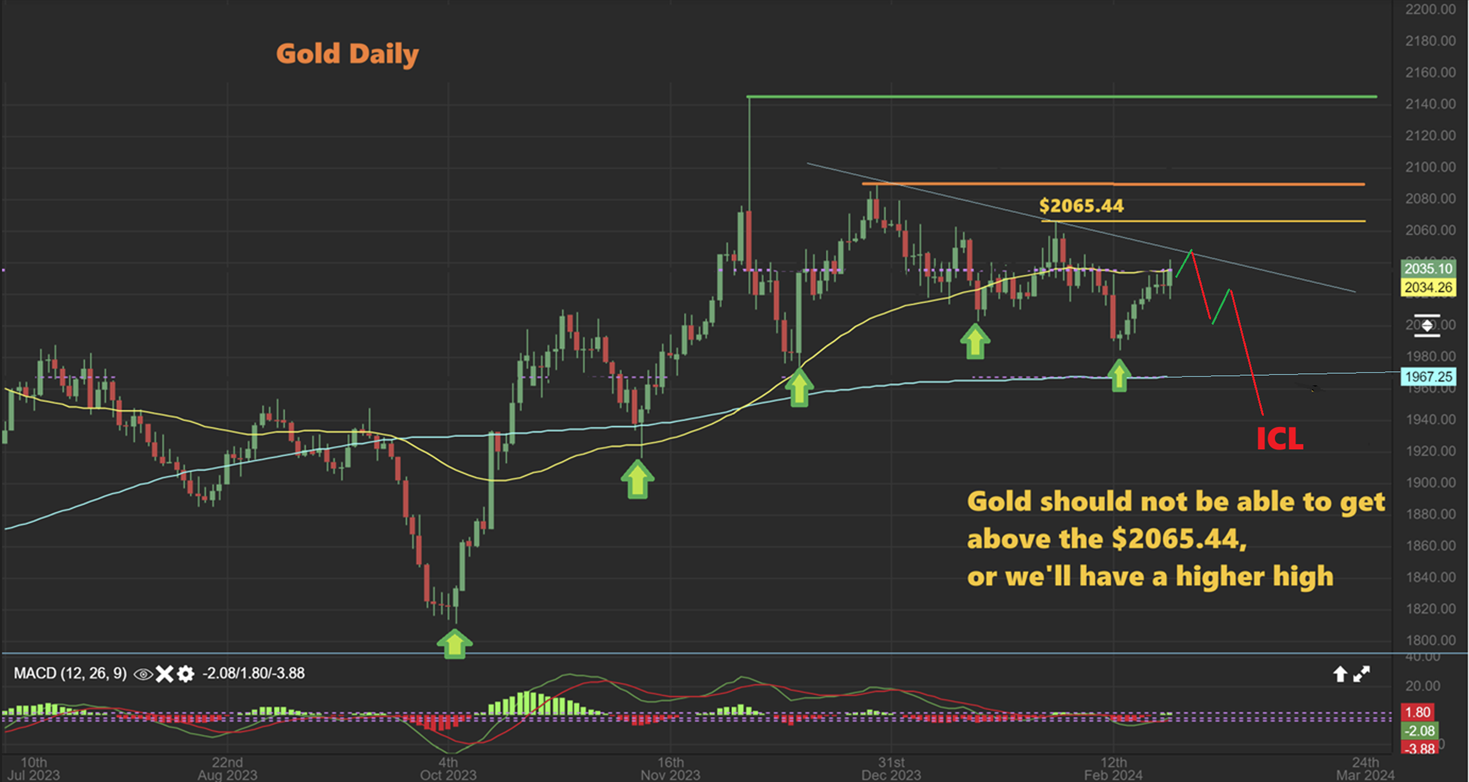
GOLD DAILY – So both Gold & the USD looks to be at a crossroad, with triangles of their own. Gold is very interesting here, because as mentioned in prior reports, Gold should be dropping fairly sharply in a 4th or 5th daily cycle. At this time in an intermediate cycle, Gold is known to fall apart quickly, but the weakness isn’t there. In fact…
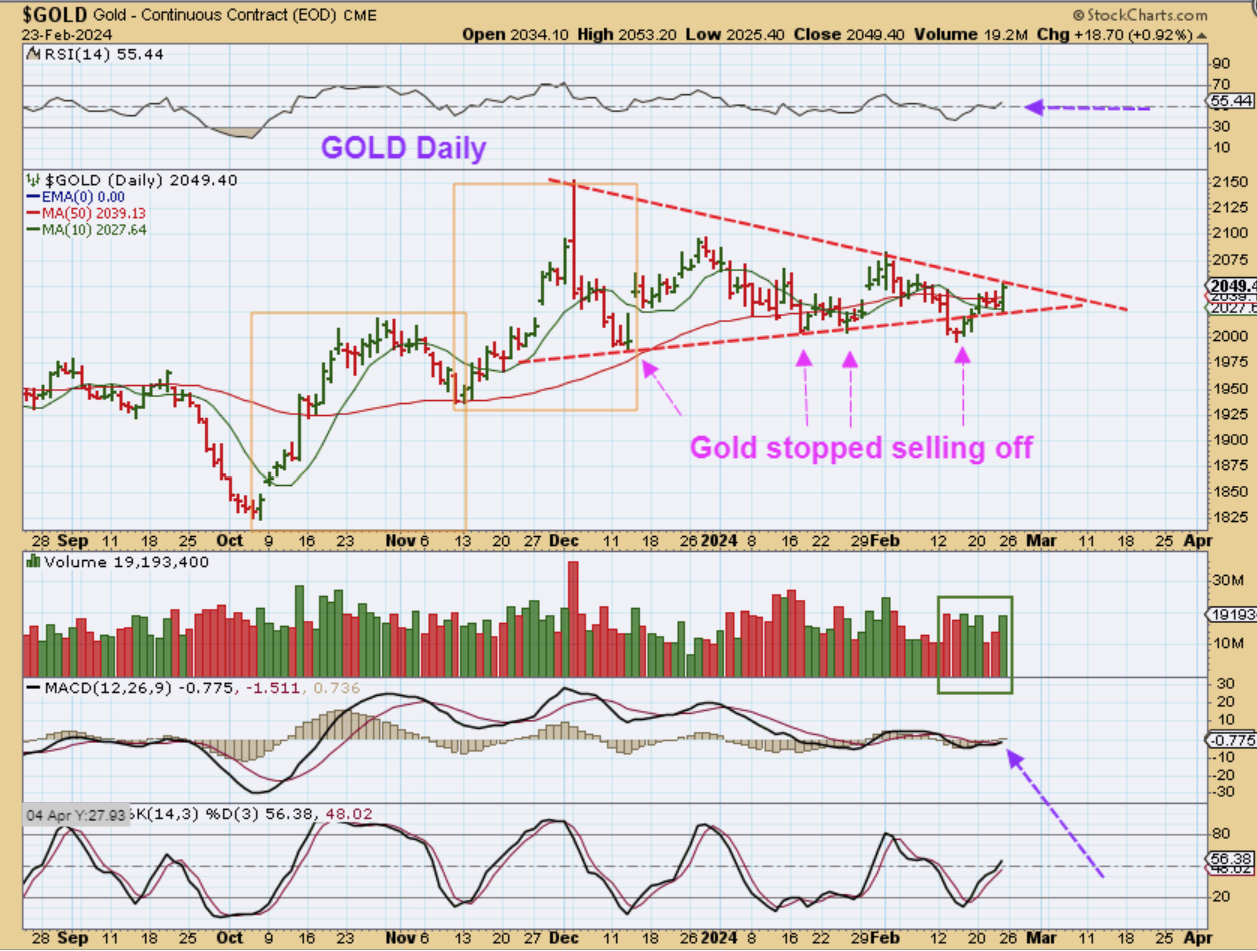
GOLD DAILY:
In fact, look at the RSI as Gold pushed above the 50sma, with growing volume and a steady MACD. This looks very different from what I would expect in a 5th daily cycle. I Look for signs of strength and weakness in the 3rd and 4th daily cycles, I am seeing signs of strength here in this triangle and it is impressive this late in the cycle. This could breakout higher if the USD drops, and that would be a shakeout false break down and a very mild ICL, hidden in this triangle.
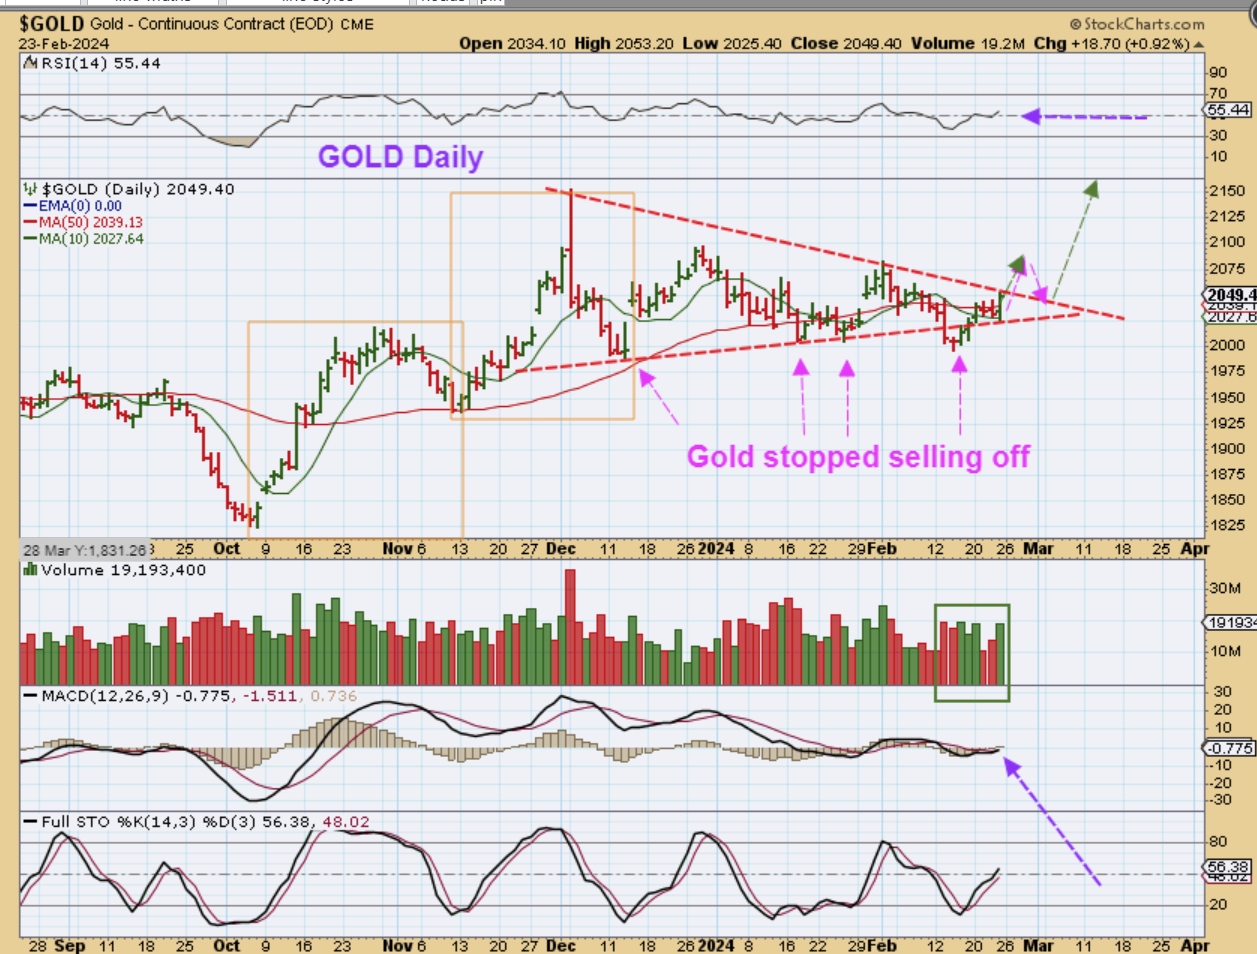
GOLD DAILY – The drop into the 4th dcl did give us a lower low and that also gives us an a-b-c drop into the lows. That can lead to an ICL, but this was not a deep drop. Is that ok? In this case, we may have completed an entire intermediate cycle with sideways choppiness and we could have a MILD ICL hidden in the triangle pattern drawn on the chart above. You would not expect to see a break above the prior high of $2065.44. We would see that if the ICL is in place.
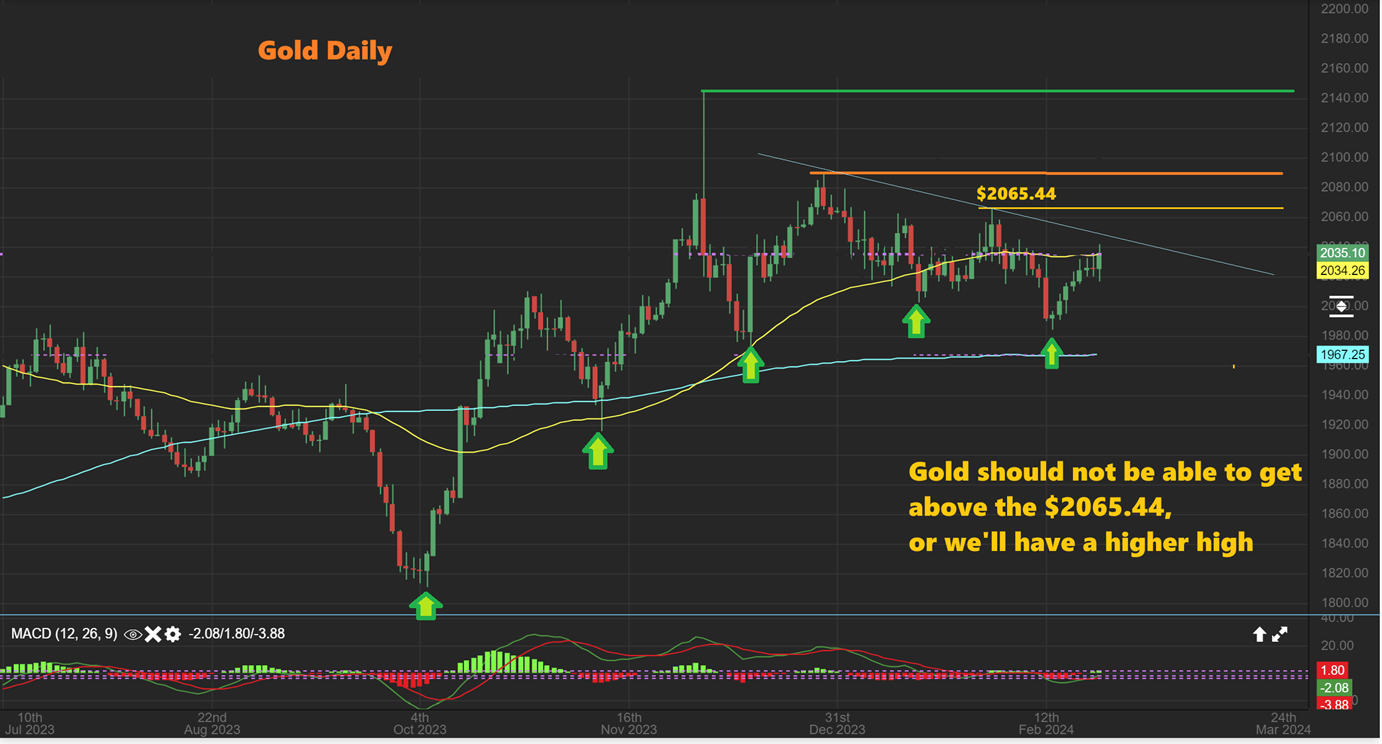
GOLD DAILY – This is what we would see if the ICL is still ahead. Price may be capped at the 50sma, where it is right now, or do a quick breakout and then roll over (at the upper trendline seen here). We should NOT see it break above the $2065.44.
GOLD WEEKLY – So when we switch to the bigger picture we do see a set up that is more bullish than bearish. And please take note of the 30 week ma. Not only did price bounce off of that area, but…
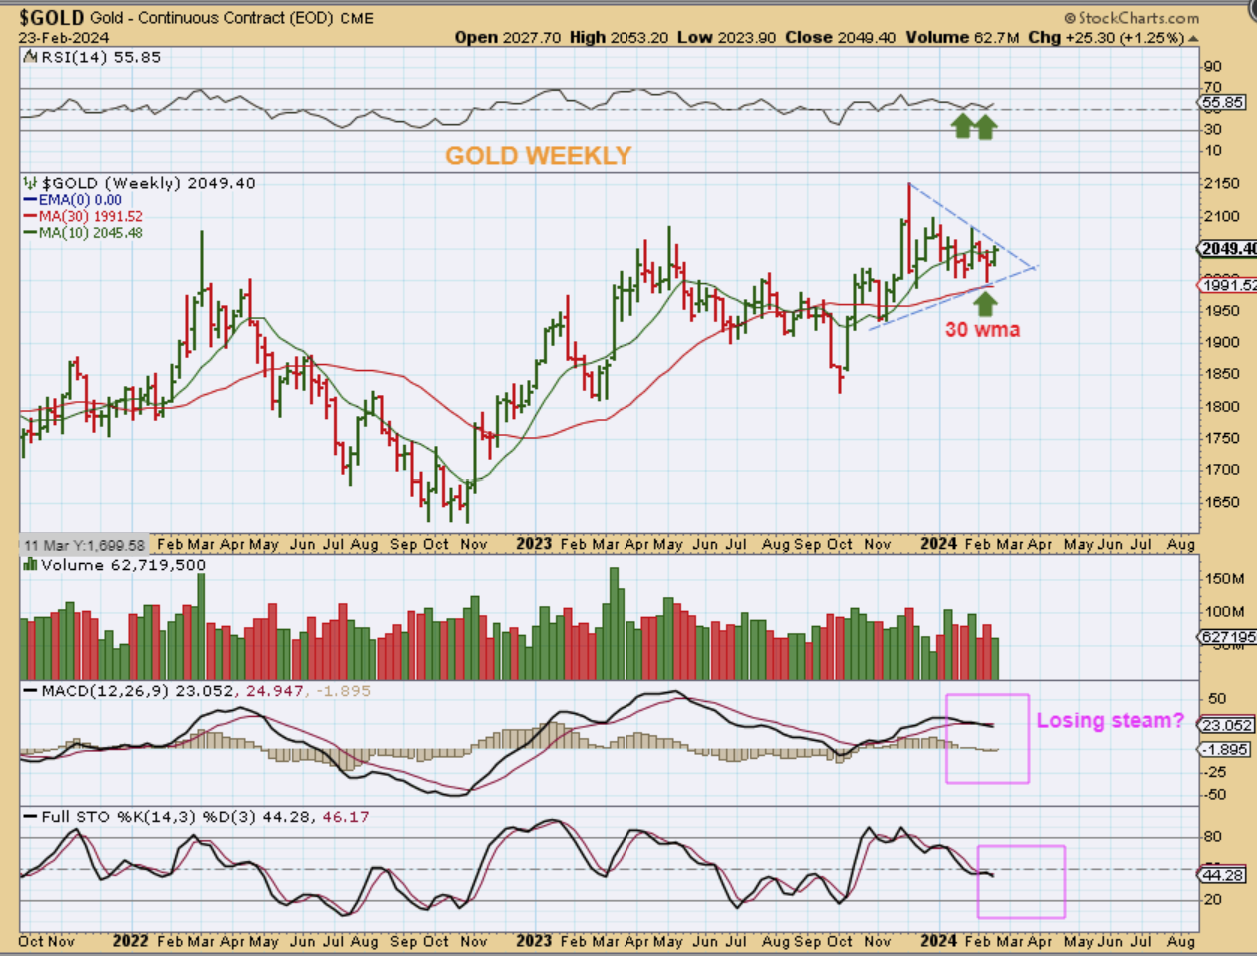
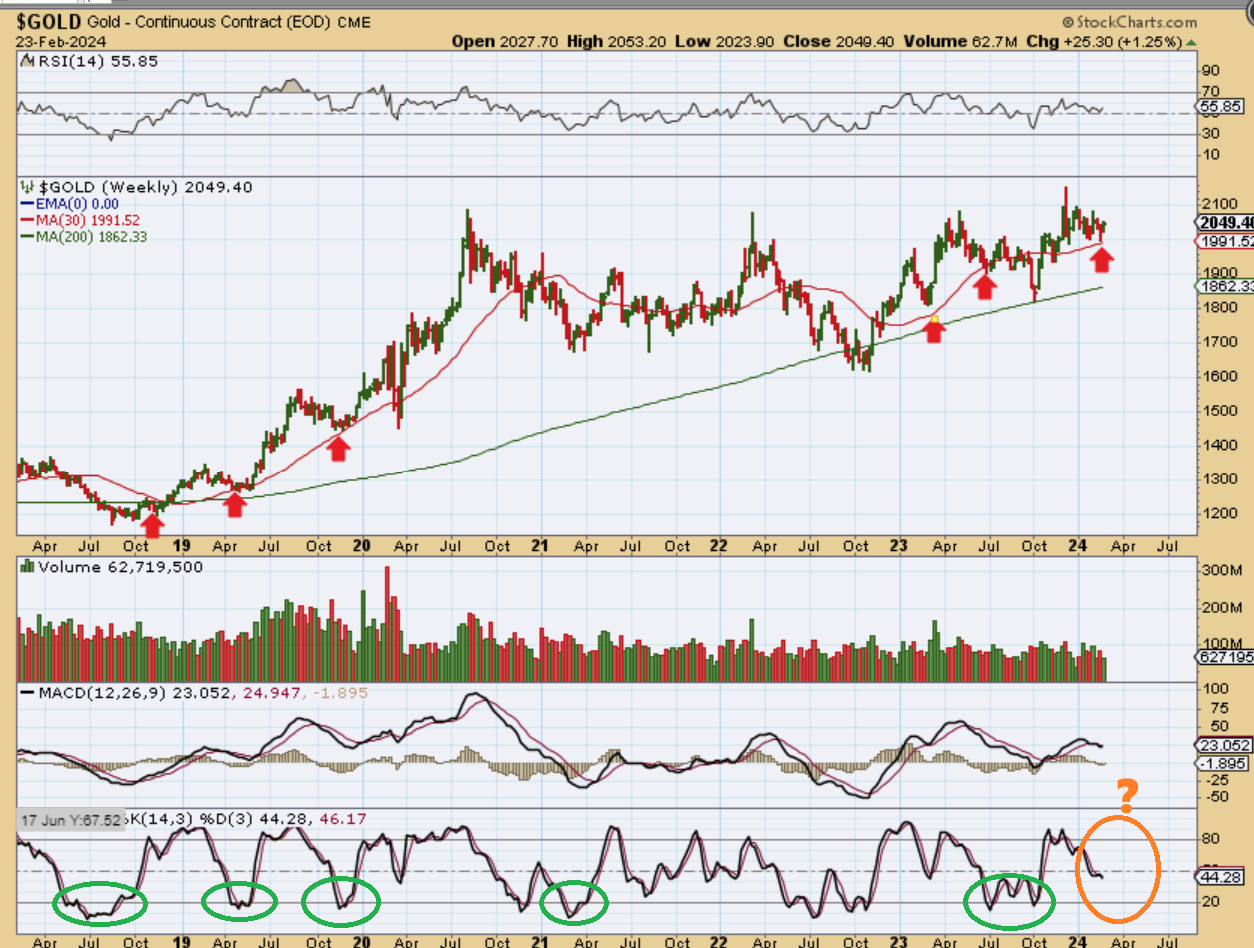
GOLD WEEKLY – That 30 week ma is an area that I have also been pointing to as a place that we’d like to see price tag and hold up, when compared to that 2018-2020 run. One big difference here is the stochastics. At prior ICLs we were quite oversold, and we are not oversold right now. One more daily cycle could cure that.
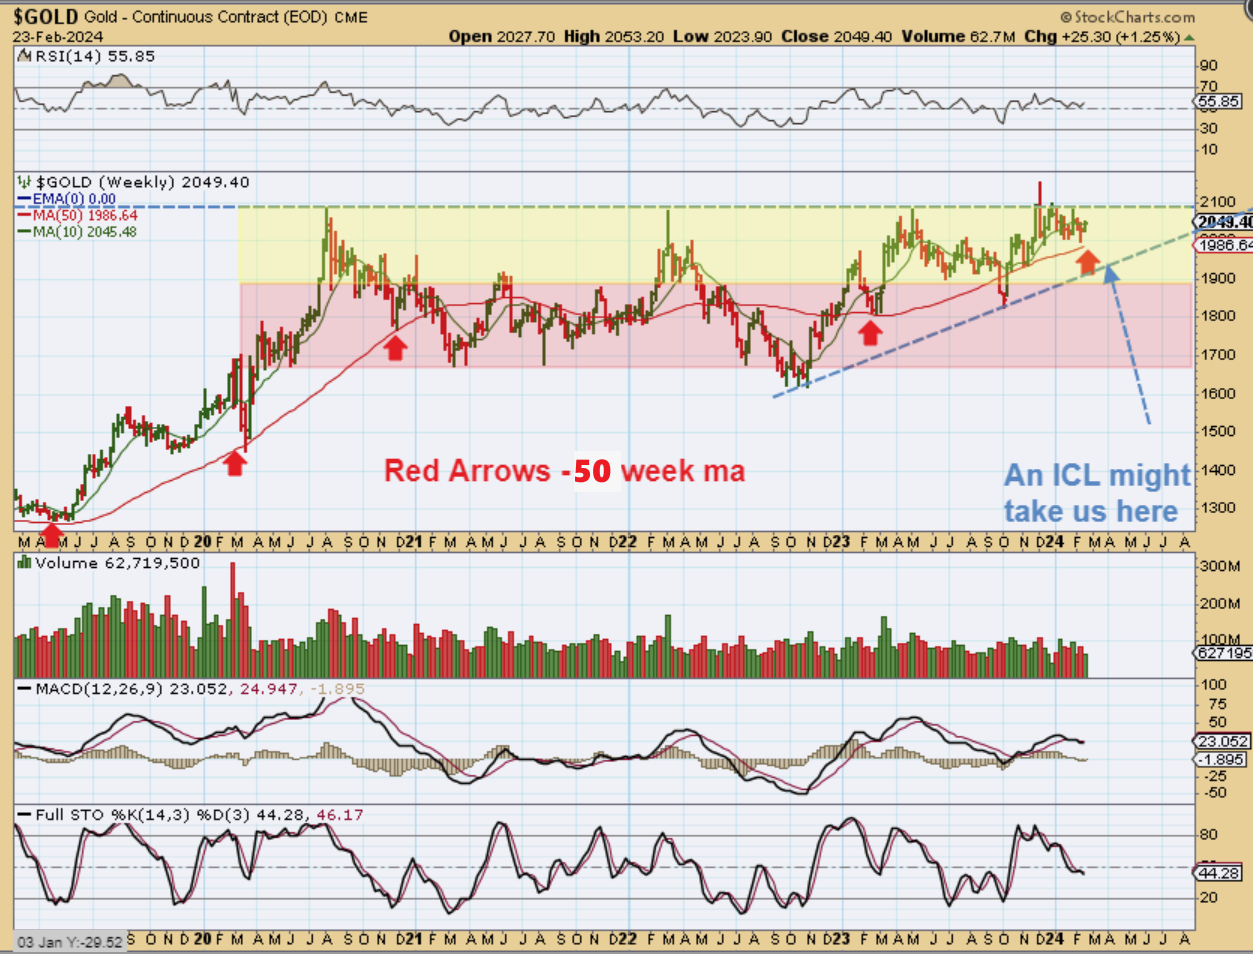
GOLD WEEKLY – Here I am using the 50 week ma, instead of the 30 wma.
At prior ICLs that were much deeper sell offs, the 50 week ma also acted as a place of support or a target area, but notice that our current price is also almost there. Again, we were quite oversold at prior ICLS except for the quick 2020 covid crash, and we are not right now. One more daily cycle could cure that and it might tag that 50 week ma, but that is not necessary. I am still not expecting a deep drop.
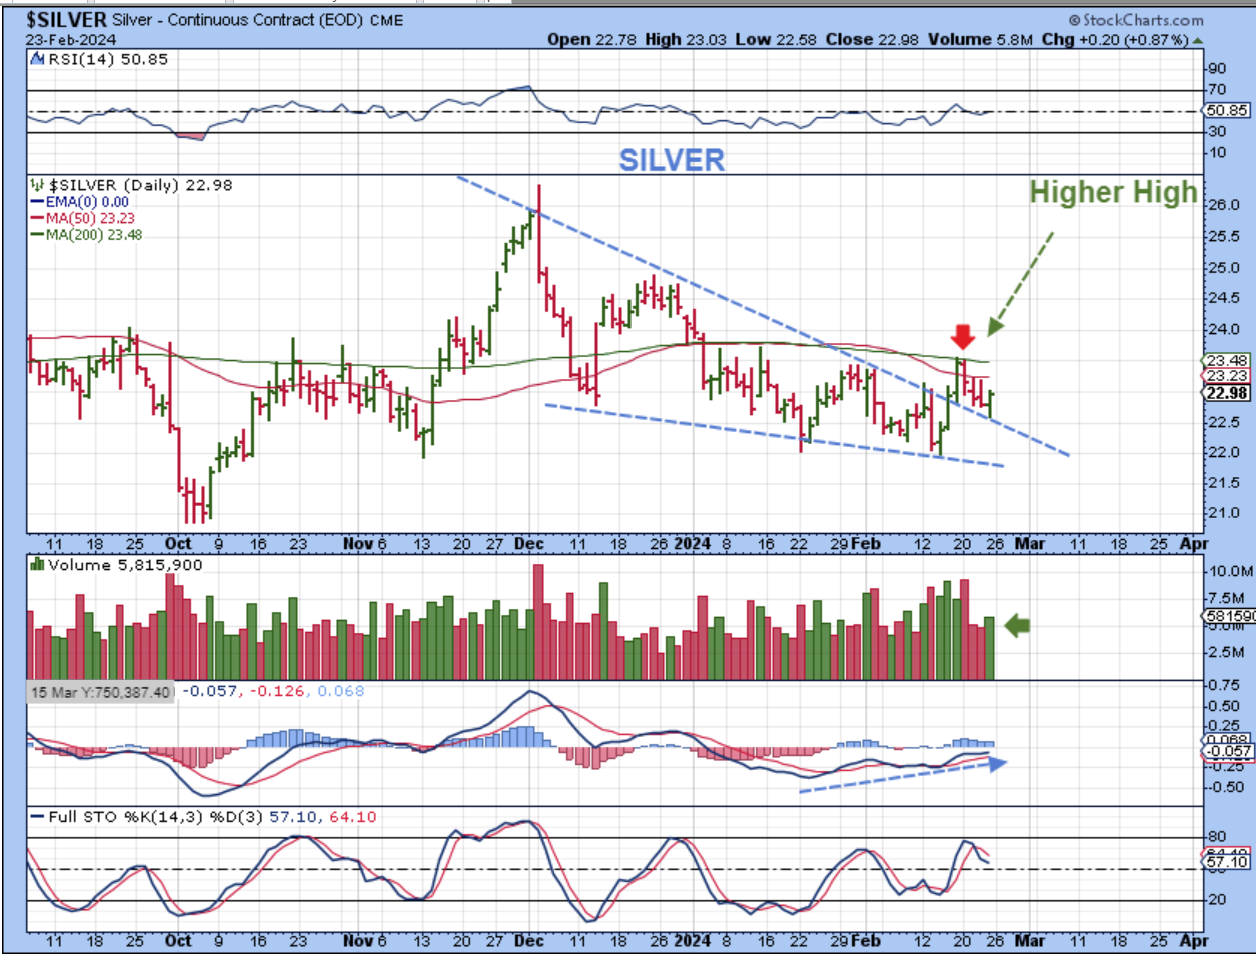
SILVER DAILY– Silver has been bumping up against resistance too, at the 50sma, but this set up looks bullish.
1. I pointed out that Silver already made a higher high, and I use that as a clue that we are seeing strength (which is not common in a 5th daily cycle at all).
2. We had a wedge breakout and now a reversal on Friday as a back test. This could indicate that we have an ICL in Silver, and Friday we saw that push higher with volume and take a look at that RSI & MACD. This honestly looks like a bullish set up and not a final daily cycle to me.
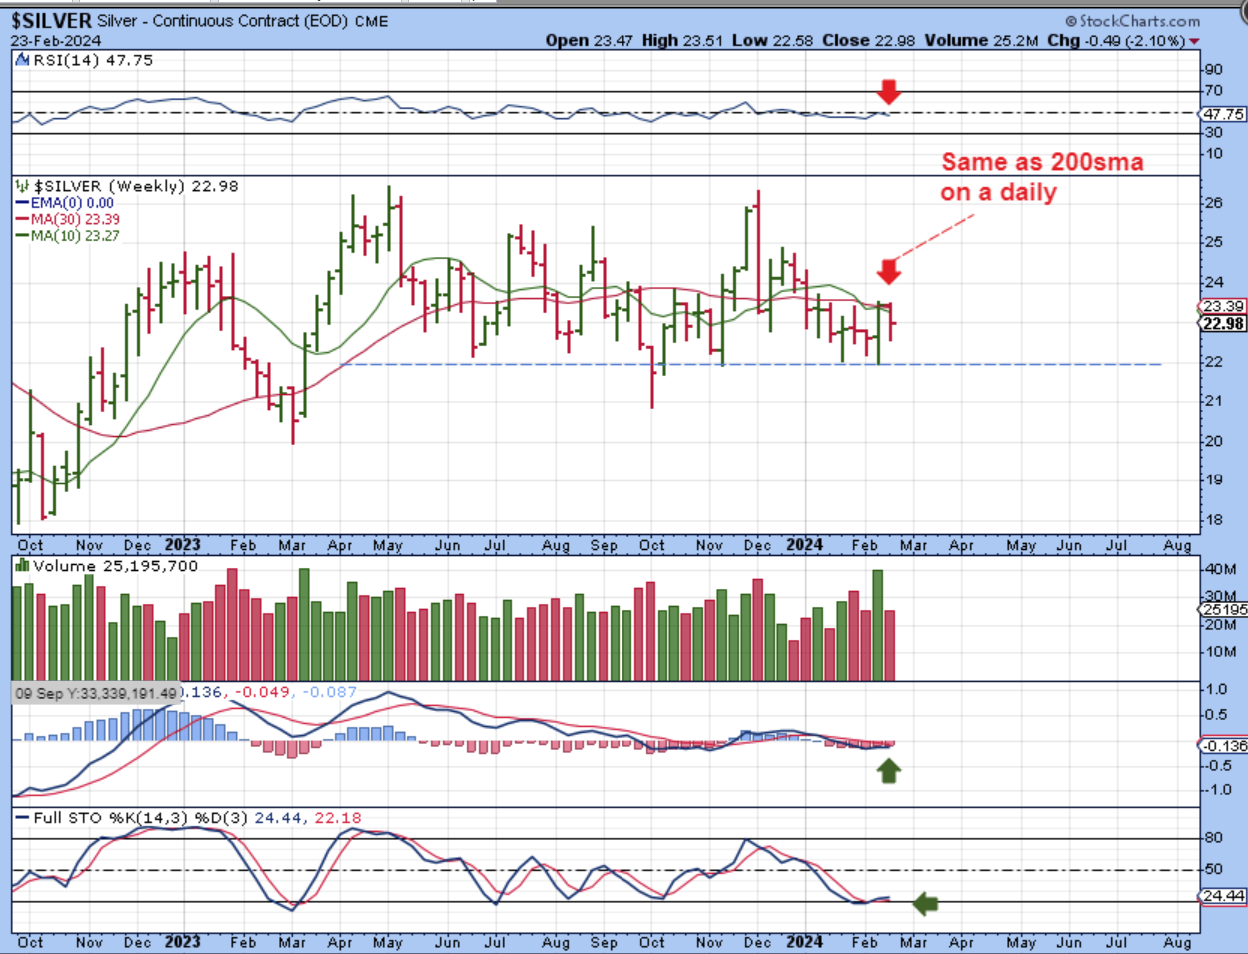
SILVER WEEKLY is also showing that 30 week MA as resistance, but a break above that is bullish.
,
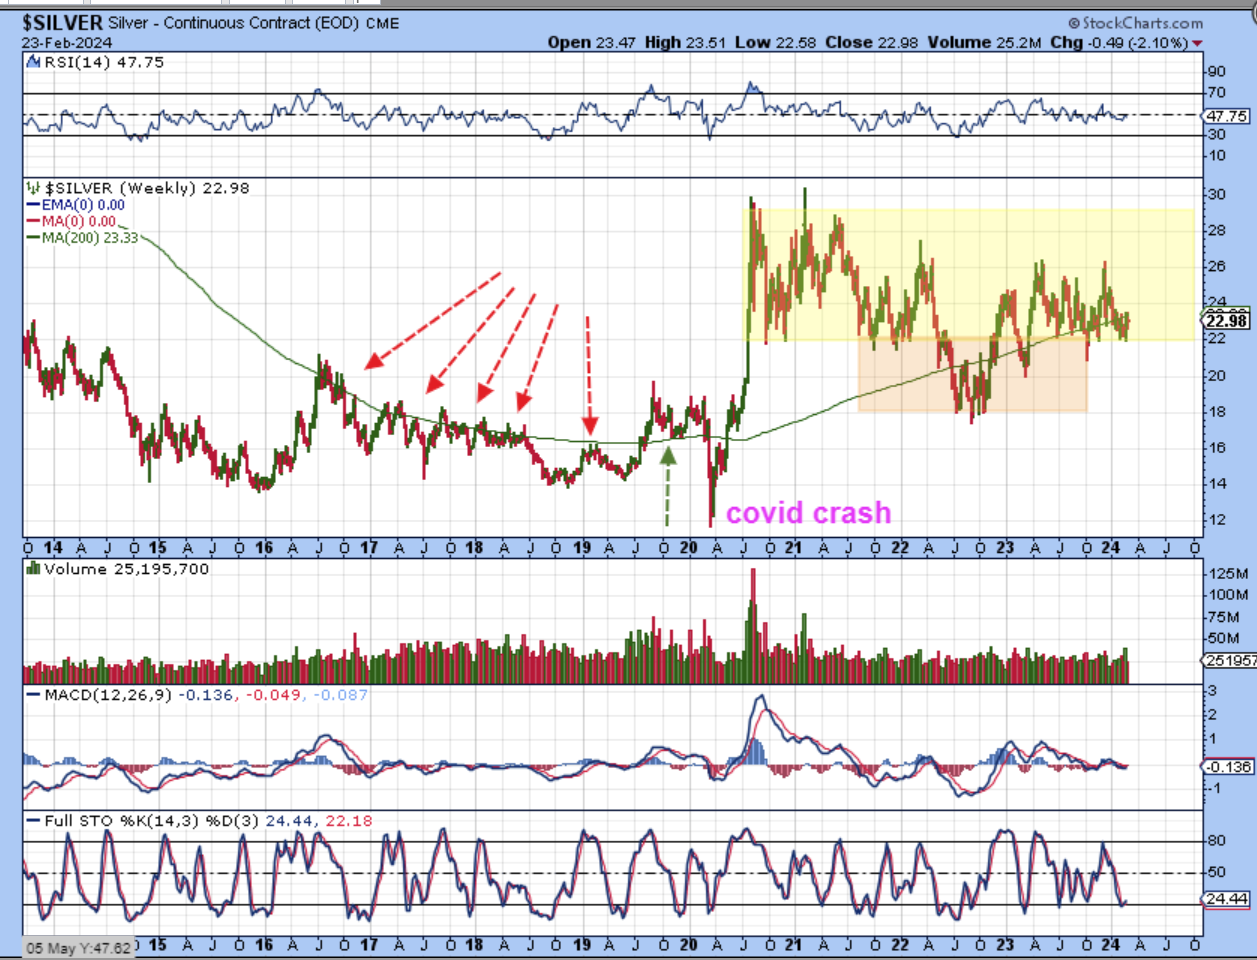
SILVER WEEKLY The Big Picture shows how price dances around the 200 week ma. Price is right at the 200 week ma now, and the weekly chart is oversold.
.
I want to remind everyone of what I wrote in THURSDAY MORNINGS REPORT: So this was noted after the Fed Wednesday Minutes…
.
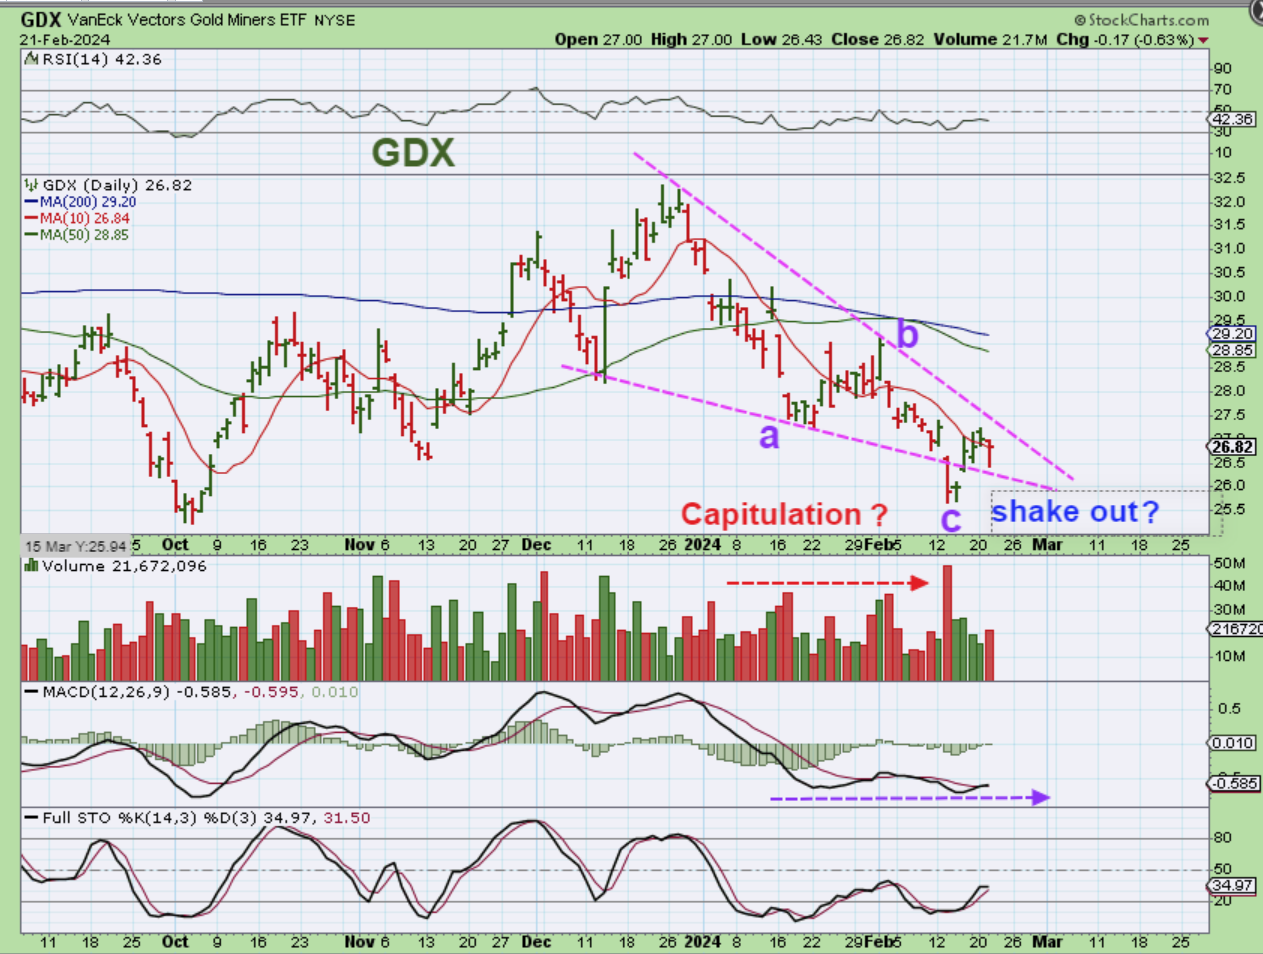
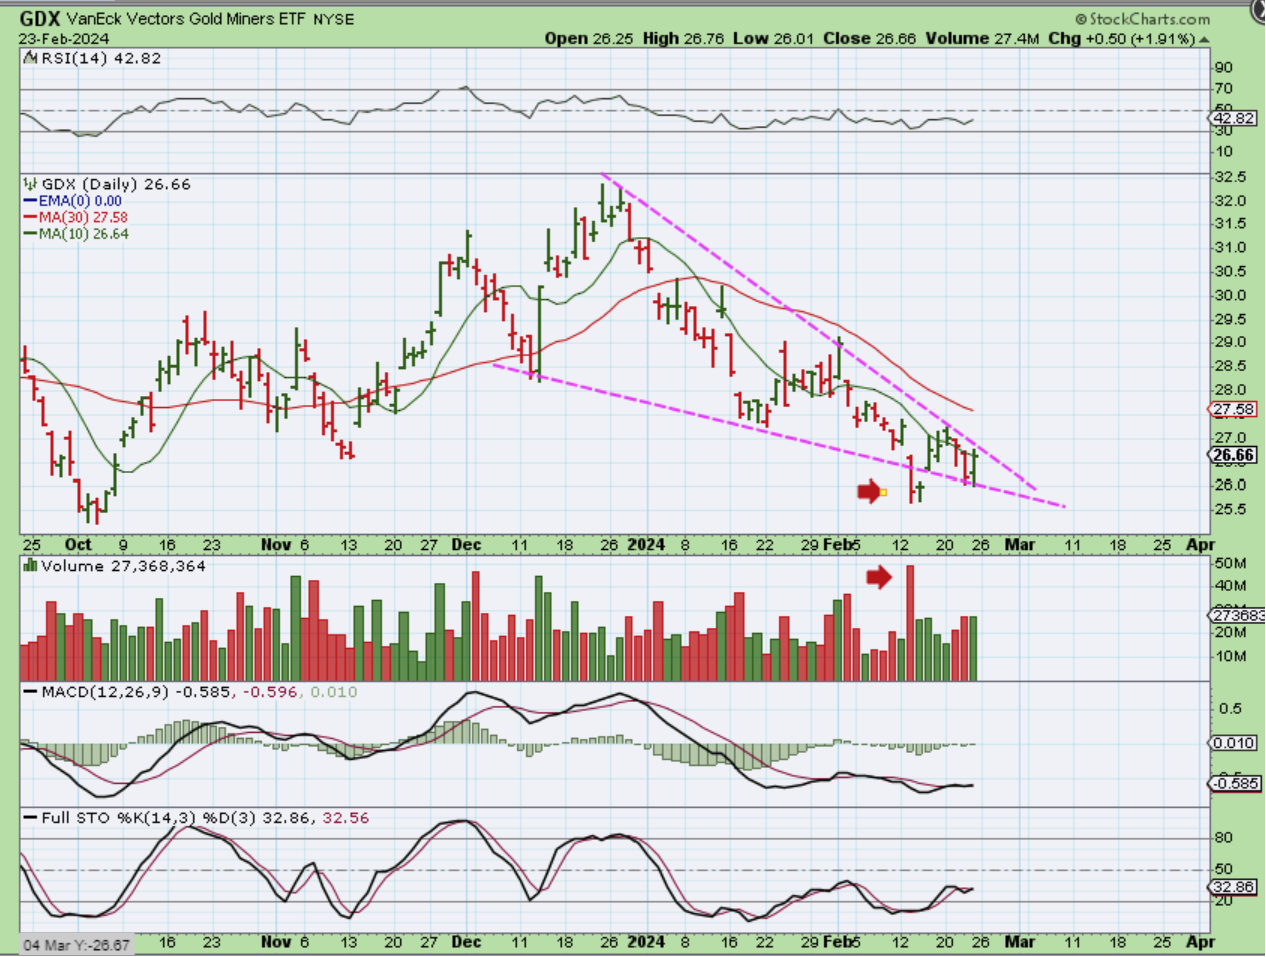
This is the good news: GDX at the lows means that when Gold starts to run higher, you haven’t missed a thing. If Gold & Silver do have stealth ICLs, then GDX could also be viewed this way…
1. GDX has an A-B-C down to a capitulation low.
2. Has a capitulation candle at the lows
3. It may be a shake out and this may be a bullish descending wedge, as drawn. It also has a MACD divergence at the lows.
GDX 2 days later: GDX DROPPED & REVERSED, SO IT IS STILL AT THE SAME PRICE.
The GDX dropped on Thursday and then it put in a solid reversal candle after filling that open gap on Friday. Everything that I wrote after the Fed Wednesday action still stands – this could still be an a-b-c down into capitulation ICL. A very mild one.
Think about that: This could be day 7 out of the ICL, but we are still RIGHT AT THE LOWS. You could buy a starter position with a stop and add if it breaks above the wedge, we might even see it rally.
.
So the set ups that were bullish remain bullish in the Big Picture and for the Precious Metals sector? It will likely depend on the USD to decide which way it will go next week. We may have formed a stealth ICL, but that won’t be confirmed until we get a little more upside. I discuss Bitcoin below, Enjoy your weekend!
,
~ALEX
.
I Think that it would be helpful to rediscuss what I mentioned in Fridays report, before I discuss the weekend view. If you feel that a review is not necessary for you, AT LEAST skim thought and look at the next couple of charts and then see what has happened this weekend. 🙂
.
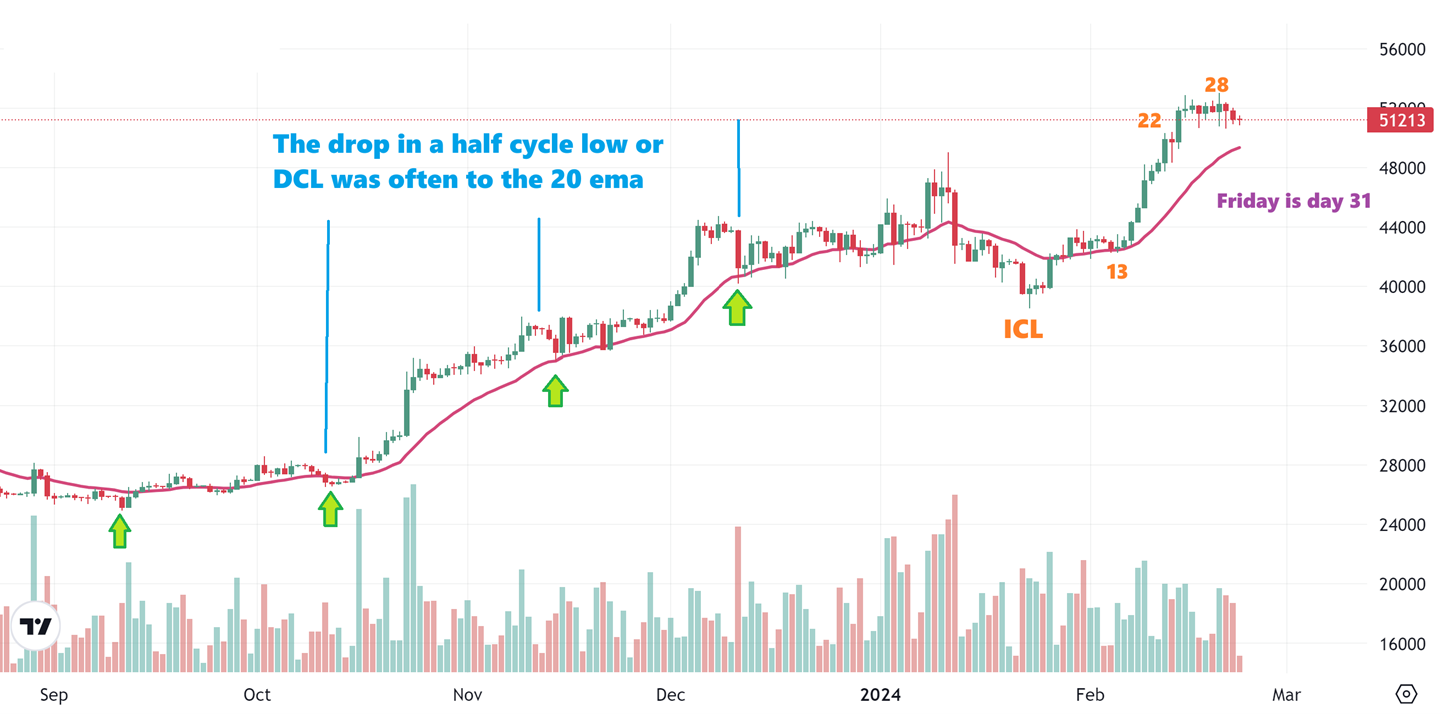
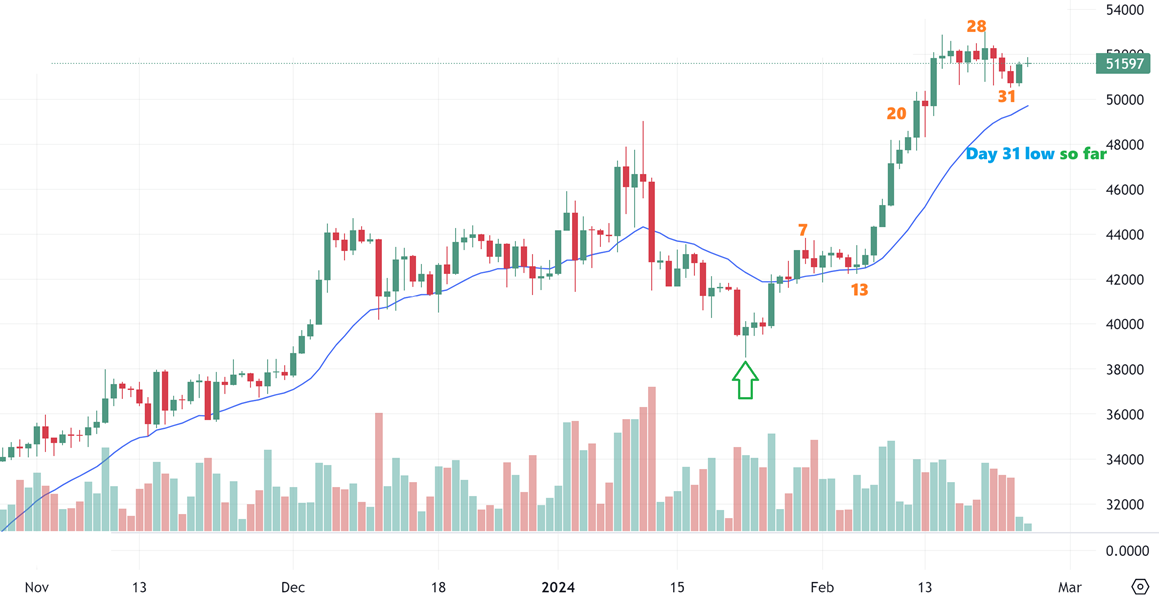
Bitcoin – So far our ‘peak’ is day 28, and our ‘half cycle dip’ came the next day on day 29. Today is day 31. As mentioned in yesterdays report, we have often seen Bitcoin just suddenly sell off to the 20 ema, also seen on this chart.
1. That means that we could drop quickly down to the $49,000 area on day 31 (today) or maybe over the weekend. Or…
2. This could just continue to bore us to tears and chop sideways until that 20 ema catches up to price a little more in a week.
3. There is nothing that says that this daily cycle can’t just be stronger and no longer dip down to the 20 ema. Sometimes a bull run will get steeper and find another moving average to ride, like the 13 sma. (However the 20 ema is pretty popular for a strong bull run).
.
Bitcoin:
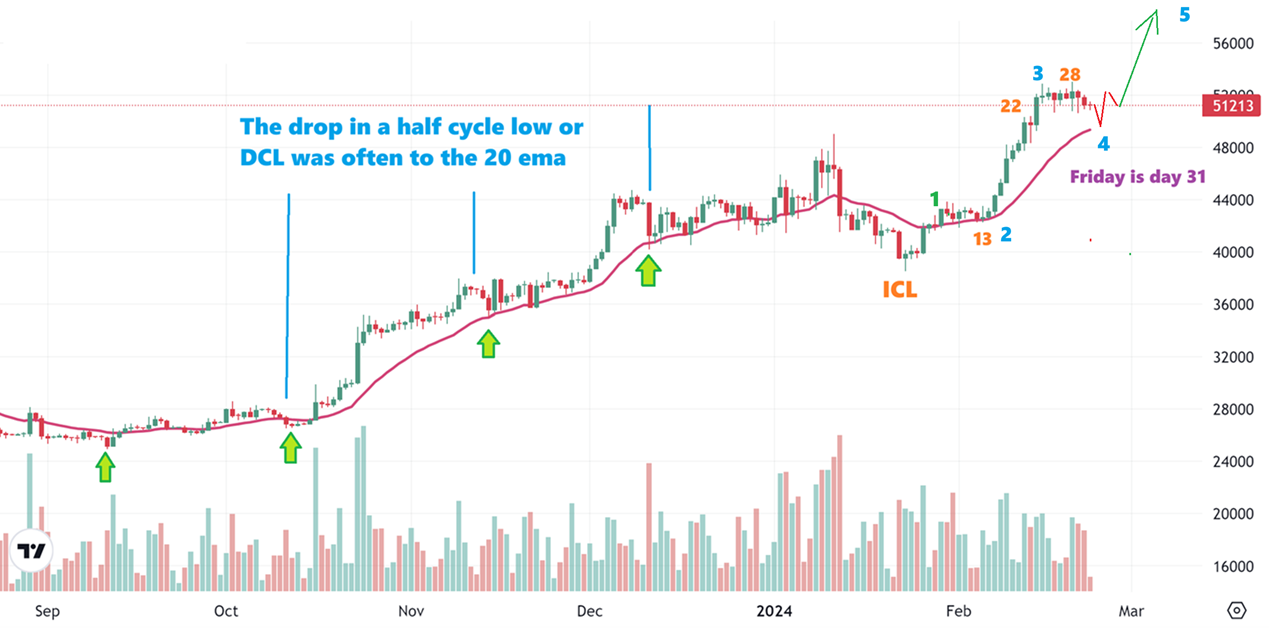
Yes, Bitcoin has had a strong run already in 2023 and it can just continue to chop sideways here like it did from late November to January, but what I have drawn here would be the ideal outcome. 🙂 If that was an ICL, we could go higher from here and I would love to see this run back to former highs after a half cycle low.
.
.
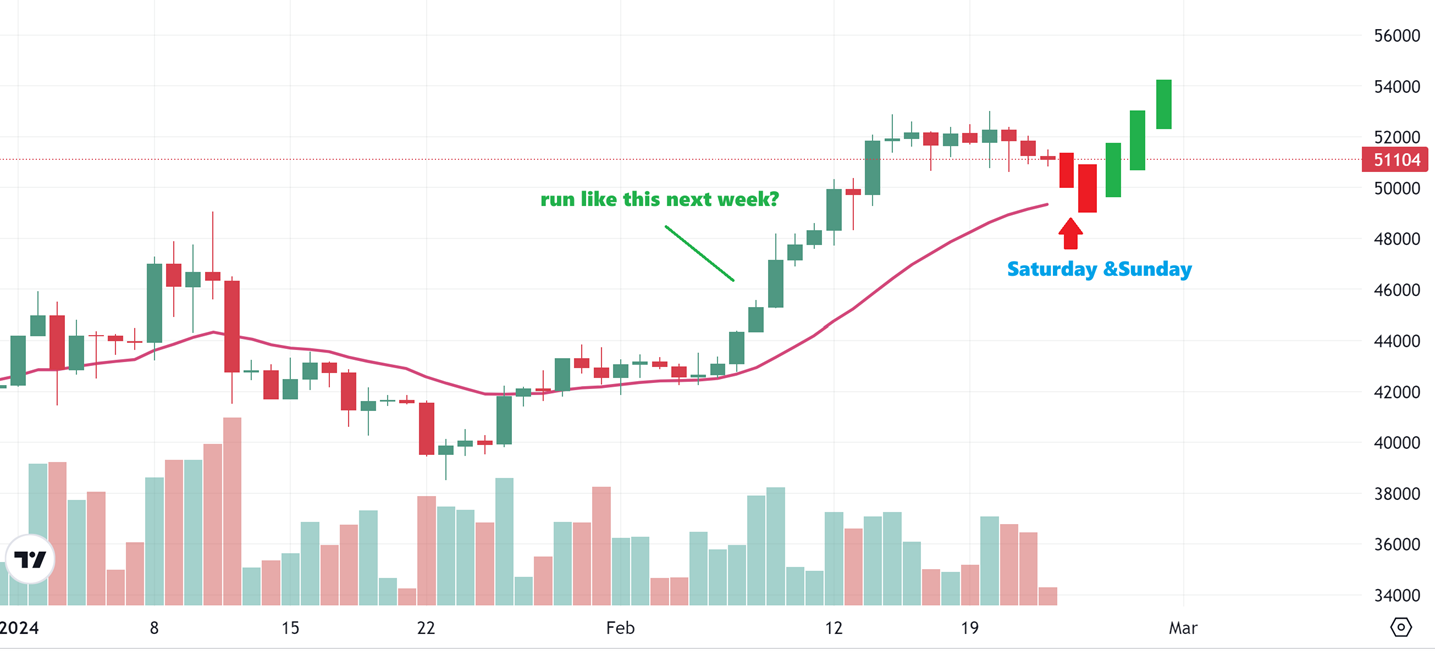
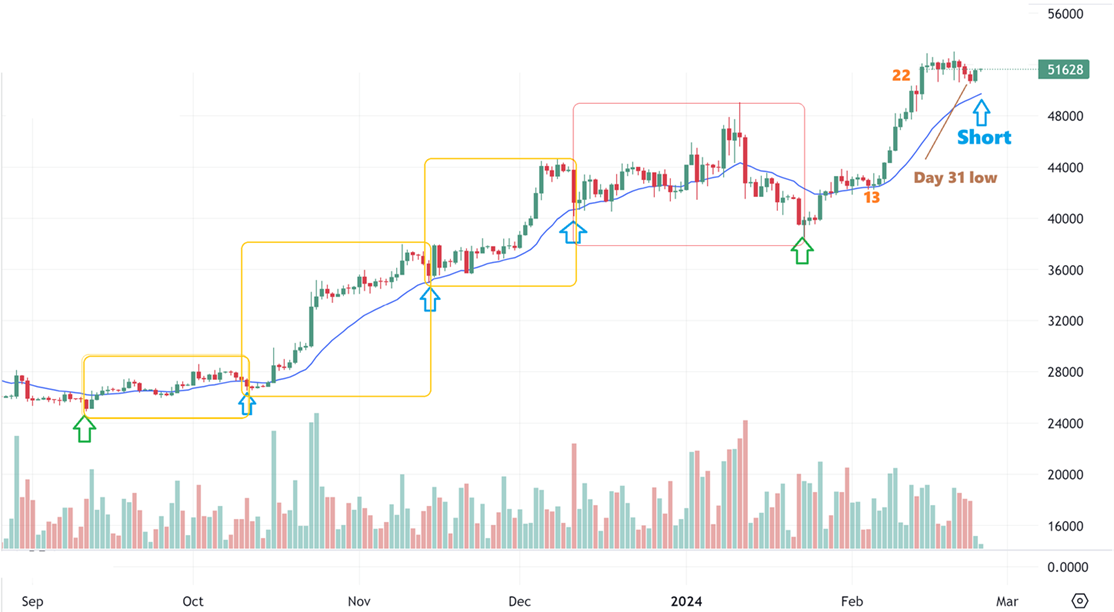
Bitcoin :
– What if we drop Friday (& that scares people out), and then it tags that 20ema Saturday night or Sunday and flips higher? By the open on Monday the crypto stocks can be up 10% and then rally from there. It is VERY HARD to buy that, because often we are waiting for those gaps to fill, but sometimes they don’t. These stocks can gap open up 10% and be up 15% in minutes, so for THAT reason and due to the cycle timing, and the closeness of the 20ema, I will likely hold a core position or at least 1 or 2 ‘starter positions. I am NOT going ‘all in’, because ANYTHING can happen in this sector and it can slam down quickly too.
.
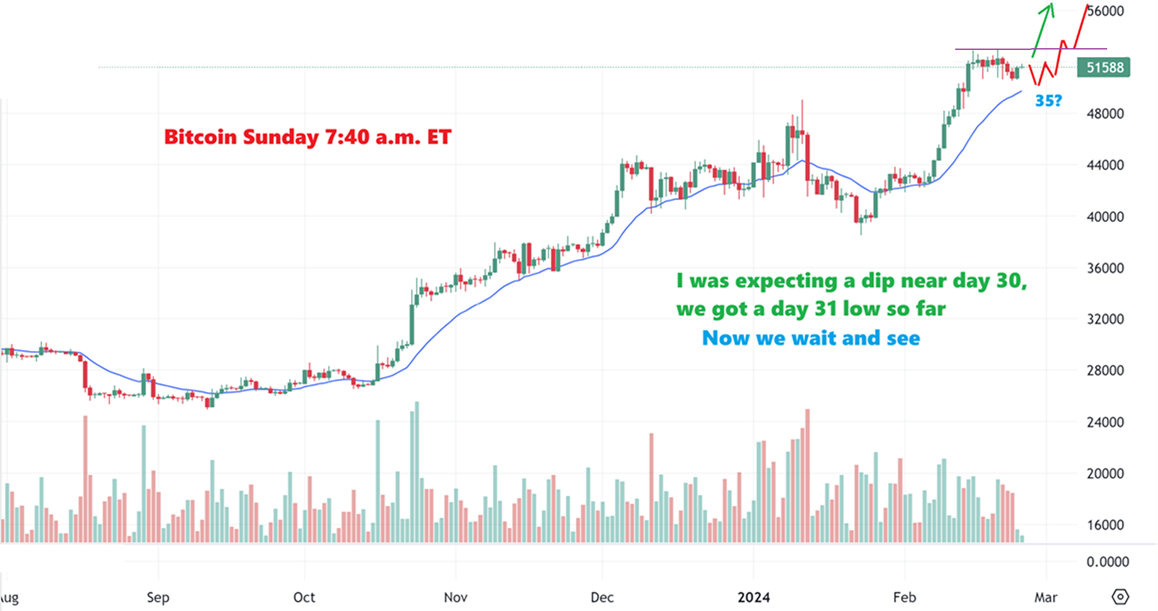
Bitcoin Sunday morning: Bitcoin did drop lower on Friday, but we did not drop far enough to tag that 20 ema yet and then it reversed. So we have a new low on day 31 that was followed by a push higher, but will it drop again or is that enough?
“Do we NEED to tag that 20 ema?”, or could that day 31 low be the half cycle low and we move higher from here? We did tag that 20 ema on the last run higher, so that is what I was looking for, but I found something that does indicate that a tag of the 20 ema may not need to be necessary…
.
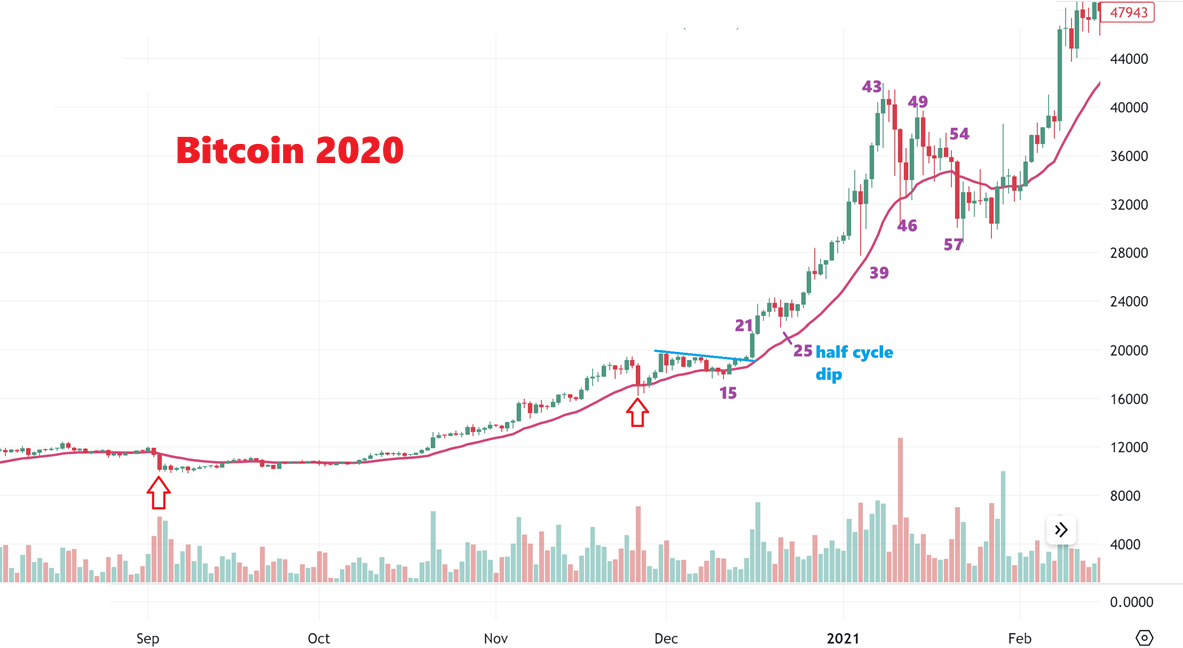
Bitcoin 2020 again – I wanted to take a look at that 2020 run again. Did we tag the 20 ema each time it pulled back? On this chart take a look at the 2nd red arrow and notice the sharp drop. That was a dcl or ICL, so next I count from there…
1. Bitcoin ran to day 15 and it dipped to the 20 ema again and then it broke out higher.
2. Now take a look at day 21, and we see that the rally started to get choppy at day 22-30, similar to now, as the timing for that day 30 half cycle dip closed in.
3. On day 25 we saw a dip, but it DID NOT tag the 30 ema. It chopped sideways until day 28 and took off higher without tagging that 30 ema.
4. In Conclusion: At that time, we got a day 25 half cycle low that came up short of the 20 ema.
BITCOIN SUNDAY MORNING:
I SHOWED YOU THE ABOVE CHART BECAUSE we have been watching that 2020 rally as similar to the current one. In 2020 we did not tag the 20 ema when it suddenly launched into the next strong leg higher, so maybe we don’t need to tag it this time? Well, we all know how tricky Bitcoin can be, and a sharp drop as drawn here on Sunday or Monday cannot be ruled out as impossible, so we’ll see if it starts higher soon and breaks the day 28 highs & continues higher?…or not quite yet. The day 28 highs are the next target that I am watching.
.

