Thursday Post Fed Minutes (& NVDA)
The Bull Markets have been strong. With the Release of the Fed minutes, we had a selloff in the General Markets, but suddenly those markets turned higher in the last hour of trading & they ramped straight up. We had similar movement in other sectors too. In after hrs, when NVDA released their earnings, NVDA popped up 10%, and the futures continued to rally too, so let’s take a look and see how this all fits in with my analysis…
.
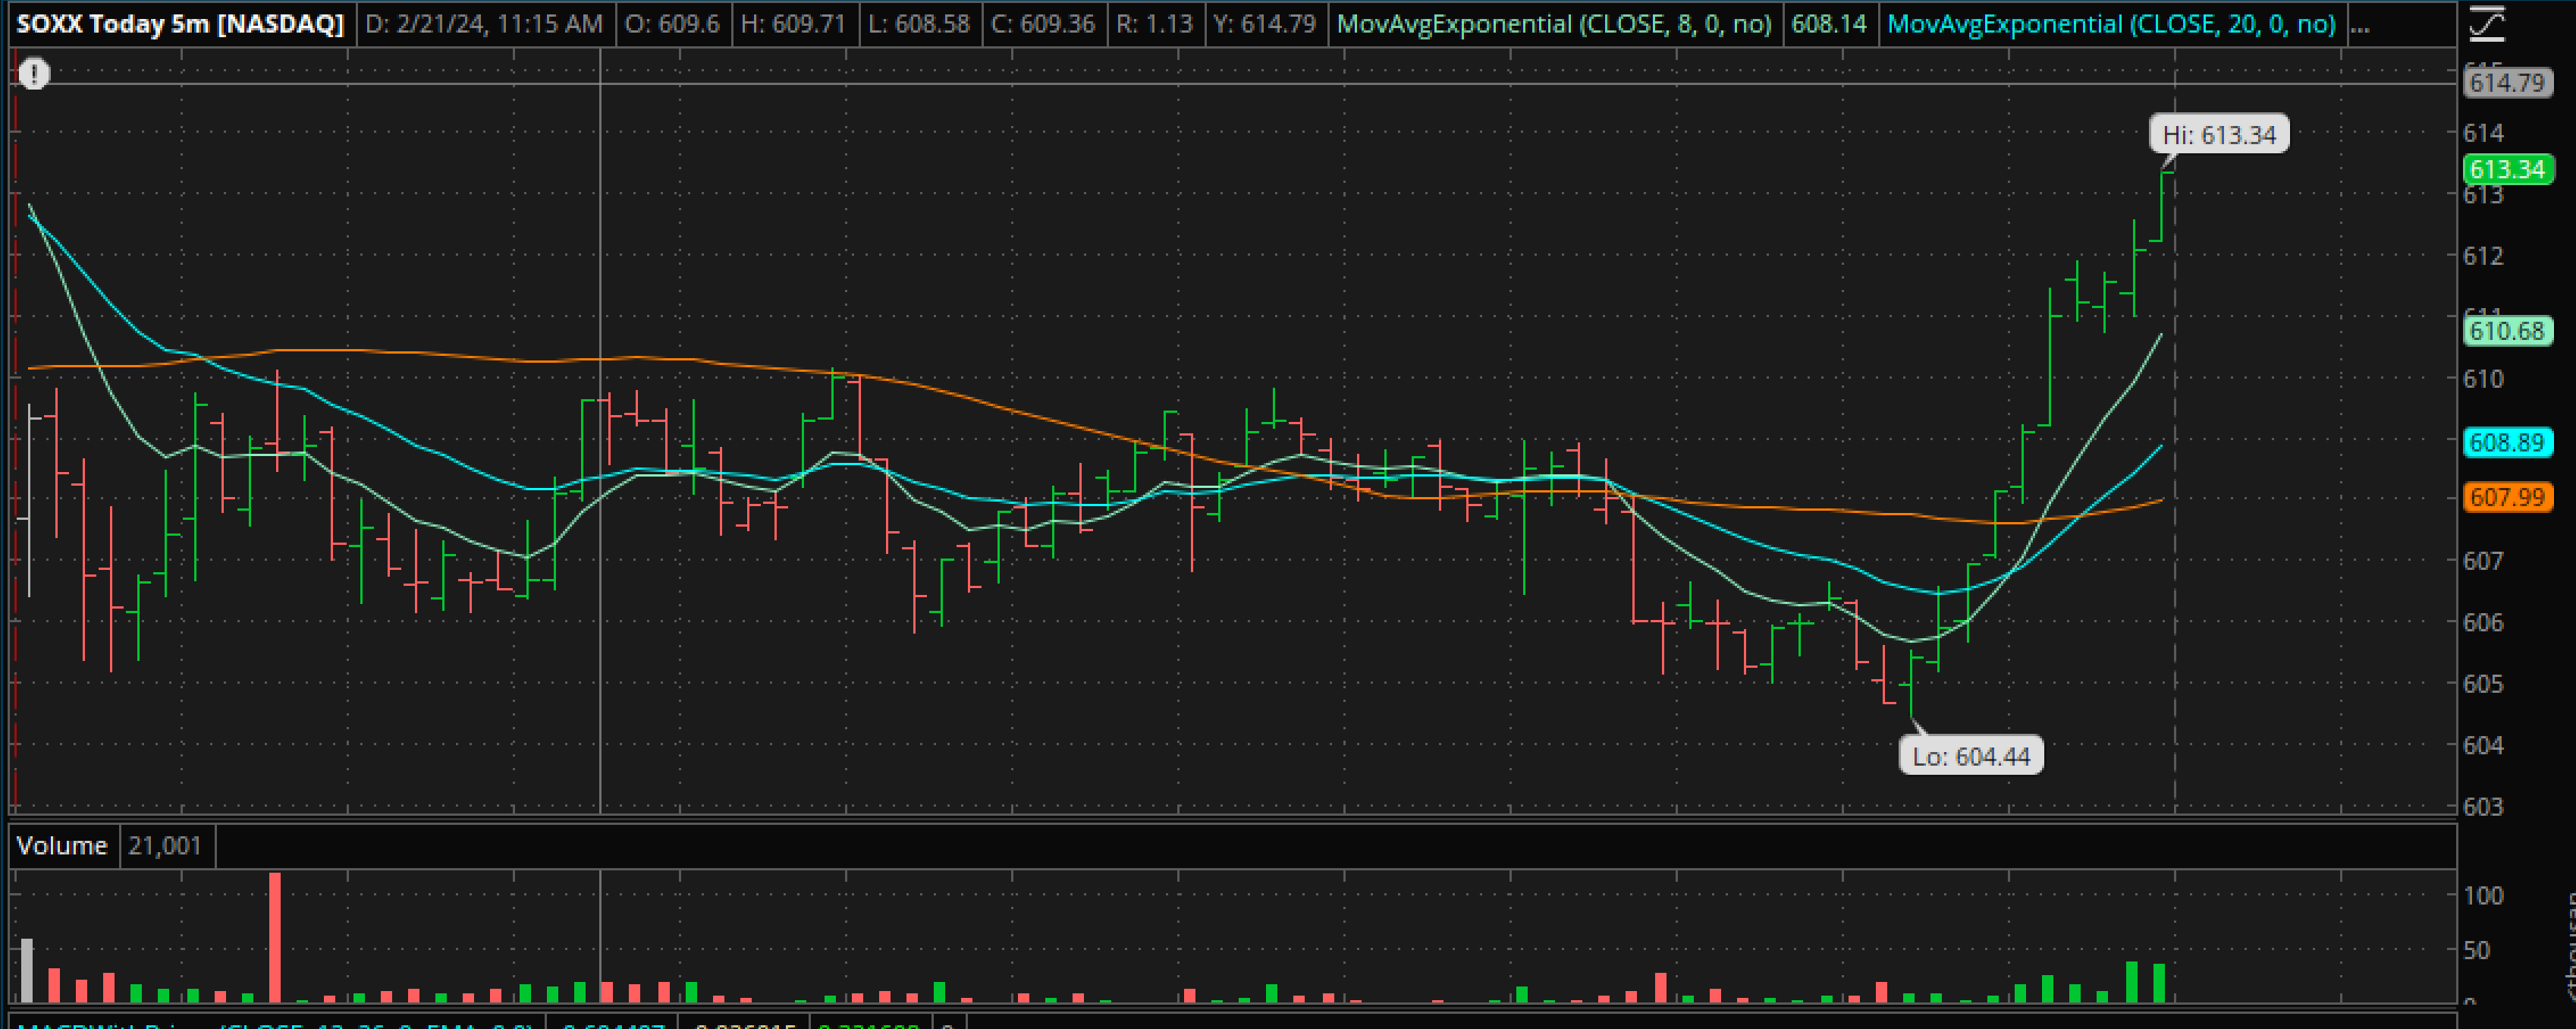
I want to start with the SOXX INTRADAY CHART: The markets pretty much chopped sideways all day waiting for those minutes.
1. After the release, you can see that a sell off started to take place from 2 to 3 p.m., but
2. Then in the last hour of trading The SOXX, SPY, and QQQ all took off higher into the close.
.
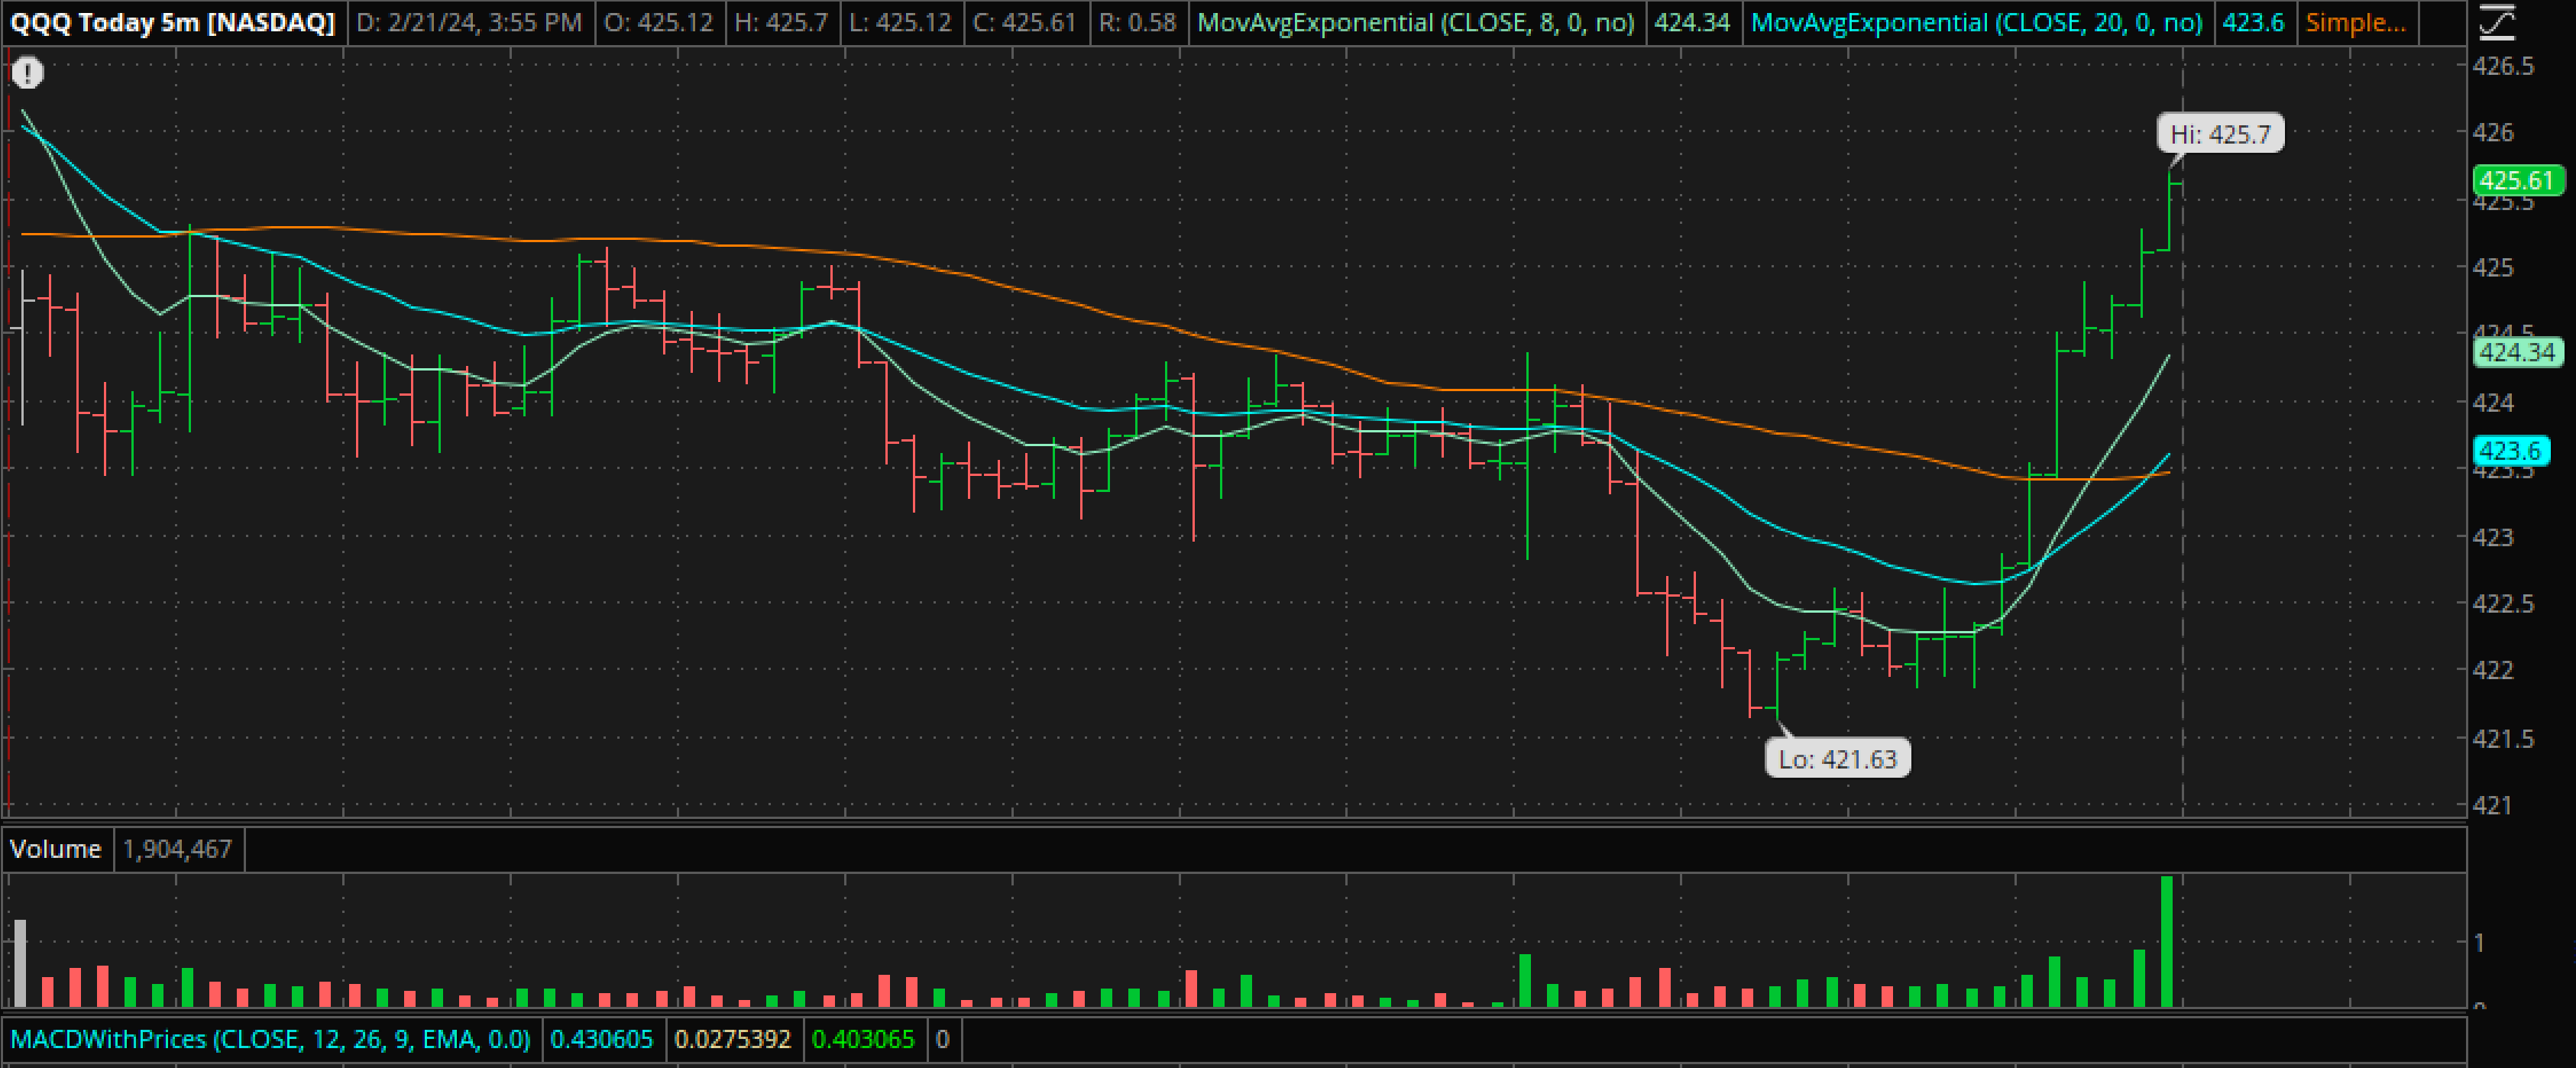
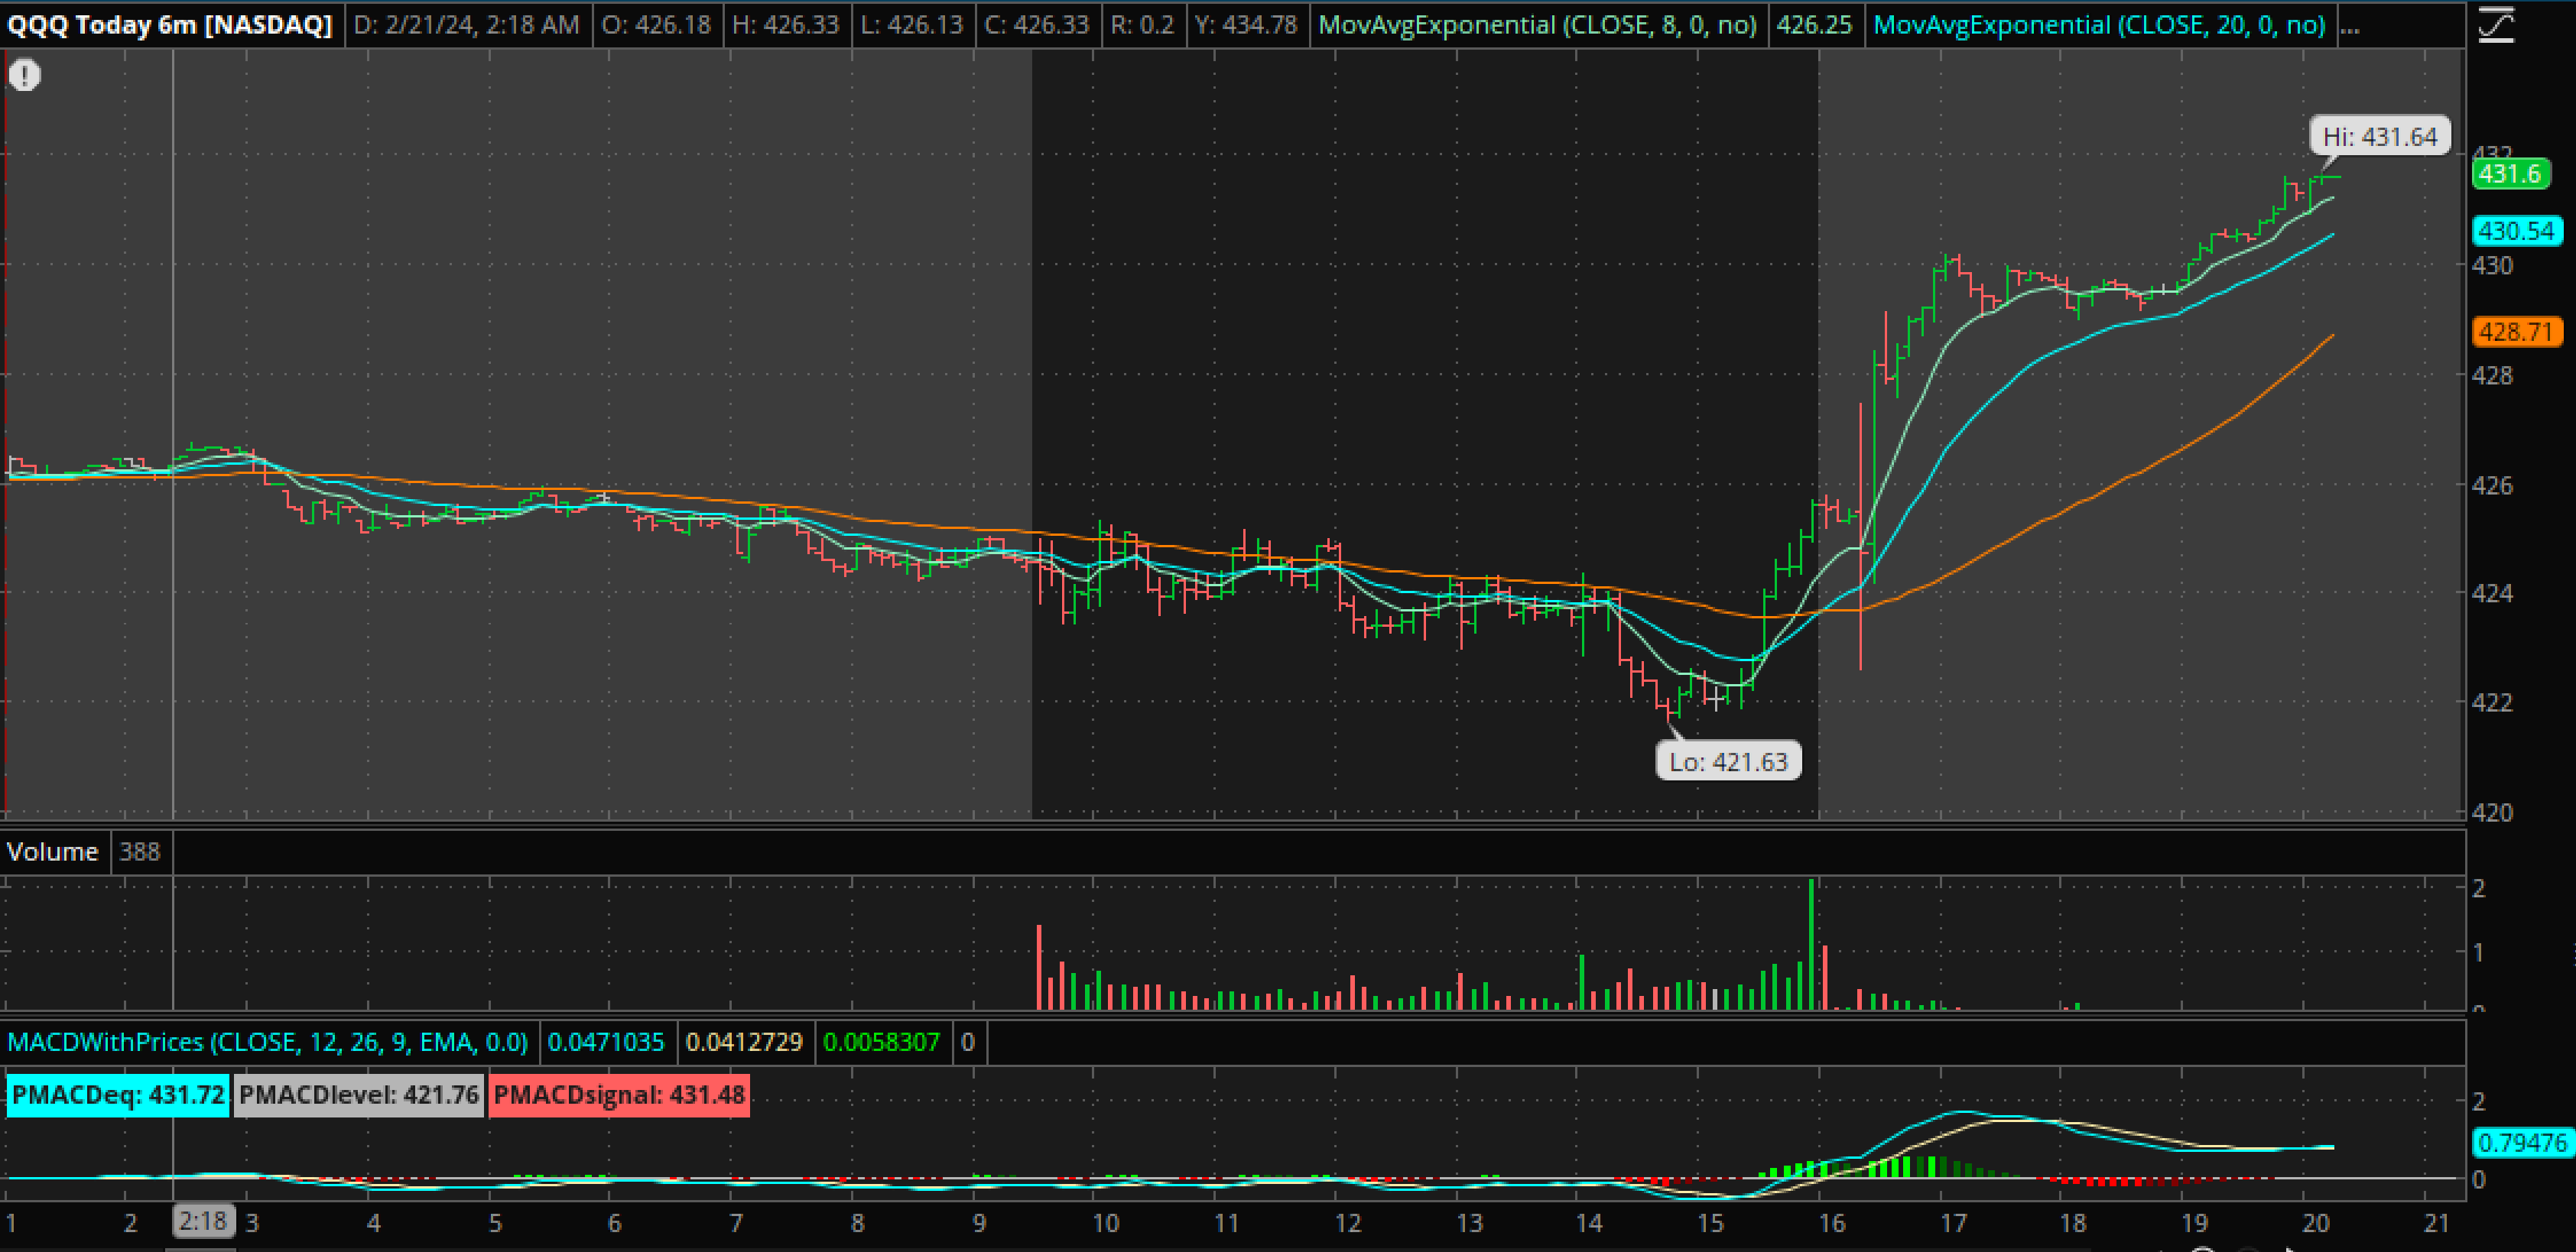
QQQ INTRADAY – You can see the same thing happened with the Tech Sector. When NVDA released their earnings…
.
QQQ INTRADAY AFTER HRS IN GRAY– You can really see the change here:
1. In the darker box you see the choppy sideways action during the day,
2. Followed by the sell off after the release of the minutes.
3. In the final hour the markets rallied straight up out of that hole, closing at the highs of the day, and in after hrs…
4. The release of NVDA earnings caused that rally to continue.
.
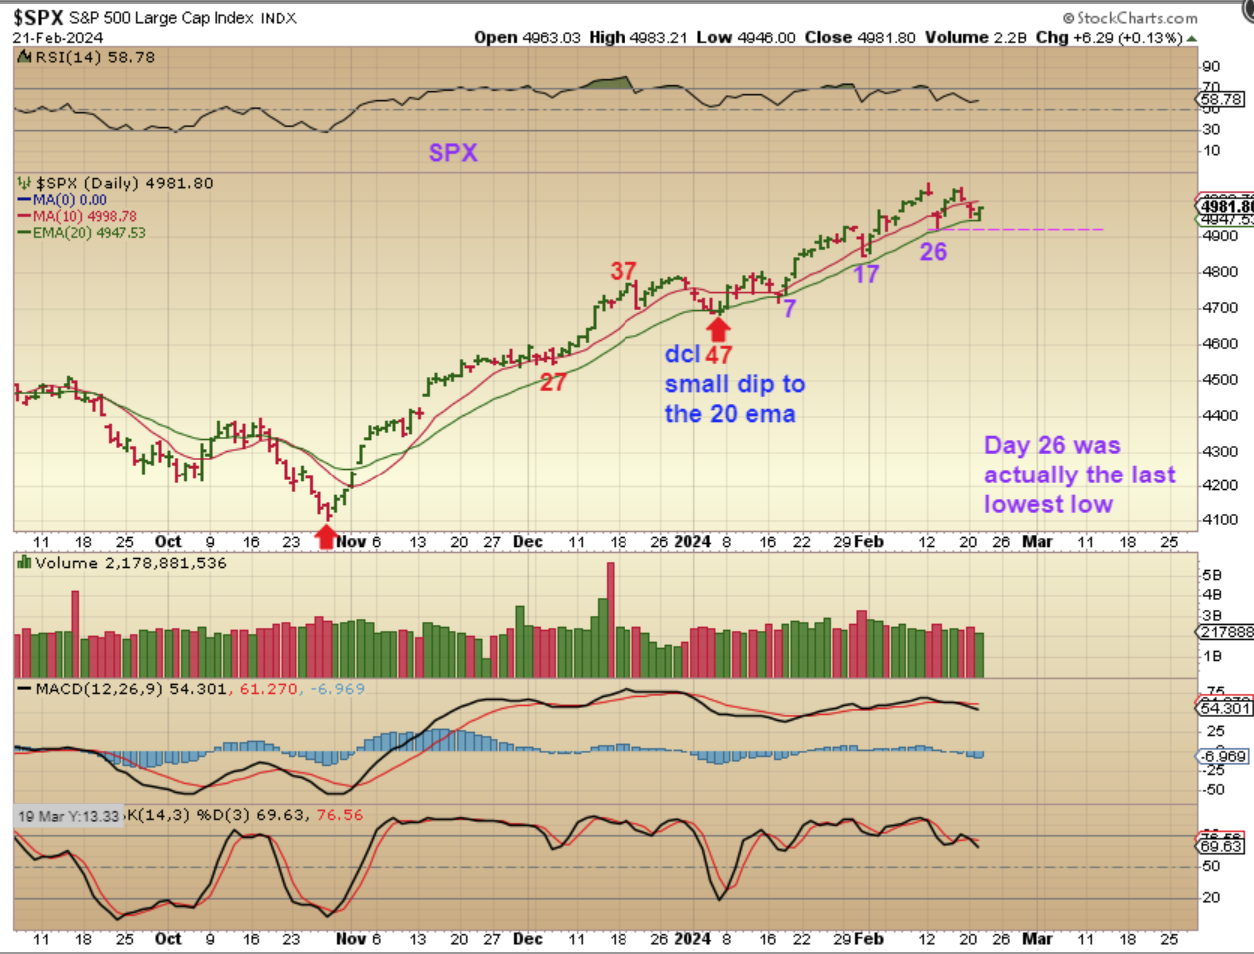
SPX – So on the daily chart we saw that drop and reversal, closing at the highs. Now that makes this quite interesting. Wednesday was day 31, but it didn’t break day 26 and it didn’t break the 20 ema. I mentioned a stop at the 20ema, and since that was never broken, we are likely going to get a continuation of this daily cycle (unless the jobs report hinders it on Thursday). So notice this…
.
So notice this:
Take a look at the first daily cycle and where it was at day 27. It still rallied to day 43 from there and then dropped to a dcl later. We are currently on day 31, so this may be what unfolds here if the markets rally on Fed Minutes, NVDA, and the Jobs Report. This can go higher and still be in the 2nd daily cycle.
.
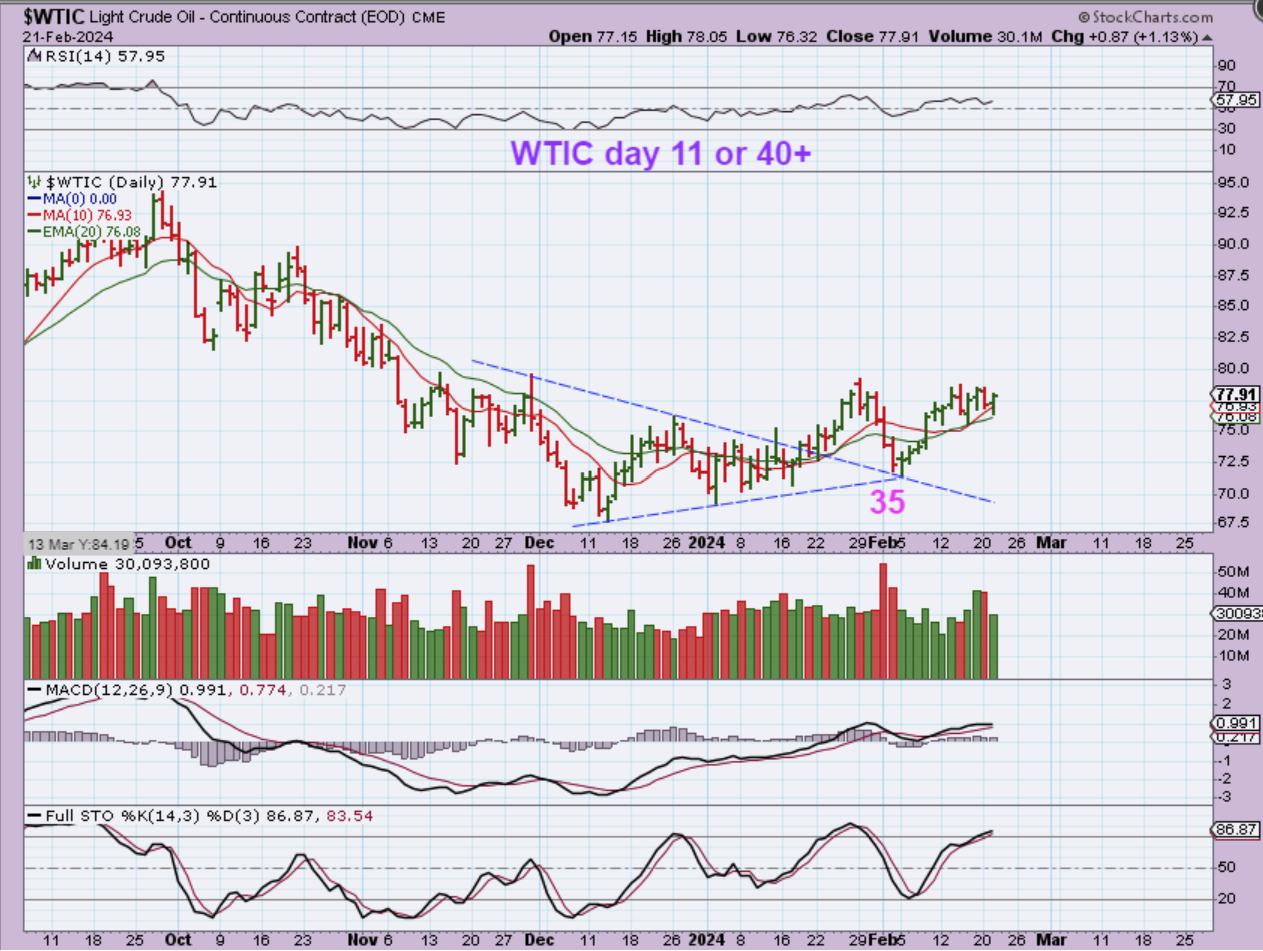
WTIC has been declared bullish and it is still acting correctly. This is day 11 of what is usually 40 -50 days or so. The Bullish daily cycles tend to be smaller and the last one was only 35 days long.
.
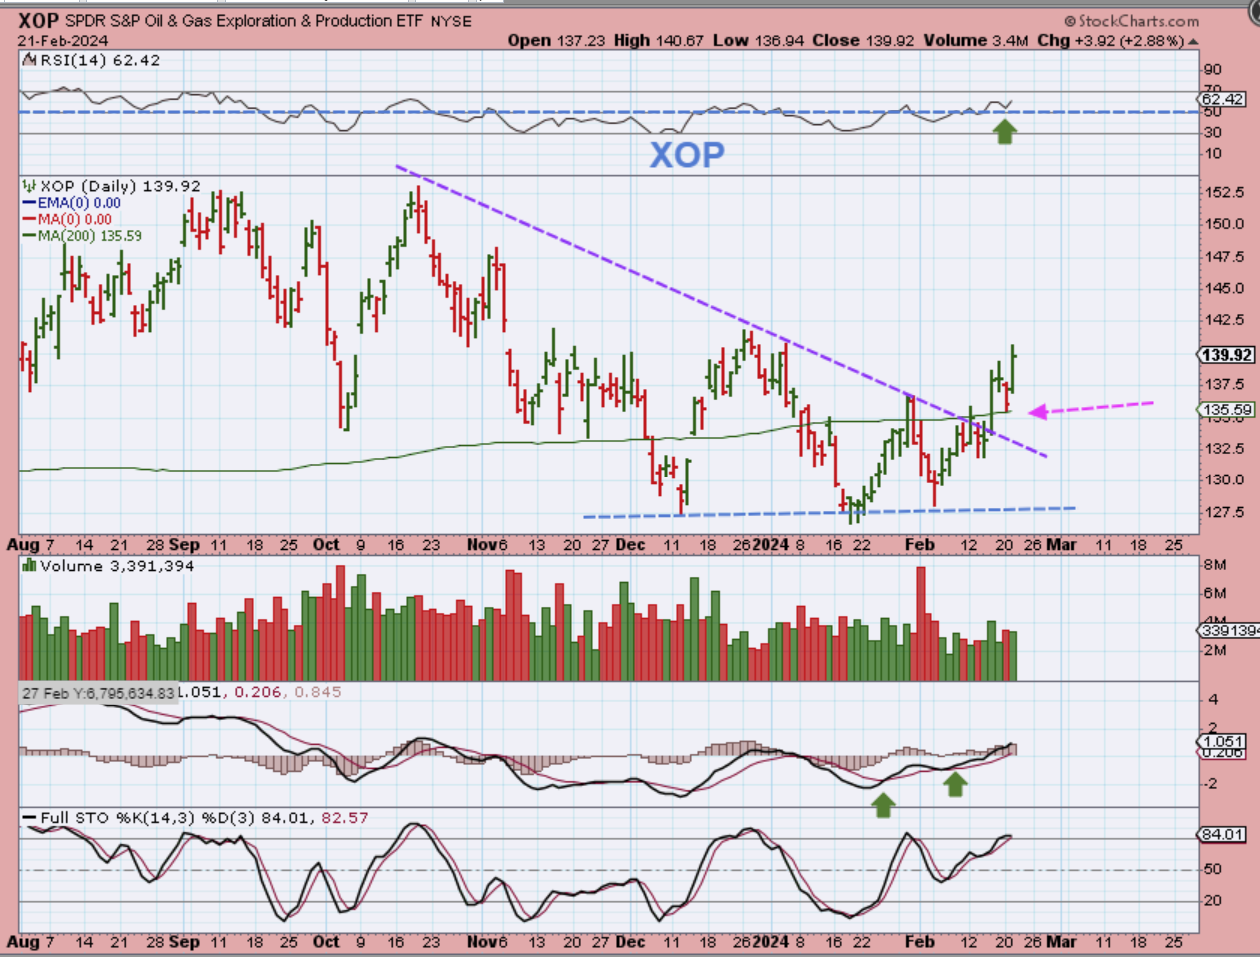
Notice how the XOP broke out from the downtrend and above the 200sma. It then paused for a day, dropped down and back tested the 200sma, and now looks ready to continued higher. The Oil stocks look good too.
.
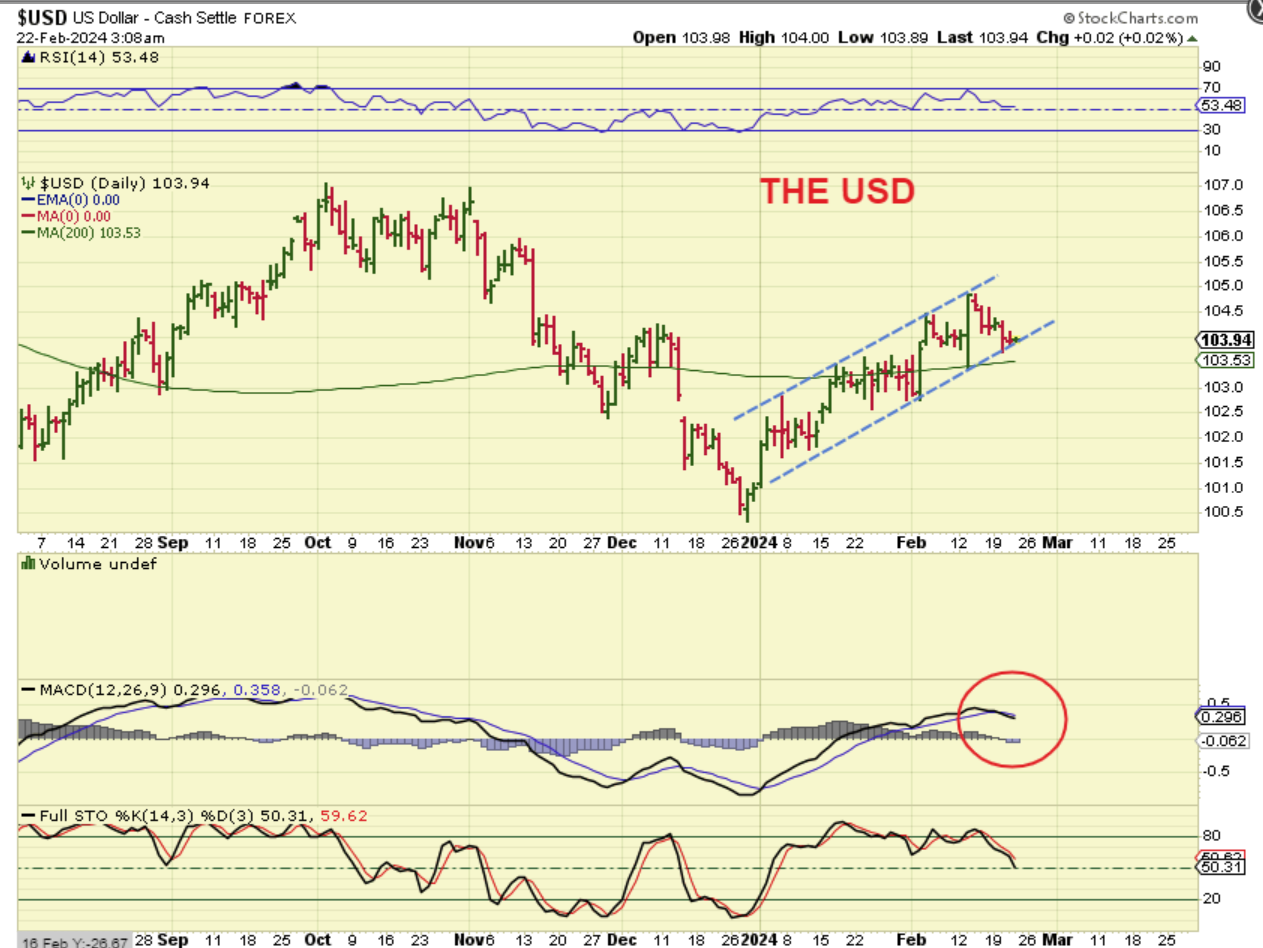
Well, The USD stayed on the lower support line of this channel and hardly moved on Wednesday. It did sell off intraday to the days lows in the final hour. The MACD has crossed lower and unfortunately it is very difficult (almost impossible) to see if or where it has its last dcl. That means that it may be ready to drop down into a dcl, but this is a very unclear set up. The MACD is a clue of weakness though.
.
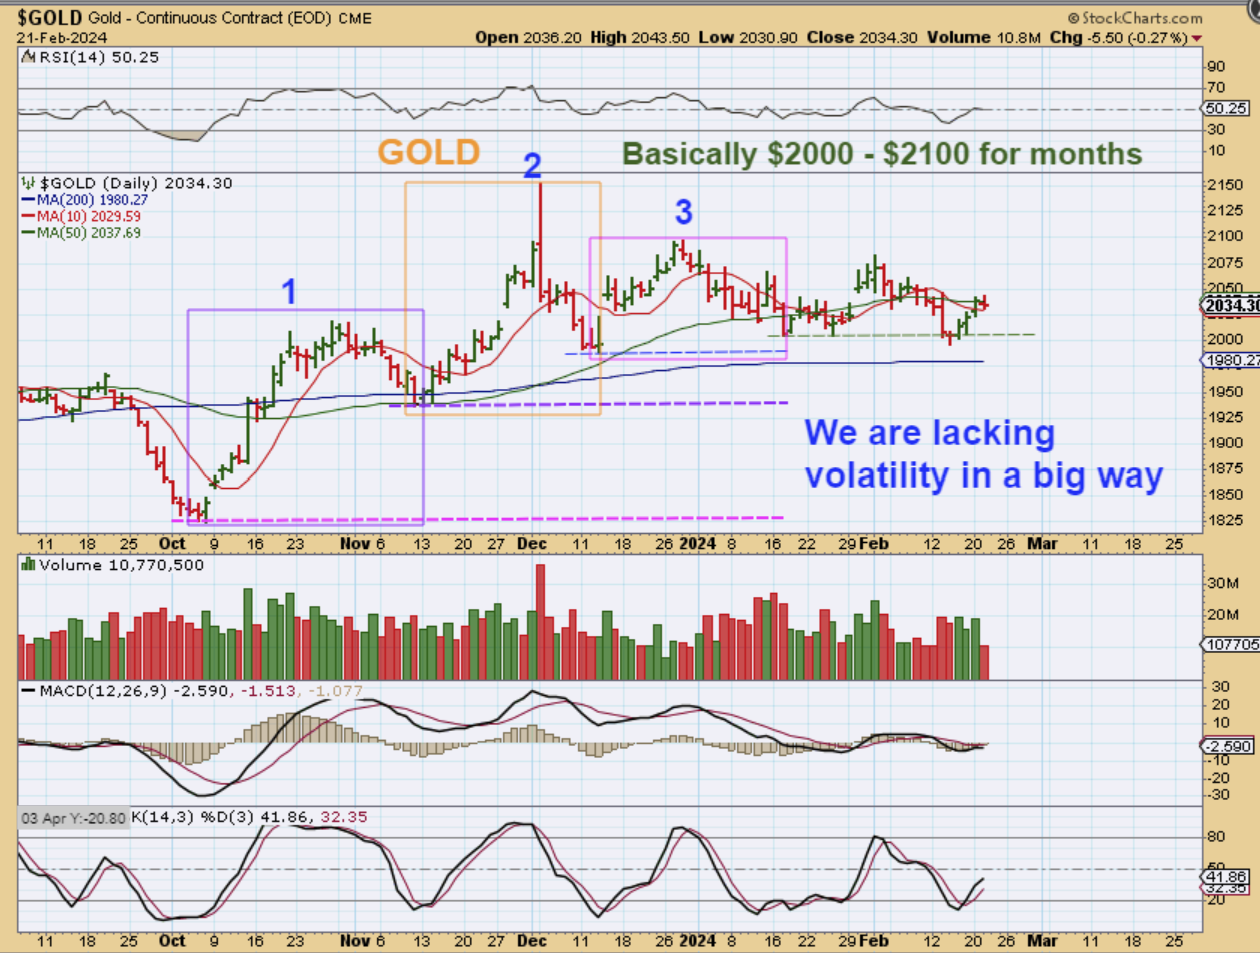
GOLD – I have repeatedly mentioned how encouraging it is to see Gold acting so strongly in a 4th daily cycle. Look at Gold over the last 3 months and you see Gold trading in a range of about $100 (except for the 1 day spike to all new highs). THAT is amazing this late in an intermediate cycle. Gold MUST be preparing to launch to new all-time highs again, but it really should drop lower into a deeper ICL first.
.
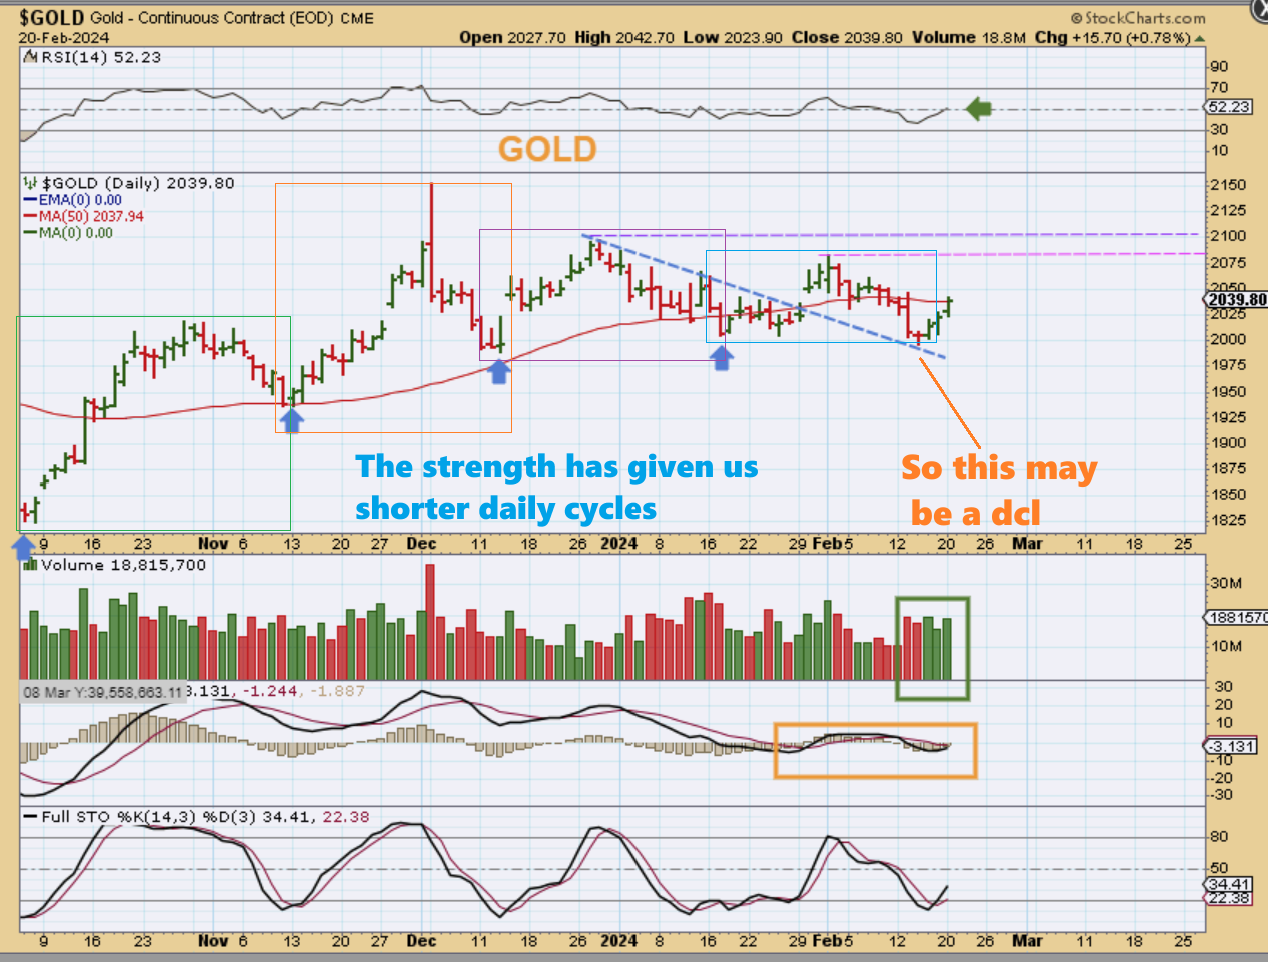
GOLD has been giving us very short daily cycles, so we are either in the 4th daily cycle on day 24, or we had a VERY short dcl at day 19, and this is the start of a move out of that low. Daily cycle #5 most likely.
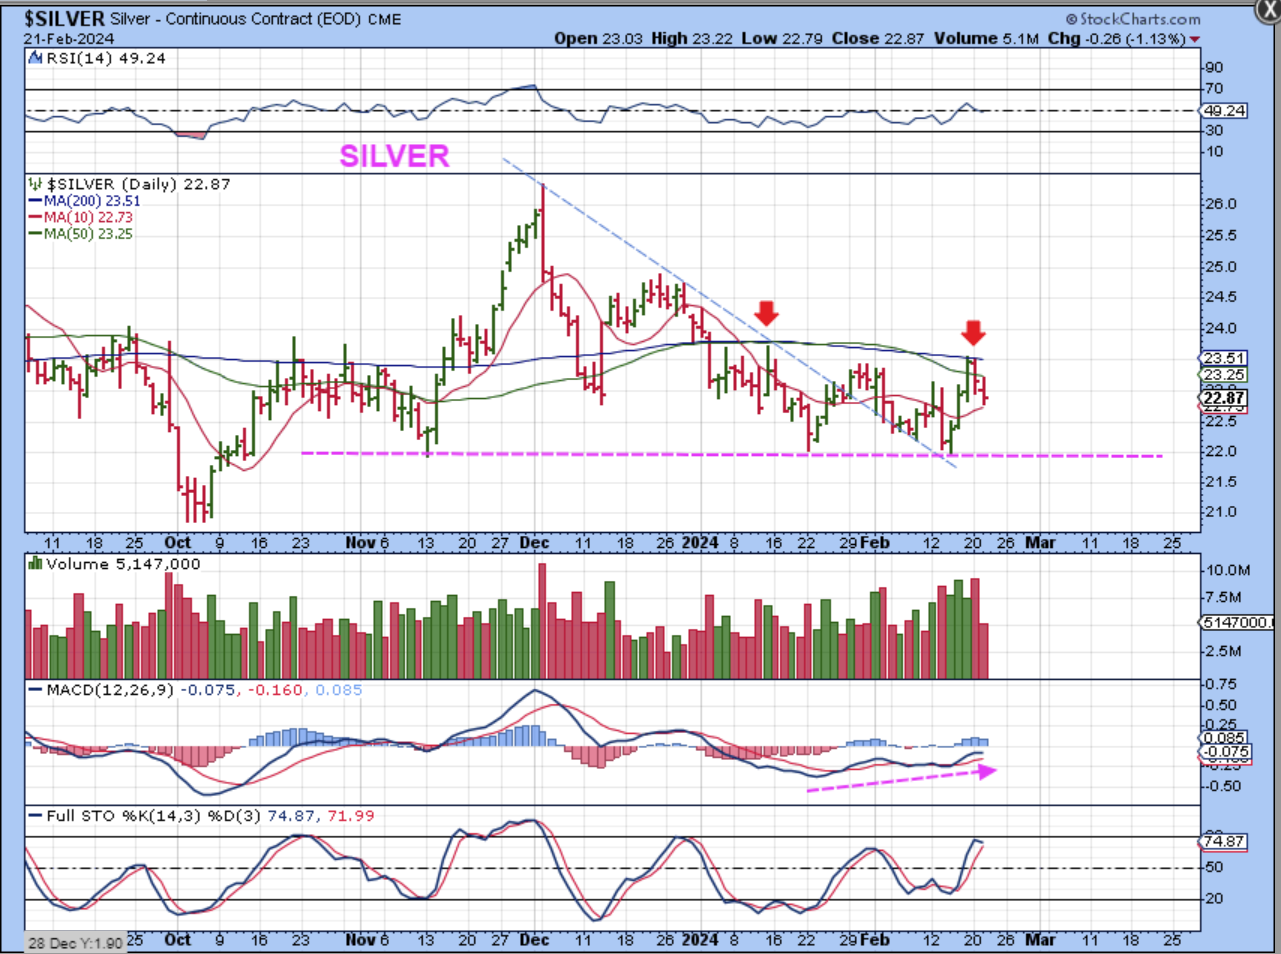
SILVER was rejected at the 200sma and Silver was down on Wednesday. Silver has a bullish look to it for several reasons, so we need to see if Silver can get above the 200sma. what Bullish features do I see in Silver?..
1. Day 2 out of that low took out the late Jan highs.
2. We saw a trendline break that has now been back tested
3. I see 5 waves down off of that spike top, into what may be the ICL.
4. The MACD is bullishly aligned at the double bottom lows
5. The 3 day bounce out of the last low pushed the RSI above 50
.
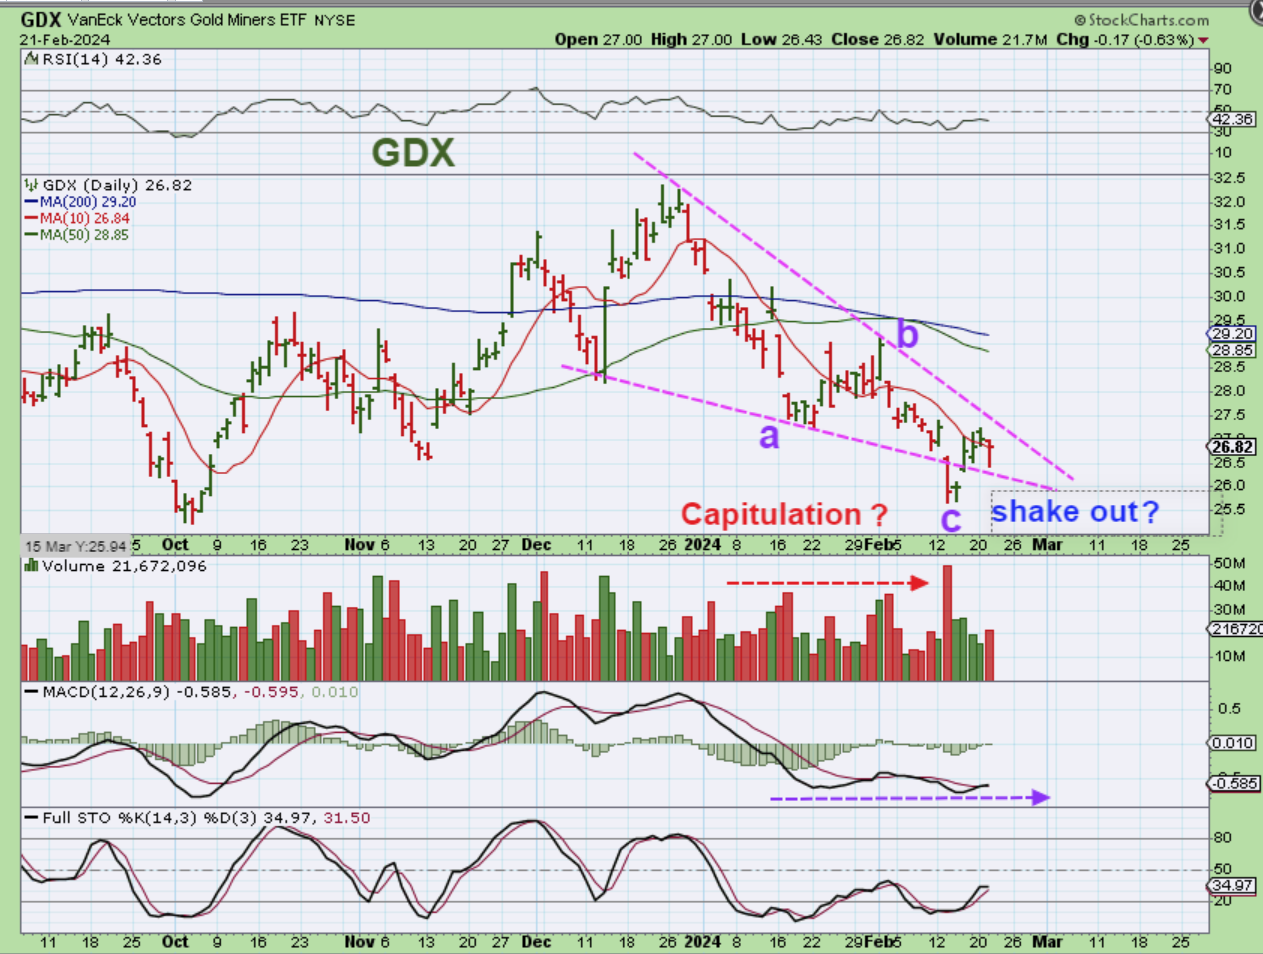
This is the good news: THE MINERS or THE GDX did not hold up nearly as well as Gold, and the GDX is back at the October lows. Why is that good news? It means that when Gold starts to run higher, you haven’t missed a thing. If Gold & Silver do have stealth ICLs, then GDX could also be viewed this way…
1. GDX has an A-B-C down to a capitulation low.
2. Has a capitulation candle at the lows
3. It may be a shake out and this may be a bullish descending wedge, as drawn. It also has a MACD divergence at the lows.
.
So we do have the jobless claims at 8:30 a.m. today, but the futures were very strong last night, so we’ll see how things play out. So far, the General Markets have been bullish until they aren’t (& they are). Riding that 20 ema has been the support for the 2nd daily cycle so far. The USD and Precious Metals both show signs of a change. The USD is starting to weaken, and the selloff in Silver and Gold (what selloff in Gold?) may be close to finishing up. We just can’t tell if we will have a 5th daily cycle or not yet. Stay frosty as things develop, this may become a great buying opportunity if Gold quickly spikes down into an ICL and then reverses higher. Enjoy your Thursday trading!
.
~ALEX
.
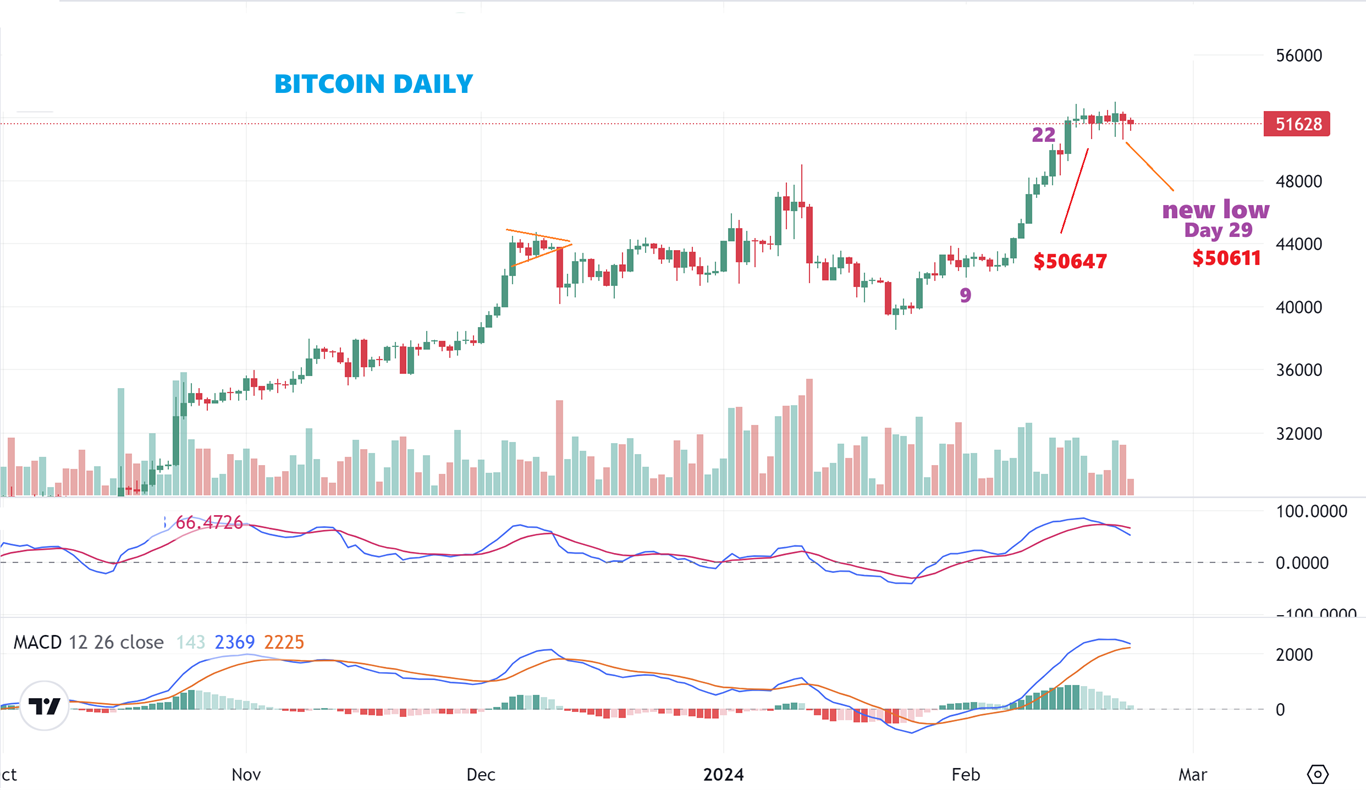
BITCOIN –
Today is actually day 30 for Bitcoin, and this is roughly the area where we get a half cycle dip. Bitcoin is chopping sideways and yesterday we did hit a new low in this consolidation at day 29. That is enough of a dip that Bitcoin can start to travel higher, however I did find something else that may indicate that another dip is still ahead…
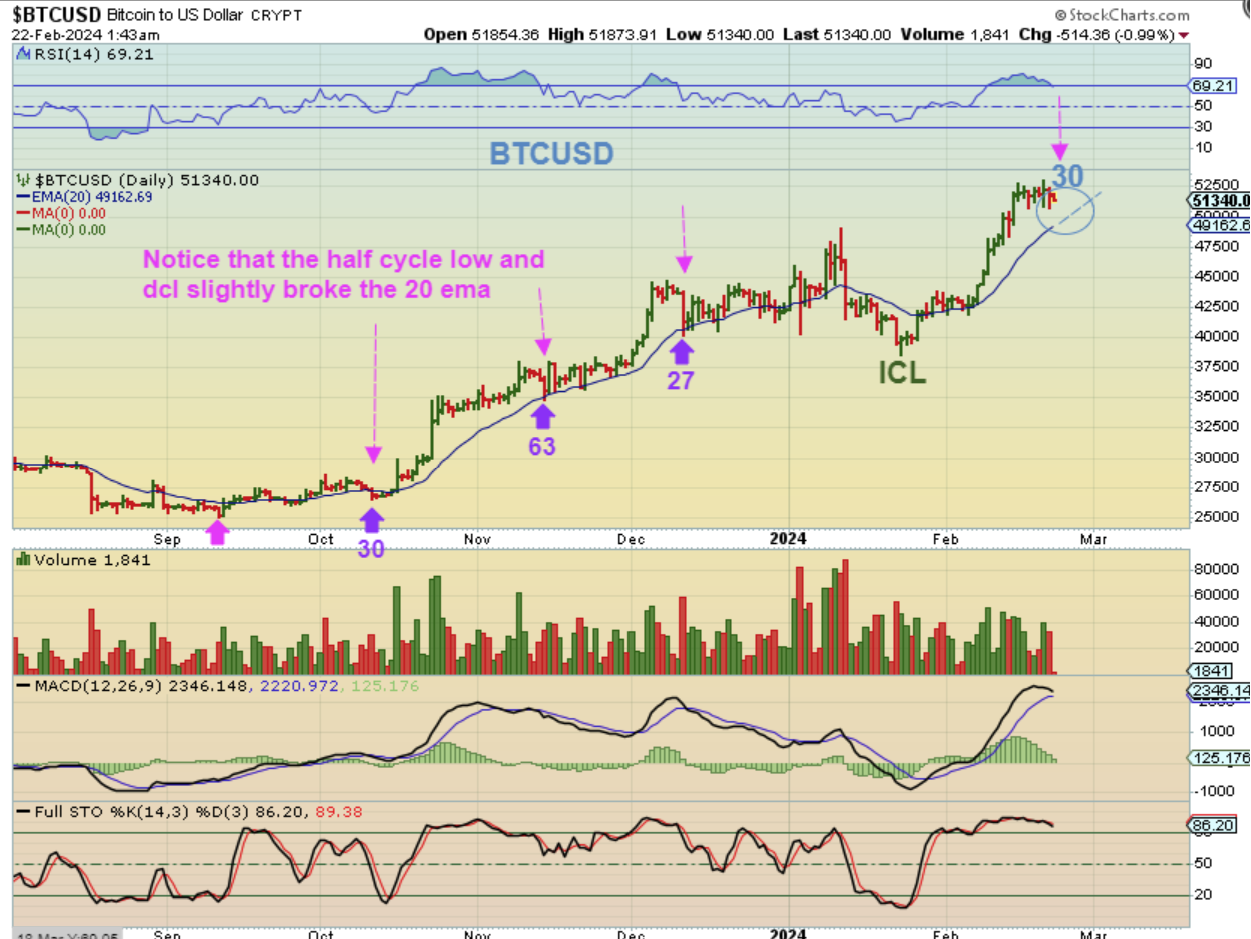
I wanted to get a different view of BITCOIN using Stockcharts, and when I did, I noticed something…
BITCOIN – The prior dips down into the day 30 or day 60 lows (half cycle and dcl) actually dropped down to and slightly broke the 20 ema. Even that day 27 sharp drop in the last daily cycle did that, so I wouldn’t be surprised if Bitcoin continues to churn sideways as the 20 ema rises, or it could do a quick dip down to that 20 ema.
.
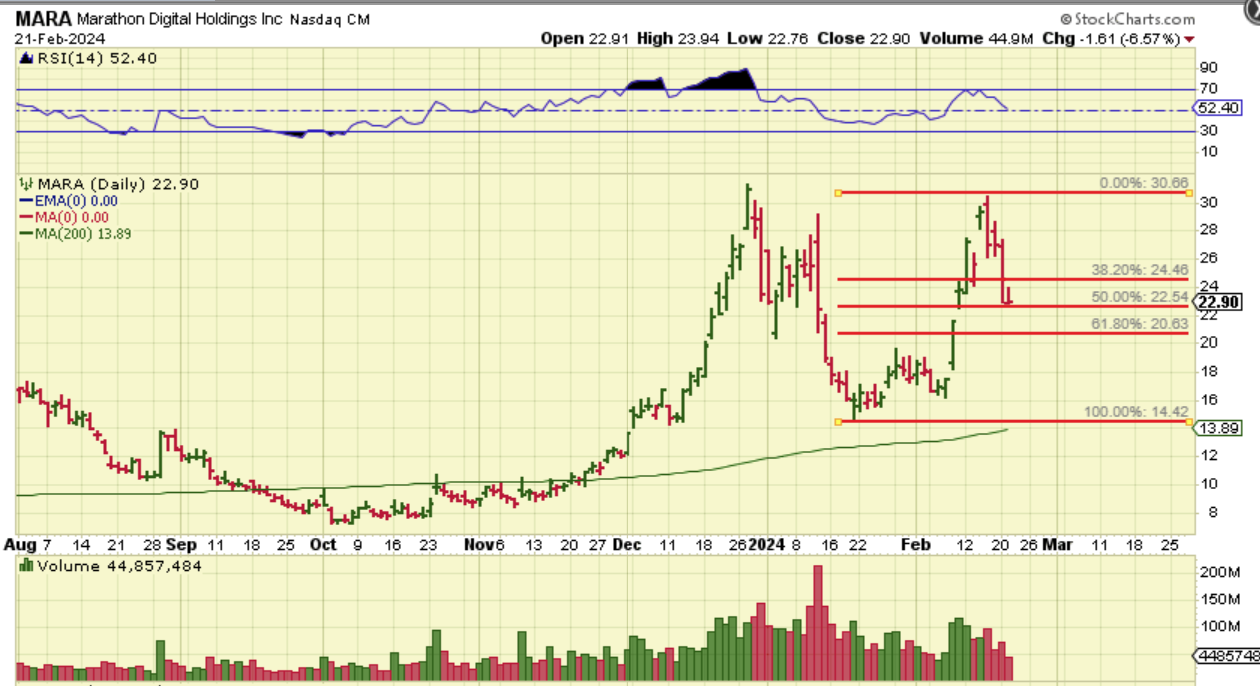
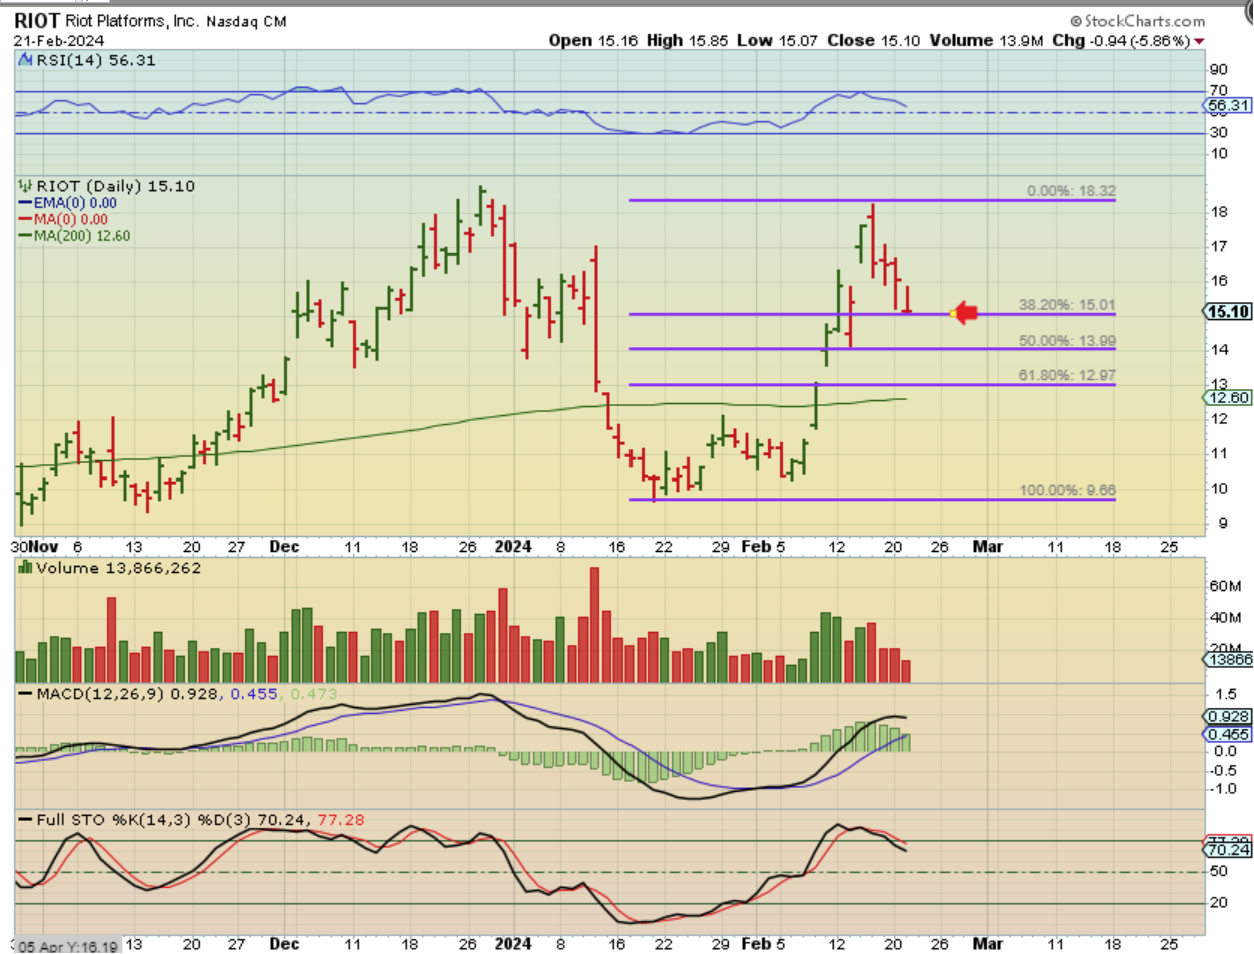
MARA – taking a look again at the ‘Miners’, many are still holding up around their 20 ema too. Also…
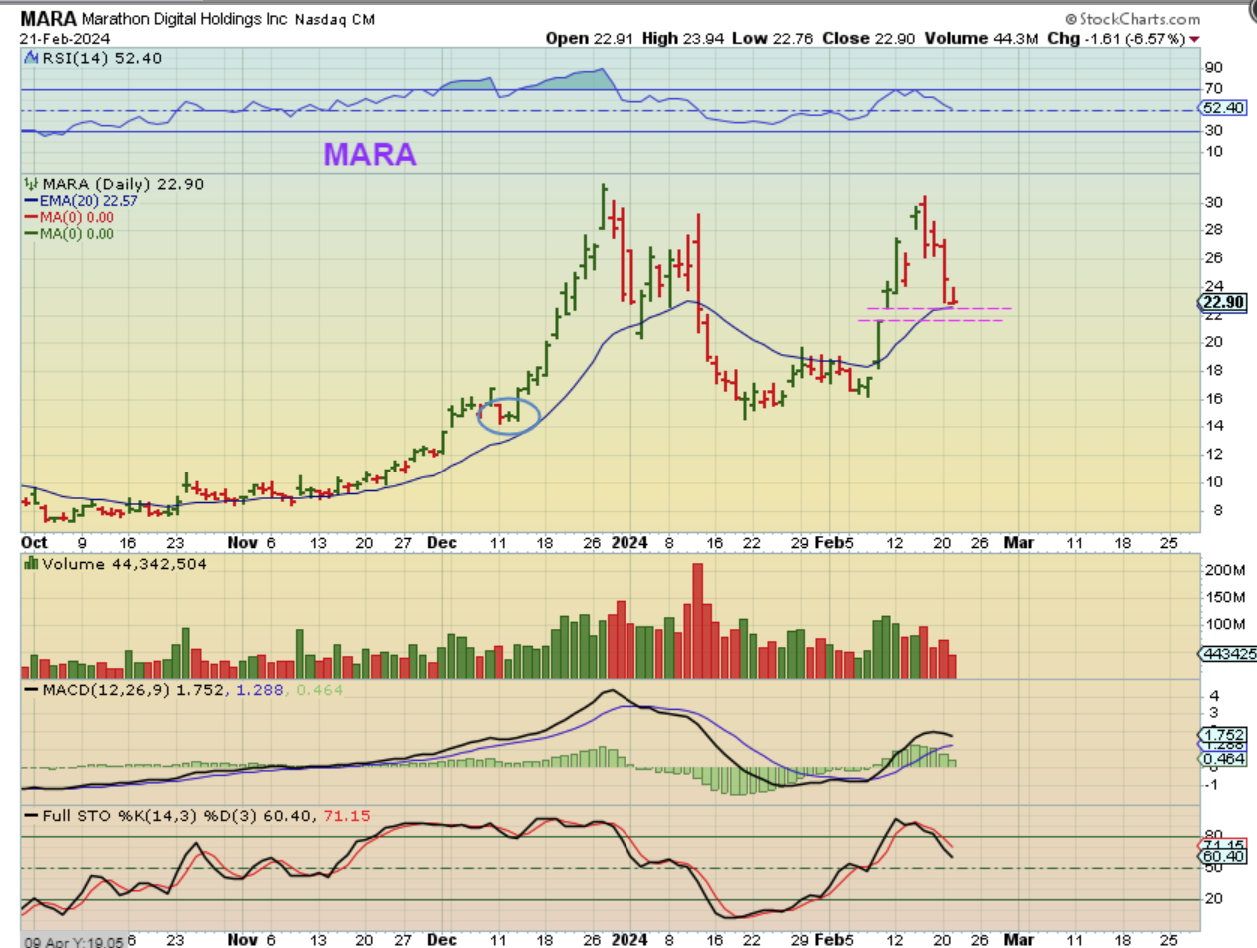
.
Also MARA and a few others have completed a 50% retrace of the last move up, and that is normal in a bull market, but it CAN drop to the 61.8% level and fill that gap too.