
Weekend Report
Due to a few interesting changes that I saw in the Precious Metals Sector, as well as developments that are unfolding in the Crypto area, I really wanted to spend more time on those sectors this weekend. I have been researching various things with Bitcoin for days, so I really spent a good amount of time doing that. I do usually try to get the report out by Sunday afternoon, but I had a busy weekend with personal commitments too, so that along with the extra time that I spent in those areas alone has caused this report to be a little later than usual. Thank you for your patience.
.
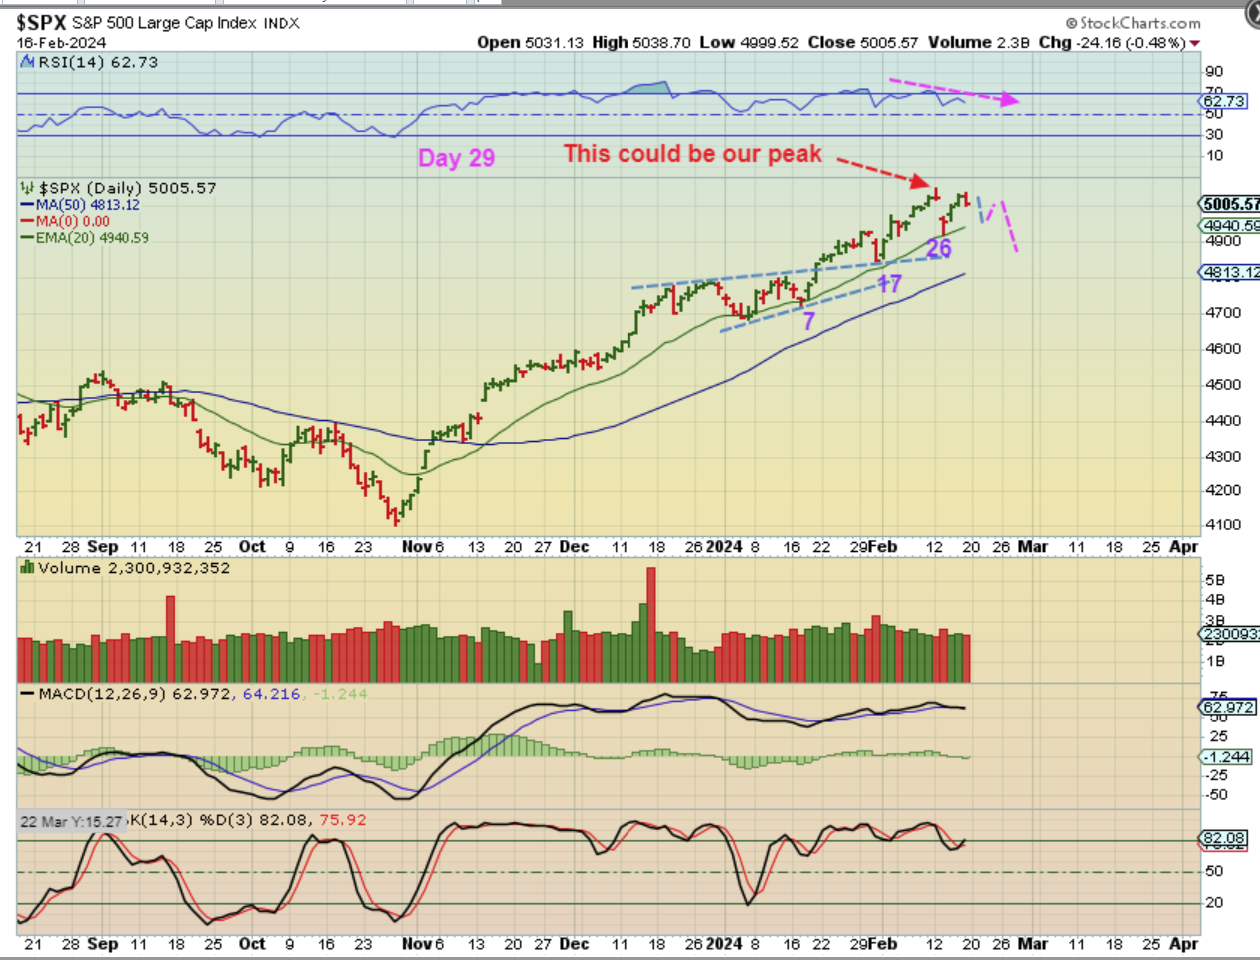
SPX DAILY #1 possibility – I can picture the markets starting to slow down, ever since we saw the CPI drop and then on Friday we also got a smaller PPI dip too. This may indicate that we put in a choppy top, especially with the Fed Minutes being released on Wednesday too. This would be roughly a 10 day chop to give us a 40 day dcl.
.
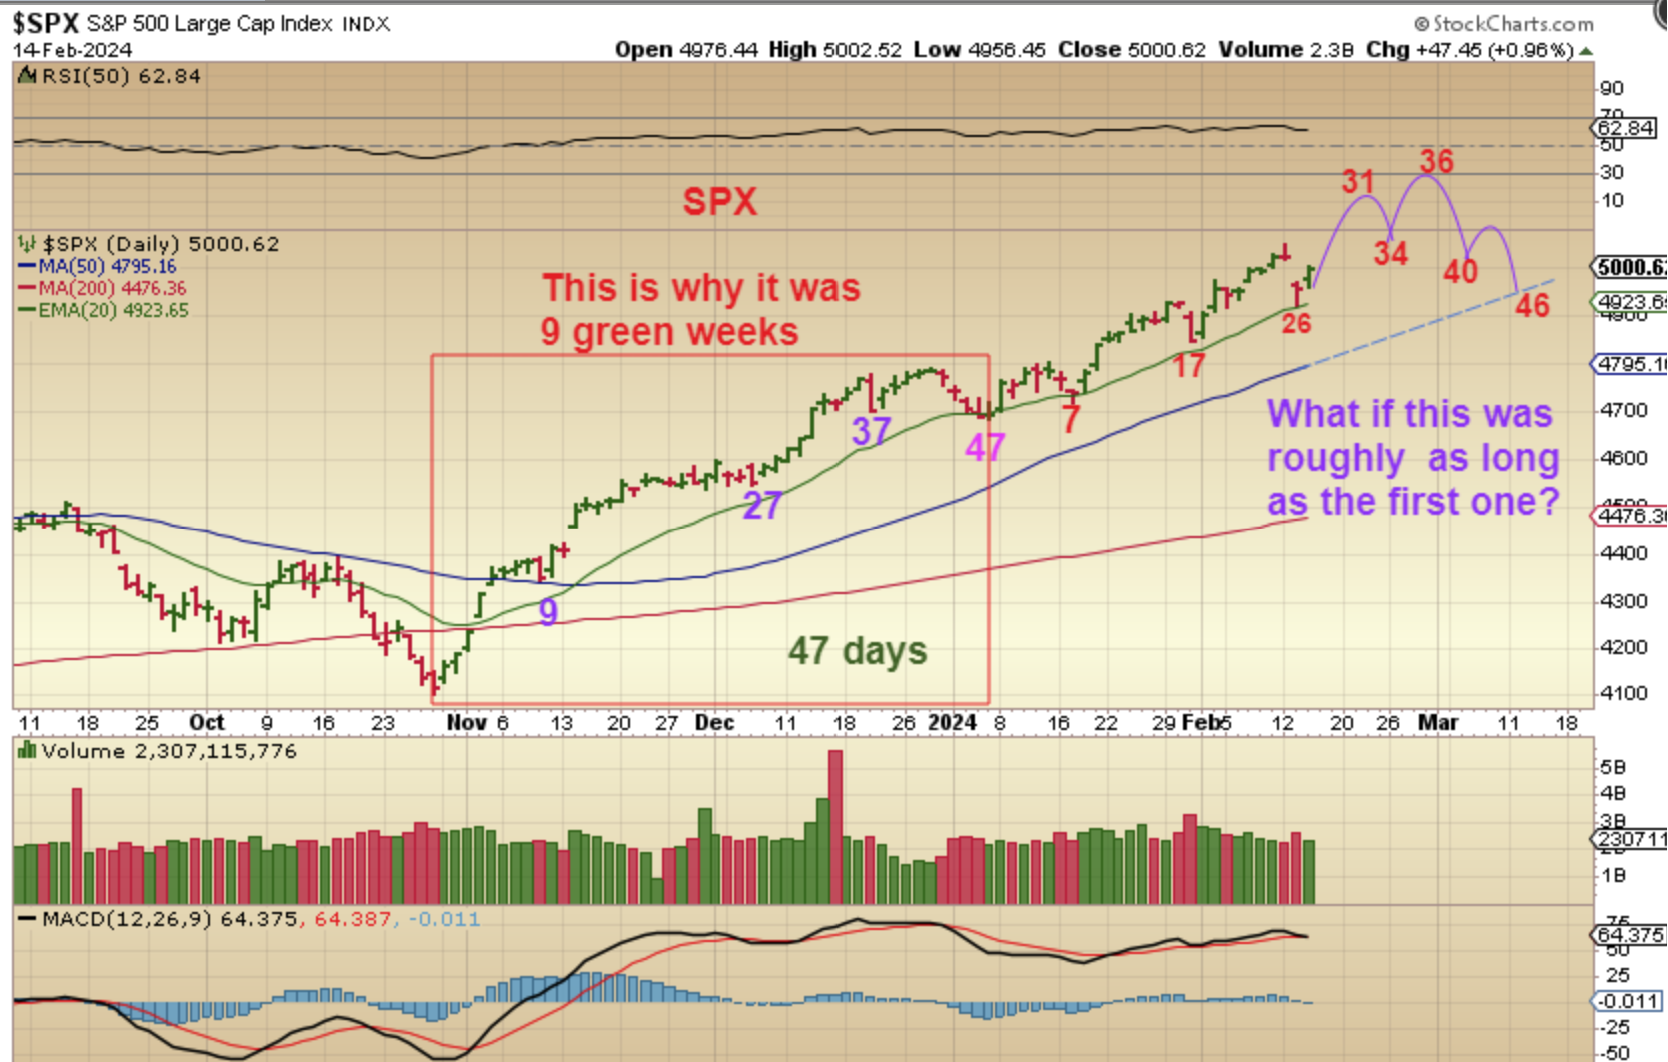
SPX POSSIBILITY #2: Thursday I mentioned that the last daily cycle was 47 days long, so since we are now only on day 29, we could actually get a little more upside. Again, the Fed Minutes on Wednesday may make it clear too. On Thursday I said:
.
Using THE SPX daily chart, we see that we had 47 days in the first daily cycle, that is why we had 9 green weeks. We are only on day 27 now, so we are on week 6. So it is possible that we dropped on CPI and rally to new highs into next week too.
Stay Frosty – Use stops at the 20 ema! 🙂
.
So basically what I am seeing is that the markets are getting a bit heavy on Inflationary Data releases. We will see the Fed Minutes this week. All of this could make it choppy and toppy until we get the next dcl.
.
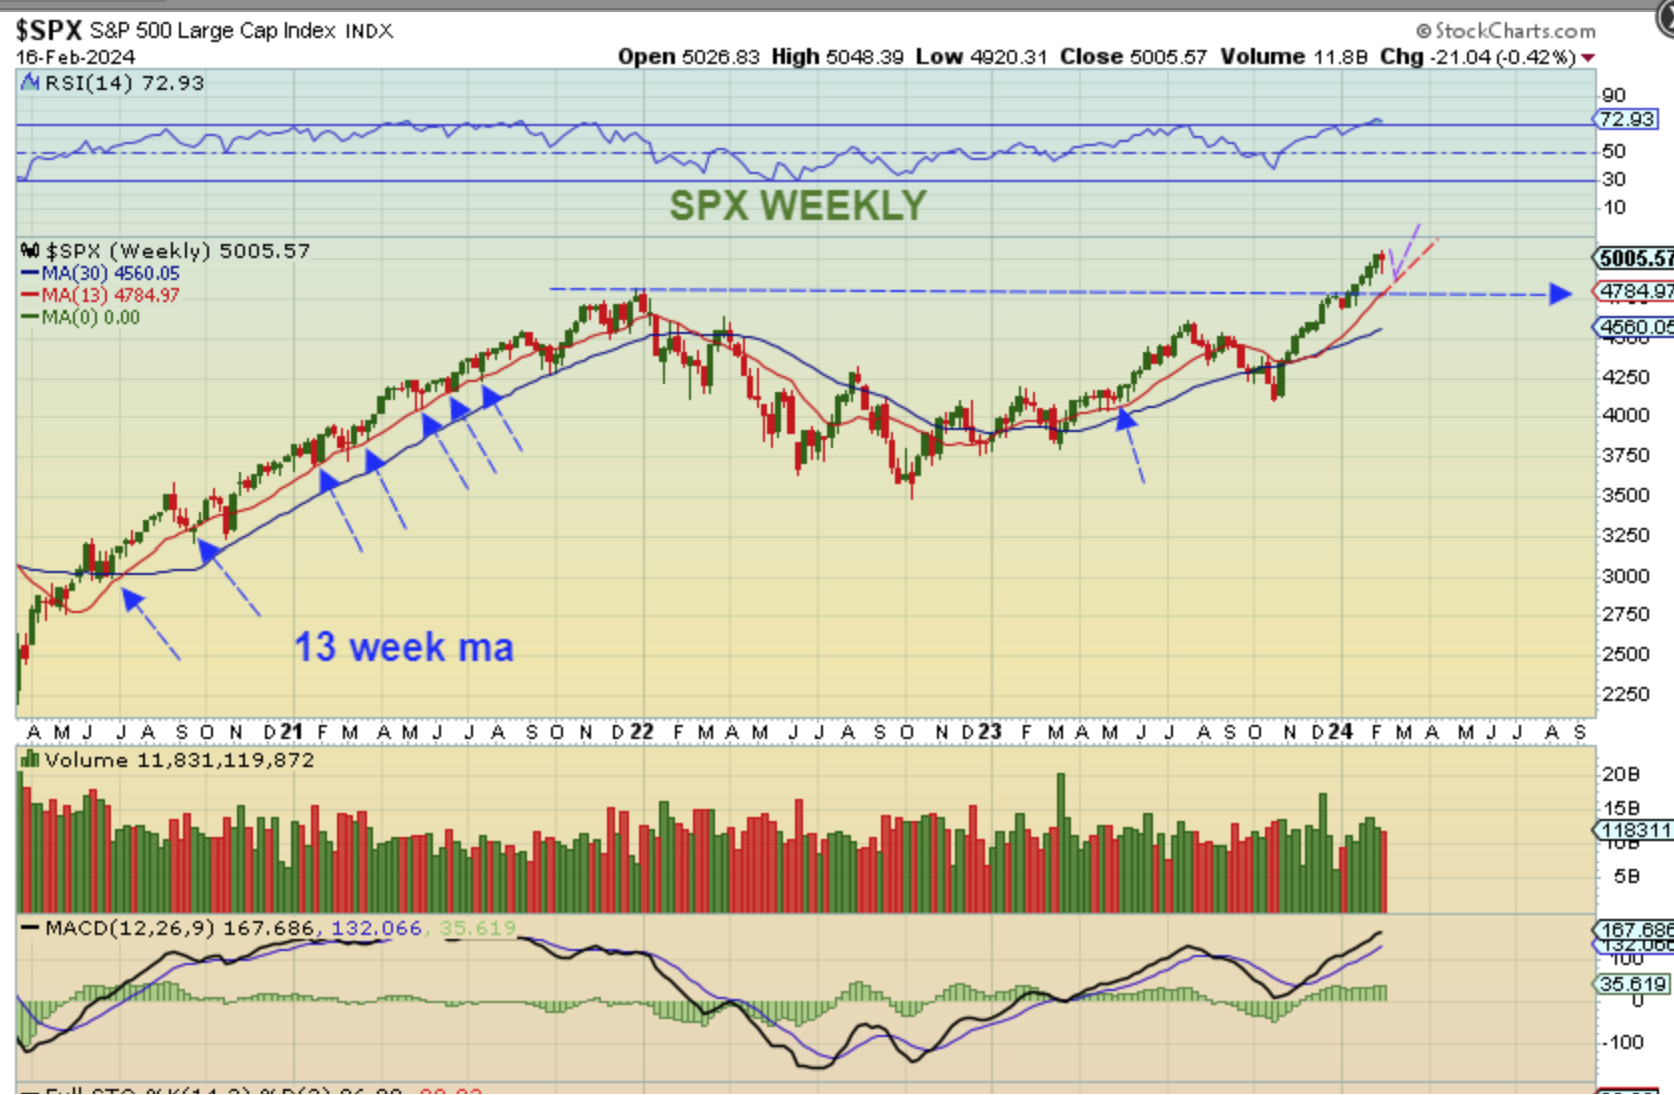
SPX WEEKLY – The next DCL that will be due in a week or 2 and then we enter the 3rd daily cycle. Price dropped to the red line repeatedly in the Bull Run of 2020-2021 ( see Blue arrows). The next dip will be a buy, even though a 3rd daily cycle MIGHT peak a bit earlier than the last two. Note: The next ICL is a strong buy, that may come in April or early May as a back test of this break out.
.
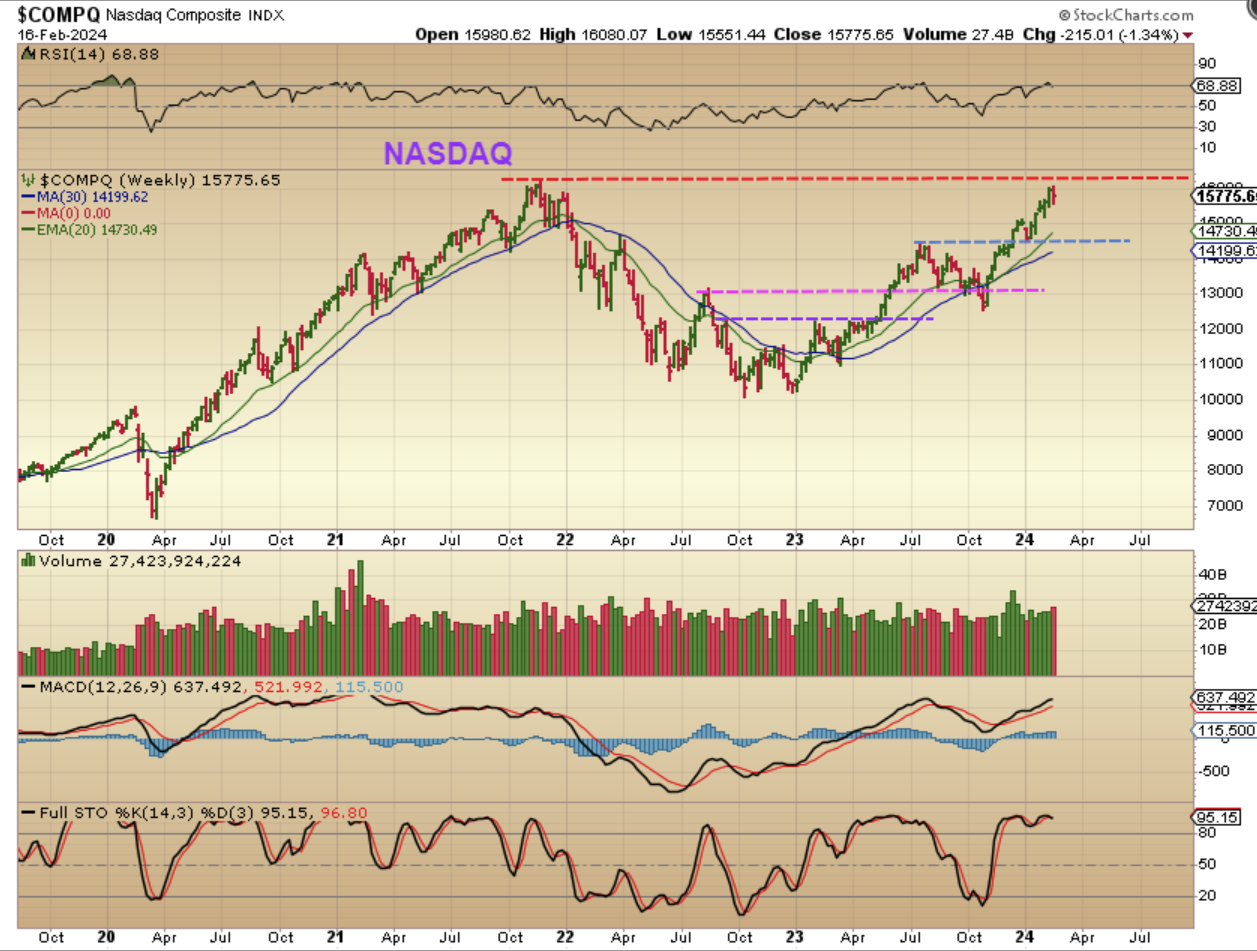
NASDAQ WEEKLY – Weeks ago I was saying that The NASDAQ was lagging. The SOXX already broke above the all-time highs, and then The SPX had reached prior highs too, so I expected that we might see the Nasdaq catch up. It has finally caught up, and is ALMOST breaking to new all-time highs. Maybe we’ll see that before we dip into the next dcl.
.
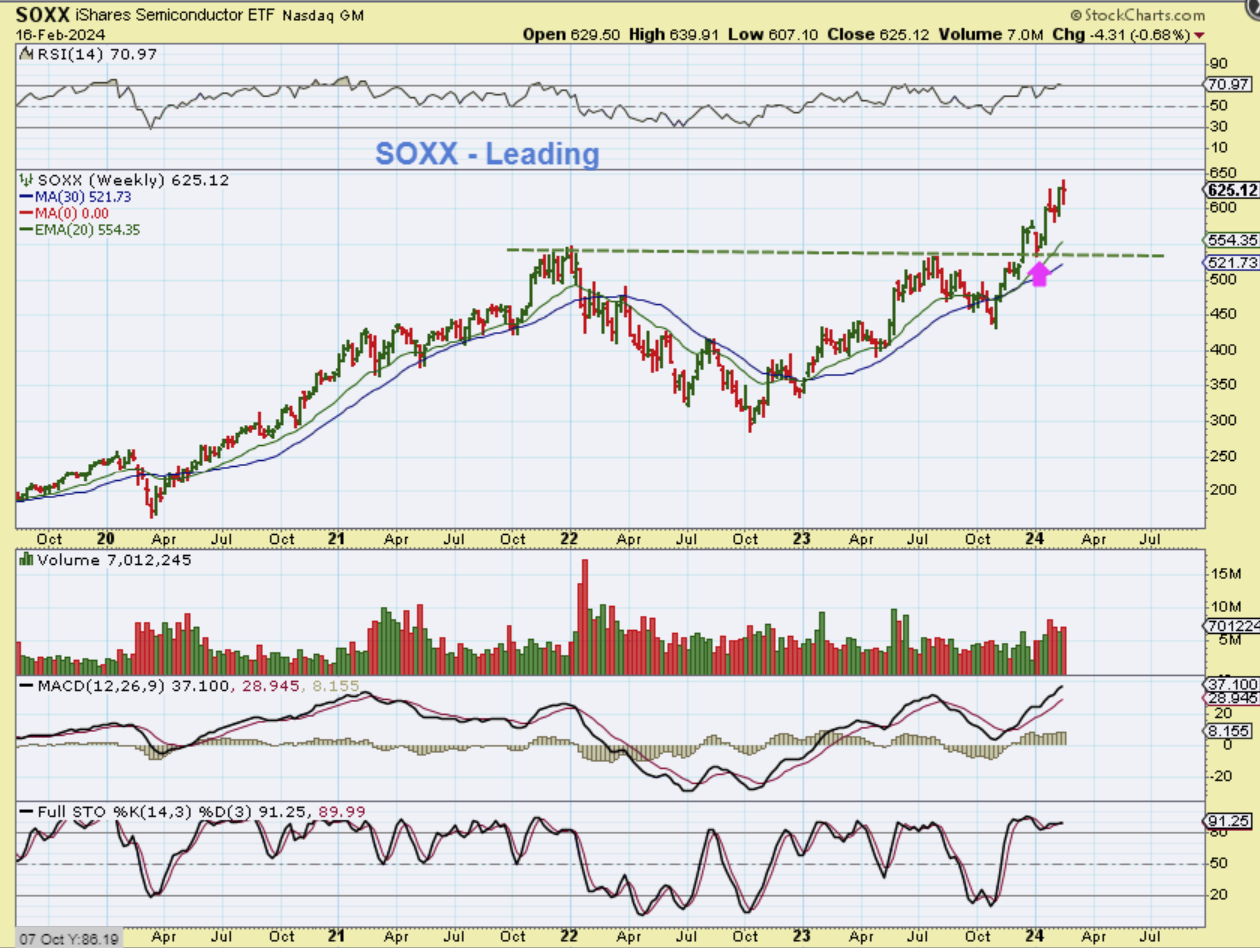
SOXX WEEKLY – The SOXX has definitely been leading the way. That ugly sell off in 2022 actually became a beautiful Cup & Handle.
.
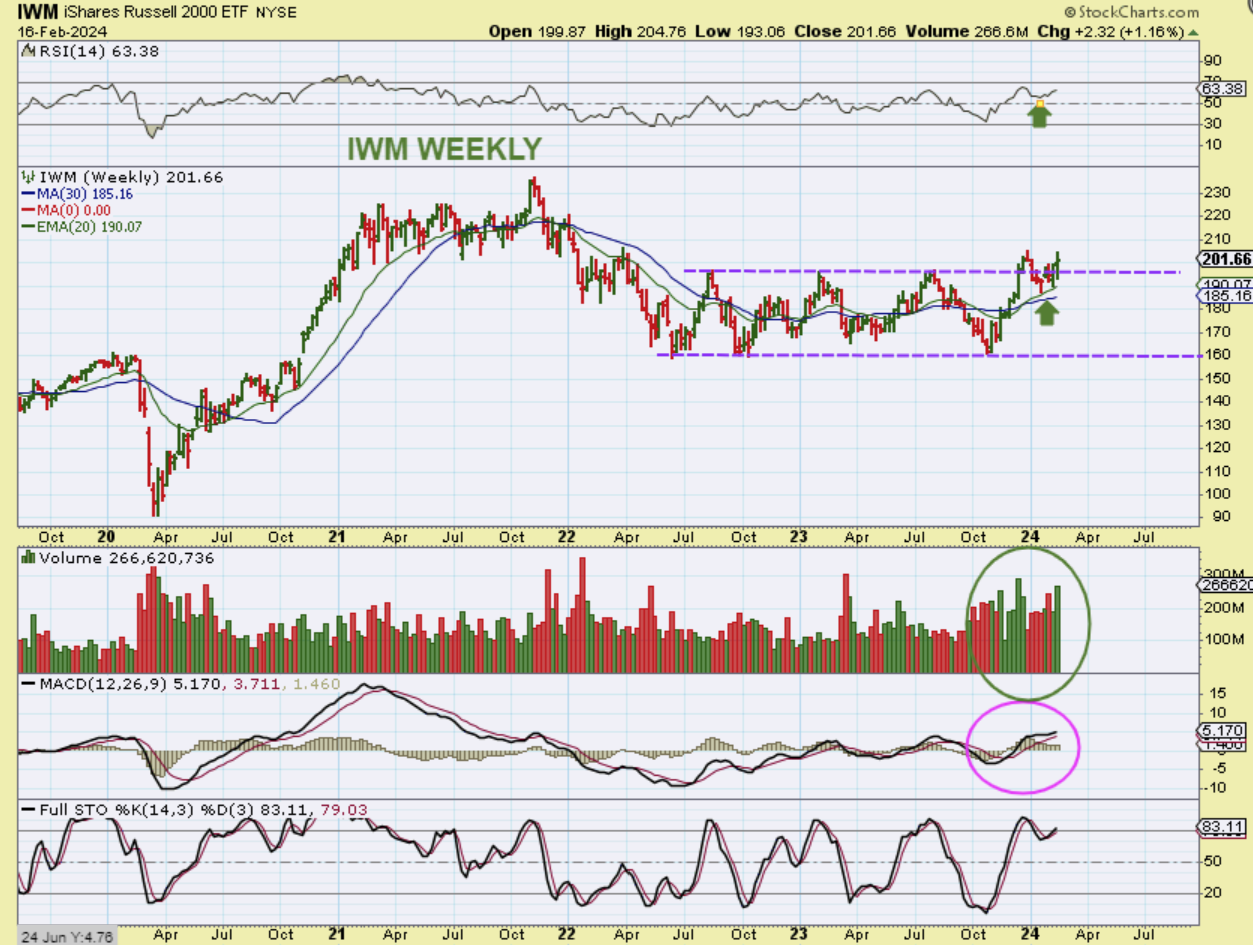
IWM WEEKLY – This has been the real choppy Lagger.
It does look to be starting to break out, Volume is now popping on this break out, and many of the stocks that have been choppy, bottoming, and lagging seem to be perking up too. Clean Energy, EV, MJ, Solars, etc look to be ‘bottoming’, forming bases, and some started to break higher too, so this may be the time for me to keep an eye on those too. We have had a few false starts, but now this channel is being broken.
.
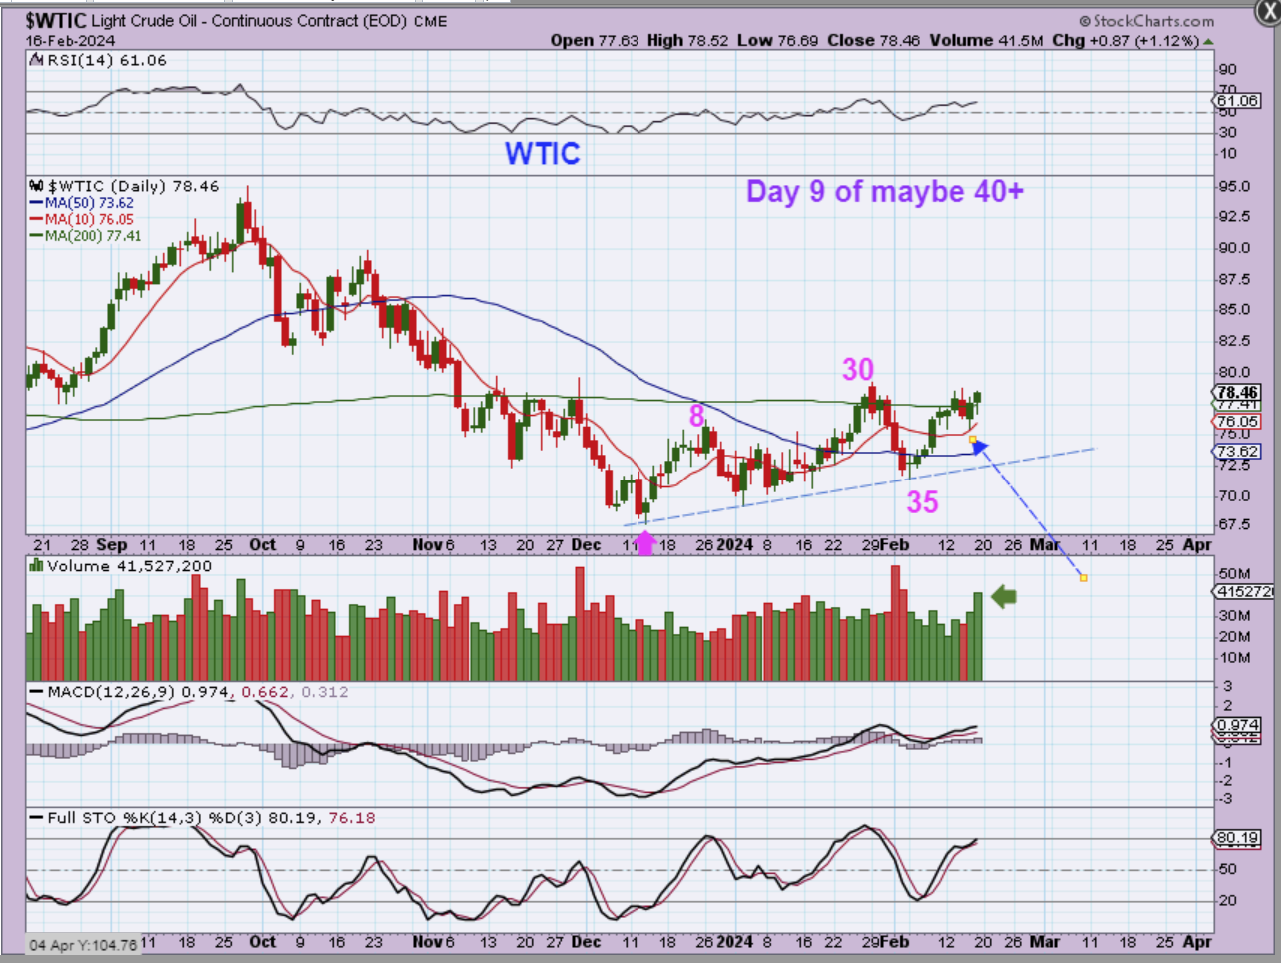
WTIC DAILY – This does now look to be a day 35 dcl and it is trying to break above that 200sma. It found support on the 10 sma, reversed, and Volume is coming in nicely now.
.
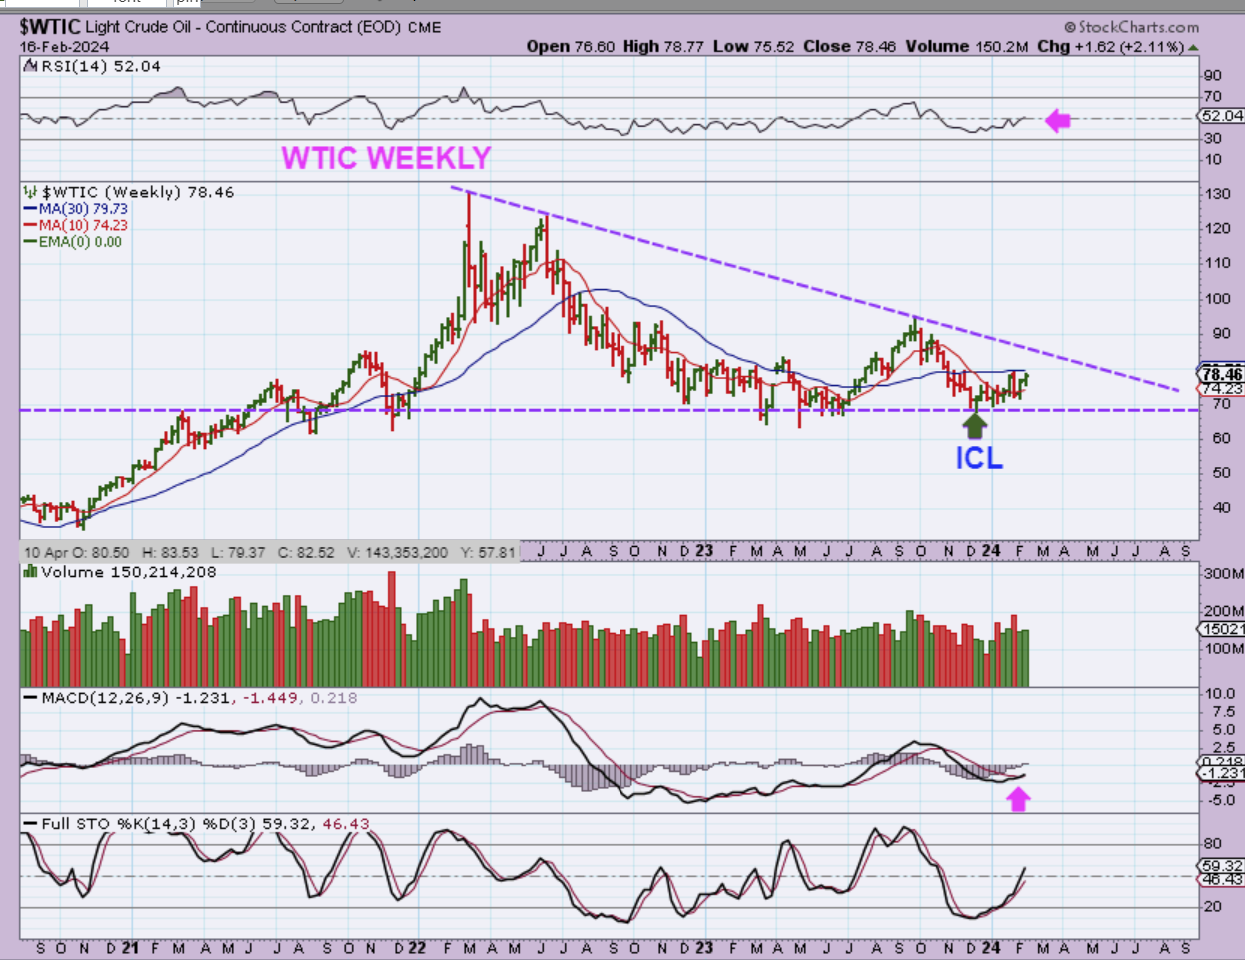
WTIC WEEKLY – For over a year, most of the time Oil has been between $70-$80, with the exception of the August to October time frame. On a weekly the blue 30 week ma line has affected price, and we are almost there now. The daily looks quite bullish so a run to the top of this wedge is not out of the question, for starters.
.
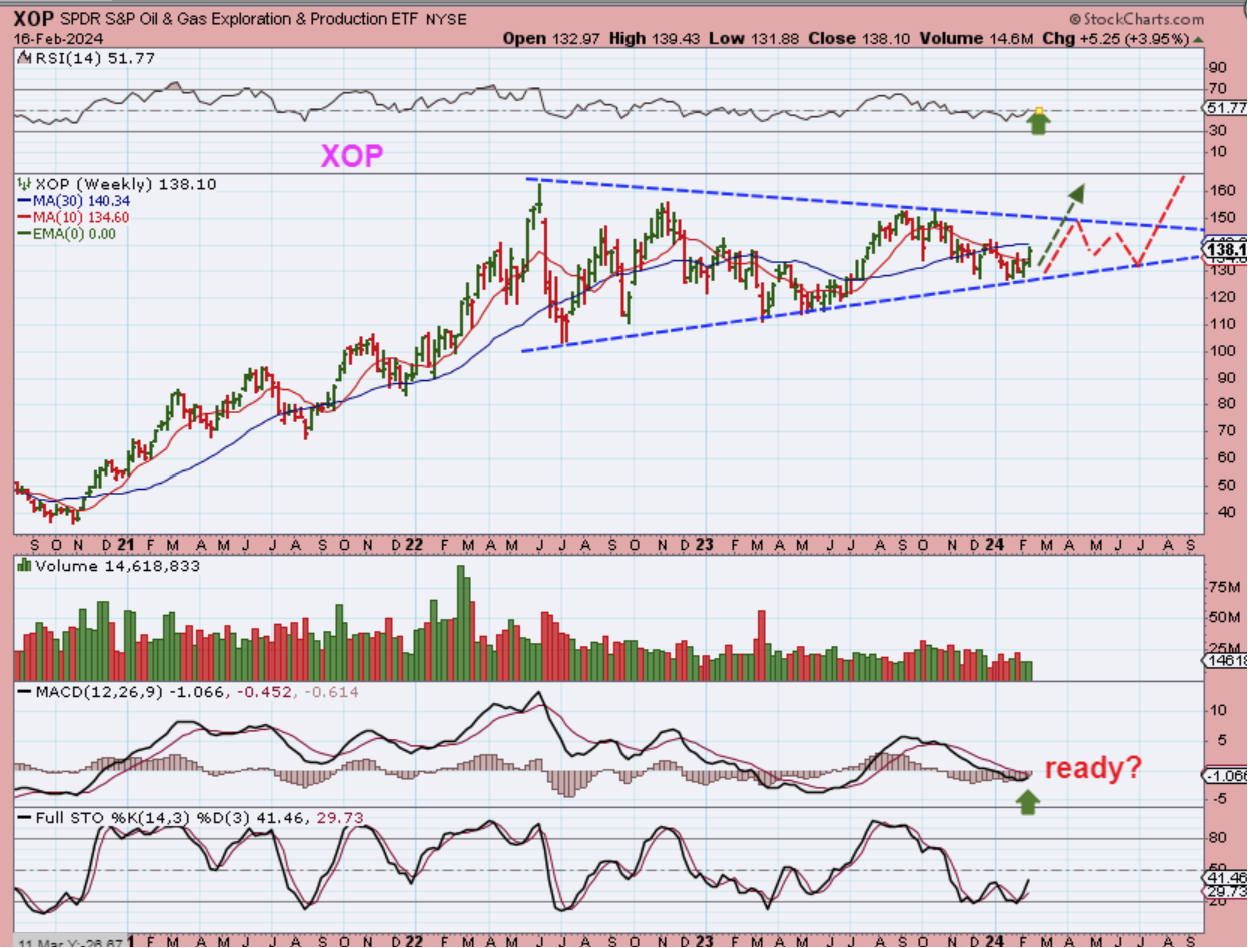
XOP WEEKLY – Oil stocks ETF really is set up nicely, and they are also just coming out of the lows, so despite their being choppy lately, they are considered a buy (or trade). 2 possible paths are seen here where one is ready to break out and run, the other needs a little more time.
.
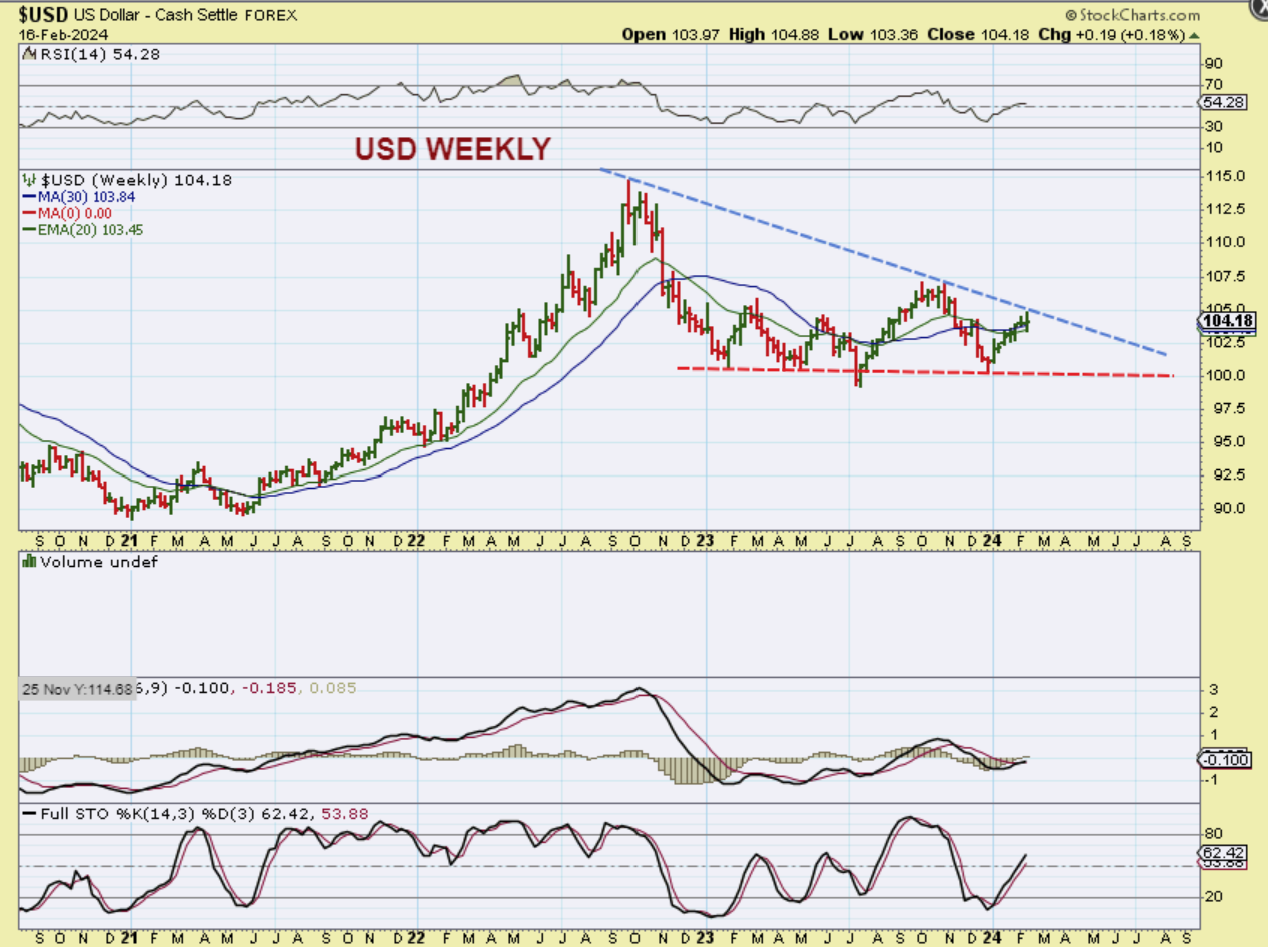
USD WEEKLY – Is the USD going to peak here on Fed Minutes (Or could it break out)? It really looks like a bullish set up to be honest, but if it peaks here and starts to roll over, that could mean that GOLD, SILVER, and Miners will put in an early ICL. I think that Gold has been very noticeably strong despite being in a 4th daily cycle, and Silver surprised me last week, so let’s take a look…
.
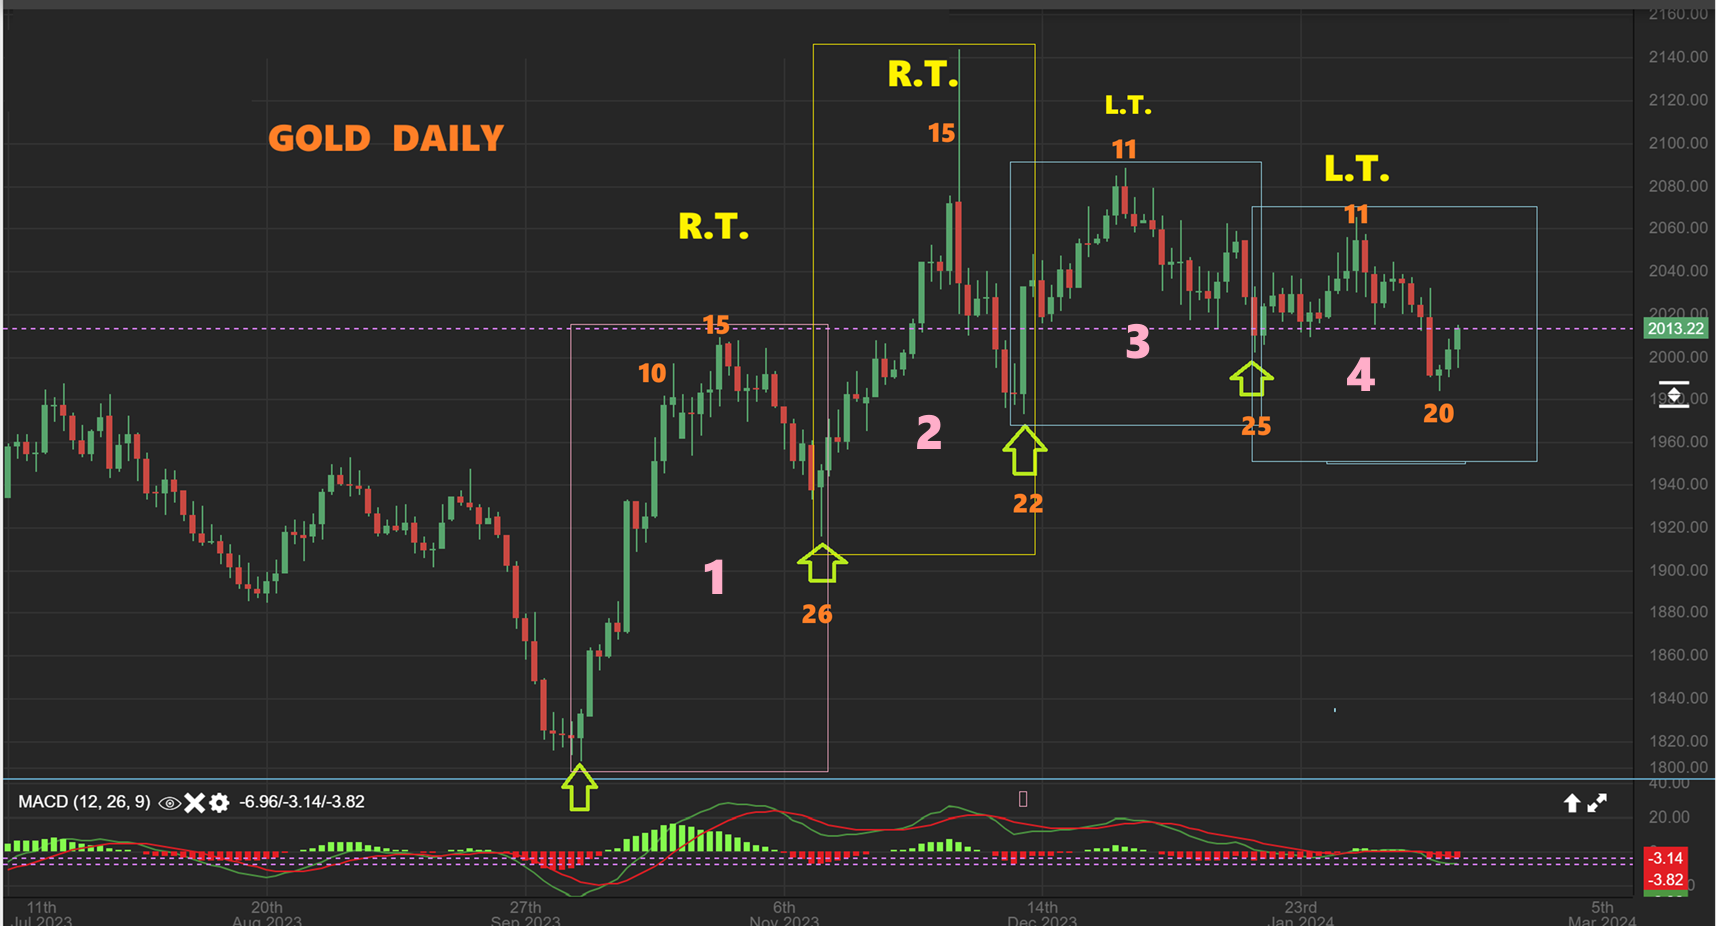
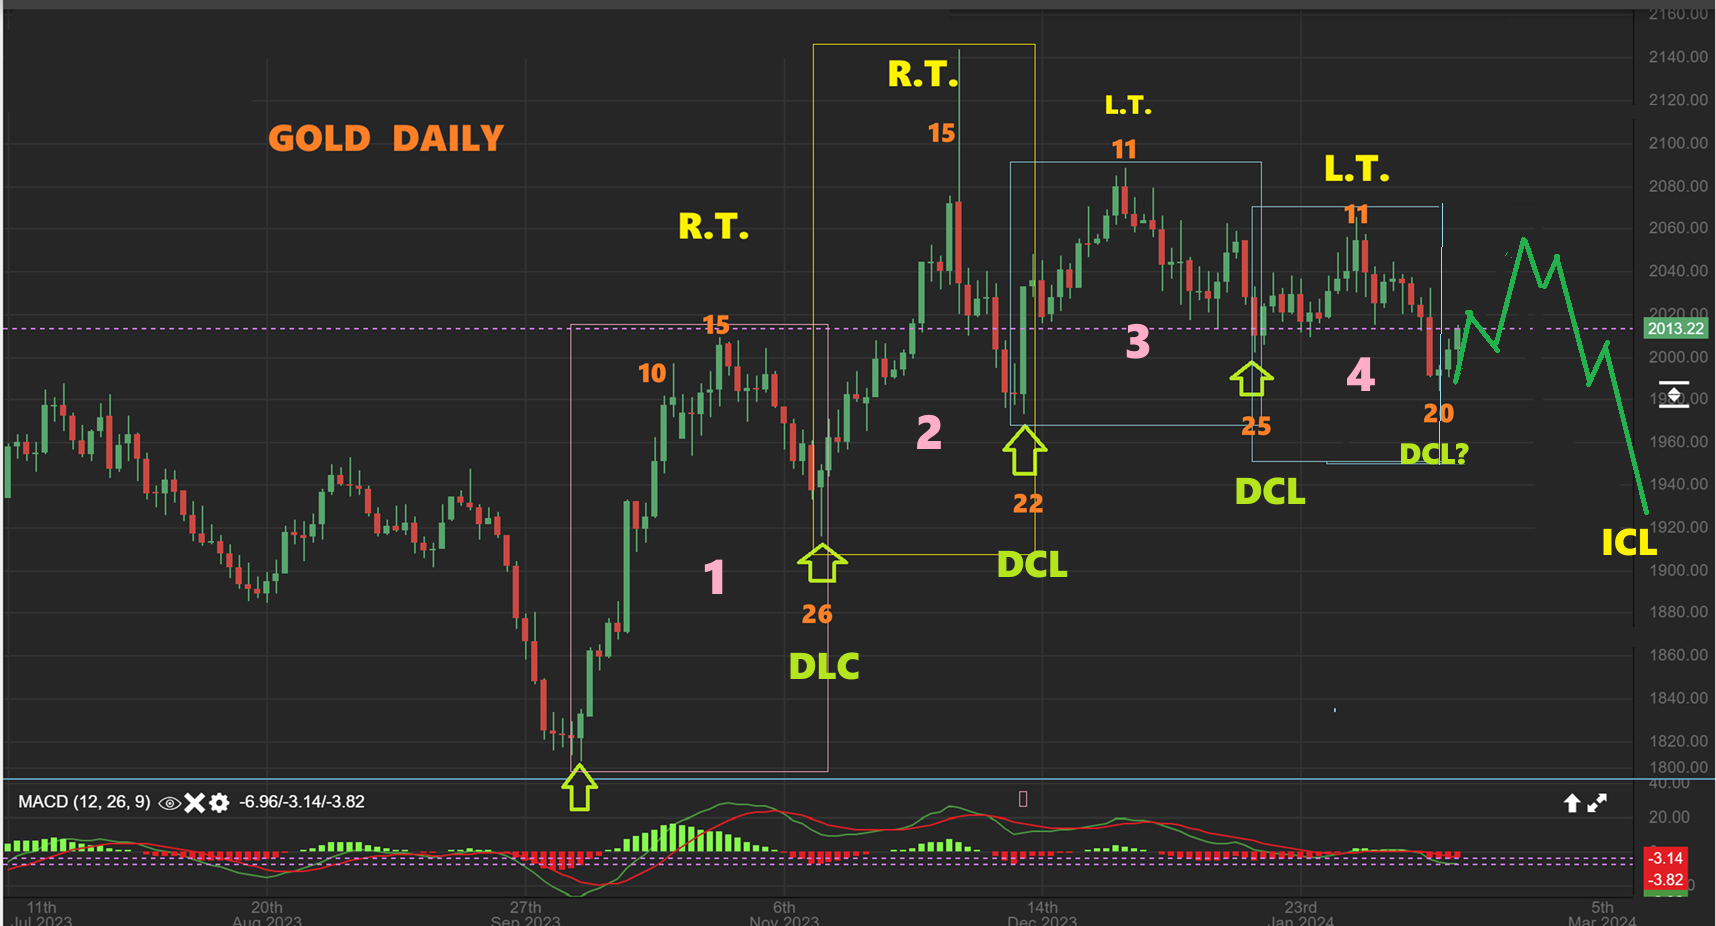
GOLD DAILY – These daily cycle lengths have been shorter lately, and price has been holding up well. It seems to be accumulation, because in a bear market sell down, the 3rd & 4th daily cycle lows would be much lower and the daily cycles also tend to drop for over 32 days. This is a bullish change that we have been seeing. So…
.
GOLD DAILY :
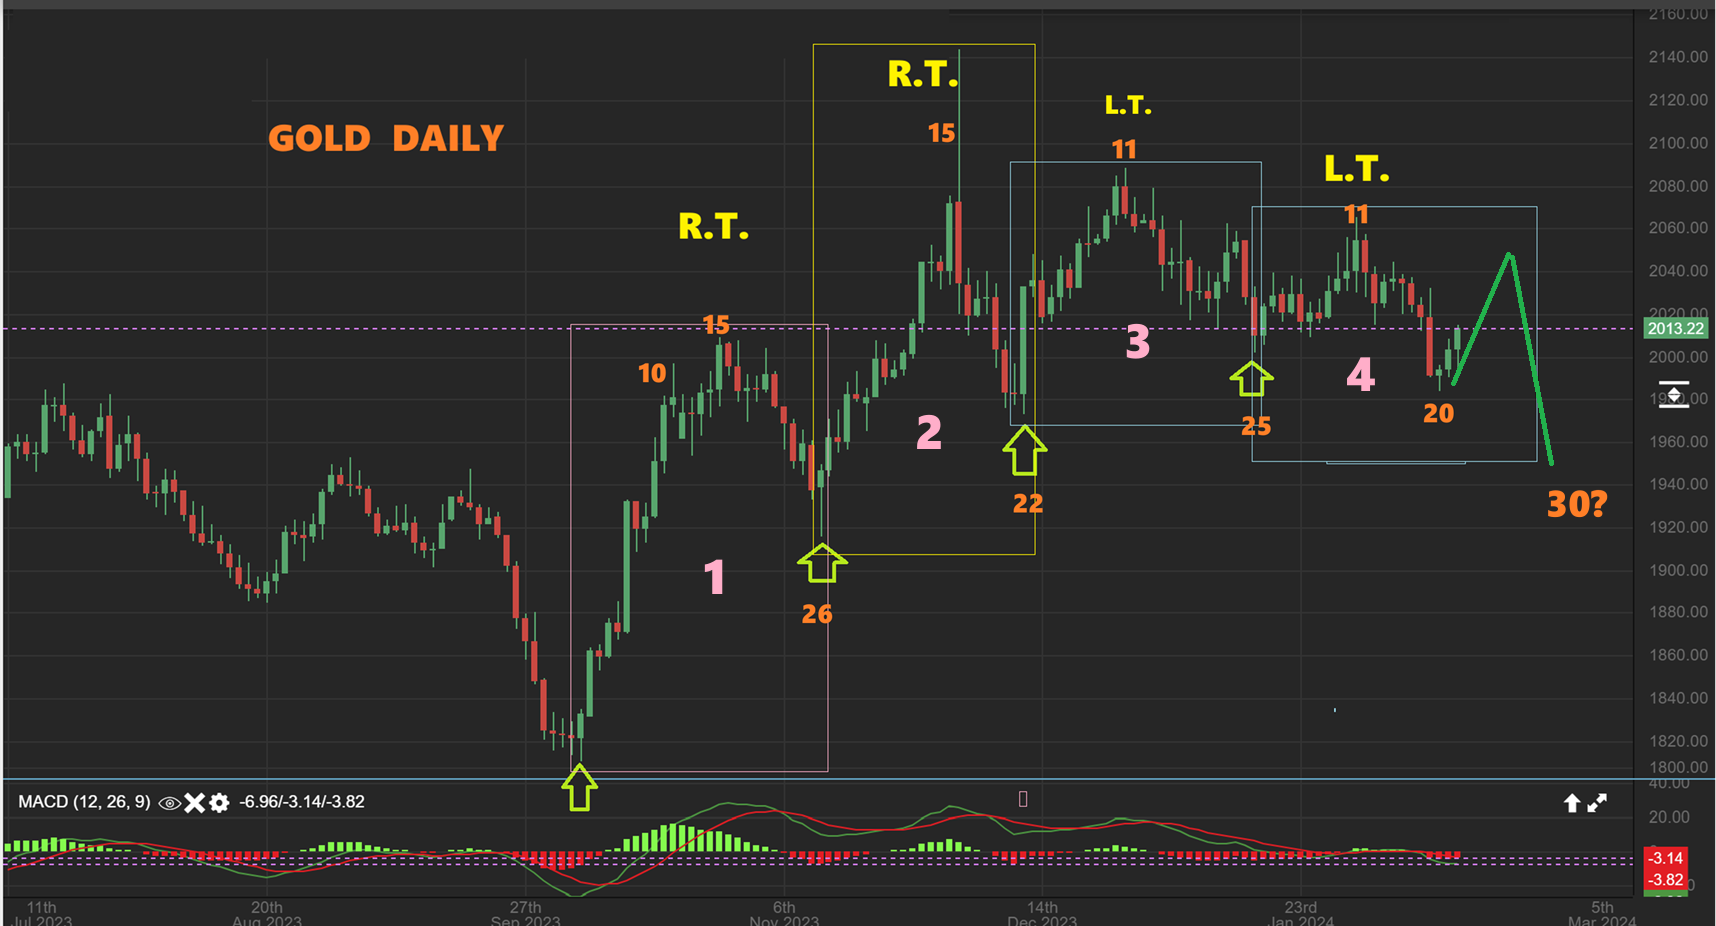
We saw 26 days, 22 days, 25 days, and now 20?? Or will it follow this path and drop to day 28-30? It is hard to say. And will there then be a 5th daily cycle? Probably not if the USD Tops, so Gold may already be close to bottoming out here. .
.
GOLD DAILY – I will still draw for you a dcl at day 20, and then 1 more 5th daily cycle into an ICL. It could look somewhat like this. The next chart is really interesting though…
.
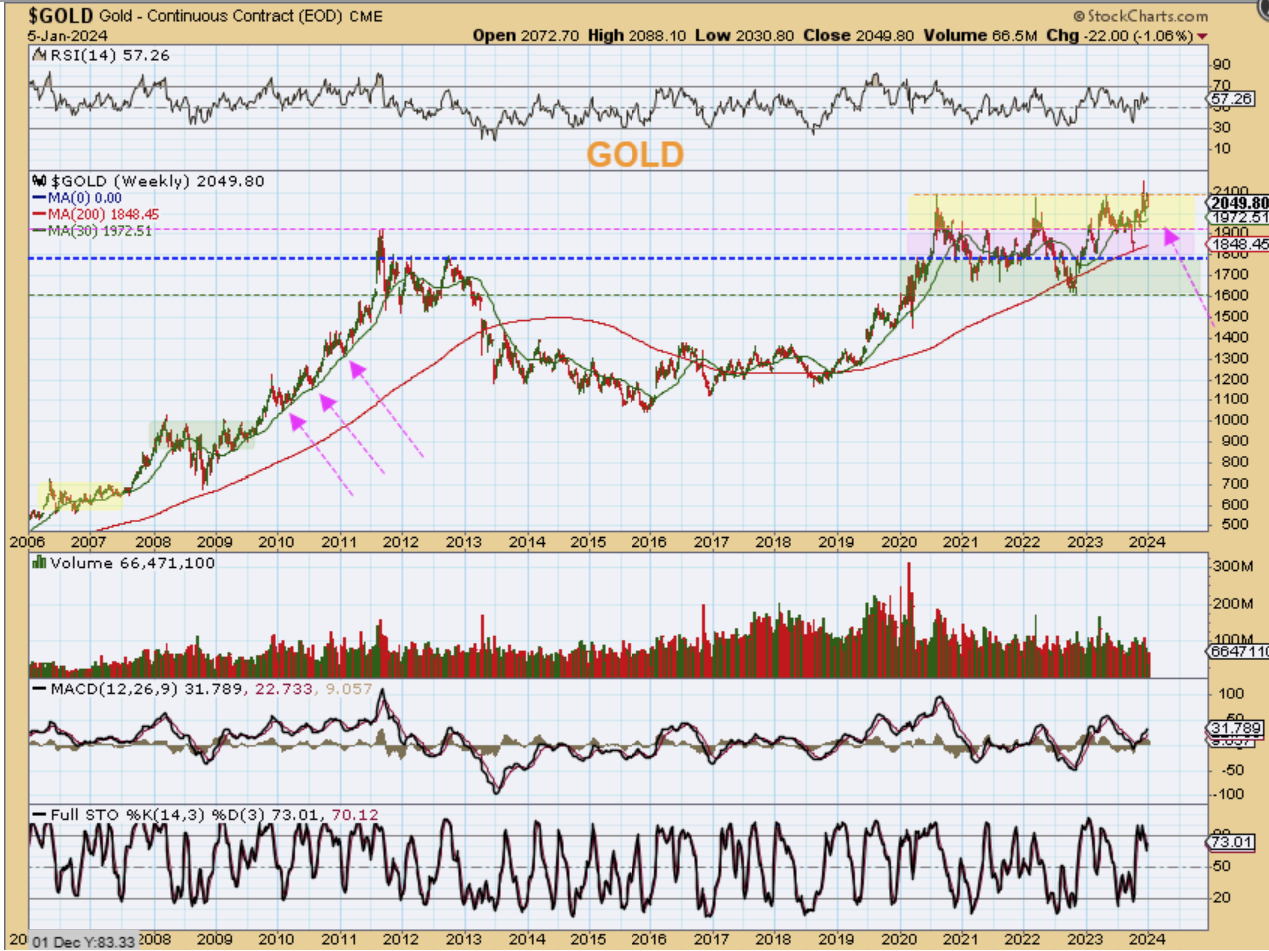
GOLD WEEKLY FROM JANUARY 5 –
I had been pointing out that green 30 week MA as support in the bull market run higher for Gold 2010 & 2011 and also 2019-2020. For us to drop into an ICL and still just ‘tag’ that moving average, I said that Gold would have needed to basically go sideways. Price would now have to go sideways to be able to hold up above that 30 week MA in that Yellow Box around $1972. NOTICE: Price was $2049 here in early Jan 5th. Could price hold up?
.
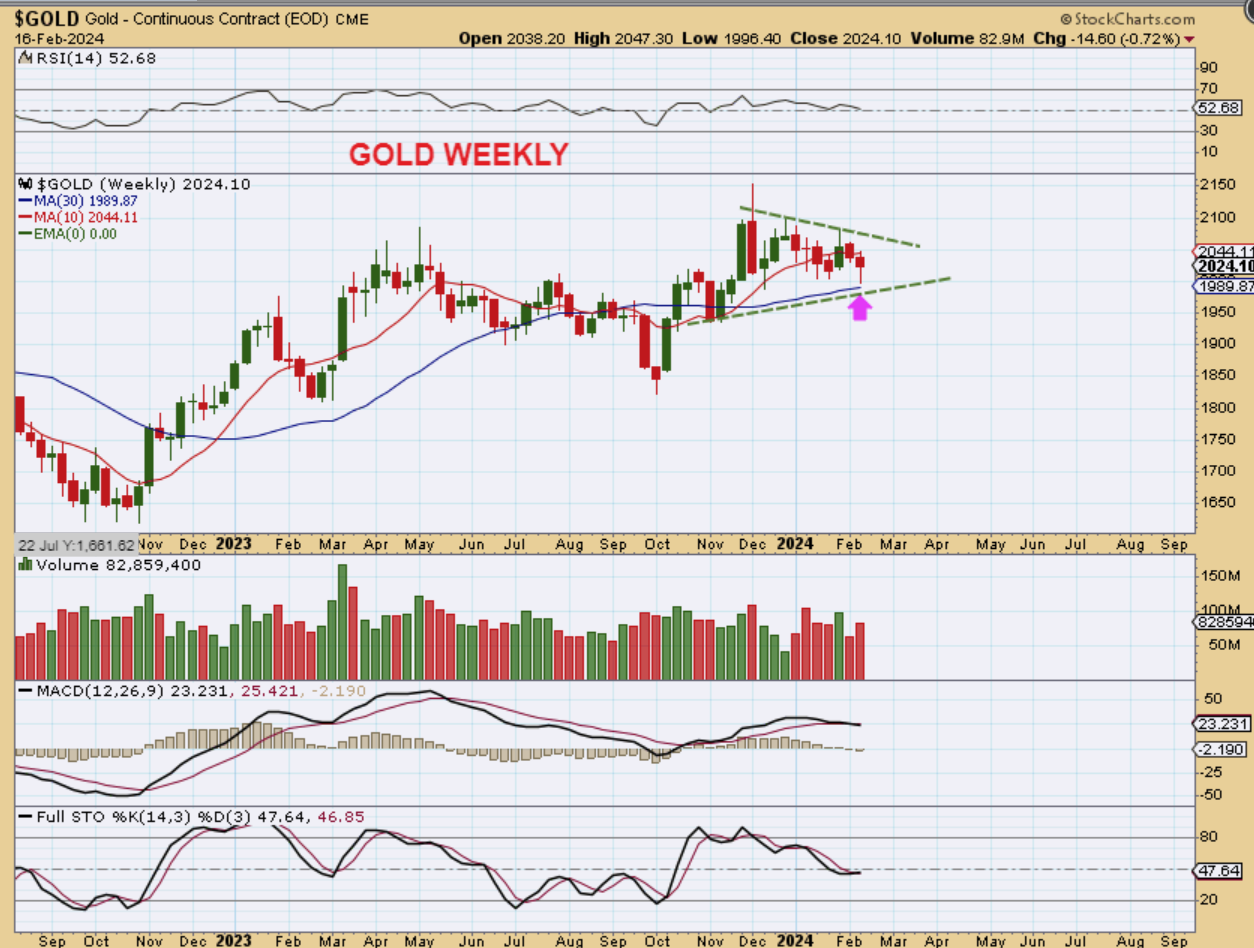
GOLD WEEKLY – Gold has held up remarkably and is still closing above $2000! Gold is now only $20 lower than Jan 5th, and this is 6 weeks later? Think about that for a minute. Gold dropped $20 over the last 6 weeks and practically no one has noticed that. So yes, it has chopped sideways to the 30 week ma. It could form an ICL here, or chop sideways some more and form an ICL in the next 5th daily cycle.
.
Now let me show you something really interesting with Silver:
.
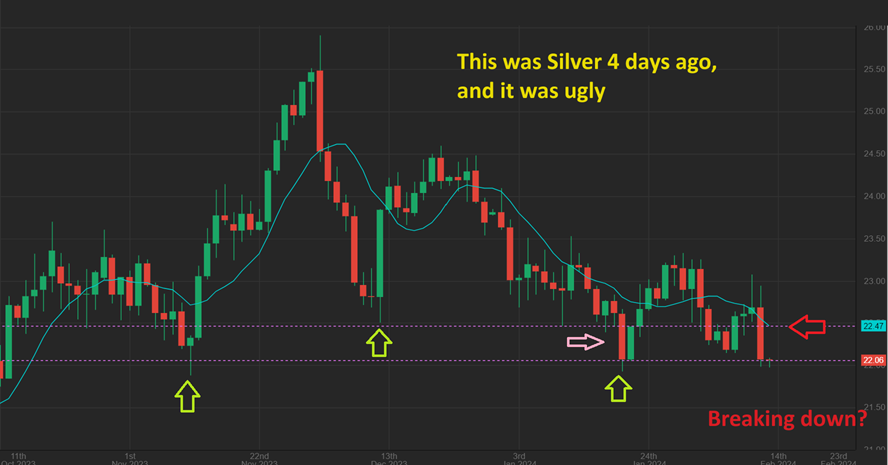
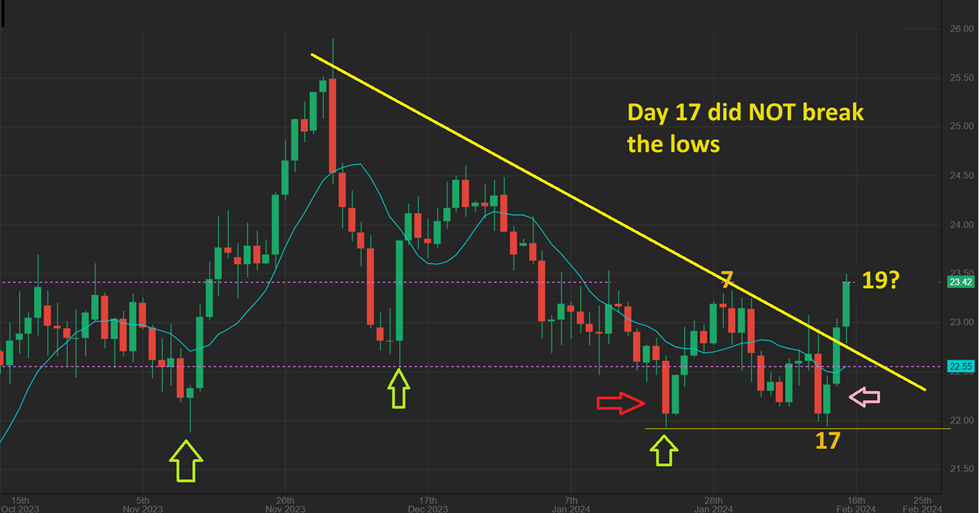
SILVER DAILY – Can you see the tiny, tiny candle on Silver here on Wednesday morning? My arrow points to Tuesdays drop. That was a slam down this Tuesday with the CPI Numbers and this looked ready to break down to new lows, with rumors of the Fed no longer cutting Rates in March or April. Silver looked weak and looked like it was about to get ugly…
.
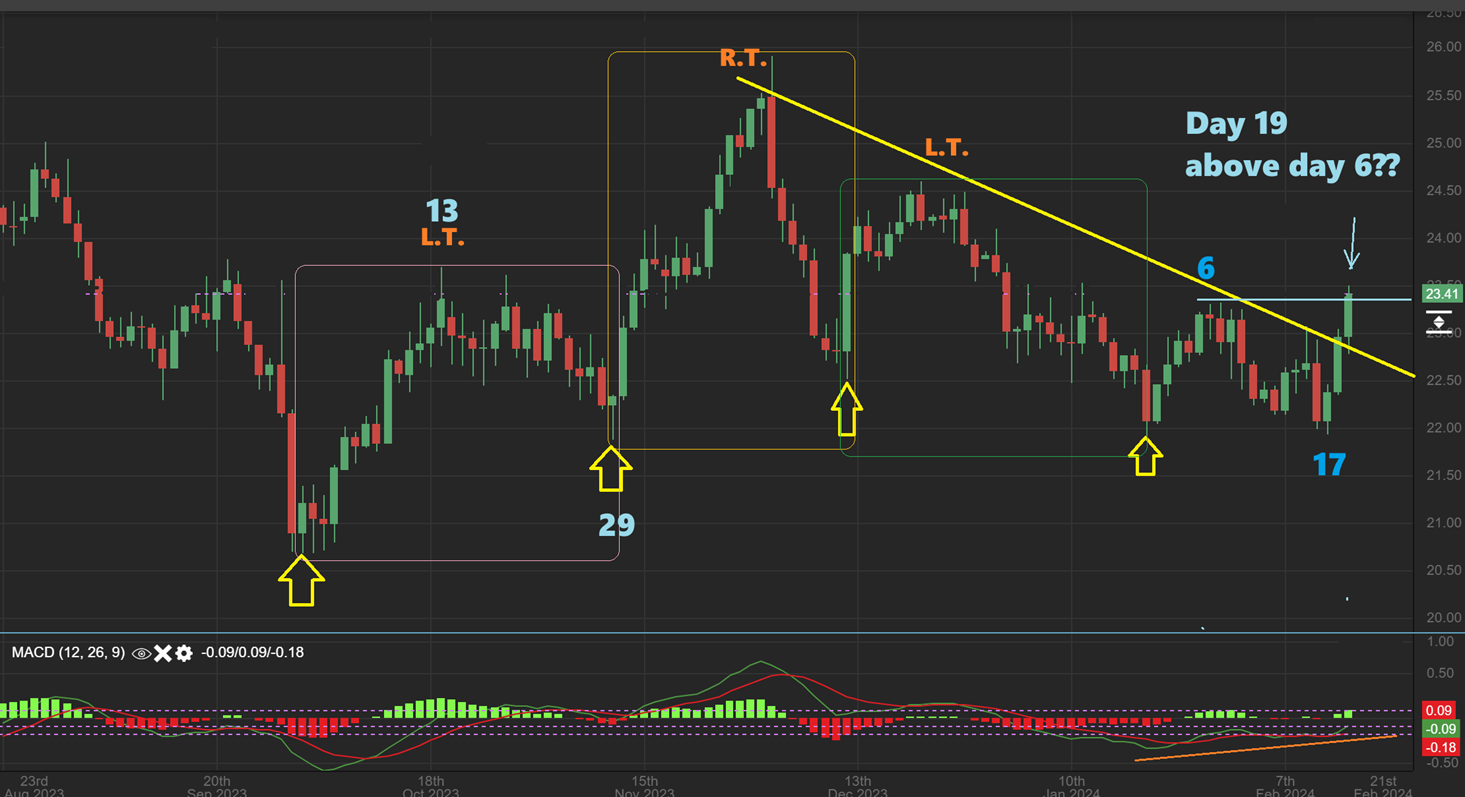
SILVER DAILY Wednesday – Friday – On Wednesday, price suddenly climbed higher. On Thursday it rallied through the trend line and I mentioned how that suddenly looks bullish. Well on Friday, Silver continued higher and is really starting to show bullish signs. In the past, Silver has actually bottomed before Gold at times, and this feels like Silver is bottoming. Let me show you why…
.
SILVER DAILY –
1. Day 17 did NOT break below the dcl, so it has a slightly higher low.
2. That breakout at the down trend is bullish, and now we saw a move to a new high above the day 6 candle. That is day 19.
3. That is not only a new higher high, but it is also a new high on day 19, making this a candidate for a Right Translated daily Cycle. This looks like a possible ICL to me, and…
.
This looks like an ICL may have formed and…
.
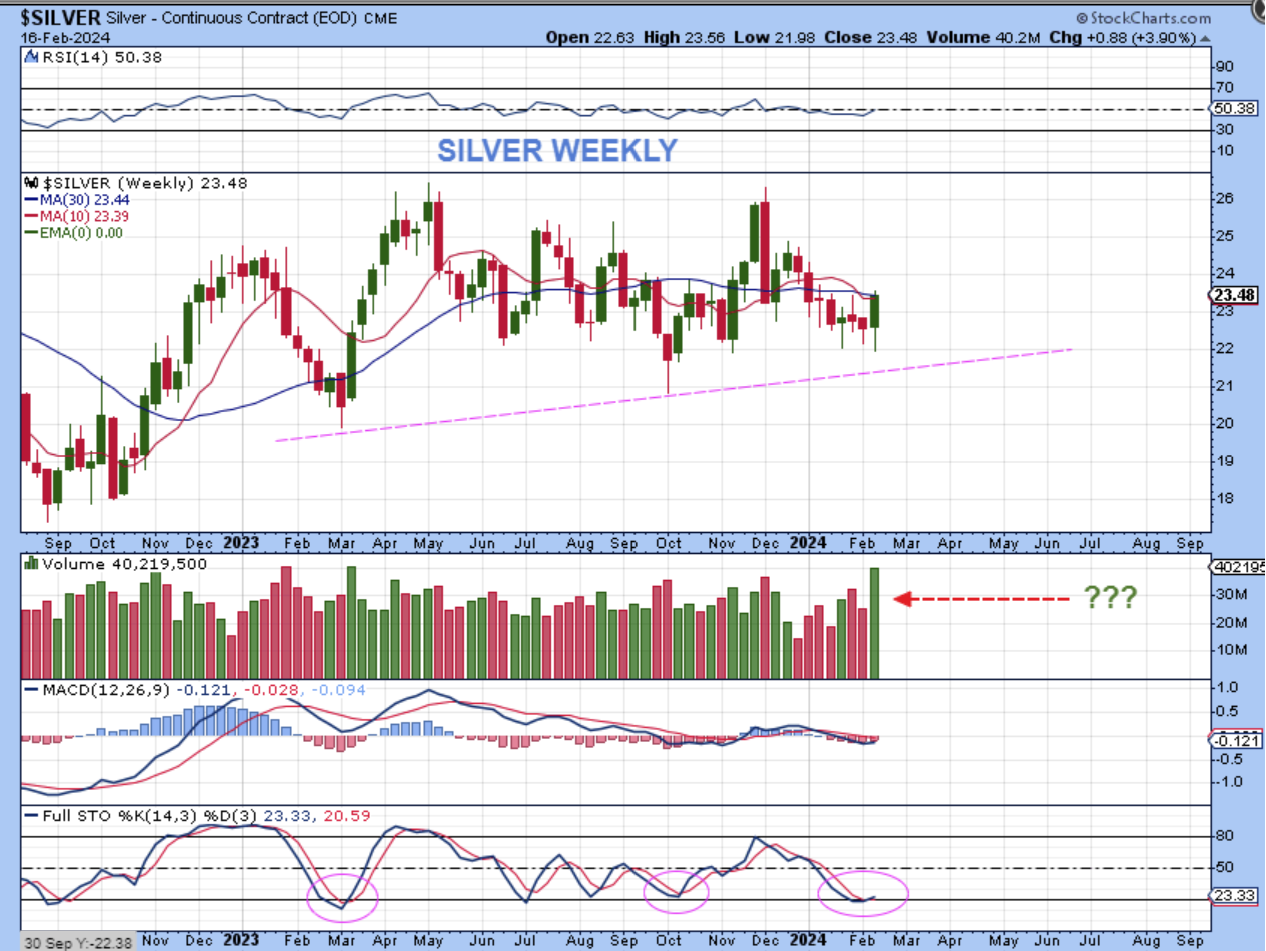
SILVER WEEKLY – Check out the volume for the week….
.
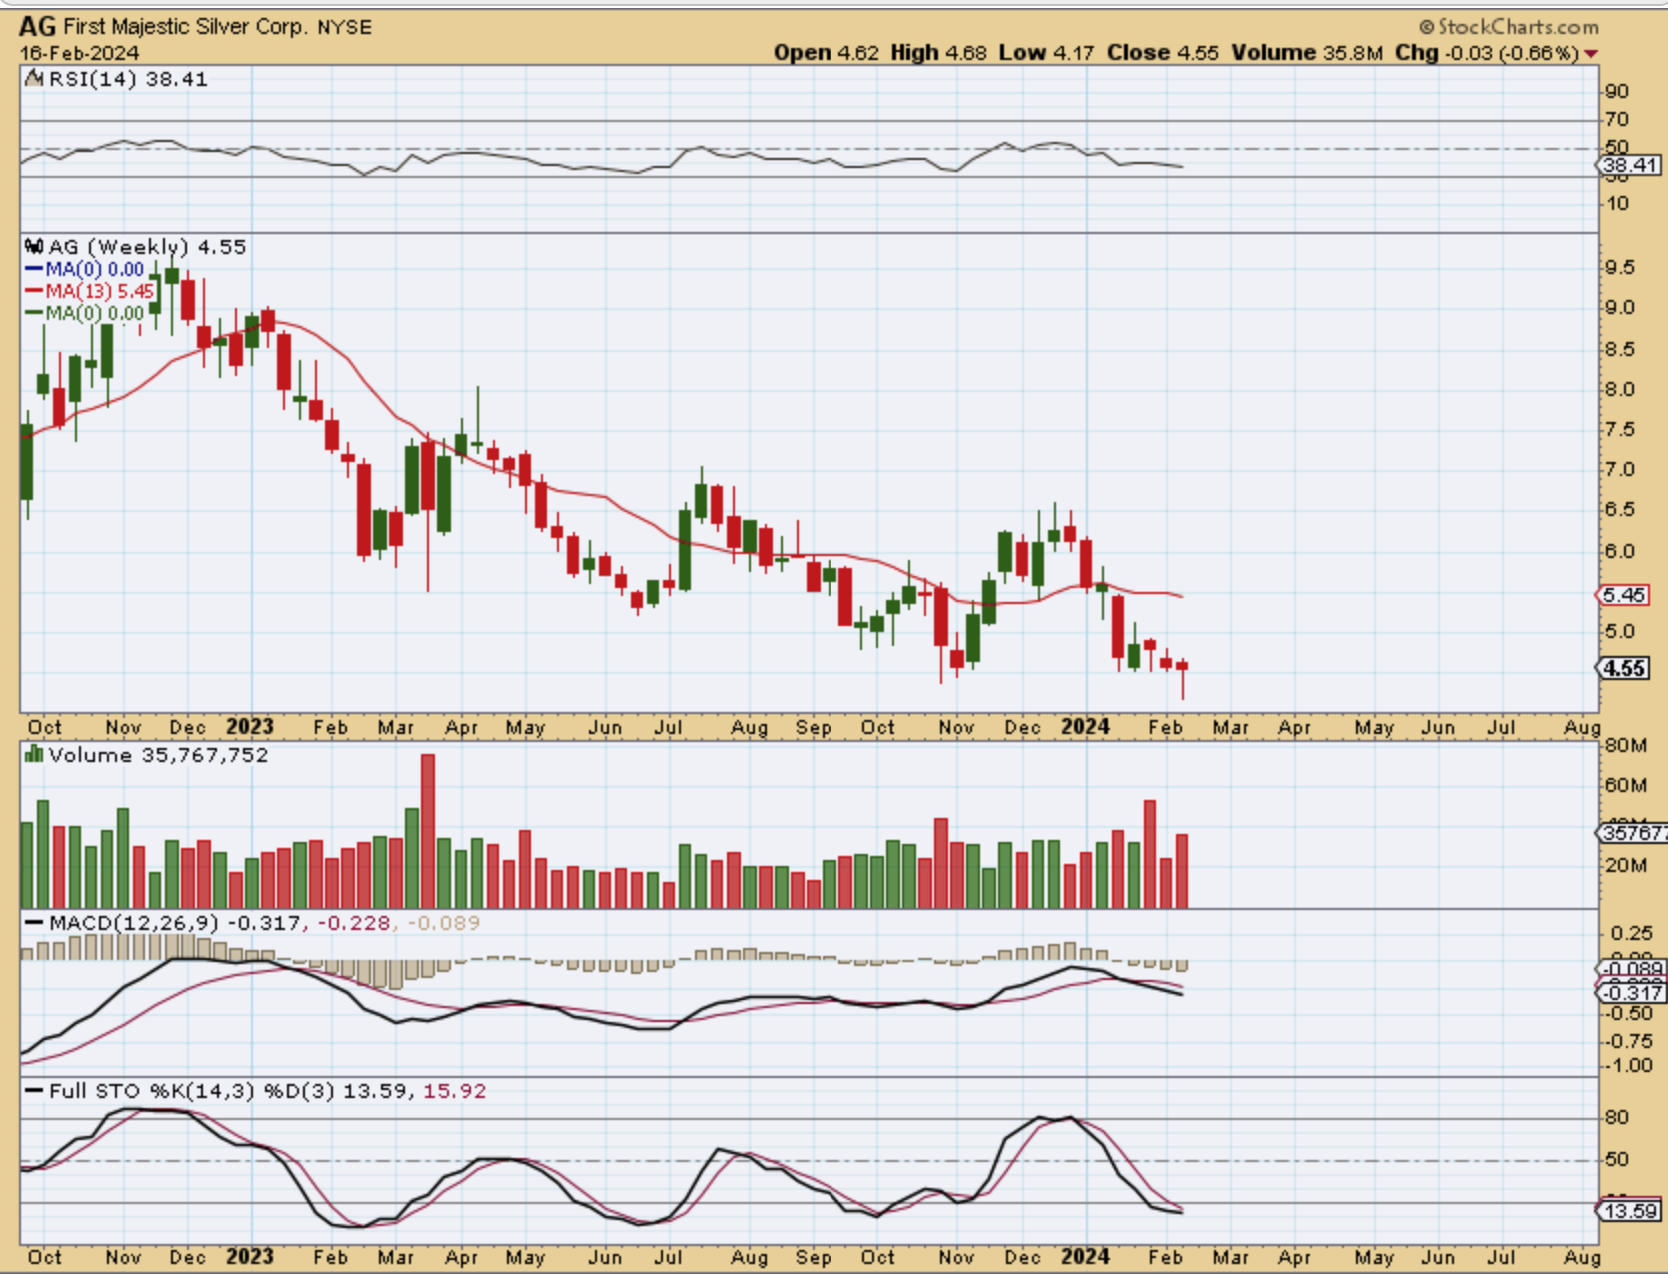
NOTE: Silver stocks like AG, EXK, FSM, HL, and such did not rise up like Silver. Their move out of the lows was not as strong as Silvers move. Instead, they closed the week red, but they did have reversal candles. You can buy this reversal with a stop, but we may just get a choppy move up and out of the lows, and then a drop back to the lows like we saw with Oil and Oils stocks.
.
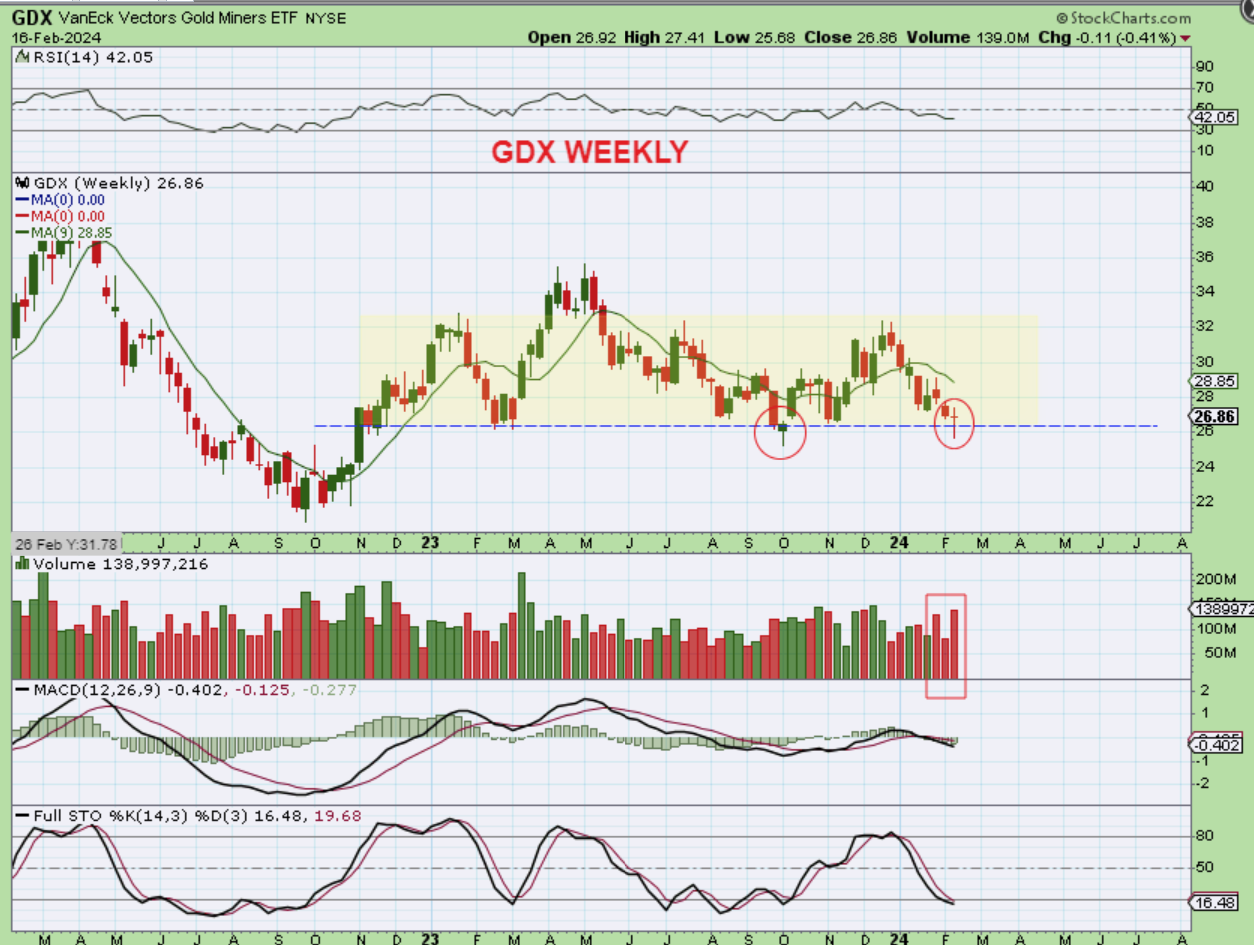
GDX WEEKLY: We do have a reversal candle with the Miners, and I have seen ICLs 4 months apart in the past, instead of the normal 5 – 6 months (It is quite rare though), So I gave this some thought, and I thought of something that I find interesting. I just hope that I can explain it so that it is understandable 🙂
.
1. We normally have four or five ’32 trading day – daily cycles’, so let’s discuss it this way: 4 daily cycles at 32 days each equals 128 trading days. 128 trading days would be 25 weeks or 6 months in length.
Conclusion: ‘4 longer daily cycles’ give us 6 months from ICL to ICL
.
2. We just had four daily cycles with roughly only 25 days. So, we recently had 4 daily cycles made up of only a total of only 93 trading days, so at THAT rate, it would be an earlier ICL if we still only get 4 daily cycles.
Conclusion: ‘4 short daily cycles’ could give us 4 months from ICL to ICL.
3. Is that still fuzzy? Try this:
–4 daily cycles at 32 days per daily = 6 months to complete 4 daily cycles ICL to ICL.
— 4 daily cycles at a shorter 25 days per daily is a shortened to 4 months to complete the same 4 daily cycles ICL to ICL.
.
So it stands to reason that the shorter daily cycles could give us a shorter Intermediate Cycle. Now we’ll just have to see if we get a 5th daily cycle in Precious Metals or not. Now we’ll be keeping a closer look at this sector as it makes progress.
.
Next week we will have the release of the Fed Mtg Minutes and if they discussed rate cuts favorably, things could move based on that.
1. The USD could drop and Gold could pop with talk of rate cuts.
2. No matter what they say, the General Markets seem to be ready to slowly drop into a dcl over time, simply because ‘time’ is getting late.
3. Oil and Oil Stocks are bullish set ups, and
4. Below I will discuss in detail Bitcoin & Crypto world. As mentioned in prior reports over 2023 to now, there have been and continue to be big opportunities in this Bull Run, if it continues to make progress. More below. Enjoy you weekend (long weekend in the U.S.) and thanks for being here with me. 🙂
.
~ALEX
.
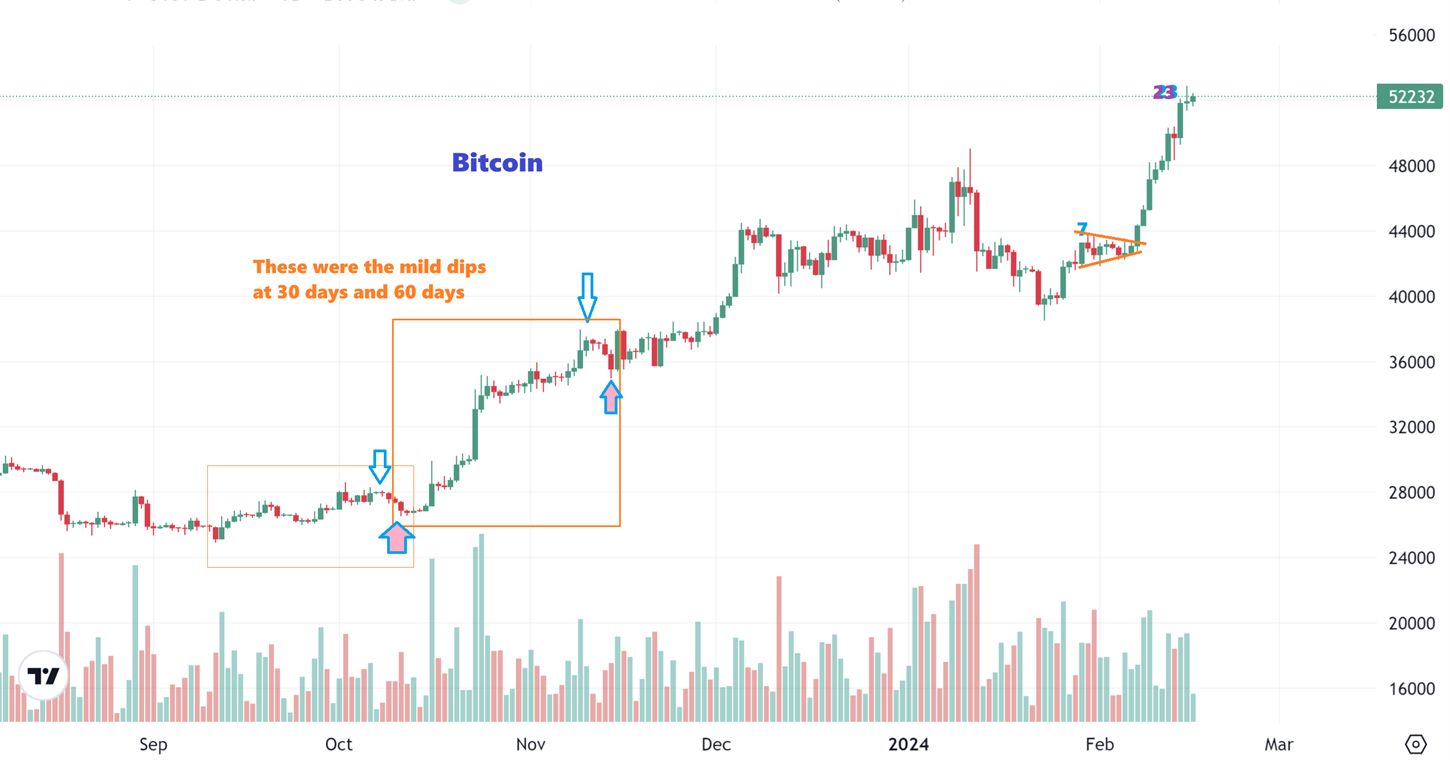
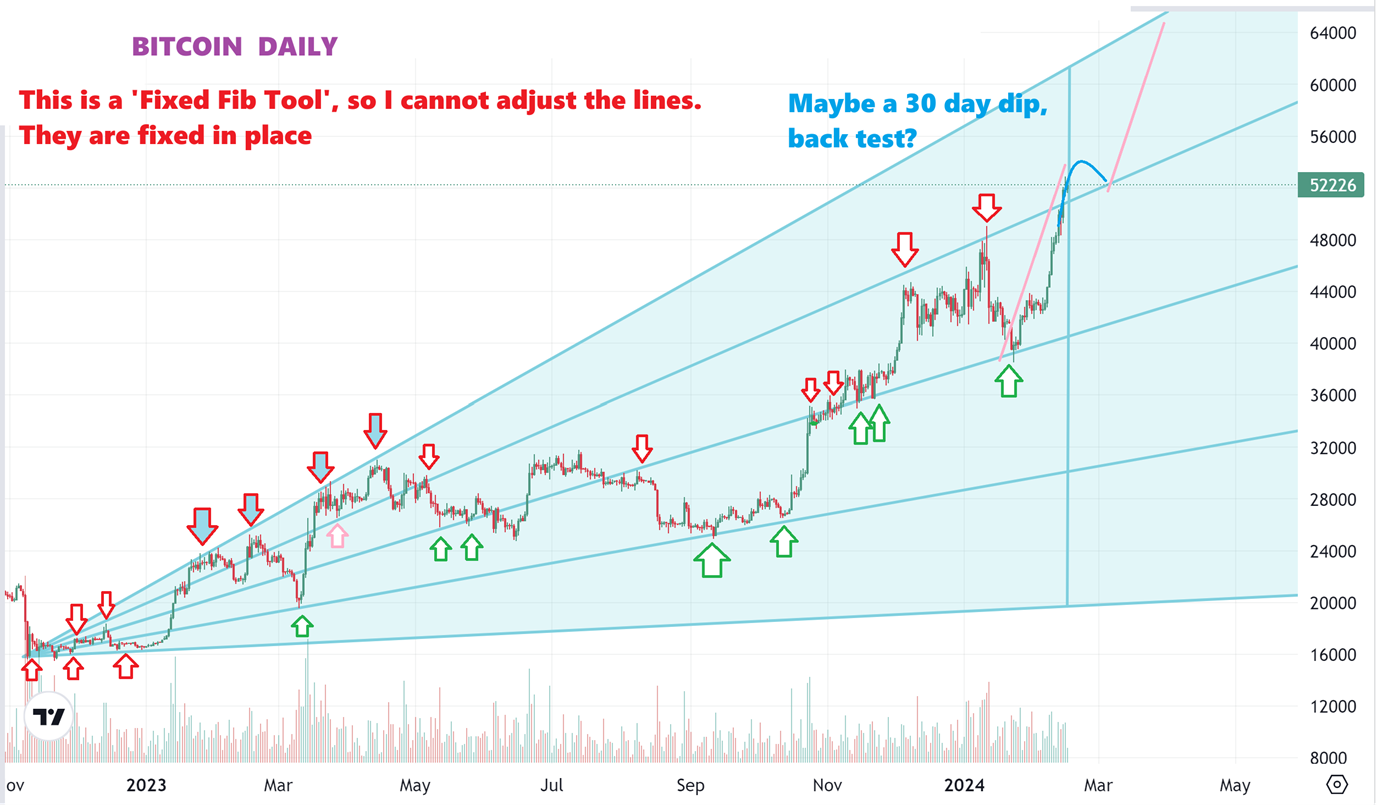
BITCOIN – I grabbed this chart on Friday to show that we were on day 24 (Friday). I’ve been saying that we are due for a 1/2 cycle dip into around day 30, and in the past these dips at roughly 30 days apart were pretty mild, lasting maybe 4-5 days. See the chart. The Blue arrows were the peak before the drop landed into the blue & pink arrows. Mild looking, right? I wanted to take a closer look at those dips, so let’s look at that a little more…
.
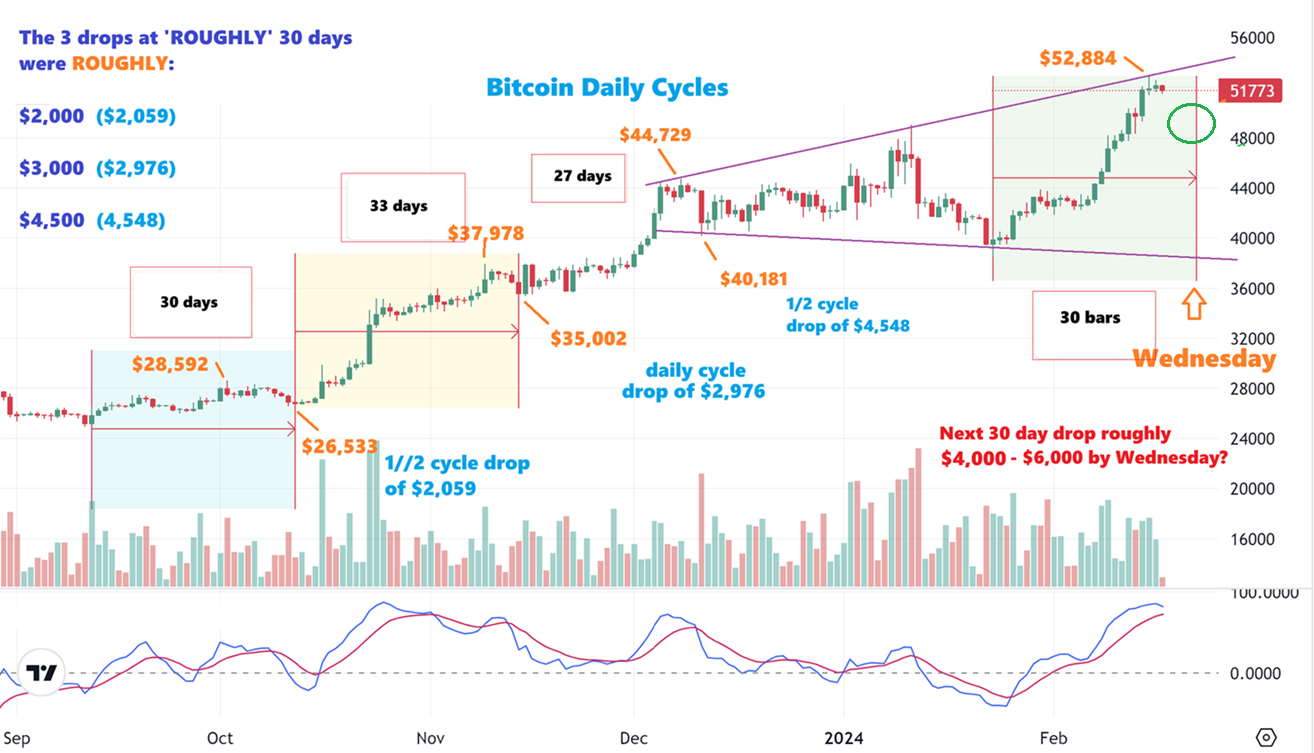
Now a day has passed and I have BITCOIN on Saturday –
The left upper corner of this chart showed the results of the last dips that arrived roughly 30 days apart. On the chart each box shows you how I got those numbers from ‘peak’ to the ‘lows’. I also wrote how long those time periods were. Please see if you can follow along…
1. The blue box, peak to low, was roughly a $2000 drop ($2,059)
2. The Yellow box, peak to low, was roughly a $3,000 drop ($2,976)
3. The next period of time was 27 days, and dropped roughly $4,500 ($4,548)
4. If Thursday is our peak, then a drop from our Thursday peak could be anywhere around $3,000-$6,000, as a guestimate, based on what I see here. A mild drop could be to $48,000-$50,000. We’ll see.
..
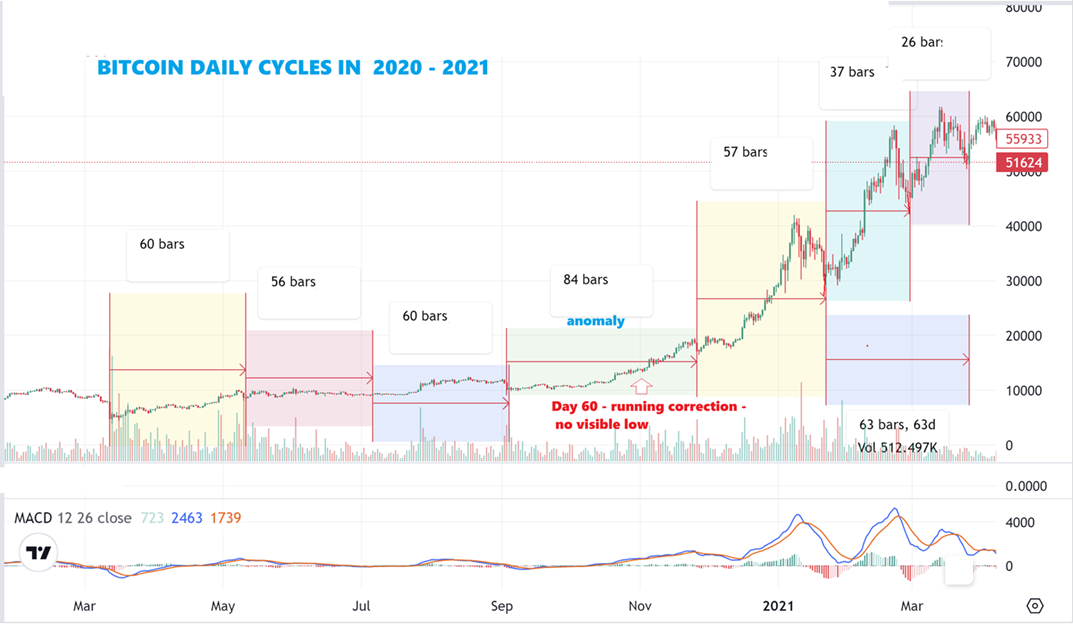
BITCOIN: I also wanted to go back to that 2020-2021 run, and show you how these daily cycles moved accurately through time back then too. I use 60 day periods dcl to dcl, and look for a mid cycle dip around day 30. We did have one very stretched daily cycle, as noted on the chart, but notice how the others were very close to 60 day dips. We had 60 days, 56 days, 60 days, 84 as an anomaly, 57 days, & 63 days. As chaotic as Bitcoin Seems at times, that was quite orderly.
.
I used a Fib Tool, where I cannot adjust the spread of the bars of the ray. These are fixed at certain Fib Levels, and I noticed some interesting ‘markers’ over time too, so let me show you that…
.
BITCOIN – I simply started in the lower left corner at the Bitcoin Lows and used the lower line along those lows. The fan spreads out and then I saw that many times, Price did find support and resistance at Fib Levels, so I decided to share that with you. Please take a look at all of my arrows and notice all of the ‘touch points’ or reversals during the 2023-2024 rally. So…
.
.
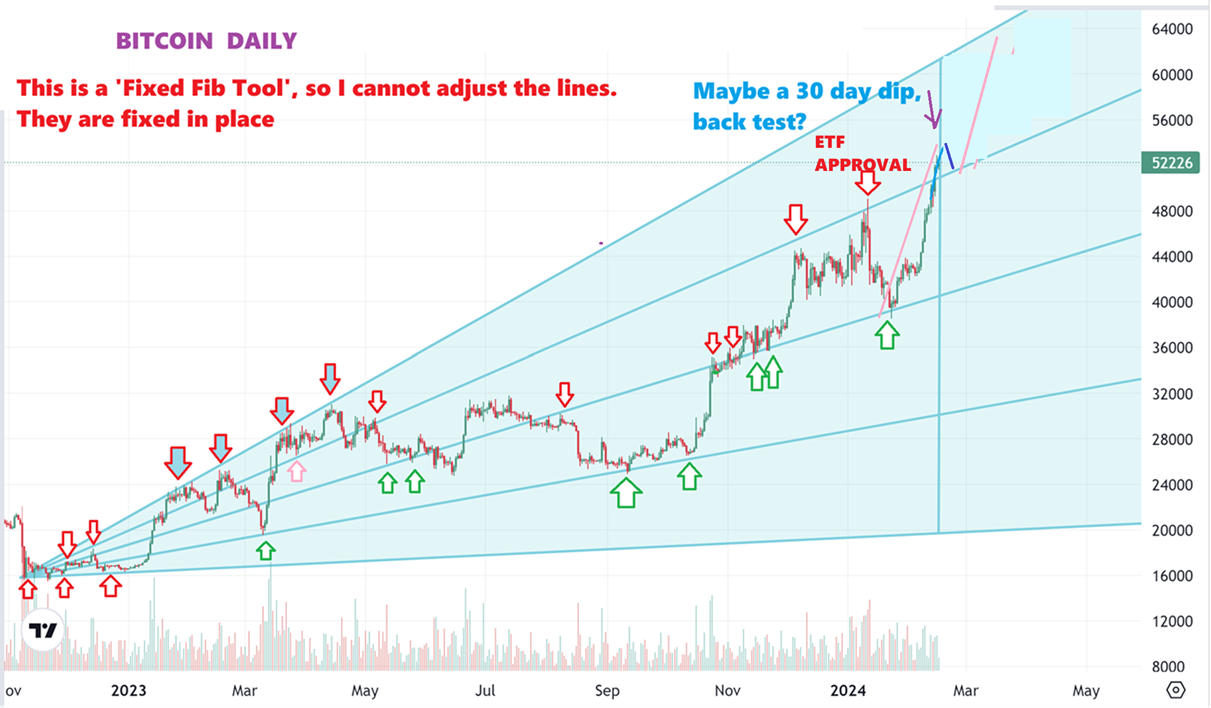
The Peak formed by the ‘Approval of the ETF’ actually tagged a line and dropped down to the next line as support.
On this rally, we just broke above that line. With a 30 day 1/2 cycle dip coming due, might we fall and back test that line or slightly break it before recovering? That’s possible. A $3,000-$6,000 drop actually takes us down closer to $48,000, but since this rally was a straight up strong move out of the recent lows, possibly from ETF Buying, the dip MIGHT be choppier and less deep when compared to past 1/2 cycle dips due to buying, it is hard to know for sure. I AM WATCHING THESE THINGS.
.
BITCOIN WEEKLY– I have been covering the similarities between now and the post halving rally in 2020 for many weeks actually, and it is still somewhat following that run higher. If we are having a rally like this due to the ETF buying, and then we get a 2nd rally later in the year after halving? Wow! I have upside targets that seem ridiculous, but they run from $130,000 to over $200,000. If that happens, Alt Coins and crypto related stocks have already and should continue to make excellent gains.
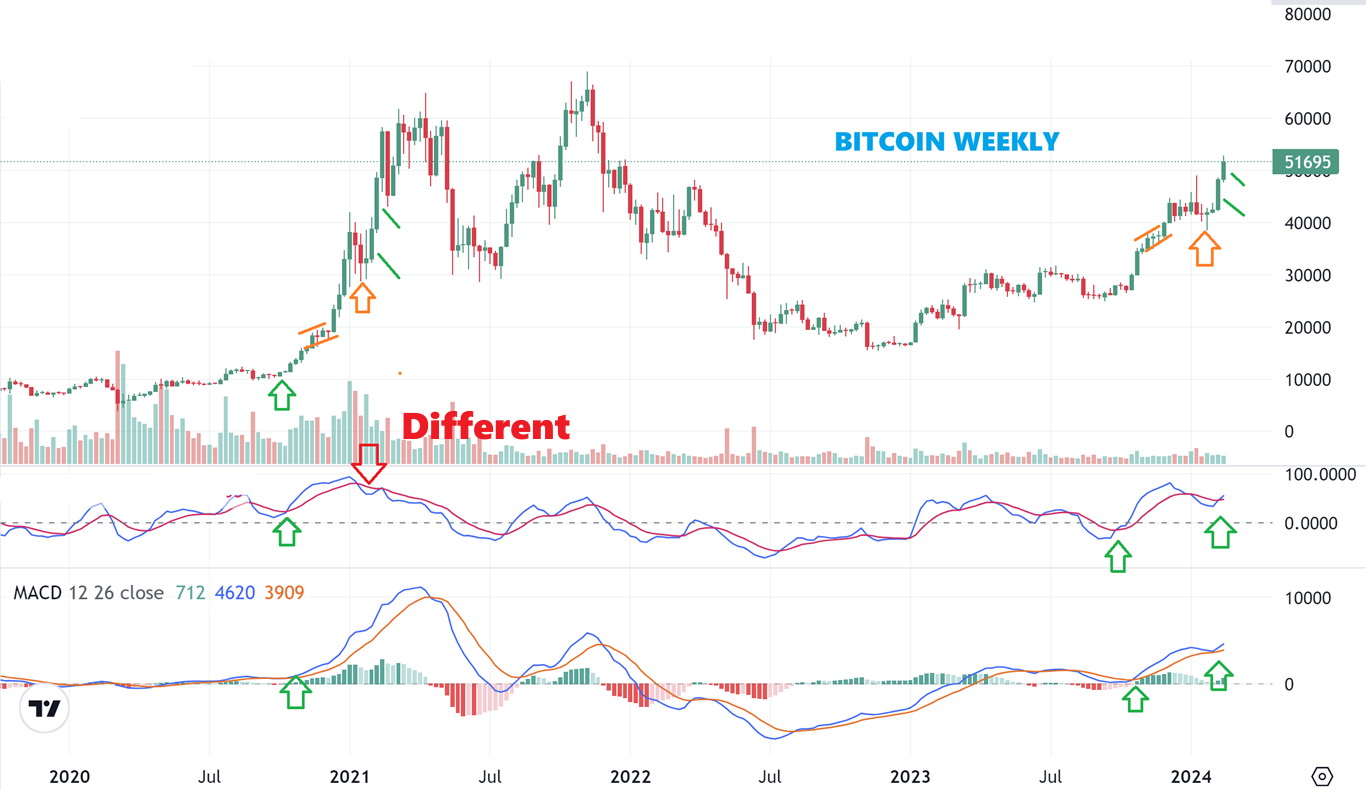
If that happens, Alt Coins and crypto related stocks have already made and should continue to make excellent gains. I have discussed that in past reports and will discuss it in more detail in future reports too. I have discussed leaders and laggers in past reports and I had the following in Fridays report about a couple of leaders…
.
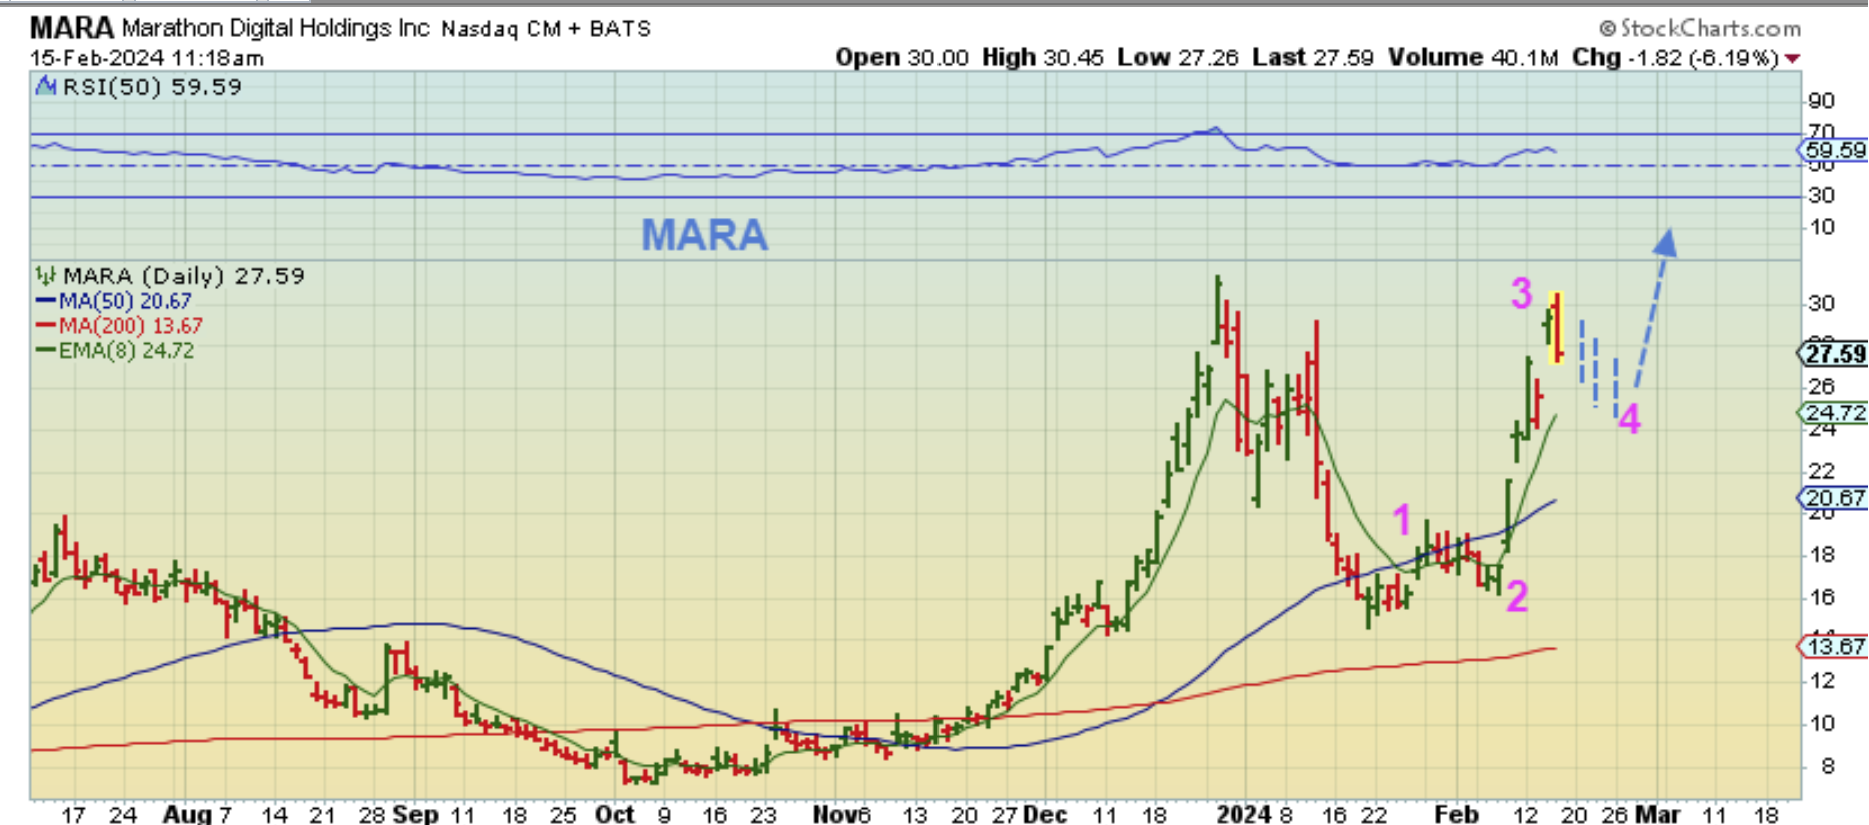
MARA FEB 8th –
DO YOU REMEMBER? I said when this run started that I think we could see a run like this. An a-b-c down, followed by a 5 wave rally. I said that this would form a very bullish inverse H&S. Well…
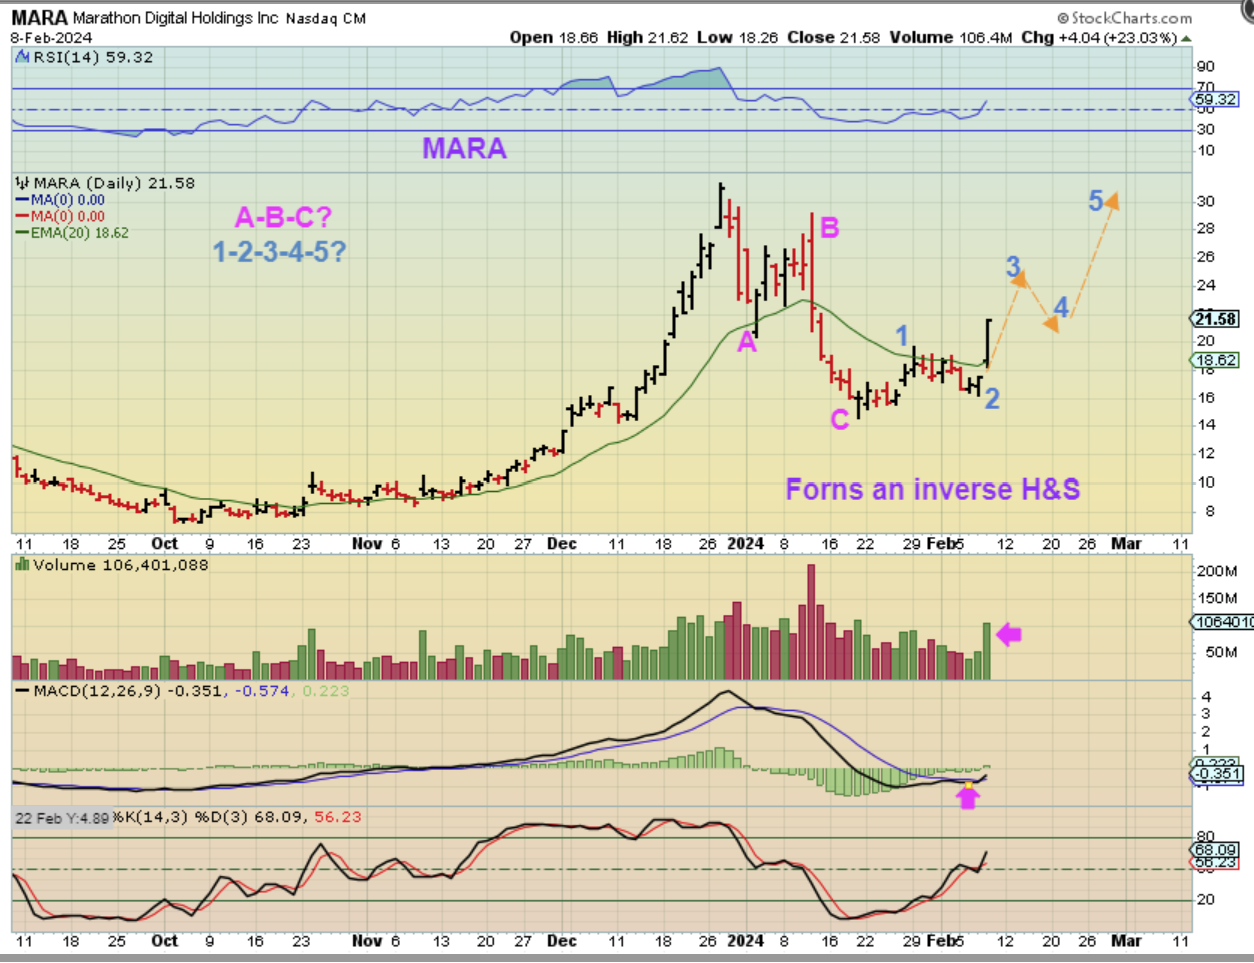
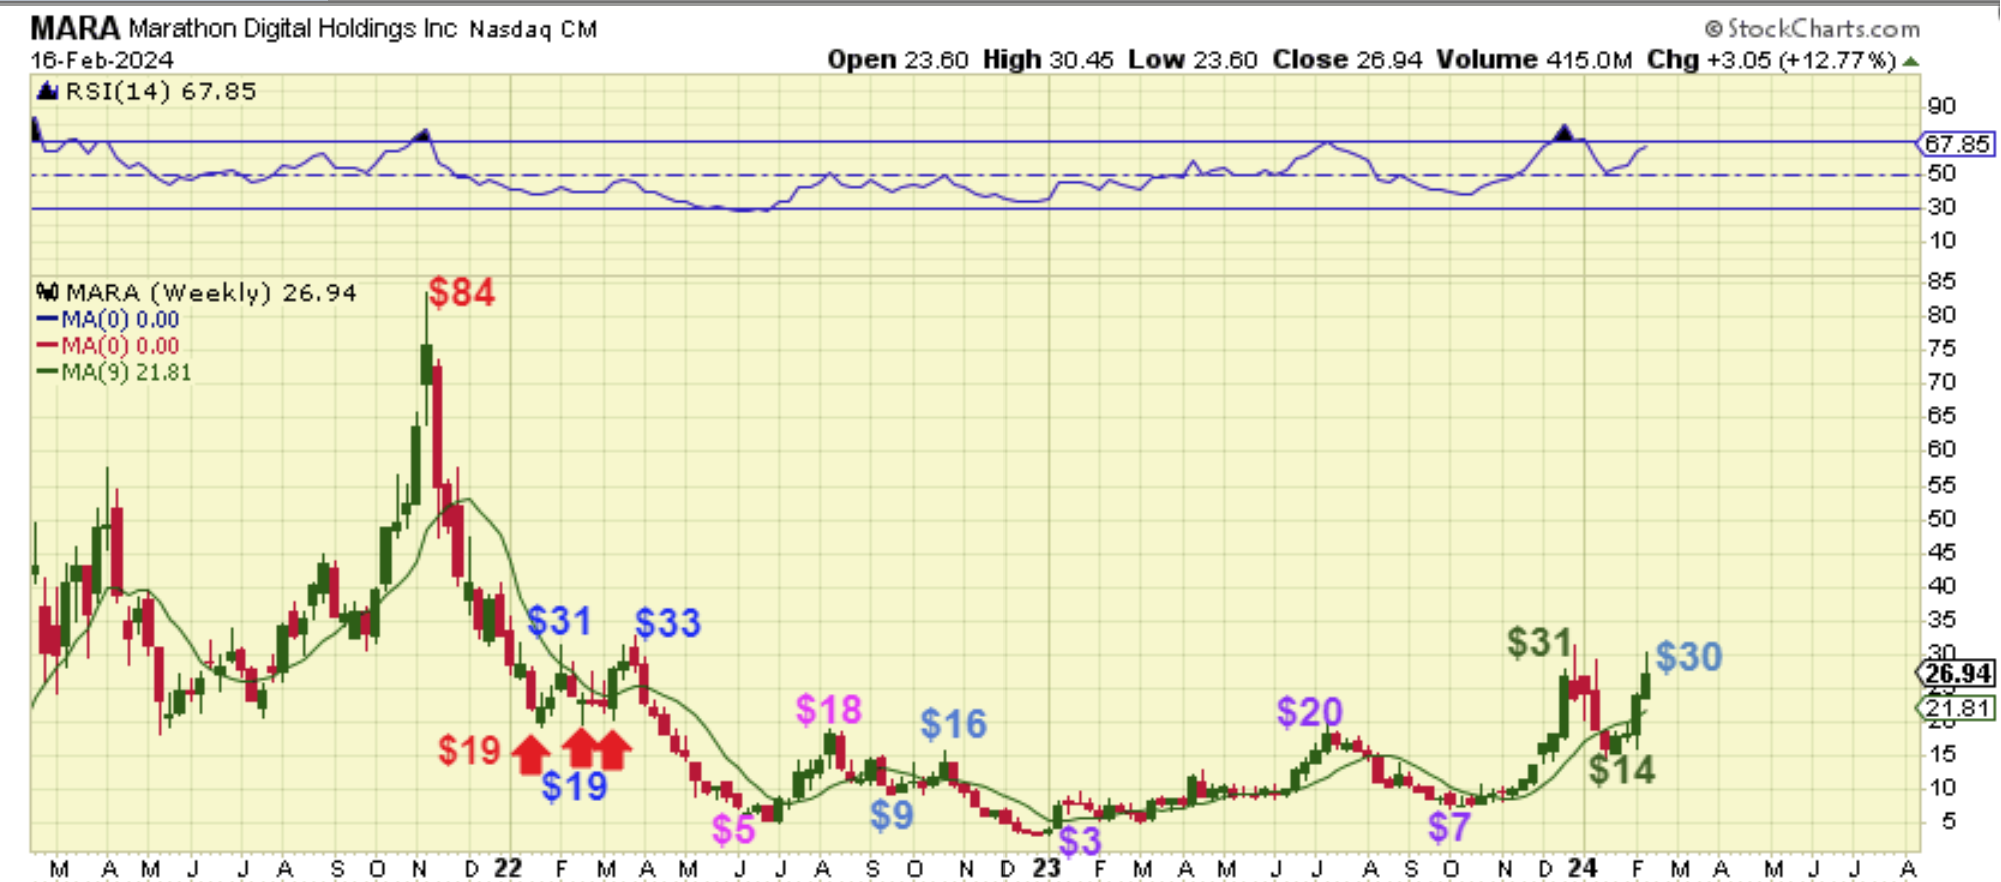
MARA FEB 15 – That last rip higher was very strong, wasn’t it? $16 to $30 in about a week. That came after that drop from $30 to $14, so these are VERY Volatile. Well, if we get a 1/2 cycle dip in Bitcoin, that is when we could get a pull back to the moving averages to give us 4, and THAT would be a clear buy, forming that inverse H&S pattern that I spoke of.
.
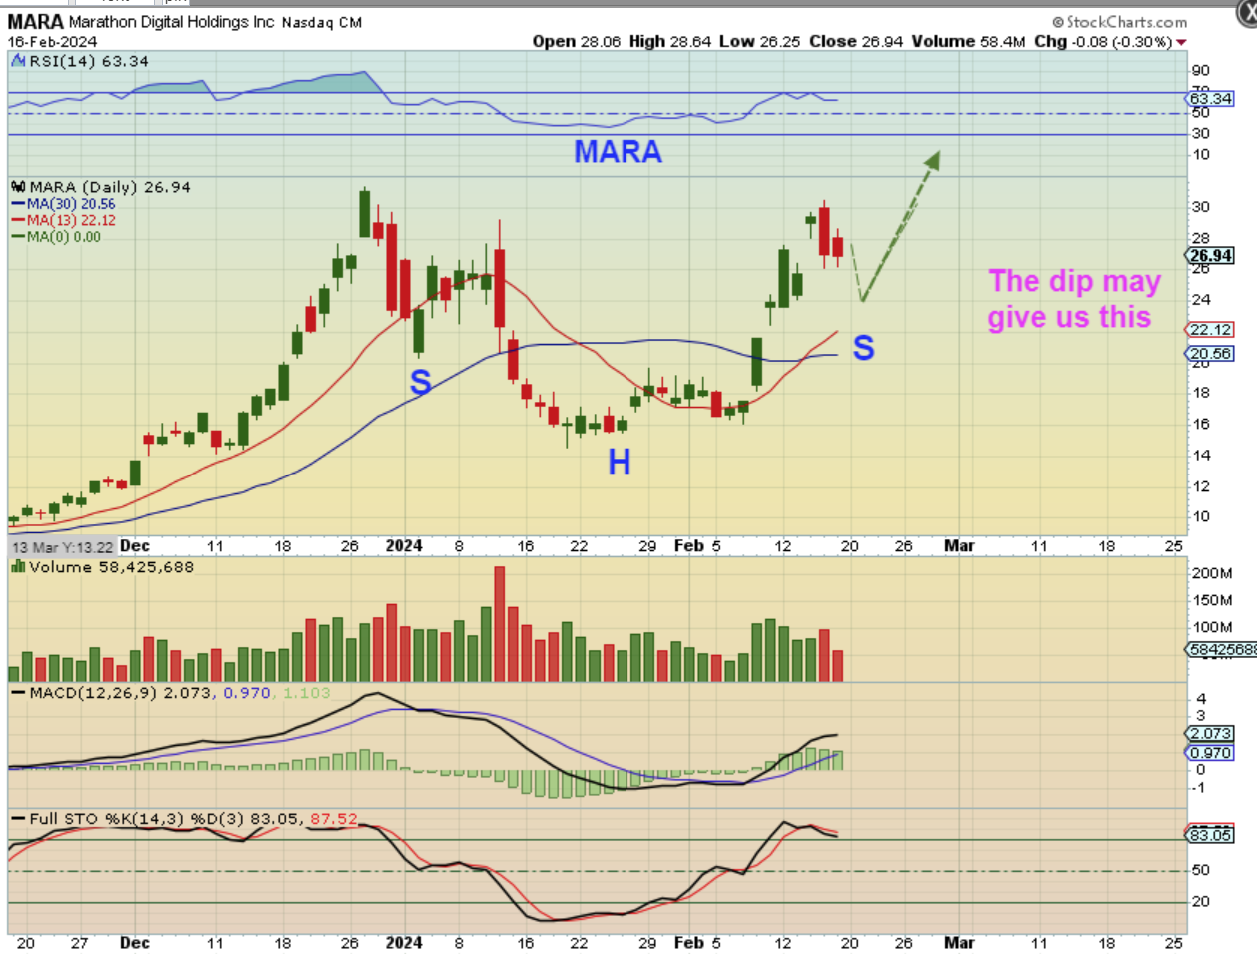
MARA FEB 16 – MARA did drop on Friday too. The hard part about Bitcoin is that it will trade Saturday through Tuesday, and it could dip down while US Markets are closed Sat-Mon. Bitcoin may or may not give the stocks time to drop if it finishes its drop by Tuesday. 🙁
.
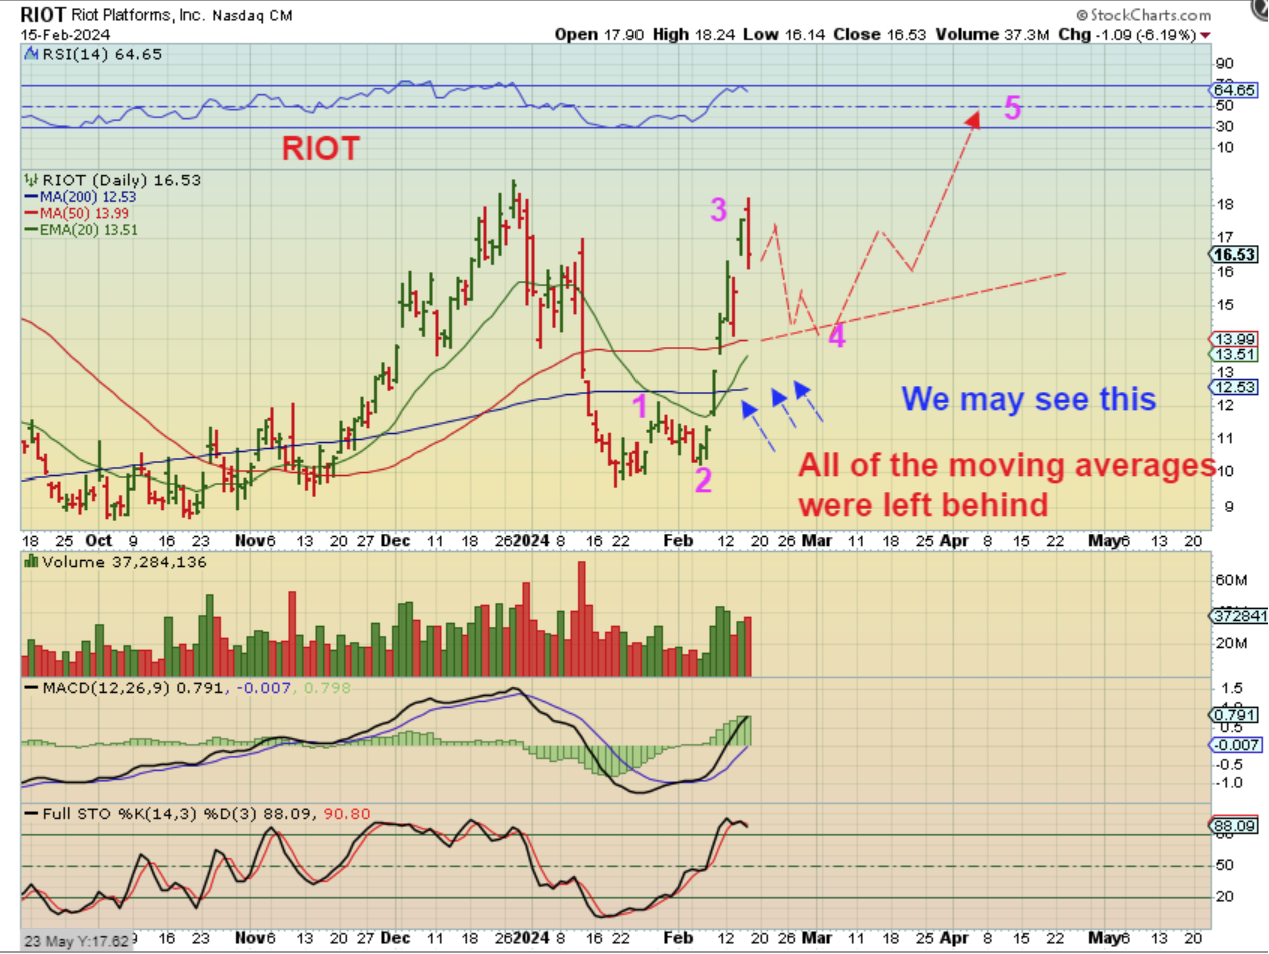
On Friday I wrote for RIOT – We MIGHT, MAYBE, POSSIBLY….could see something like this with a bitcoin half cycle dip. We just have to wait and see, but this is the next possible lower risk entry, if it happens. I guess when I say lower risk, just know that even in this bull run, we just dropped from $18 to $10 in January, and back to $18 last week. The risk is Major volatility.
.
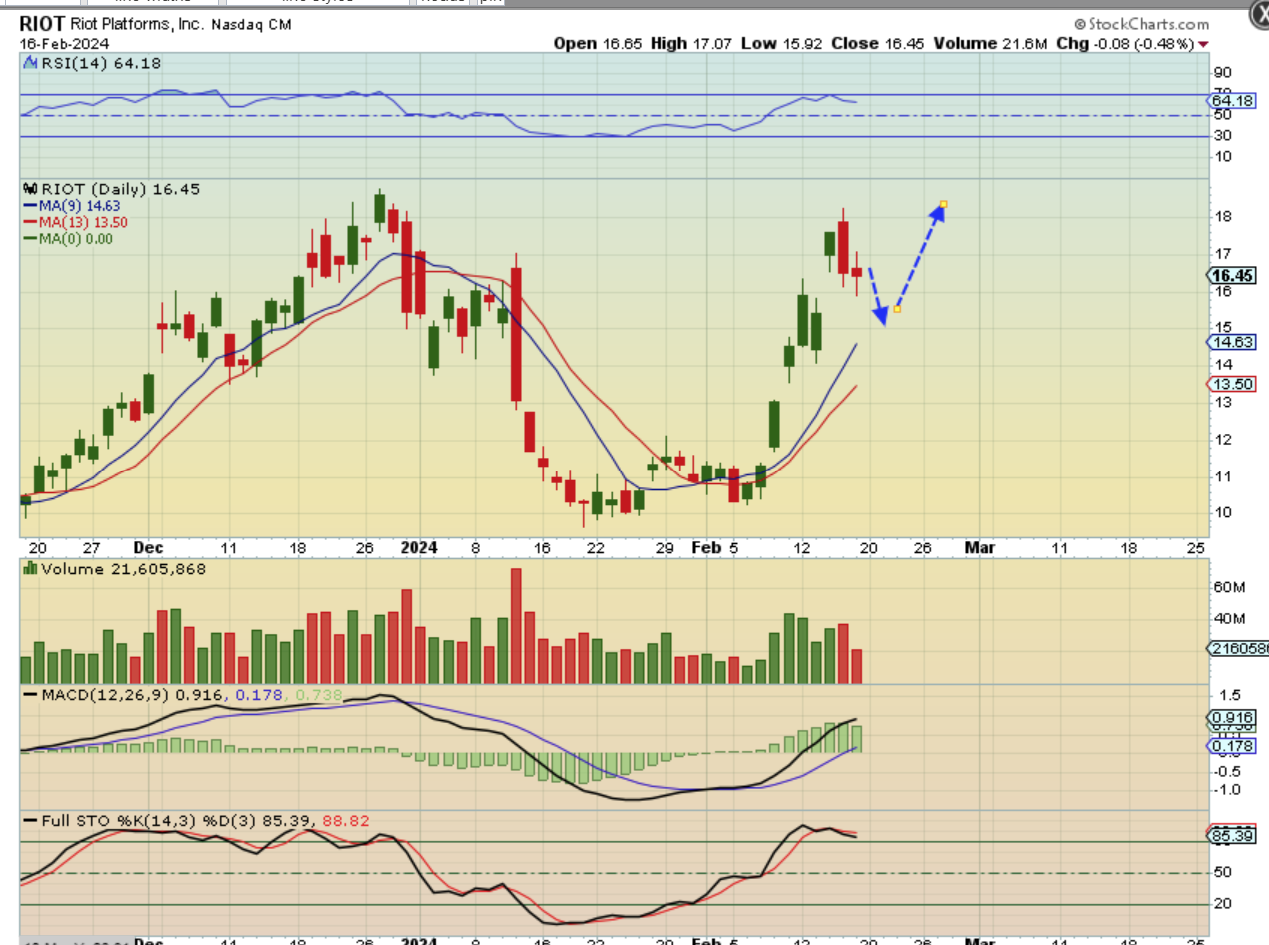
RIOT put in a DOJI on Friday and it can drop further, as long as Bitcoin dips lower into next week too. A gap fill may be what we get.
.
**THIS IS WORTH REPEATING : The hard part about Bitcoin is that it will trade Saturday through Tuesday, and it could dip down to the 1/2 cycle low while US Markets are closed Sat-Mon. If that happens, then Bitcoin may or may not give the stocks time to drop. Bitcoin may finish its drop by Monday night or Tuesday, even though day 30 is Wednesday. 🙁
.
FINAL THOUGHT HERE:
I actually received a couple of emails last week thanking me for something that I mentioned in the commenting area. I am thinking that if a few people benefitted from that there, maybe I should put it in the reports. So basically what I said was to take a good look at how these crypto related stocks move. The best strategy for some may just be buy & hold & ignore it. Why? Well, just take a good look at MARA again…
.
MARA: Some of these runs and dips in the base alone could cause one to get very emotional when you have money riding on it. In the last year — $3 to $20 to $7, to $31 to $14 to $30. Your money doubles, then gets cut in half, then doubles, then you lose 30%. The worst thing that happens is when it starts to run and goes from $7 to $30, so someone jumps in for the run back to $80, and it drops to $14 in a week. So you sell and it takes off to $30 again without you. It is very frustrating, but that may be when we just need to focus on THE BIG PICTURE. This is a still a large base and I do feel that Bitcoin is in its major bull move out of the lows and will make strong gains into 2025. If MARA runs back to $80, and then $125, and then $160, we will look back at this choppy base and laugh (or cry). So what I said was…
.
So what I said was simply that it might be easier for some to just take a % of their account to invest & ignore it (for some it may be 5%, others may choose 10%, high risk tolerance may be 15-20% or whatever they can stomach). You may even need to open a separate account or set it aside somehow into a basket of reliable, well-known crypto stocks. And don’t touch it, maybe don’t even look at it for a year. It should be money that you can afford to lose a chunk of, but in a year, these stocks could actually be MUCH Higher. RIOT and MARA are well known, and others like CLSK, BTBT, BITF, WULF, etc may qualify. Just buy the next dip or pullback and let it alone.
.
So again, let’s look at MARA.
I (we) was buying MARA in that $3 & $4 &$5 area and rode it and traded it to $10. I have also traded in and out at other areas with MARA, RIOT, WULF, CLSK, BTBT, BITF, IREN, etc, etc. In my reports in early 2023, I mentioned that a Major multiyear bottom was in back then, so if I just loaded up on RIOT & MARA and ignored those completely until now, the chop wouldn’t matter as much. If I bought MARA at $4 and let it ride, I’d look today and MARA is in the $25-$30 area. 10 x the money.

