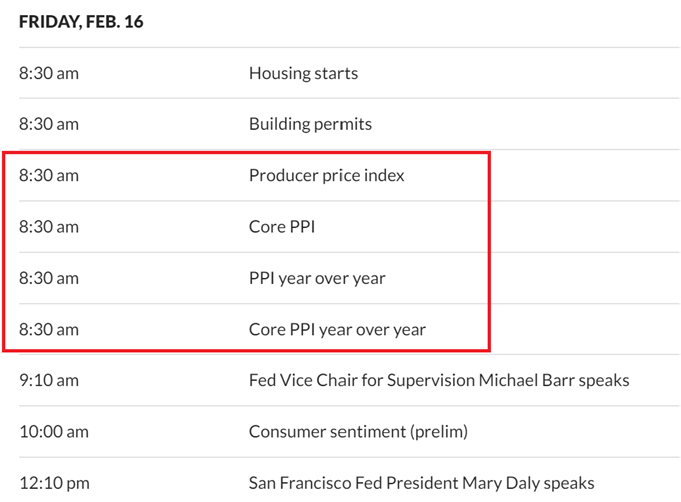
Friday Feb 16th
DATA – PPI can move the markets, and the CPI dropped the markets, so we’ll just have to wait and see what happens at 8:30 A.M. ET. The Jobless Claims had the markets continue higher yesterday…
.
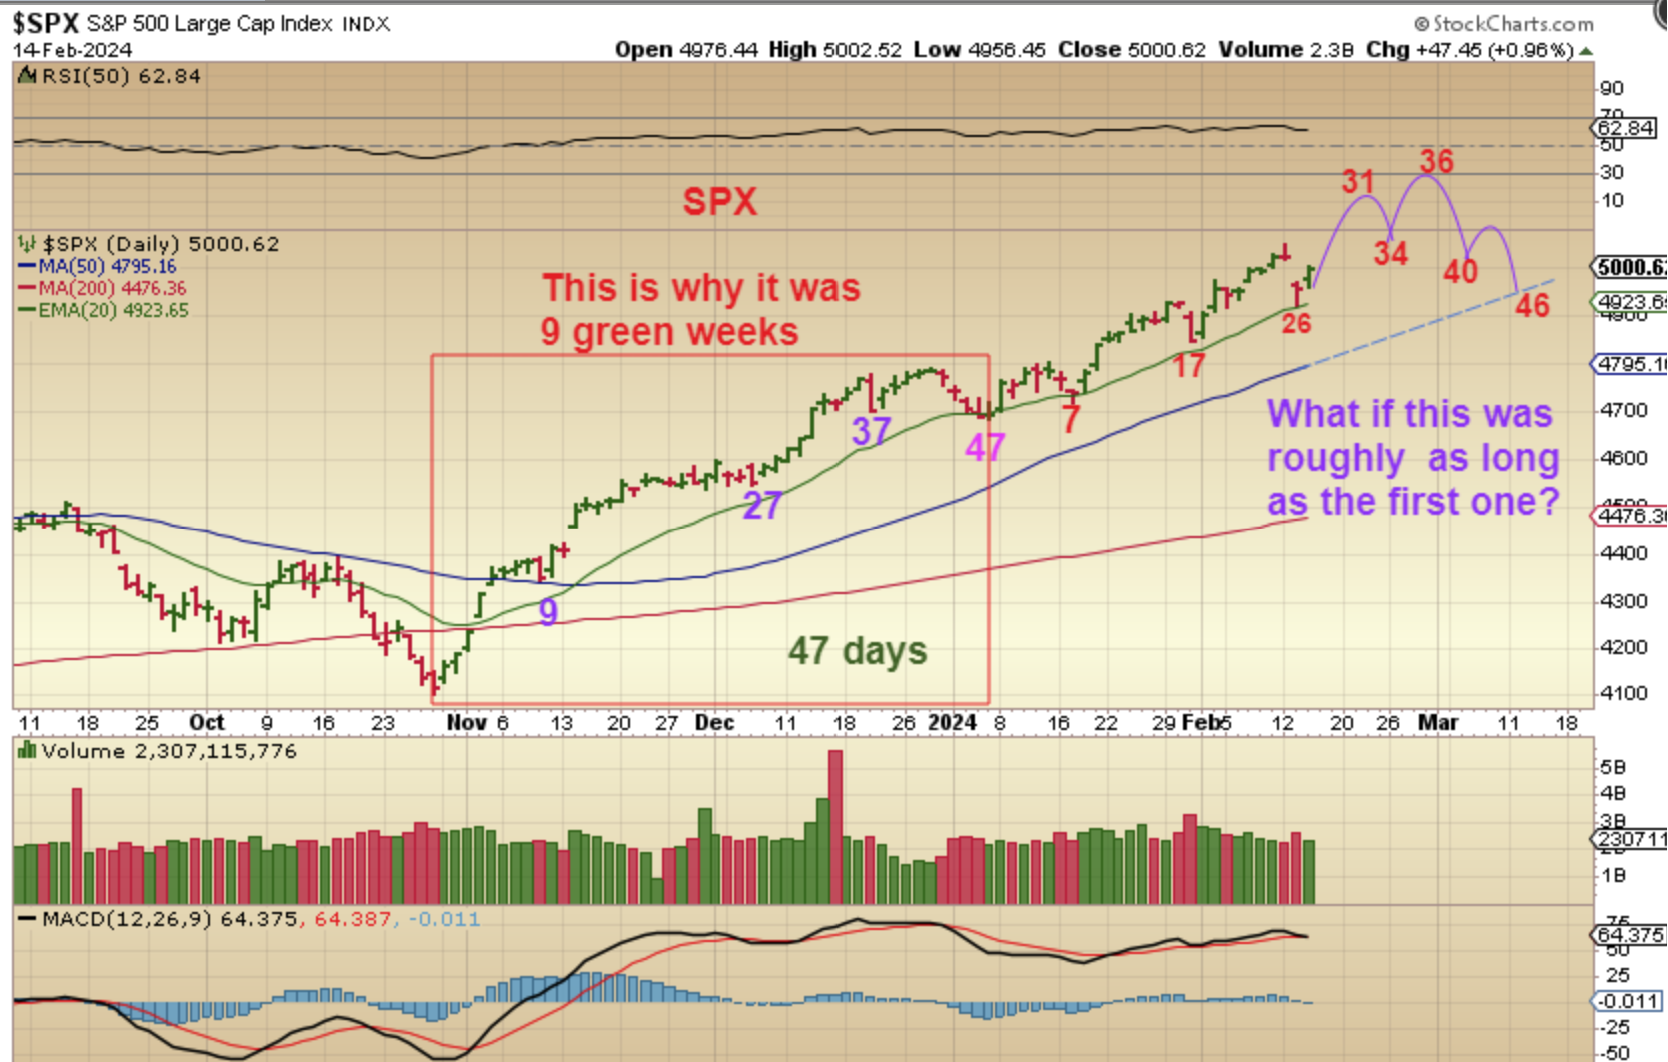
Yesterday I mentioned that the last daily cycle was 47 days long, so since we were only on day 27, we could actually get more upside. I said:
.
Using THE SPX daily chart, we see that we had 47 days in the first daily cycle, that is why we had 9 green weeks. We are only on day 27 now, so we are on week 6. So it is possible that we dropped on CPI and rally to new highs into next week too.
Stay Frosty – Use stops at the 20 ema! 🙂
.
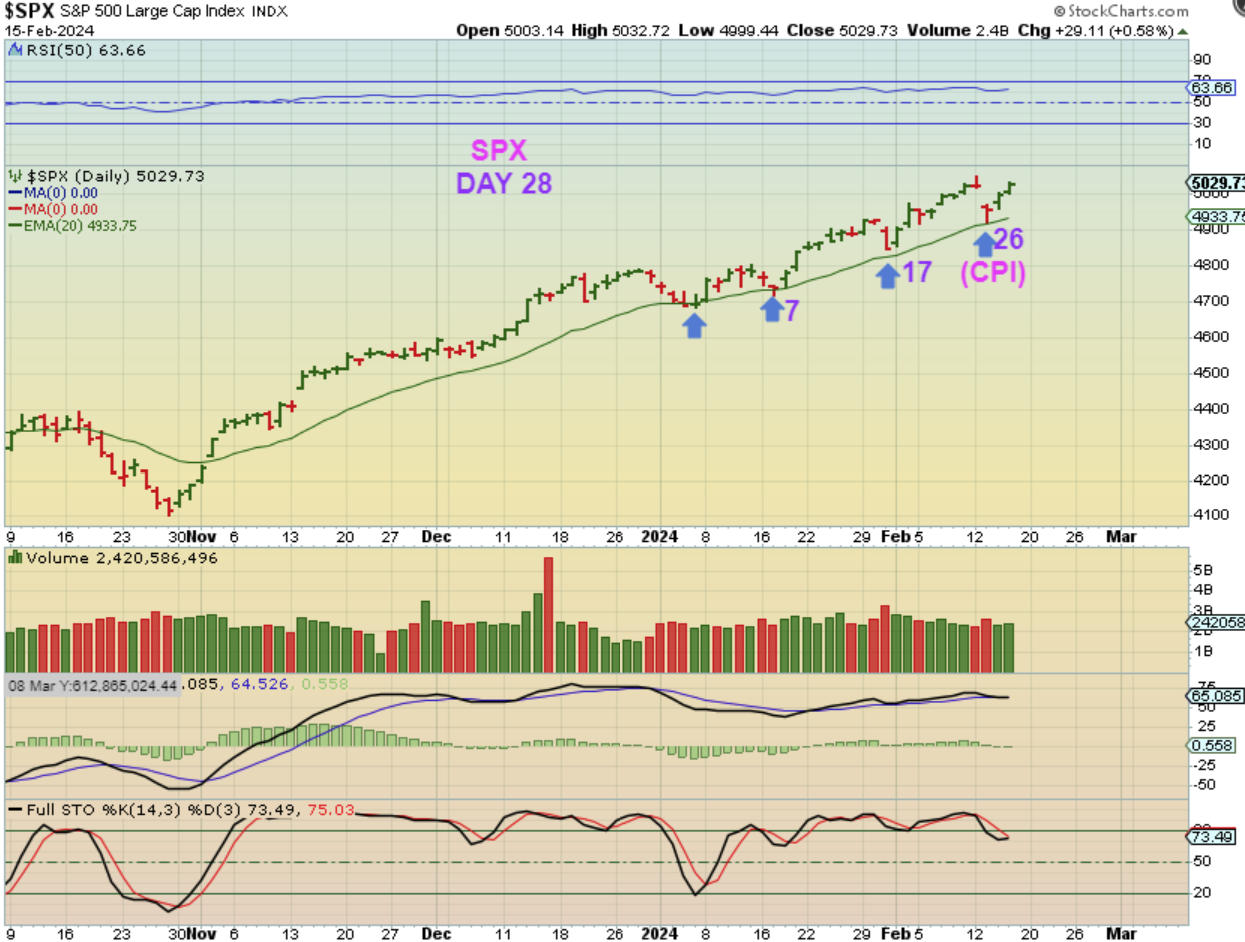
THE SPX did continue higher on day 28 with the jobless claims report. Today is the PPI number. We’ll see what happens in premarket.
.
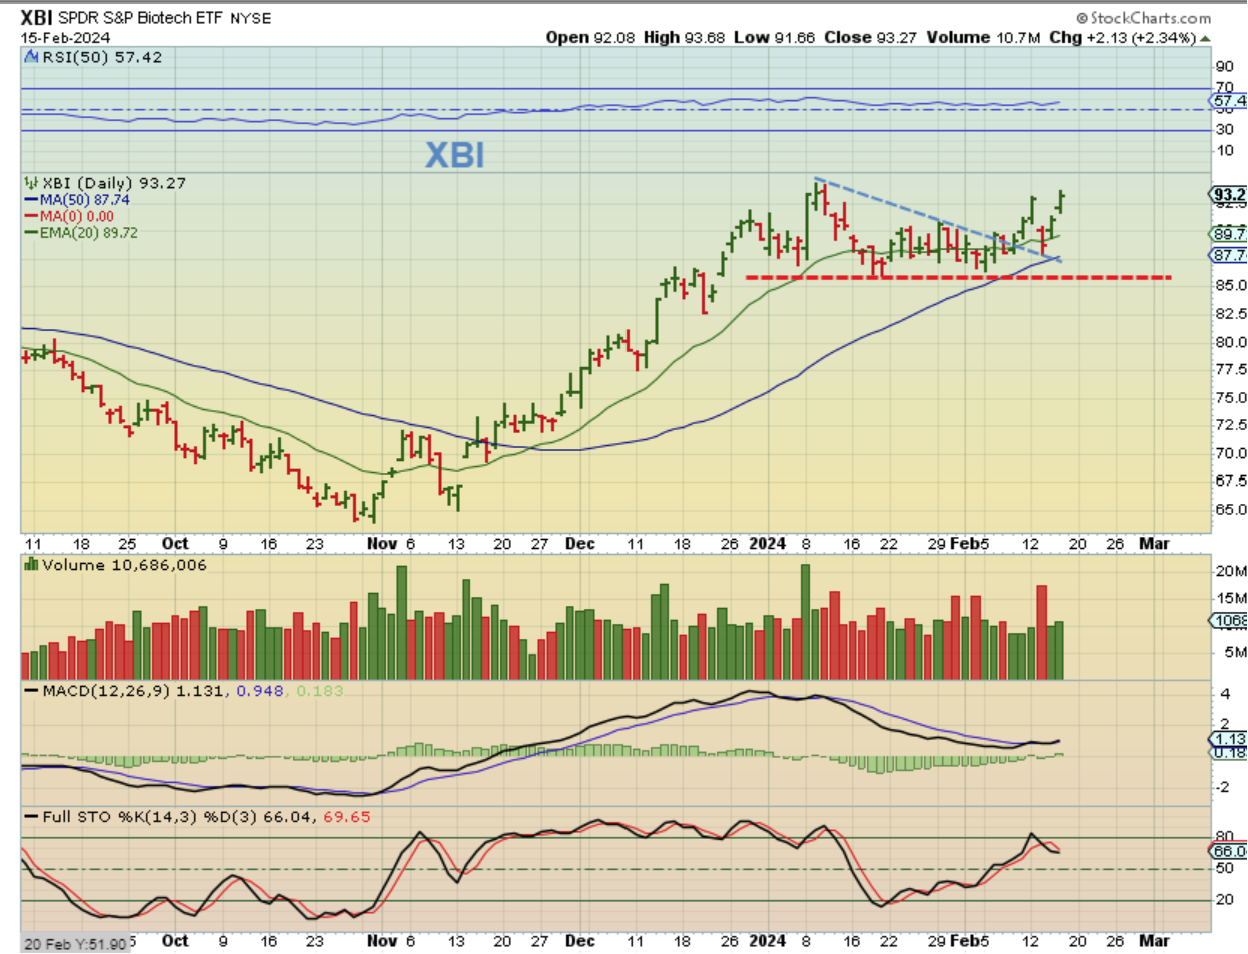
XBI -I mentioned that the Biotech sector looks good and LABU and a variety of Biotech stocks are running higher. That continued on Thursday and CRSP, TWST, XERS, OMER, SENS, etc. continued to make gains.
.
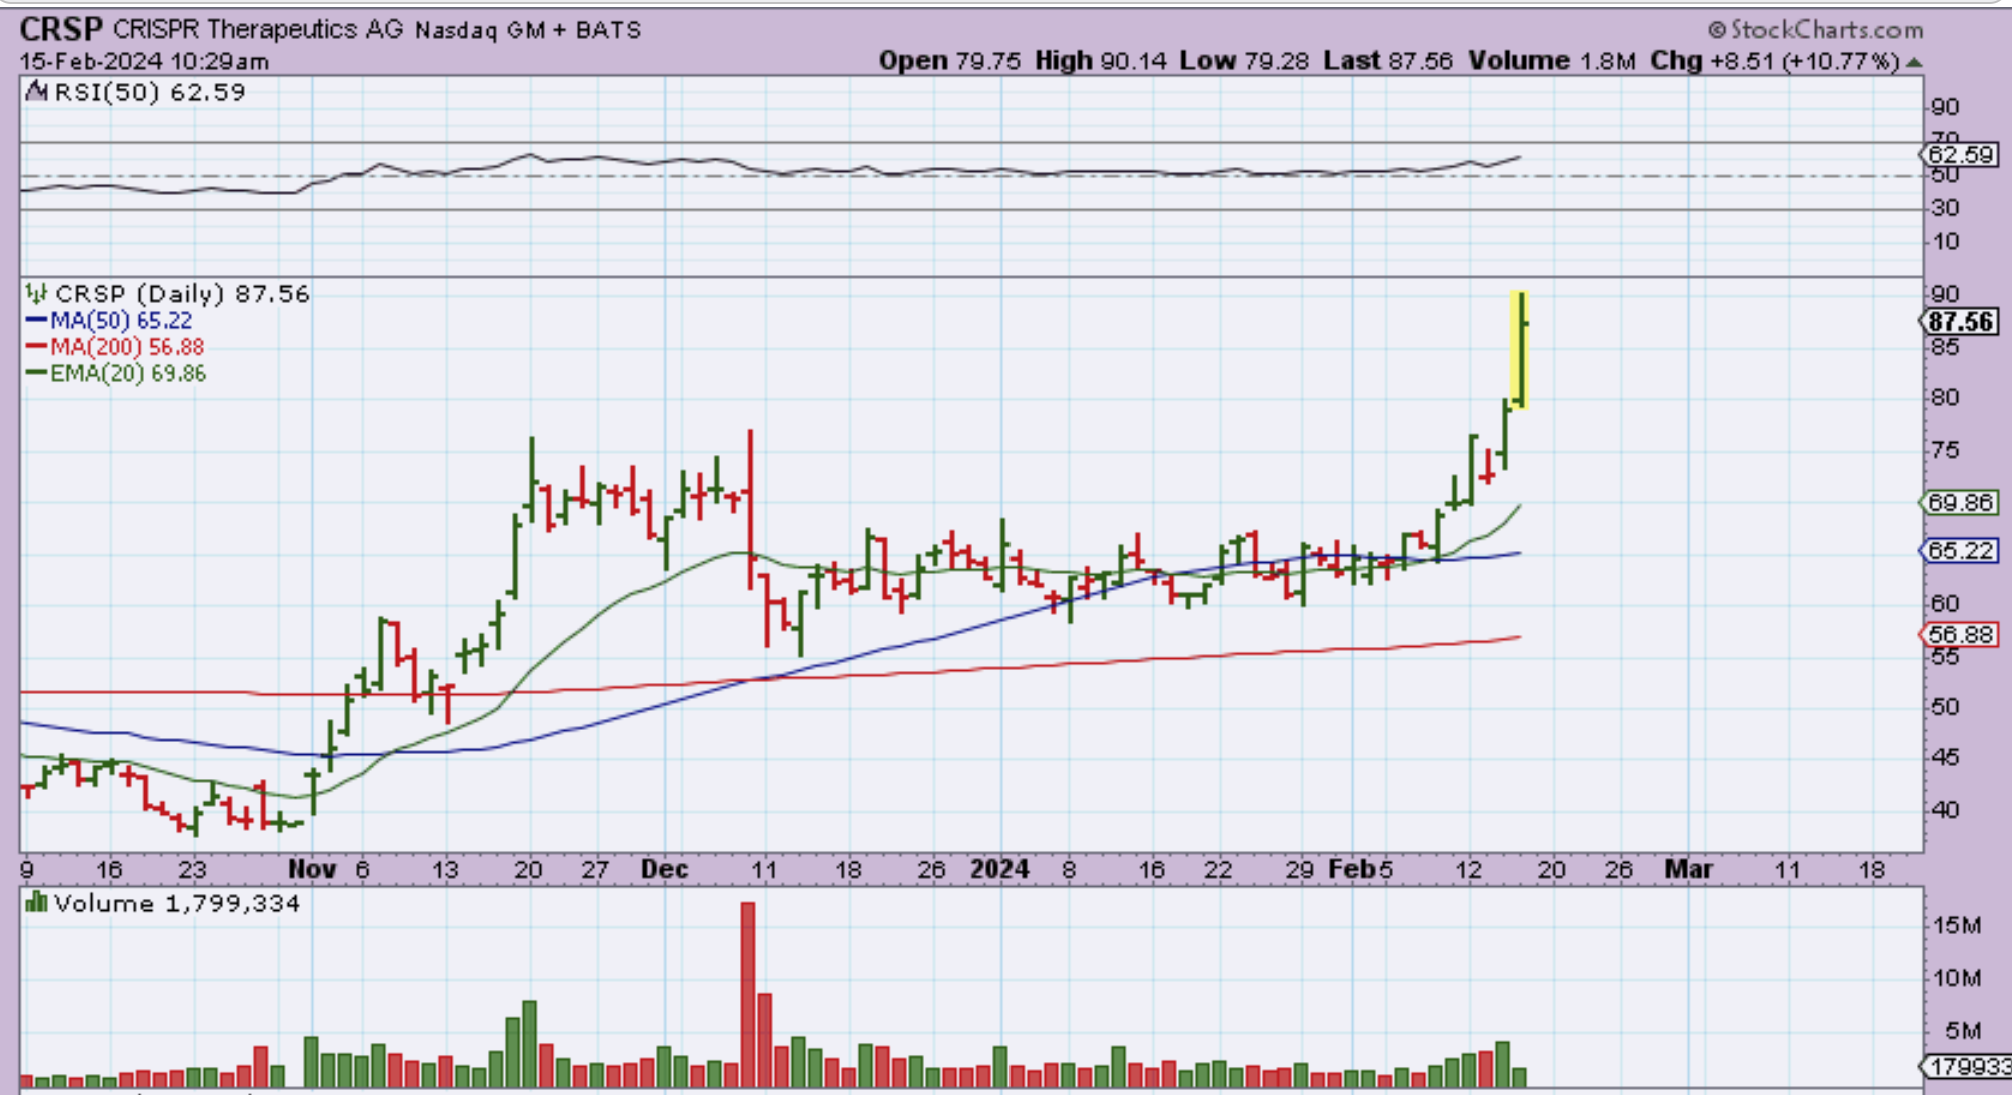
NOTE: CRSP-At one point, CRSP was actually up 13% and then started to drop back. It closed up 8%, but so far the gains have been very good. If it pulls back to do a back test or tag moving averages ana the sector is still bullish, this will make a good one to buy, but THEY DO HAVE EARNINGS ON MONDAY for those still holding it. The last earnings was Nov 7, when this whole rally began.
.
WTIC – Oil flipped higher at the 20 ema, and this now does look to be a day 35 dcl took place. Oil stocks also pushed higher…
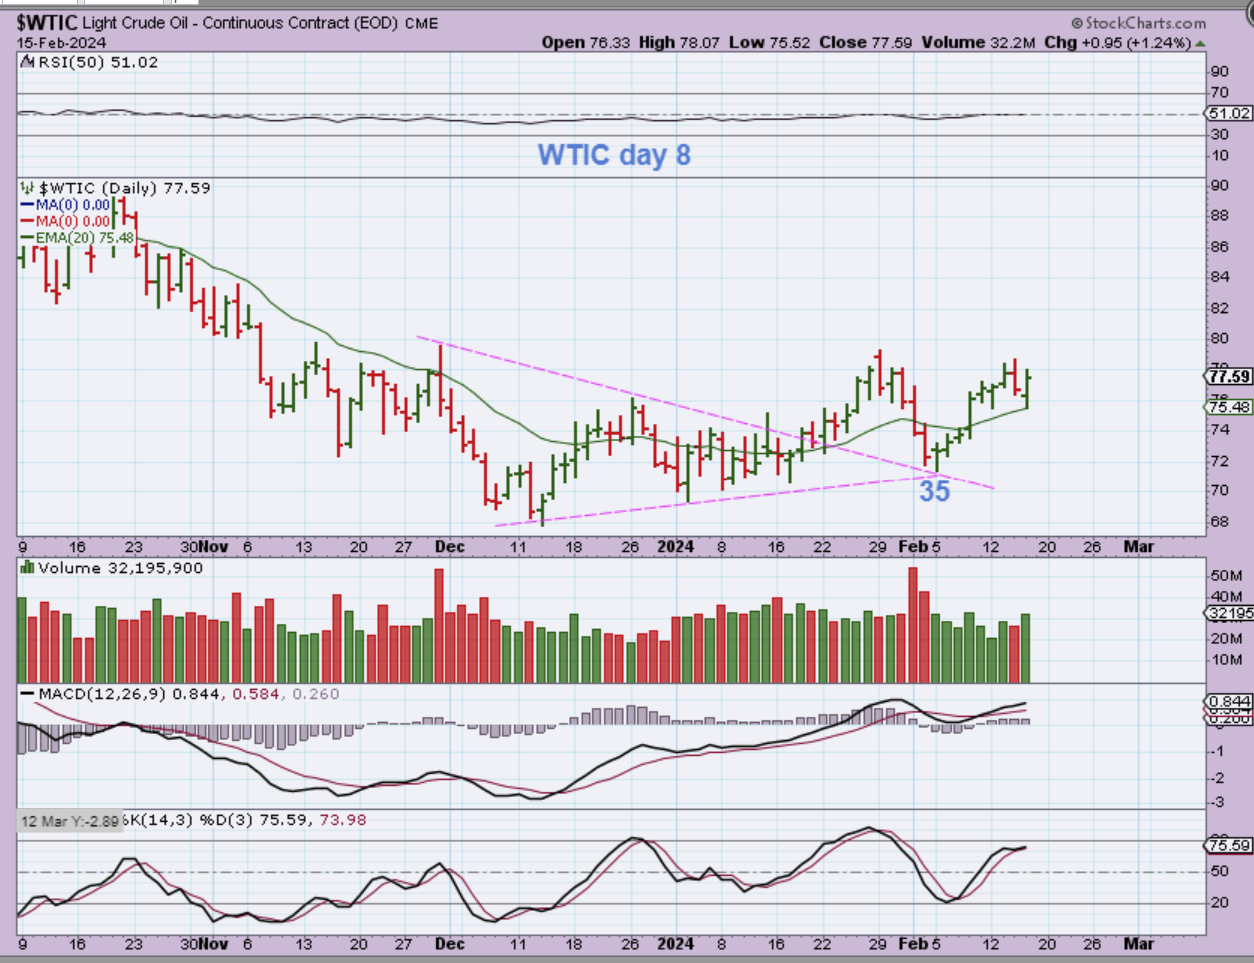
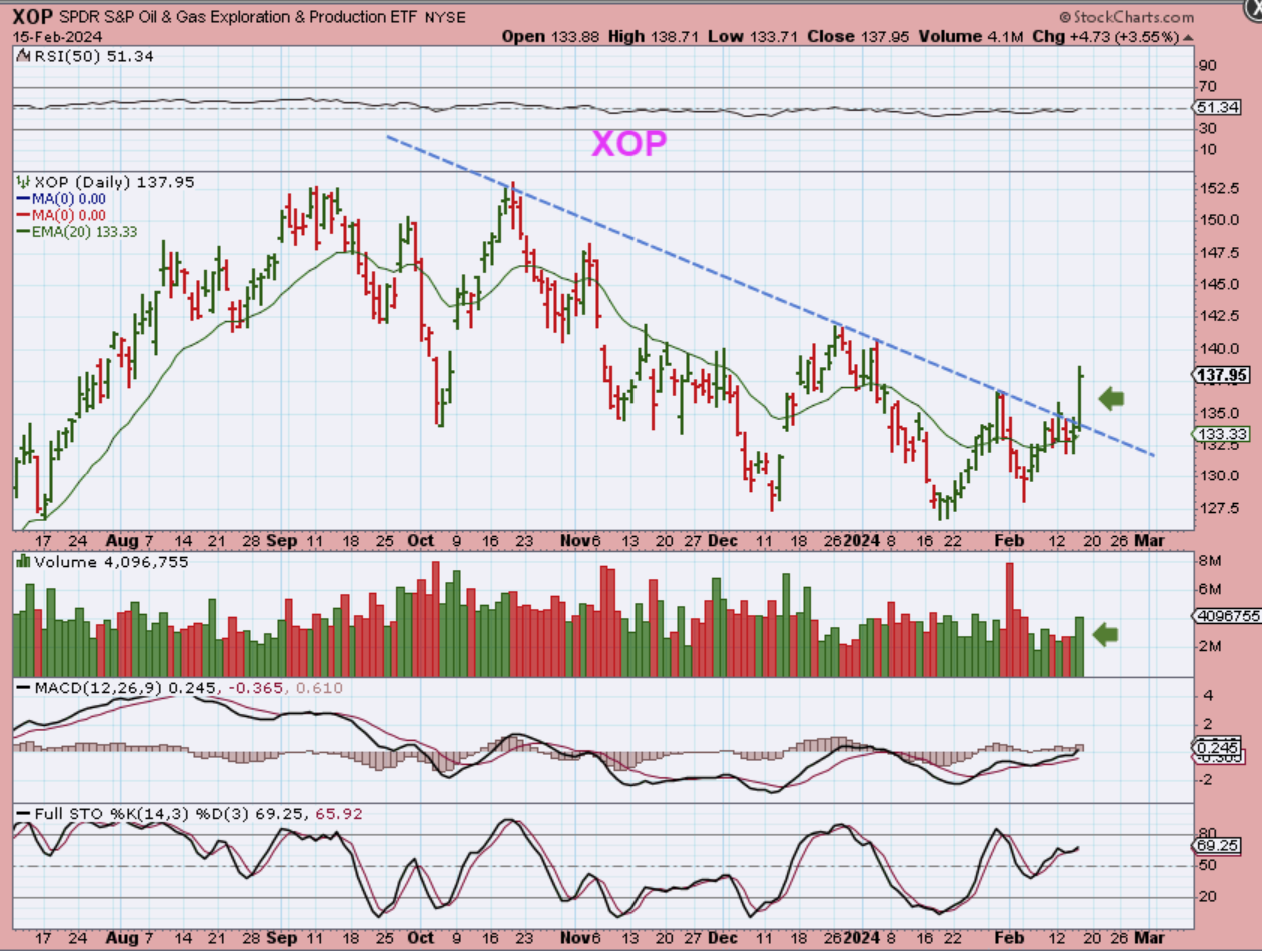
THE XOP (or Gush & Oil Stocks) broke out from that downtrend. This does look like it wants to run higher, so let’s look at a few of the Oil Stocks…
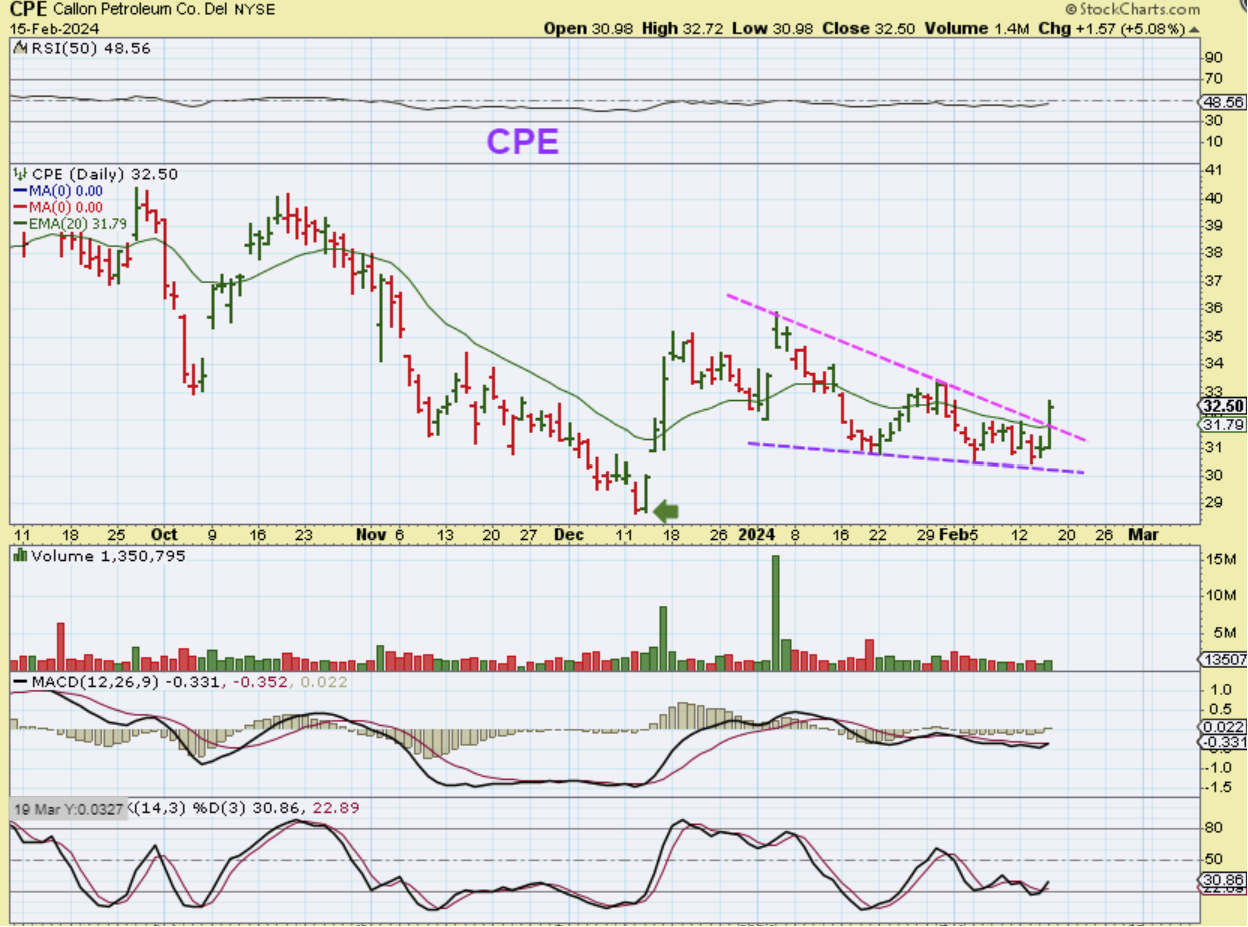
CPE gapped open in December at Oils ICL, but Oil didn’t run higher and CPE back filled and filled that gap. Now it just broke from a downtrend that formed a bullish wedge. This is a buy.
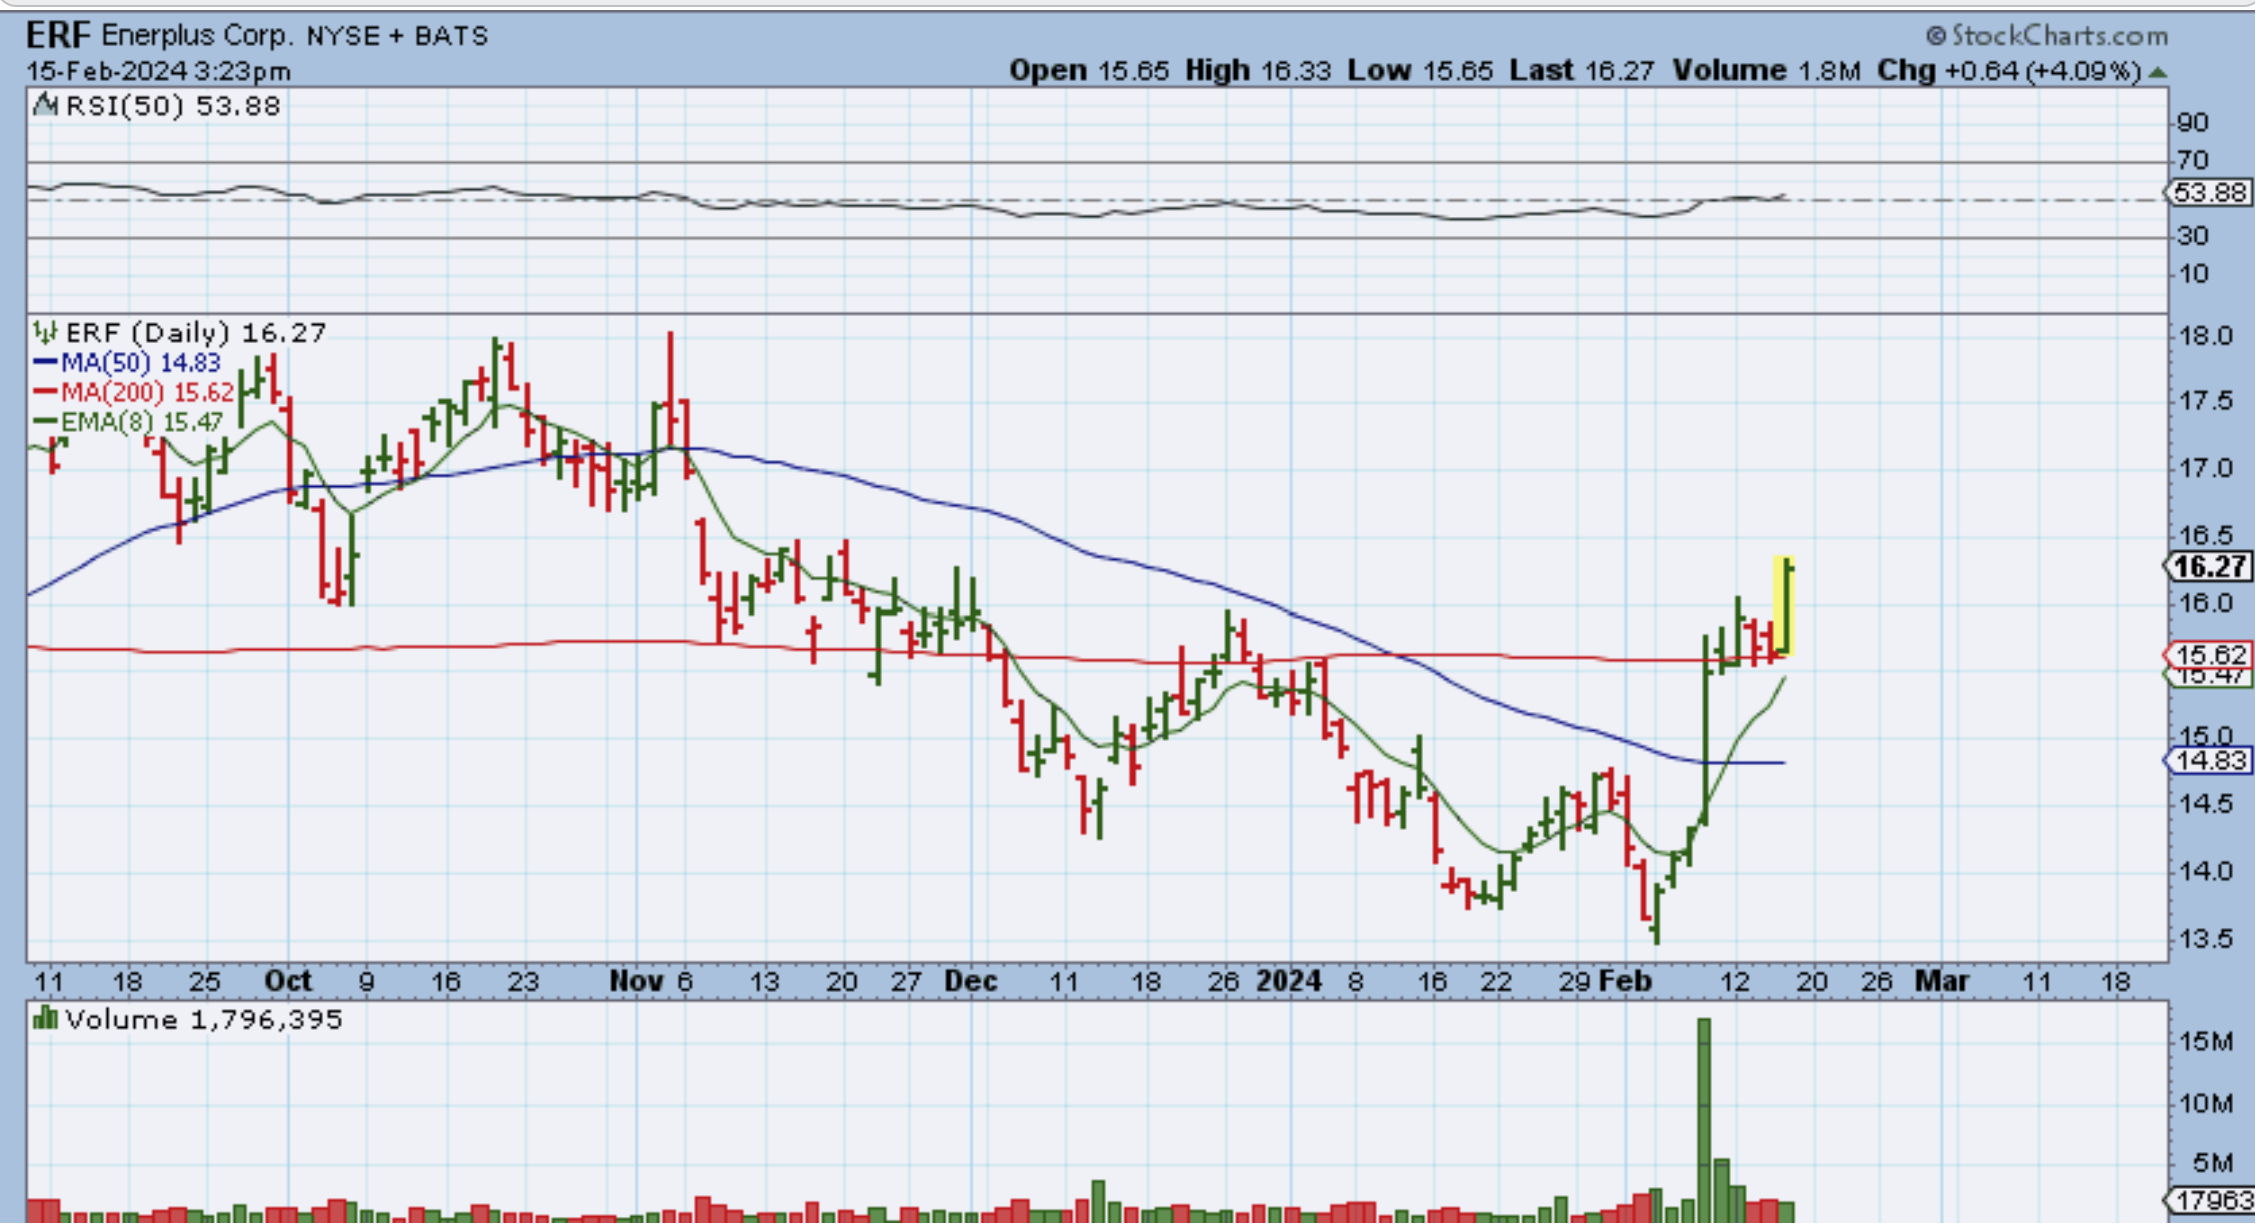
ERF made a bull flag at the 200sma, and popped yesterday.
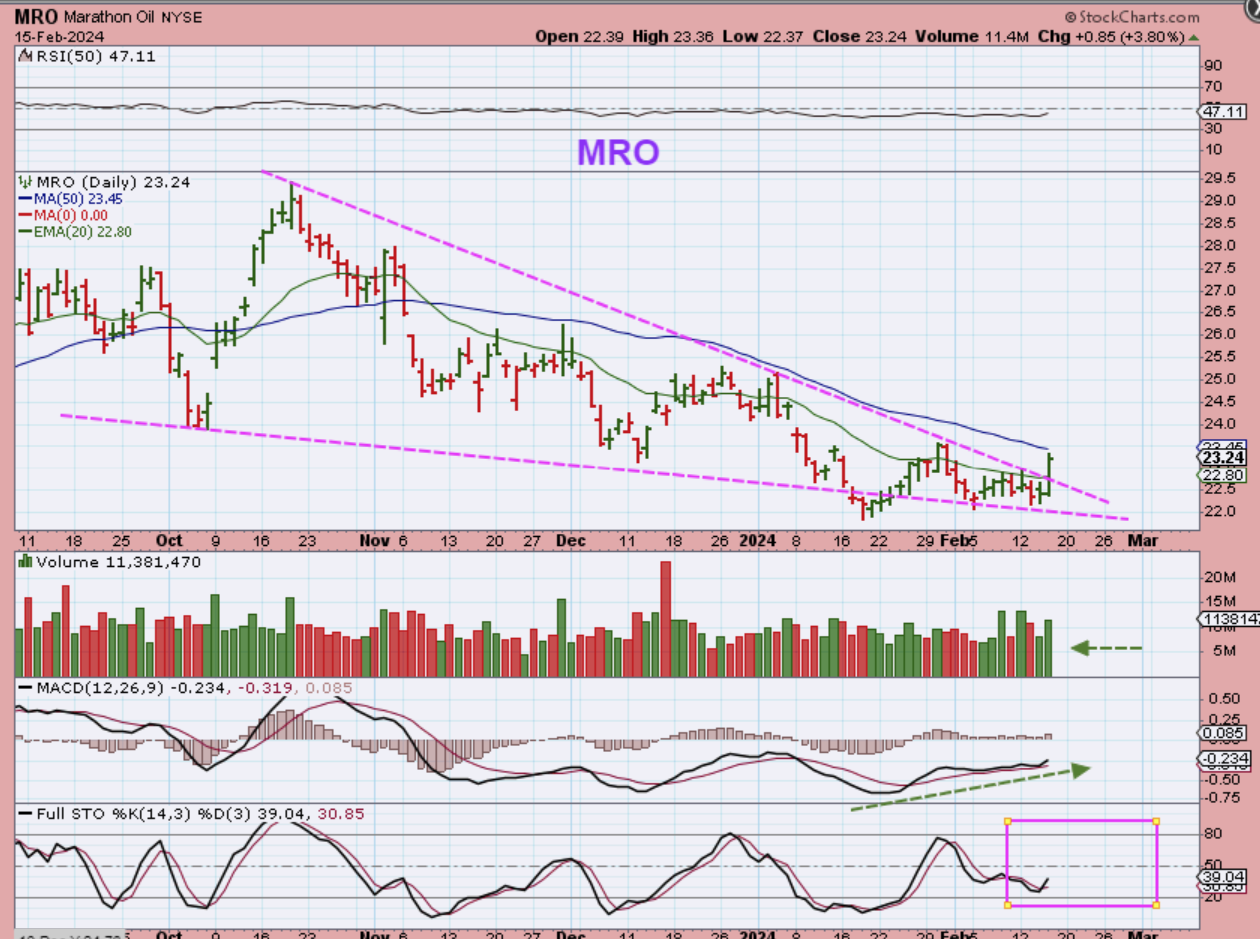
MRO also looks to have formed a wedge and it is breaking out. See also CPE, NOG, BTE, GTE, PUMP, AMPY, VET, WTI and other ones that have been on our watch list. They all look like good set ups.
.
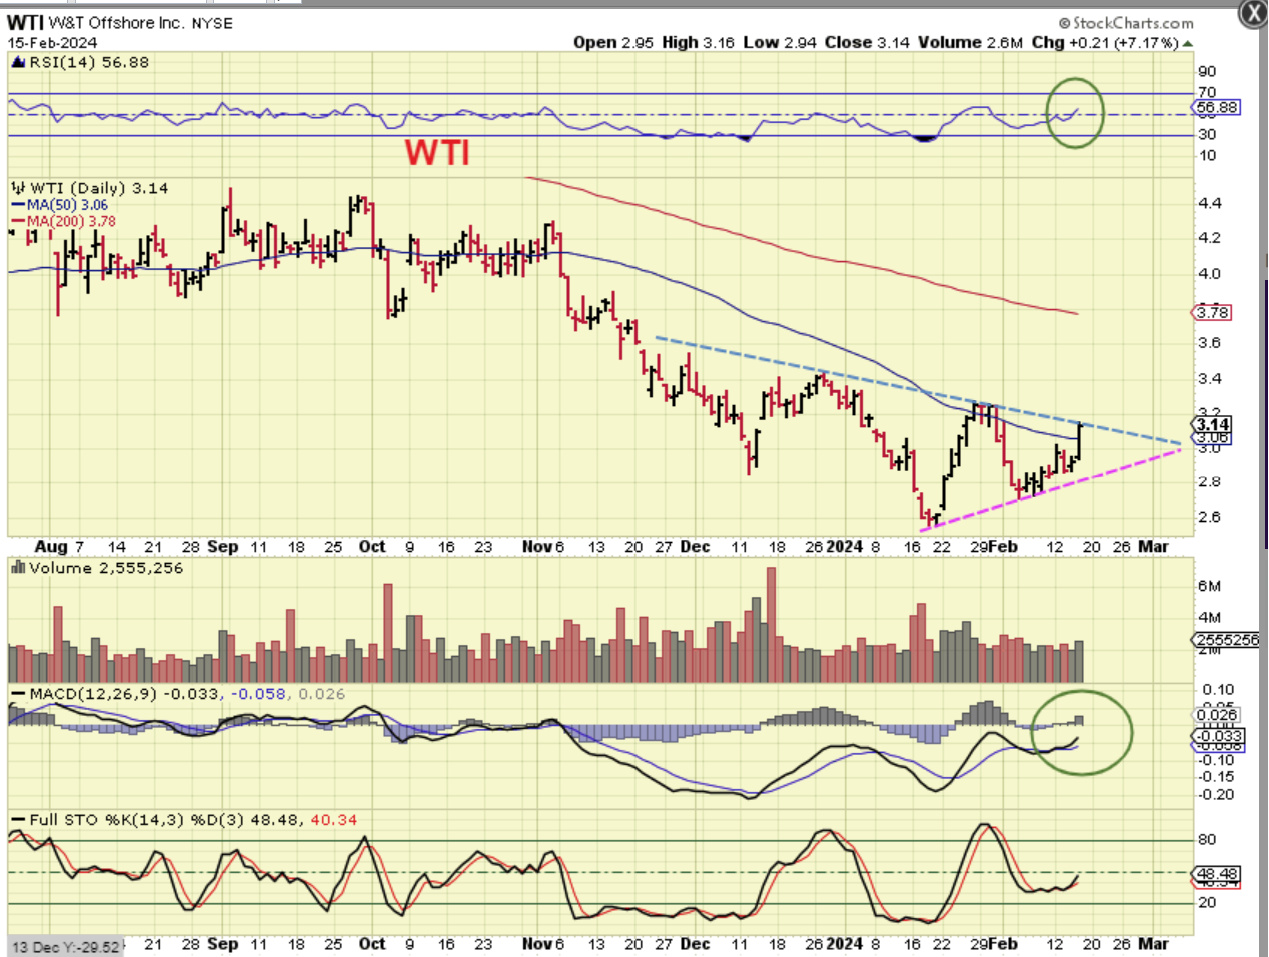
WTI is also bullishly aligned and looks ready to run higher.
.
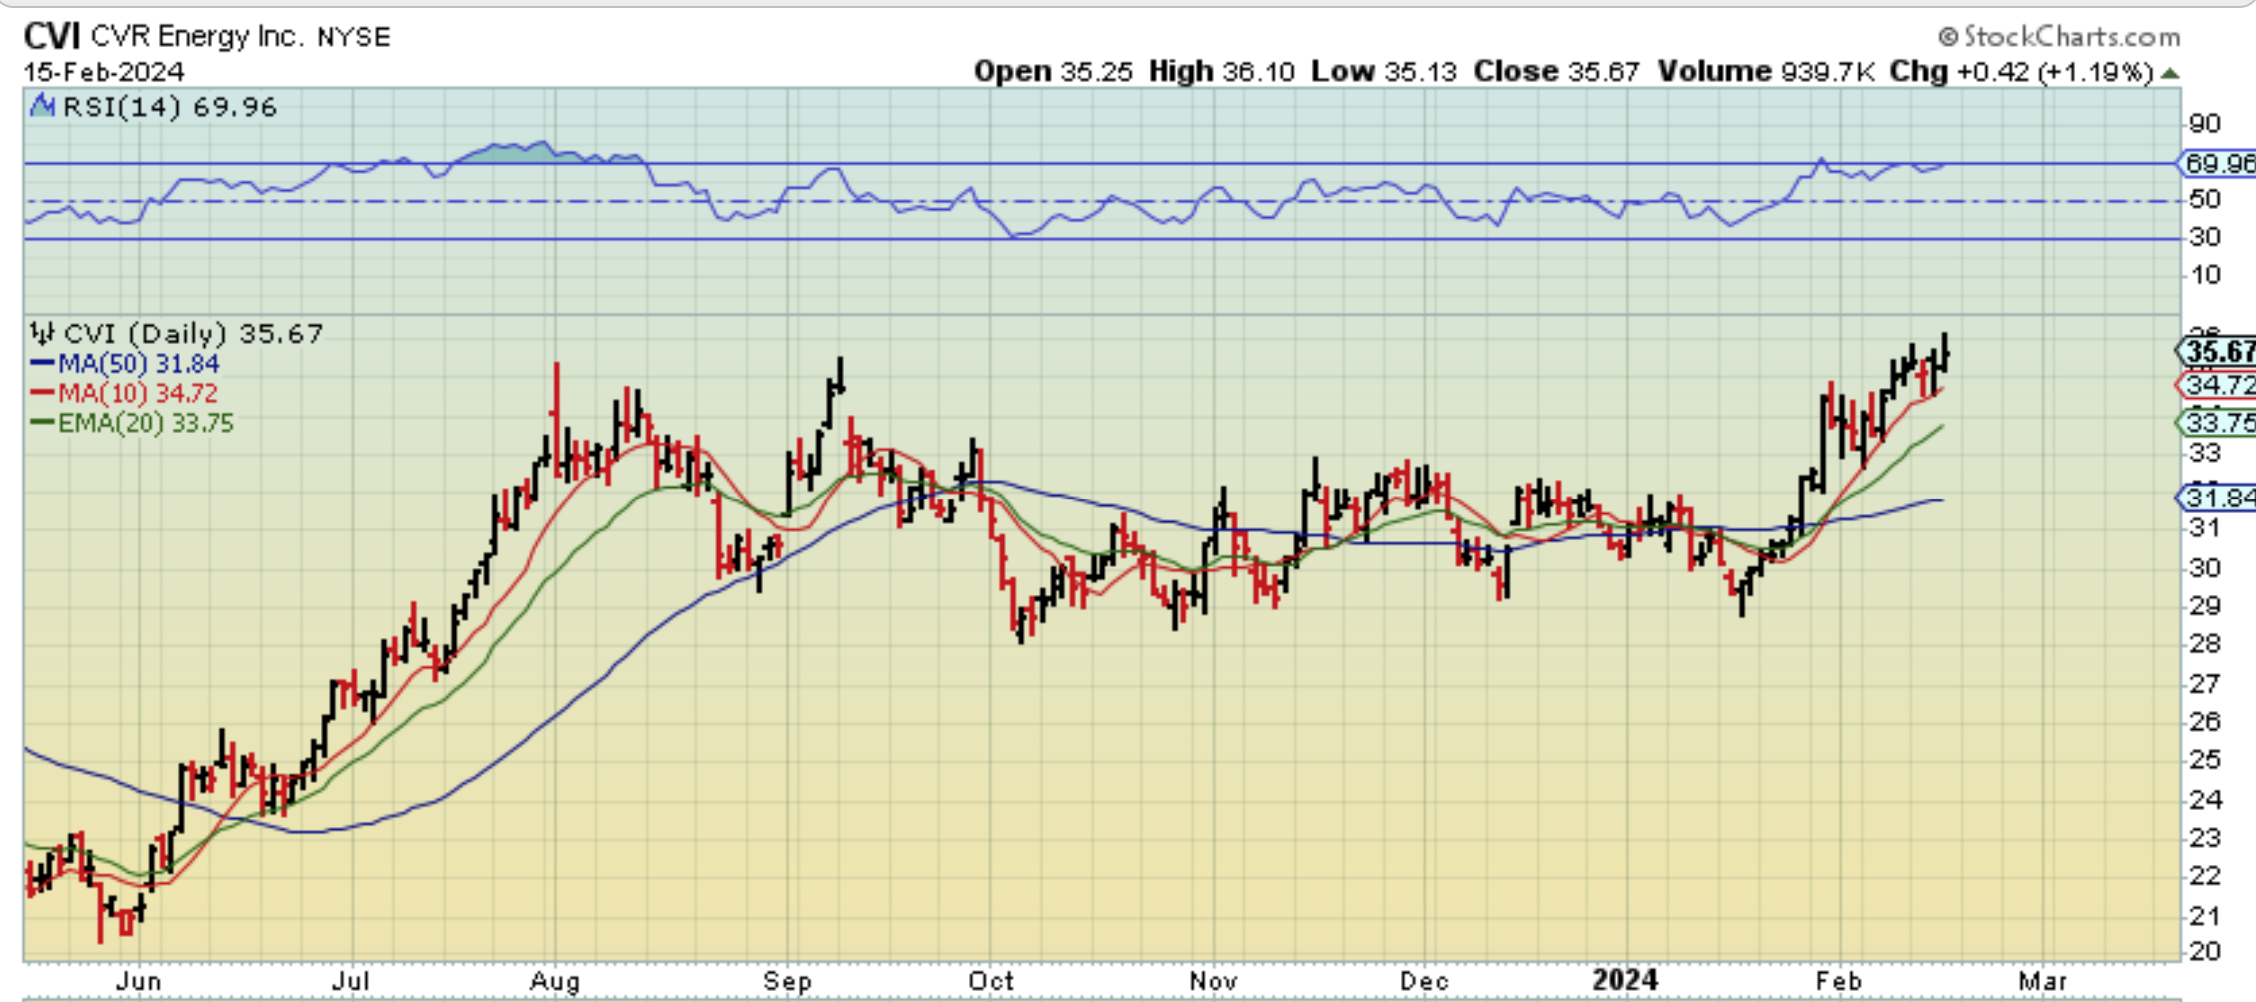
CVI is a very bullish break out on a 1 yr chart, but they have earnings on Tuesday. I would buy this if they didn’t have earnings ahead, because they are obviously leading the way. That might be because they are Petroleum and Nitrogen Fertilizer. Keep THAT one on your list…
.
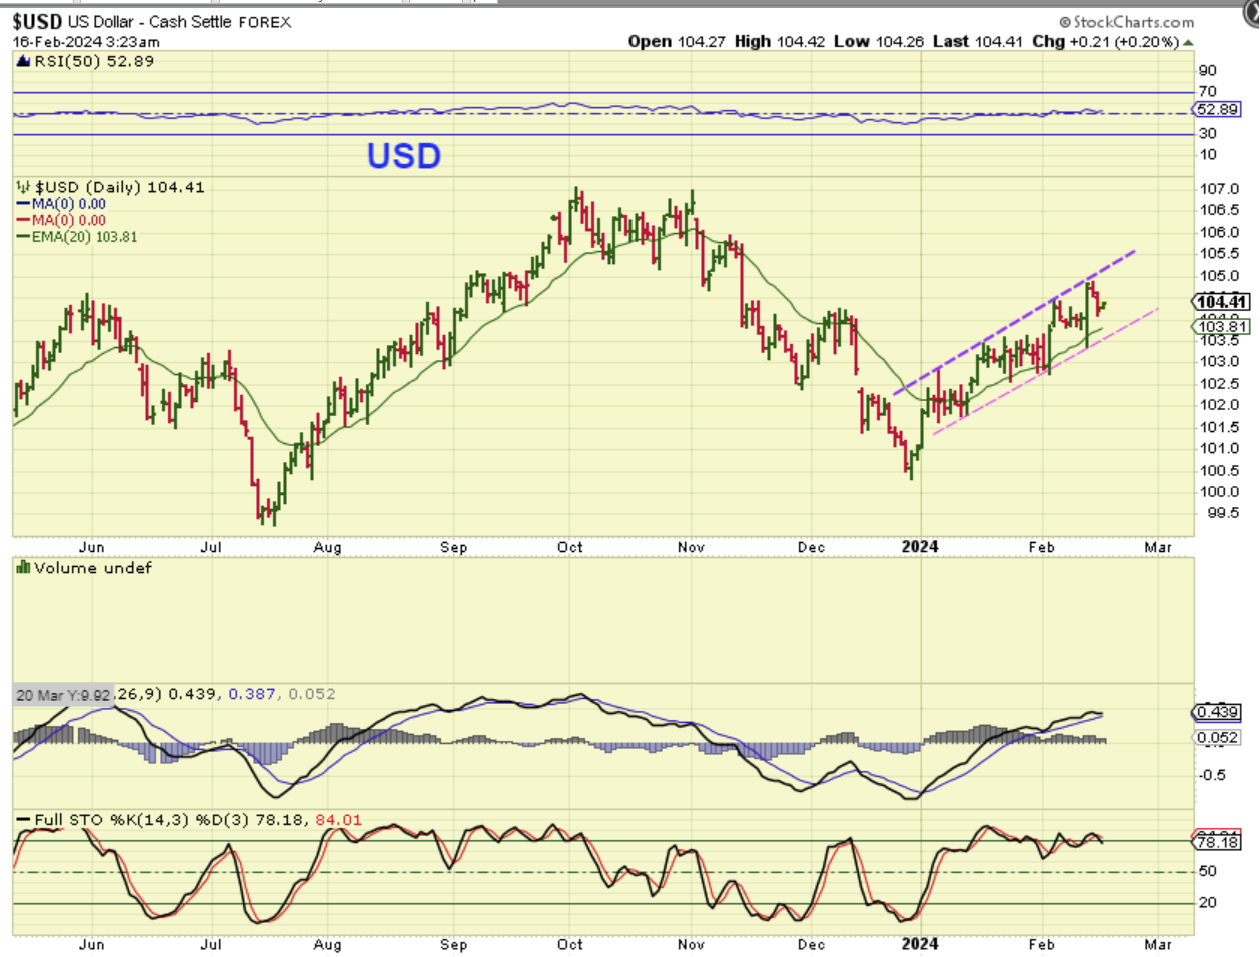
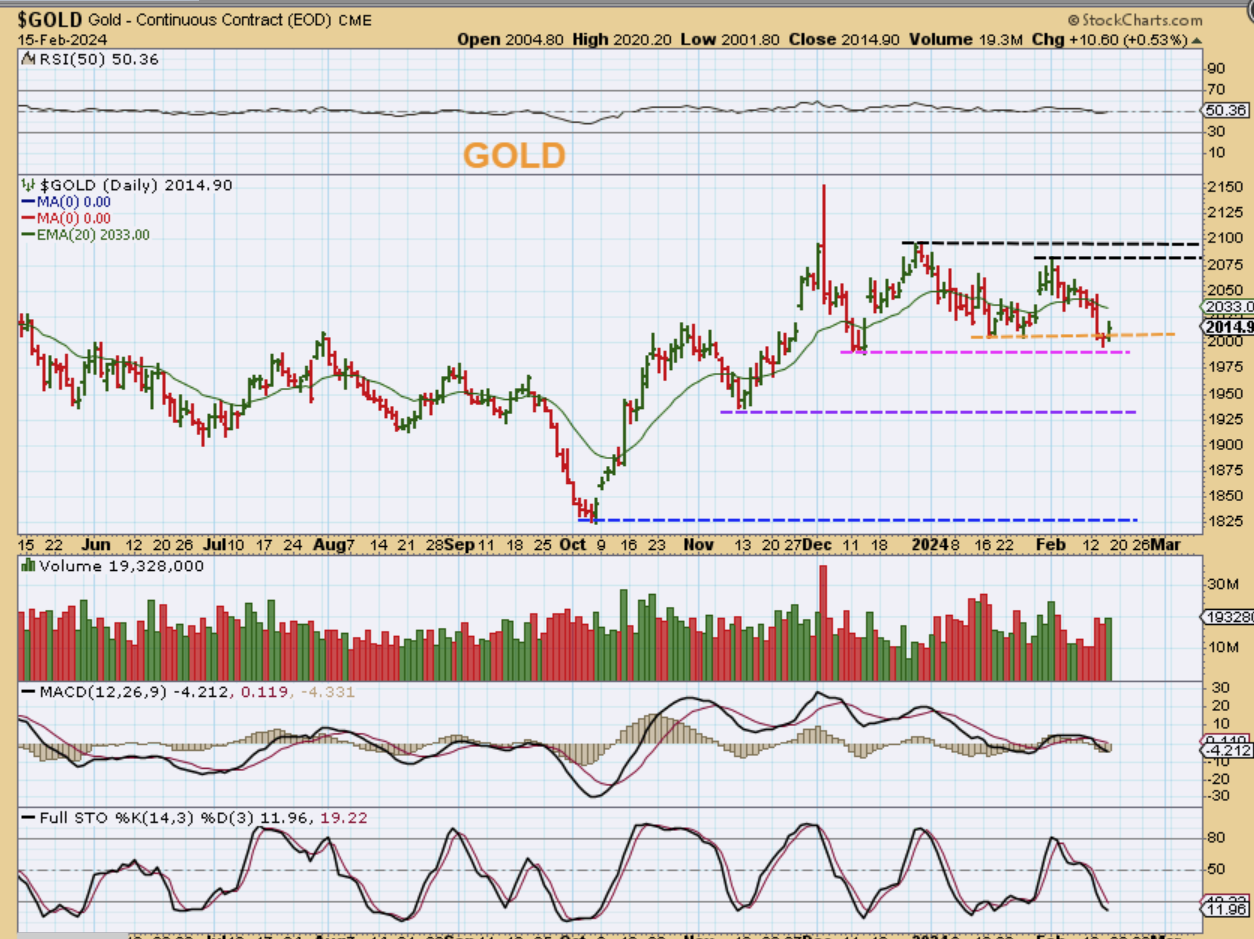
The USD dropped and Gold popped.
GOLD – That was a day 20 low, and the past dcls were in at around day 25, so I do think that it is too early for a dcl. IF this turns into a dcl, I think that this would indicate that we will have 5 daily cycles, because that doesn’t look like an ICL drop. Gold has actually been acting quite strong.
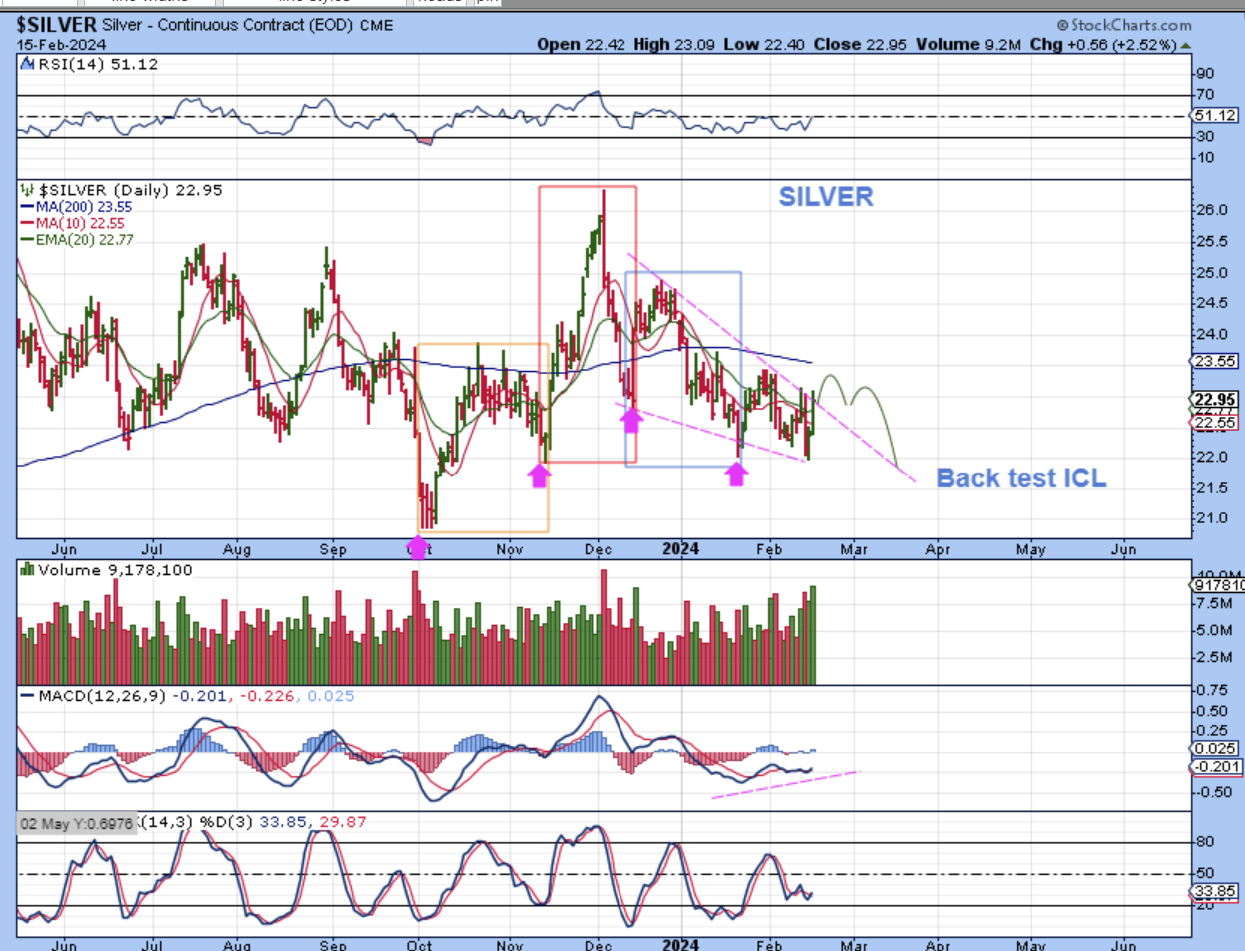
SILVER – When I saw Silver yesterday, it looked to me like it turned from weak and bearish to possibly Bullish. Why? Not only did it start to break that downtrend line, but the volume surged for 2 days and the MACD is bullishly showing divergence. What do I think of that, since it looks like Bullish action after a sell off? Well, Silver looks to be on day 18, so…
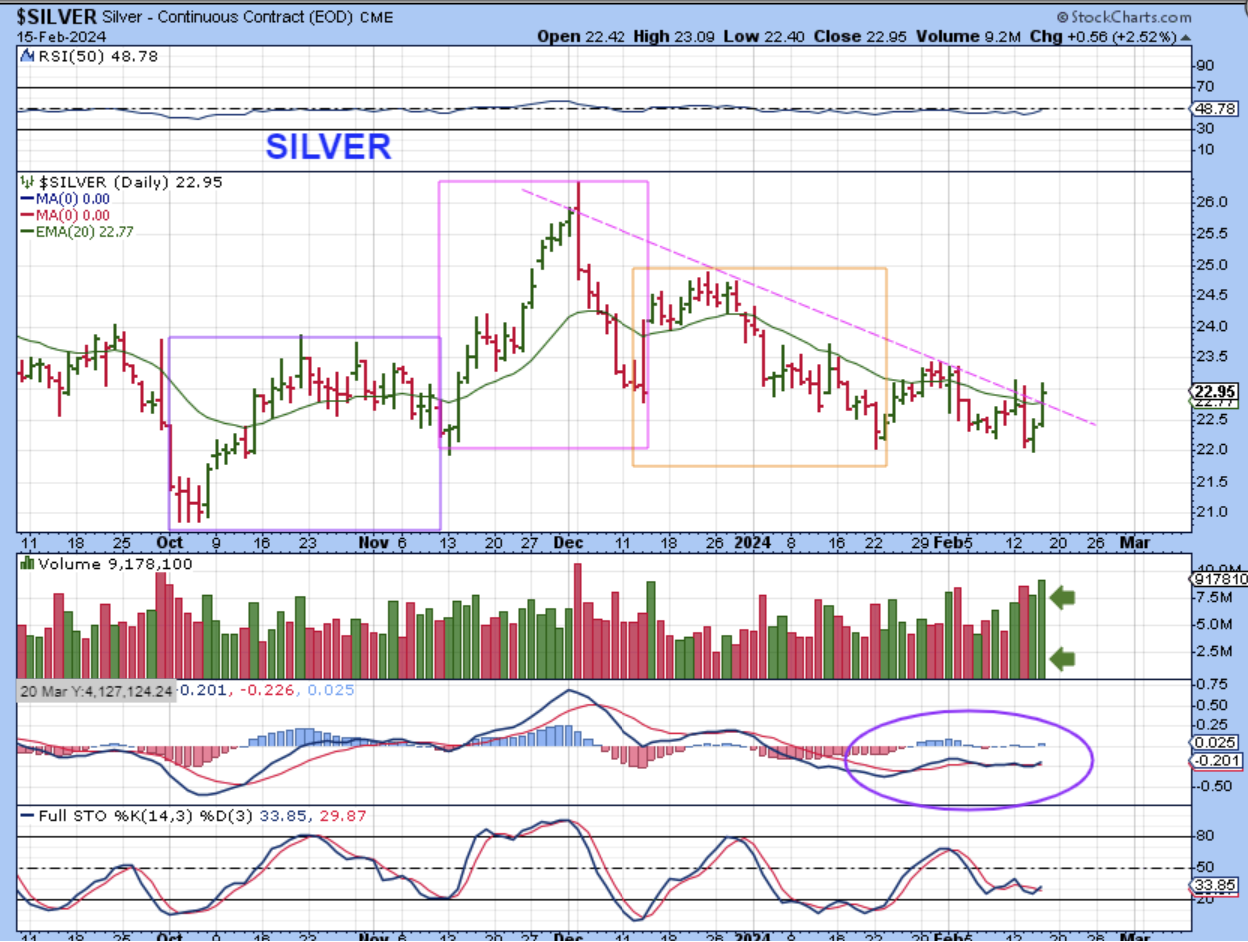
SILVER may just run to the 200sma and then roll over to back test that trendline break (that is very common), and that would be our ICL. I drew that idea here for a visual, but since Silver seems to be on day 18 (& Gold on day 21) don’t look at where price landed time-wise as a prediction. This could bottom in 10-15 days and that would be early March. We’ll see how it looks then, it may be an ICL.
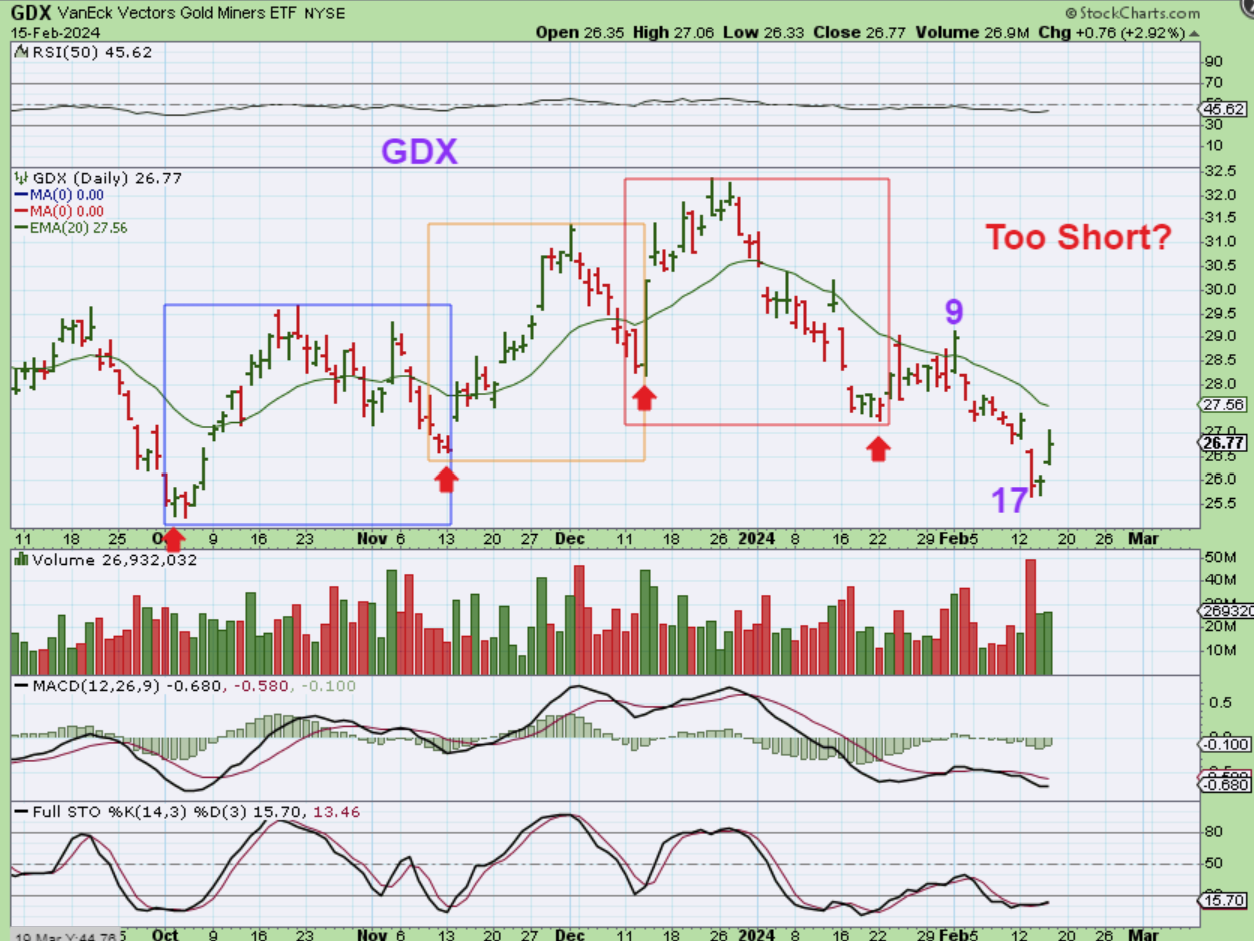
GDX also looks to be improving, but it is on day 17 at the lows, so I would say that it is on day 20 today. Again, that DOES look like capitulation lows, so it is a bit confusing when you look for the normal visual signs, but this really should have at least 1 more drop to a new low. I do have some additional good news for the sector …
.
I do have some additional good news for the sector …
.
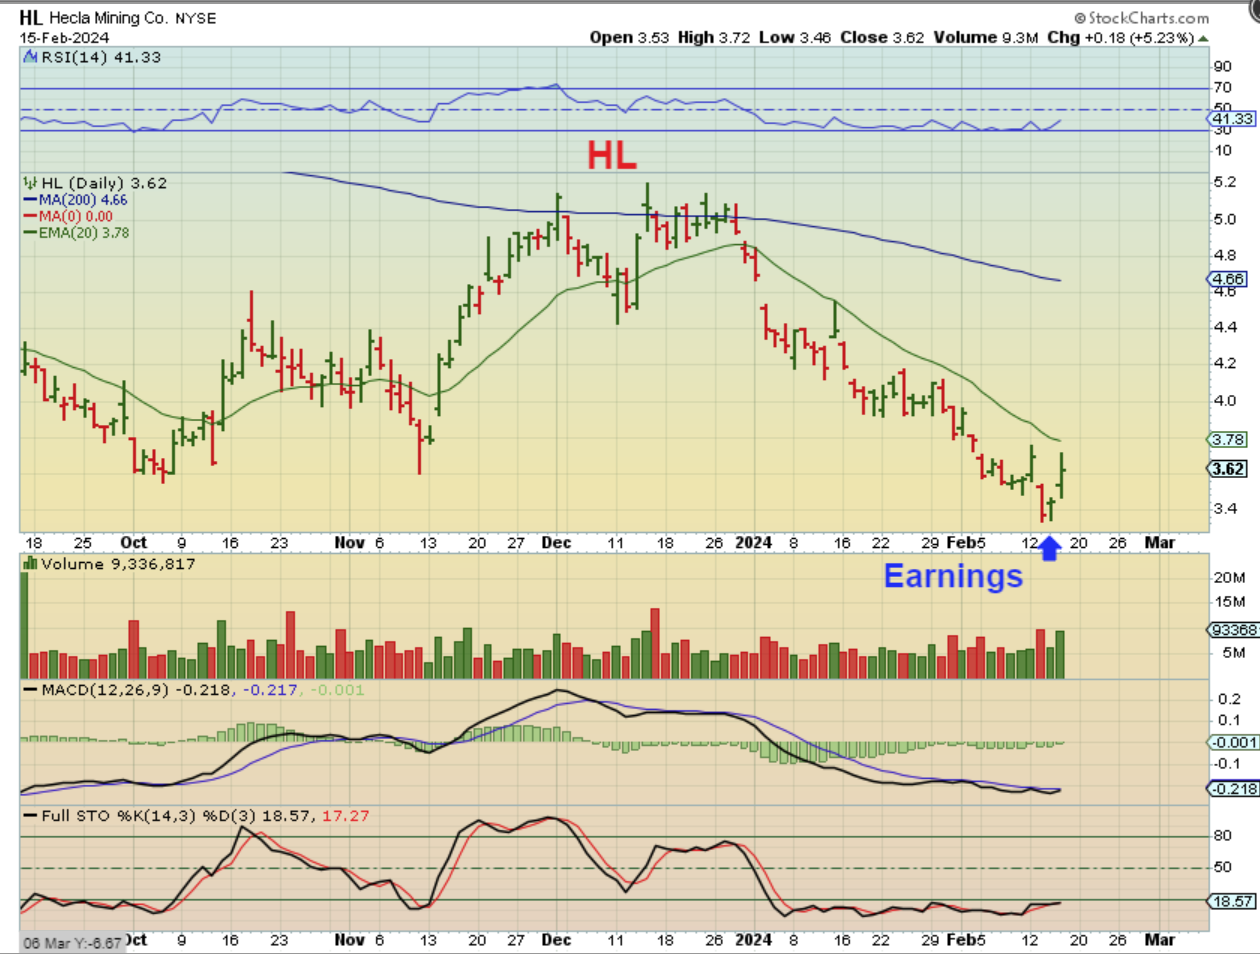
HL released their earnings after the bell on Feb 14th, and on the 15th it moved up 6 %. That is a good sign that this one is a buy when the ICL is in place (Or maybe a small start now, if you can withstand a little volatility).
.
Today is Friday and the charts look good in the General Markets, Oil, and Crypto. Gold, Silver, and the Miners actually look ‘good’ when you think about it. They are in the 4th daily cycle and should be pathetically weak, but I don’t see that. I see normal price action in a 4th daily cycle that is acting bullishly. We’ll just have to see how the data affects all of these Market sectors, starting in pre-market at 8:30 a.m. ET.
.
Enjoy your Friday trading and your weekend!
.
~ALEX
.
BITCOIN – All I wanted to point out here is that Bitcoin has dips that I look for at roughly day 30 & 60. They have been pretty reliable, even though they can be very mild. Please take a look at the day 30 & 60 dips in the daily cycle squares, back when we were coming out of the lows. They were maybe 4-5 day mild pull backs. Will we see that soon? I am preparing us to be ready for that, in case it does happen, because…
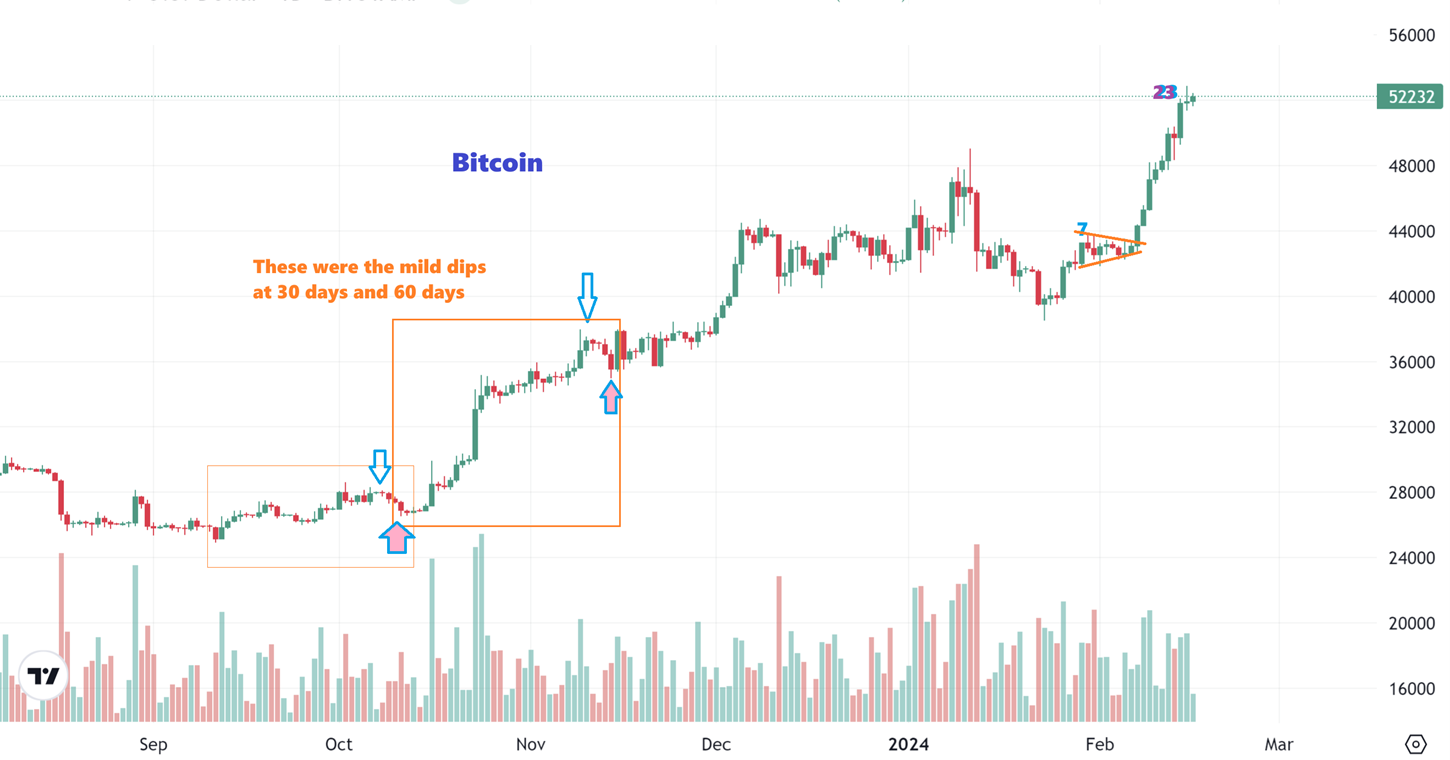
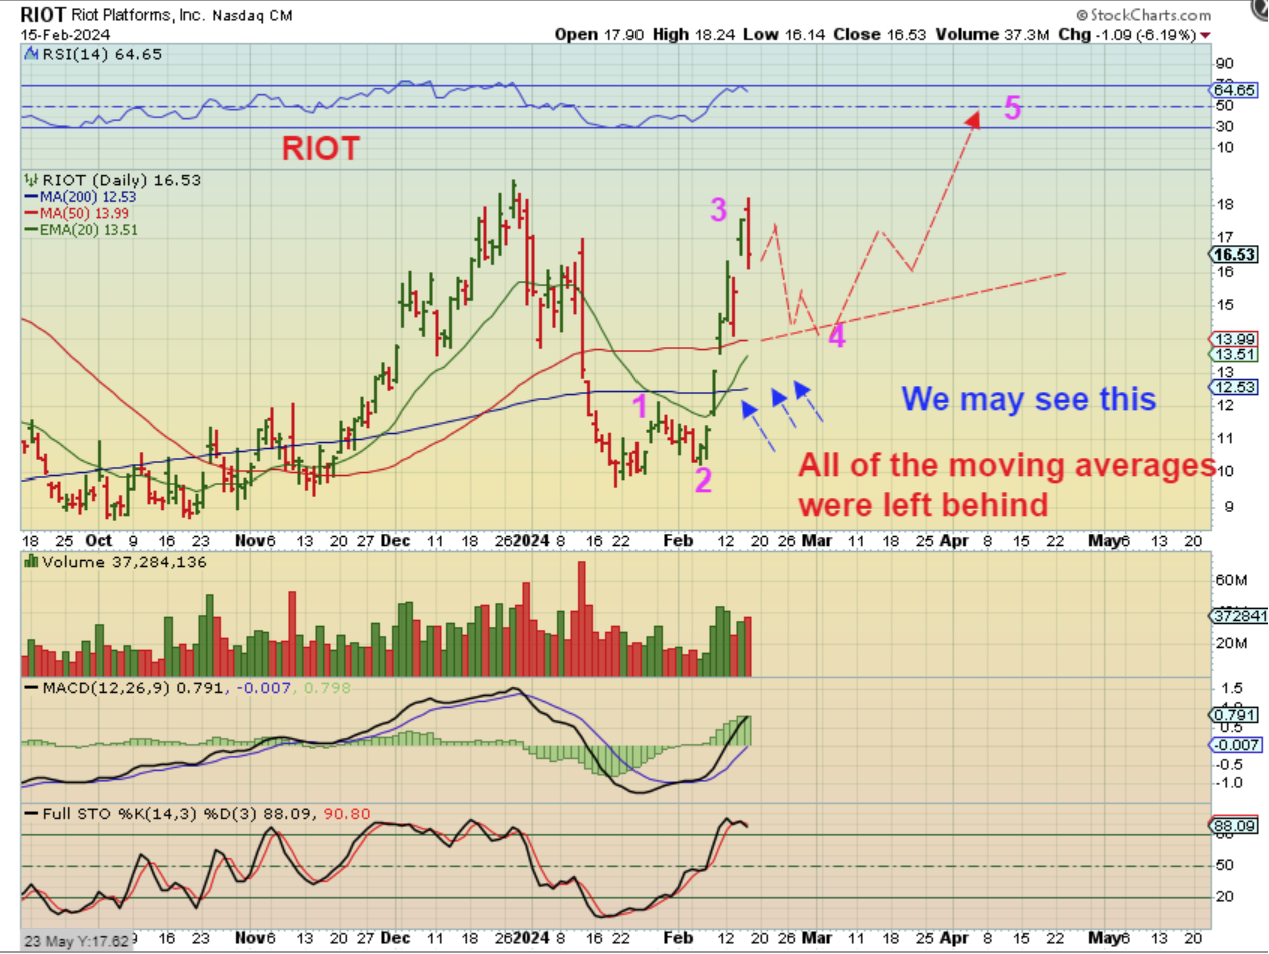
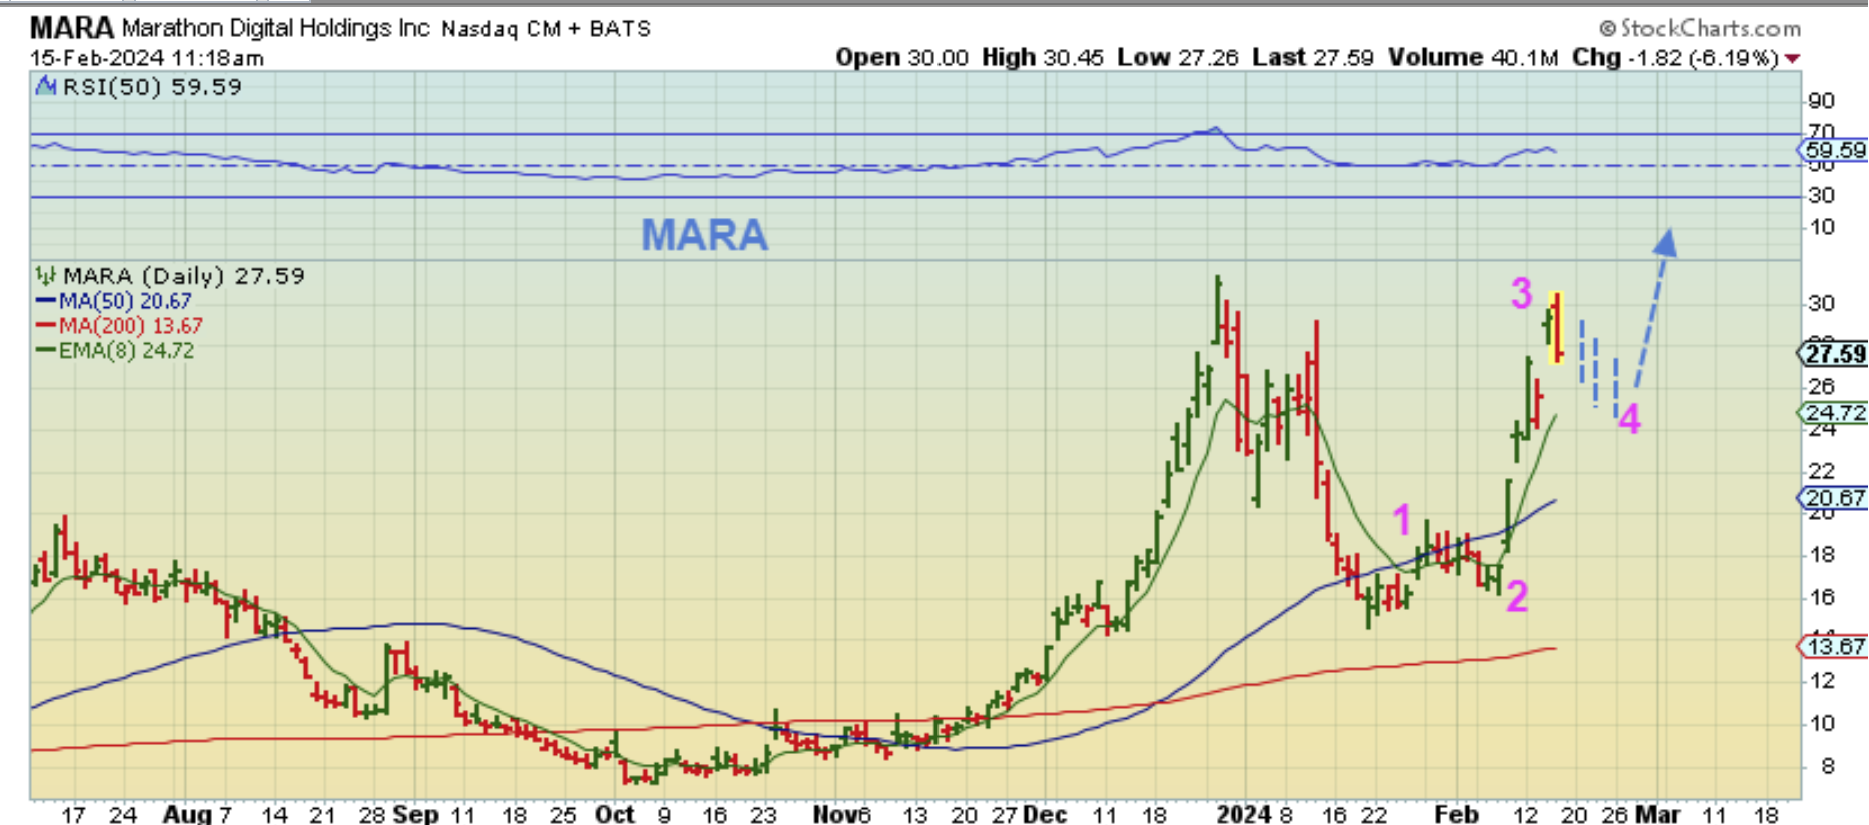
Even though the dips are mild with Bitcoin, the Crypto Stocks tend to sell off deeper. I used those area to buy Crypto stocks, because oddly enough, the Miners can dip 15 to 20% or more with even a mild dip like that. So here we are now on day 24 today with a mild reversal candle yesterday, yet the Crypto Miners gapped up and sold off hard yesterday. If we dip into a dcl near day 30, it may start around day 26 or 27 and crypto stocks may dip down for those hoping to buy. THEN we get the next 30 day push higher and you can ride some stocks like RIOT, MARA,WULF, BITF, BTBT, etc . I will have it in the reports, that timing would be next week.
.
.
MARA FEB 8th –
DO YOU REMEMBER? I said when this run started that I think we could see a run like this. An a-b-c down, followed by a 5 wave rally. I said that this would form a very bullish inverse H&S. Well…
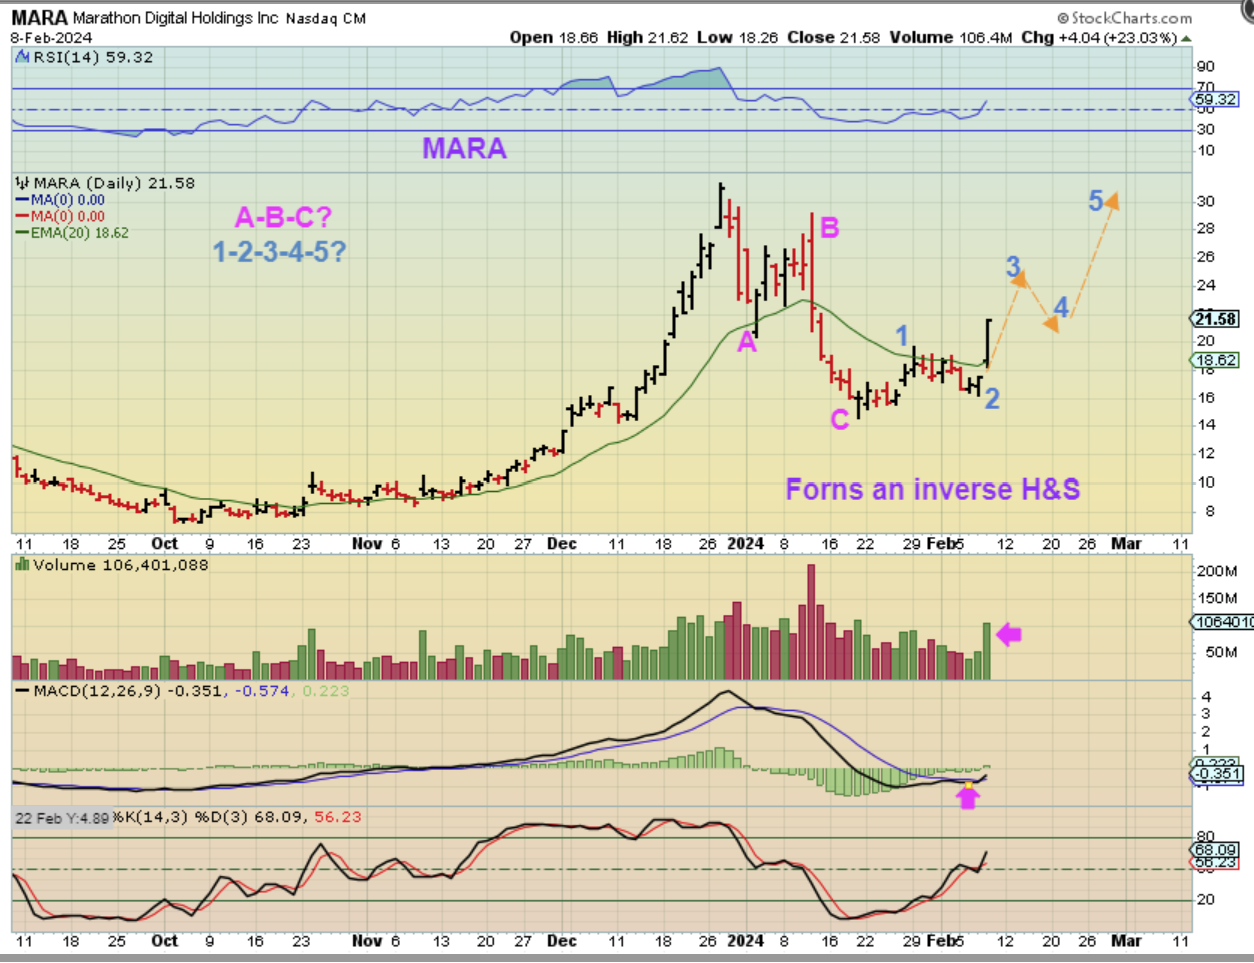
MARA – If we get a 1/2 cycle dip in Bitcoin, that is when we could get a pull back to the moving averages, and THAT would be a clear buy, forming that inverse H&S pattern that I spoke of.
.
.
RIOT – We MIGHT, MAYBE, POSSIBLY….could see something like this with a bitcoin half cycle dip. We just have to wait and see, but this is the next possible lower risk entry, if it happens.