Thursday Jobless Claims and More ‘Picks’
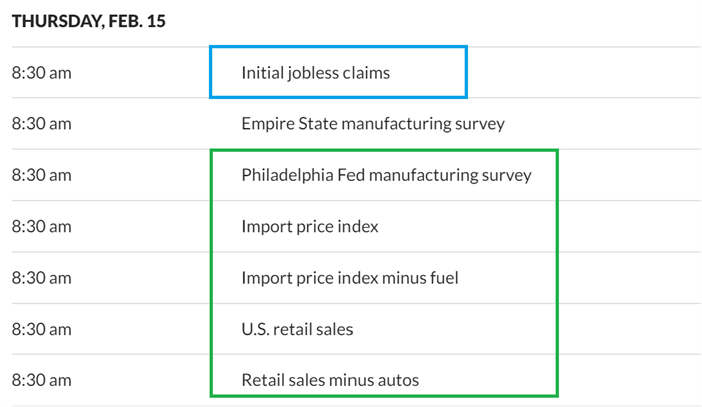
DATA – Todays data is the Jobless Claims, and lately that has been good to the markets, so it may help the recovery bounce after the CPI Plunge. We’ll see, because the later we get into the daily cycle, the ‘heavier’ the markets can get.
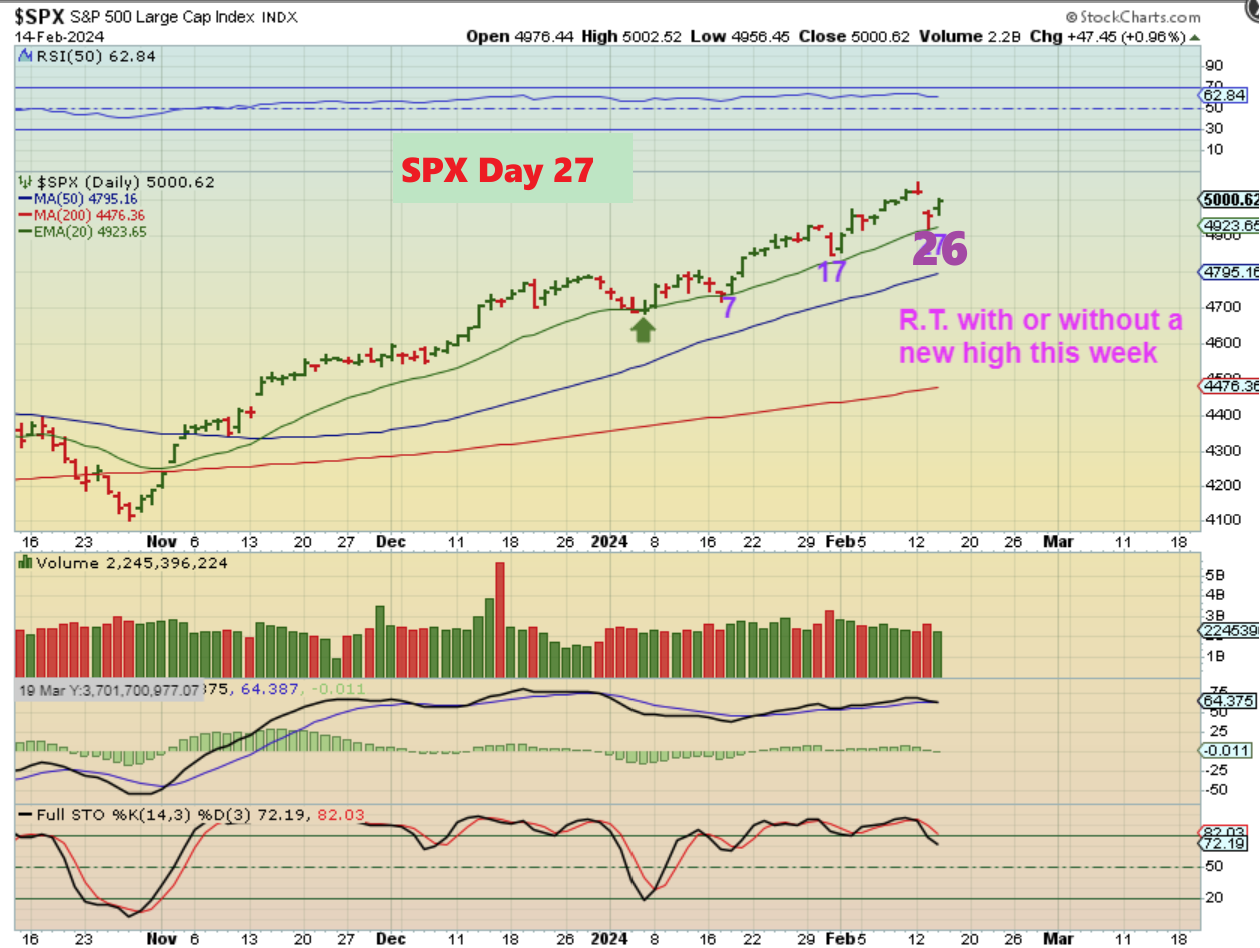
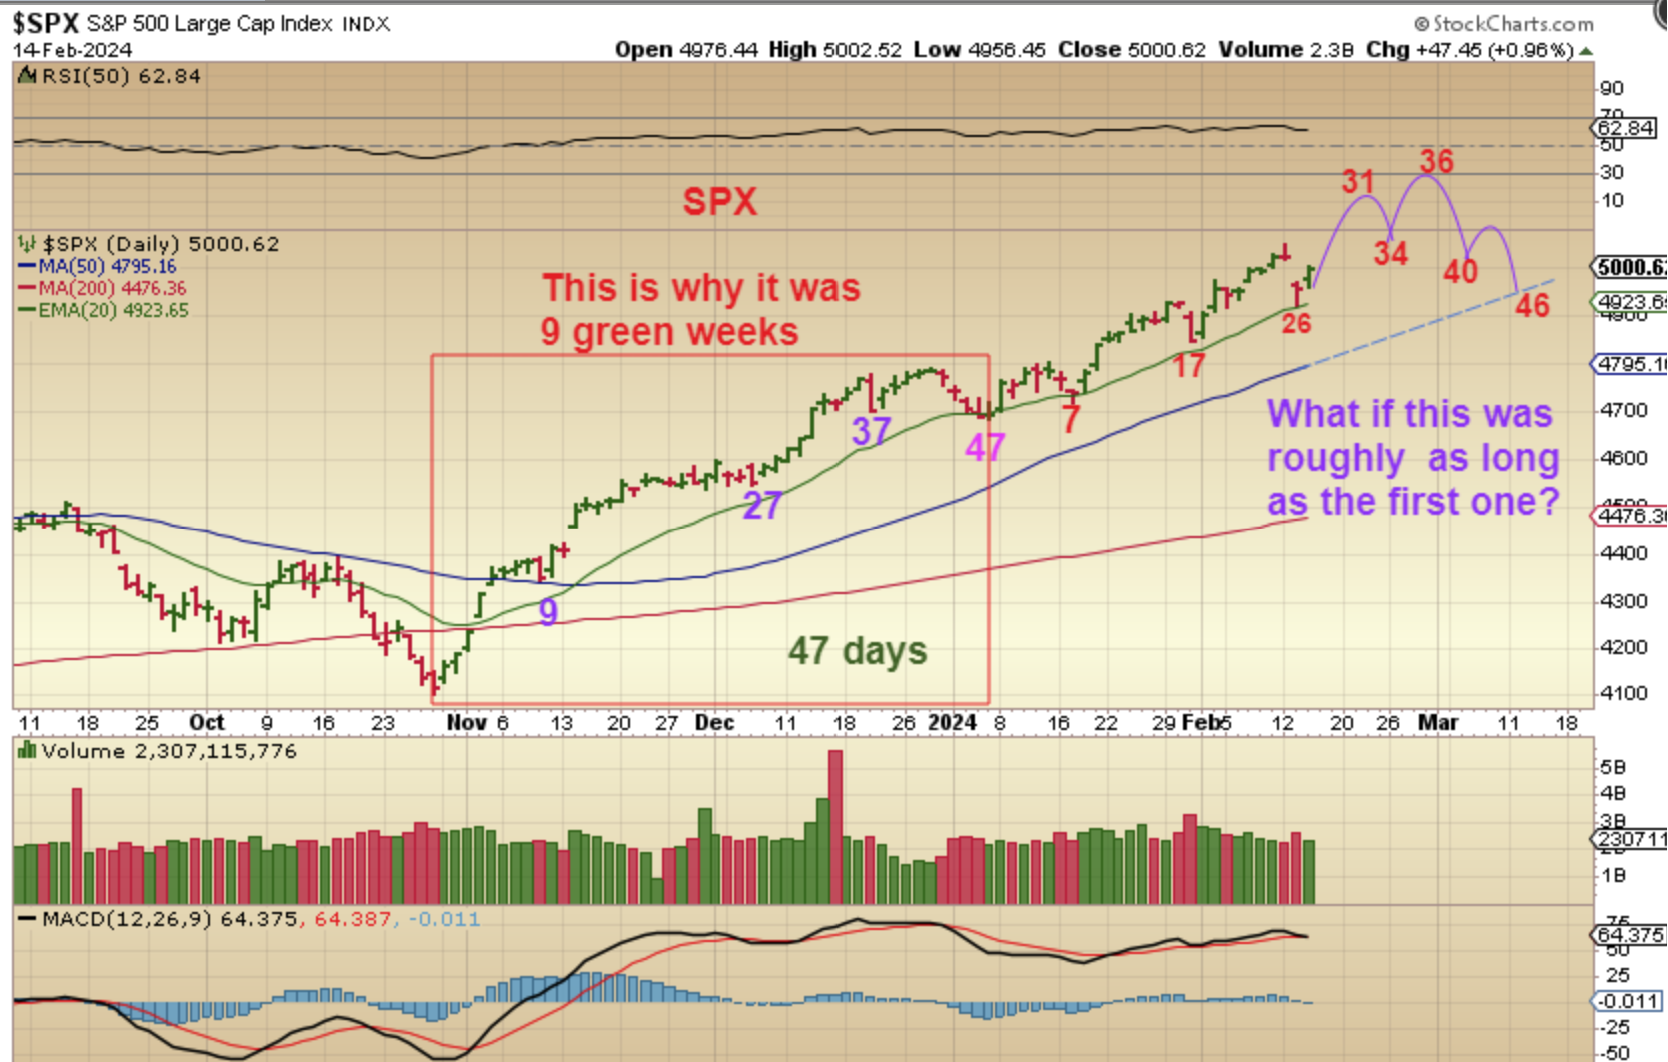
THE SPX is still climbing along the 20 ema and this is one of the ideas that I mentioned as a possibility this week. I thought that we might rally out the rest of the week, make a new high on day 30 or so, and then MAYBE pull back to a dcl next week. This should be right translated, so the 3rd daily cycle will also be a buy at the dcl. I want to mention something that dawned on me though…
.
I want to mention something that dawned on me though, when I was putting this report together. Daily cycles used to run roughly 38-40 days in length, but lately we have seen them stretch to almost 50 days at time. SO…
.
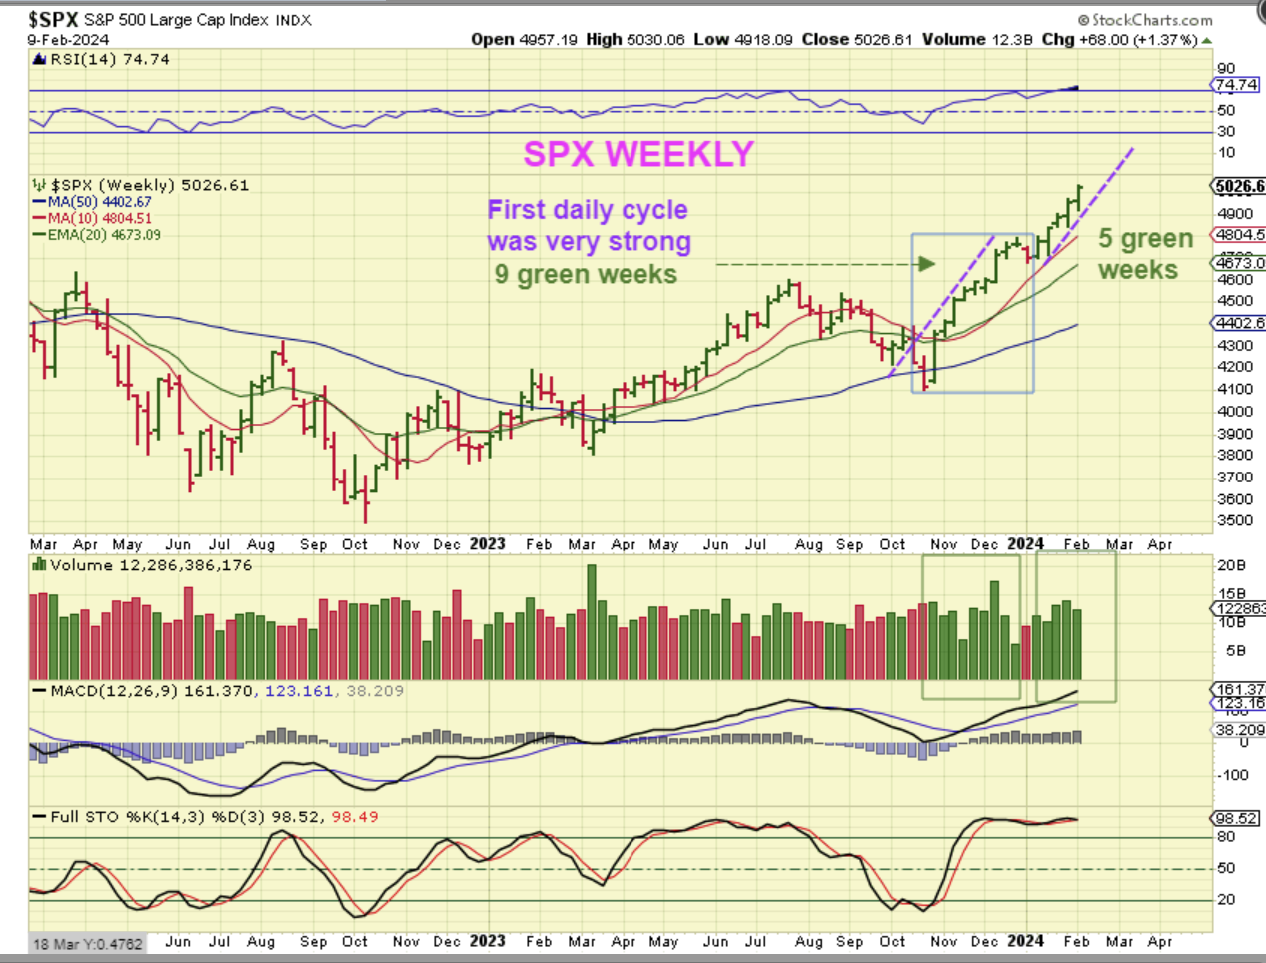
1. When I showed the weekly chart in the weekend report, we had 9 straight weeks up and a 1 week dip for the first daily cycle.
2. Now we are on week 6 of the 2nd one. Doesn’t that mean that if the markets can stay bullish, and we had 9 green weeks in the first daily cycle, couldn’t we have 7 or even 8 Green now?
3. I do think that it is possible, and I can’t rule it out, so while I am cautious going forward (especially after that CPI Plunge), we might rally next week too.
.
THE SPX now using the daily chart, we see that we had 47 days in the first daily cycle, that is why we had 9 green weeks. We are only on day 27 now, so we are on week 6. So it is possible that we dropped on CPI and rally to new highs into next week too.
Stay Frosty – Use stops at the 20 ema! 🙂
.
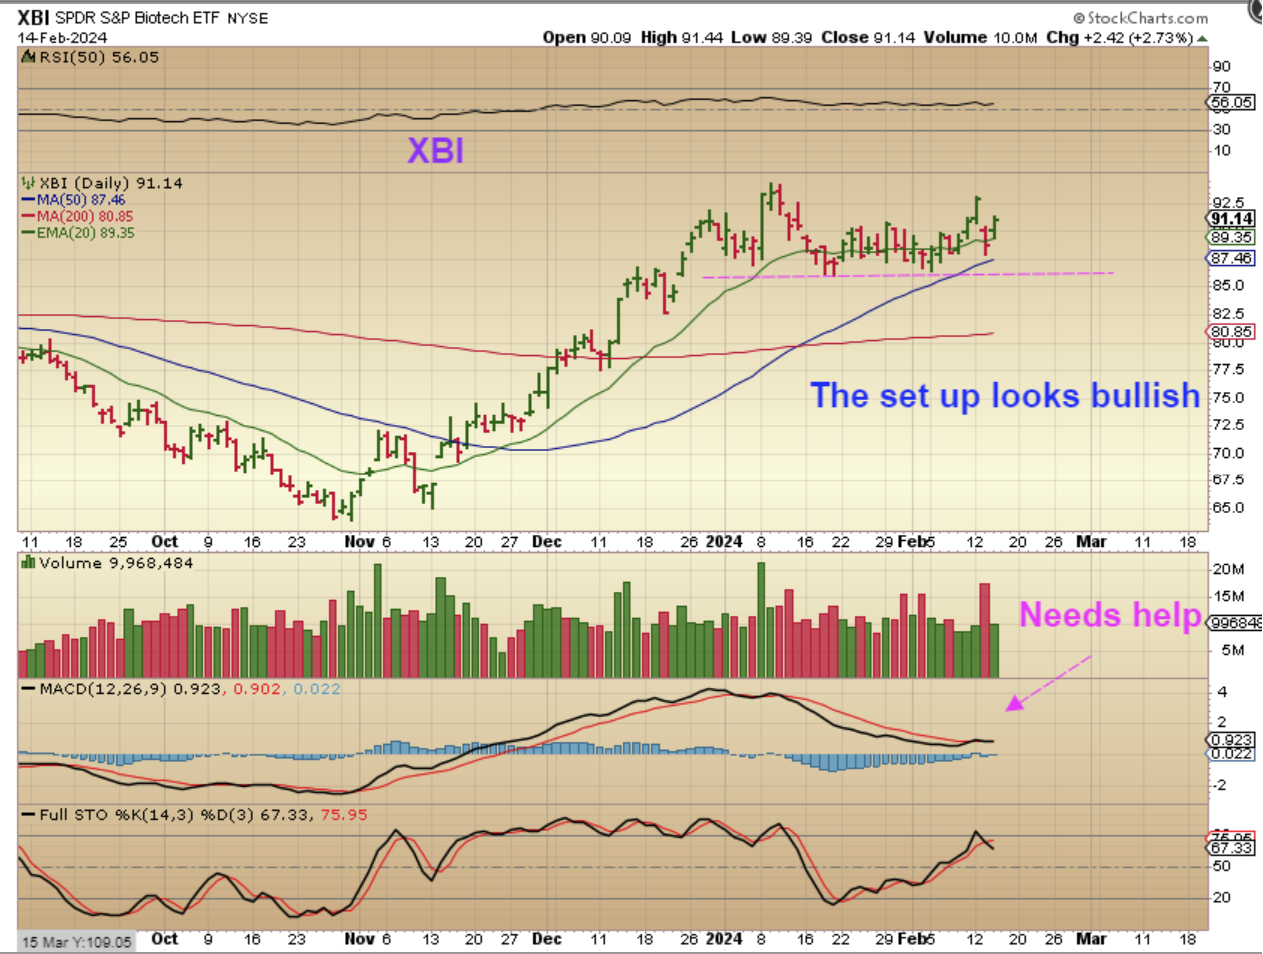
The Biotech Sector or XBI is set up a little differently from the General Markets, and after this long consolidation, MANY Biotech / Pharma / health care stocks are following through bullishly. We discussed companies like TWST, CRSP, XERS, VXRT, INO, NTLA, etc and LABU as a trade.
.
YESTERDAY I SAID:
WTIC – Oil broke above the 200sma, and normally this would build confidence that Oils day 35 low was a dcl, however it did also break out at the end of January, and then it still rolled over the next day. If you bought the day 35 lows, raise your stops…
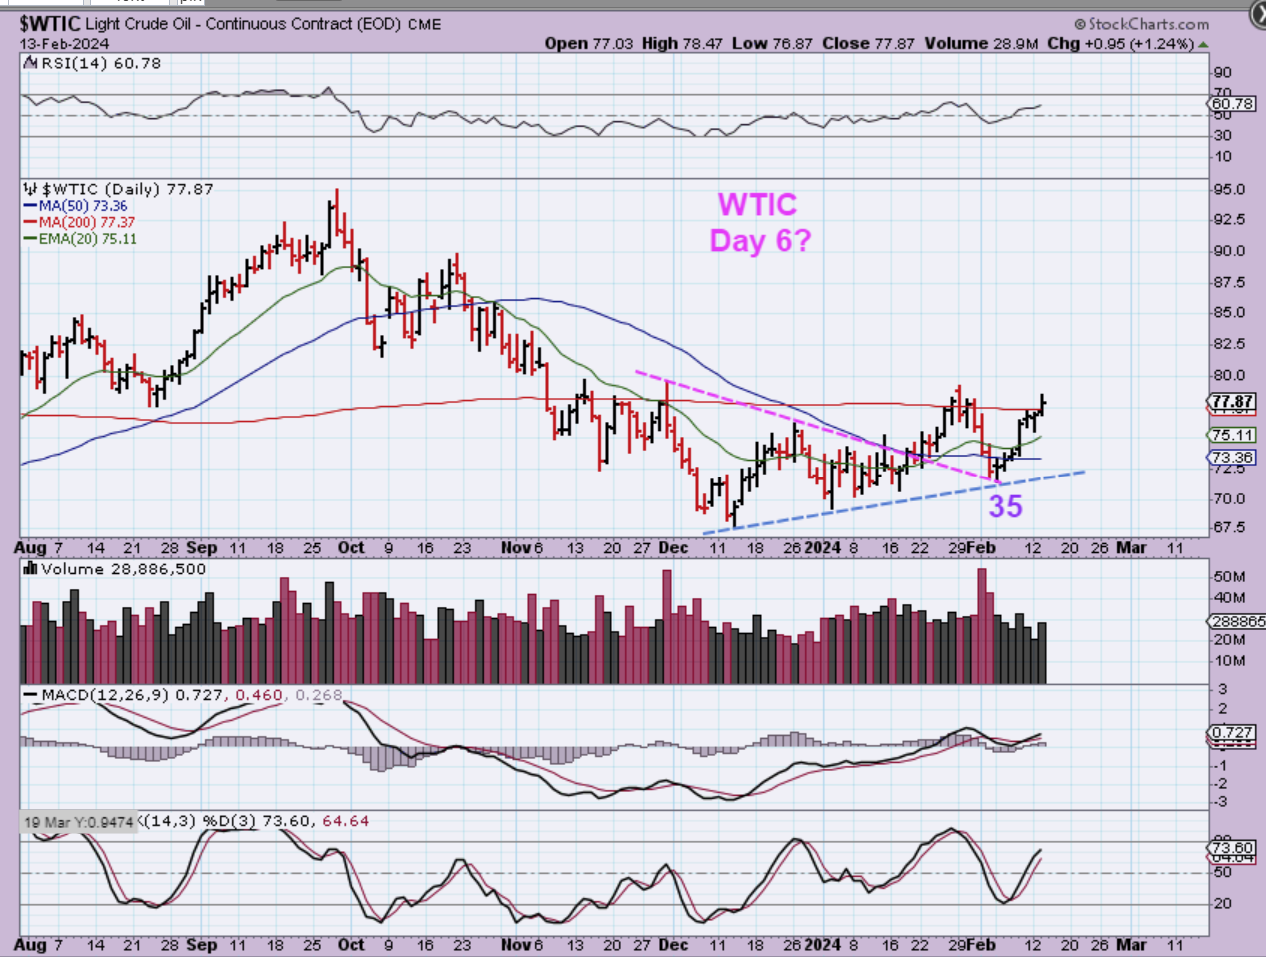
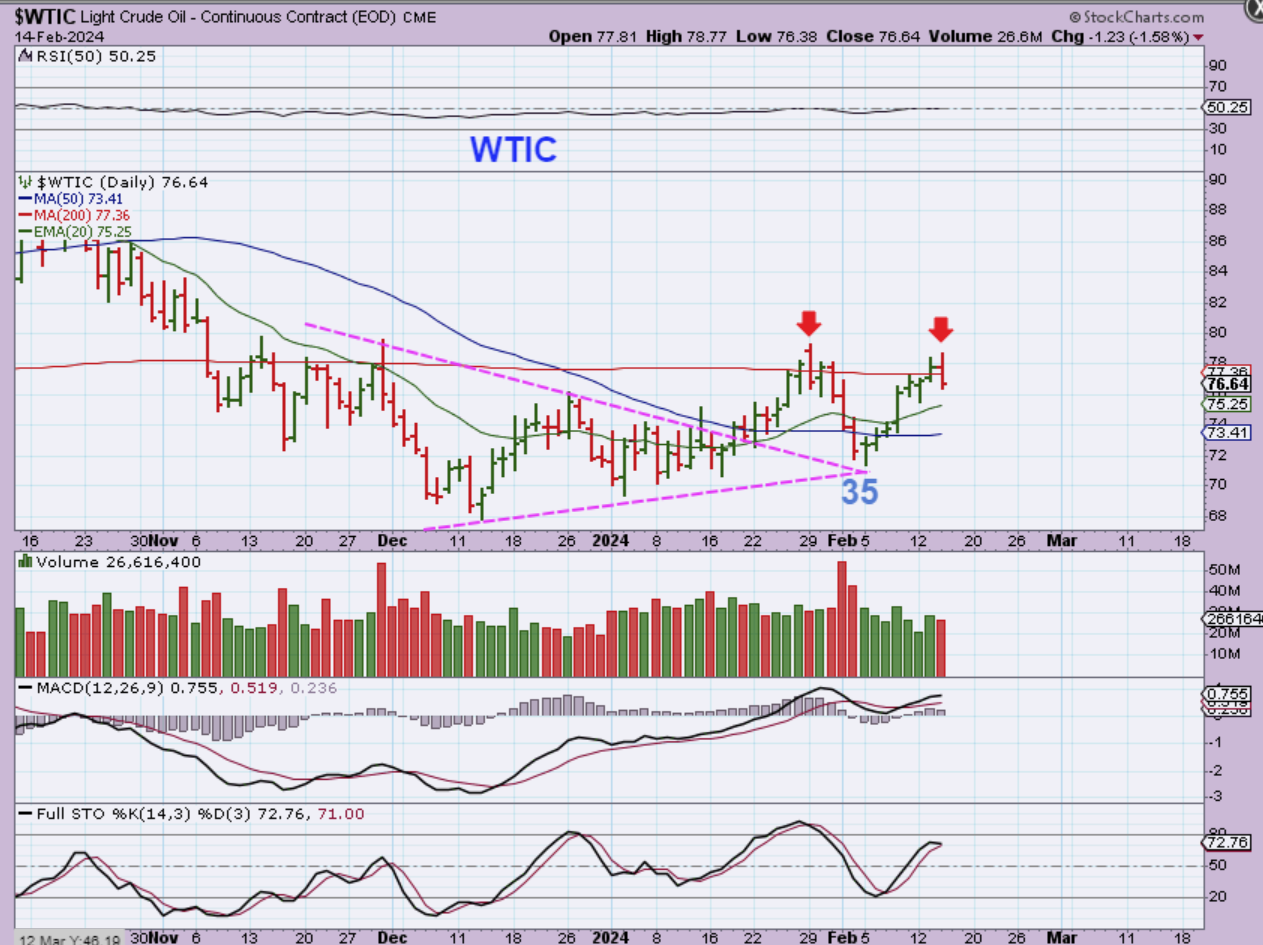
WTIC – Wow, Oil did it again. It broke above the 200sma and gave it up, just like it did in January. That means that it is still unclear if that day 35 low is the dcl or not. This may drop one more time.
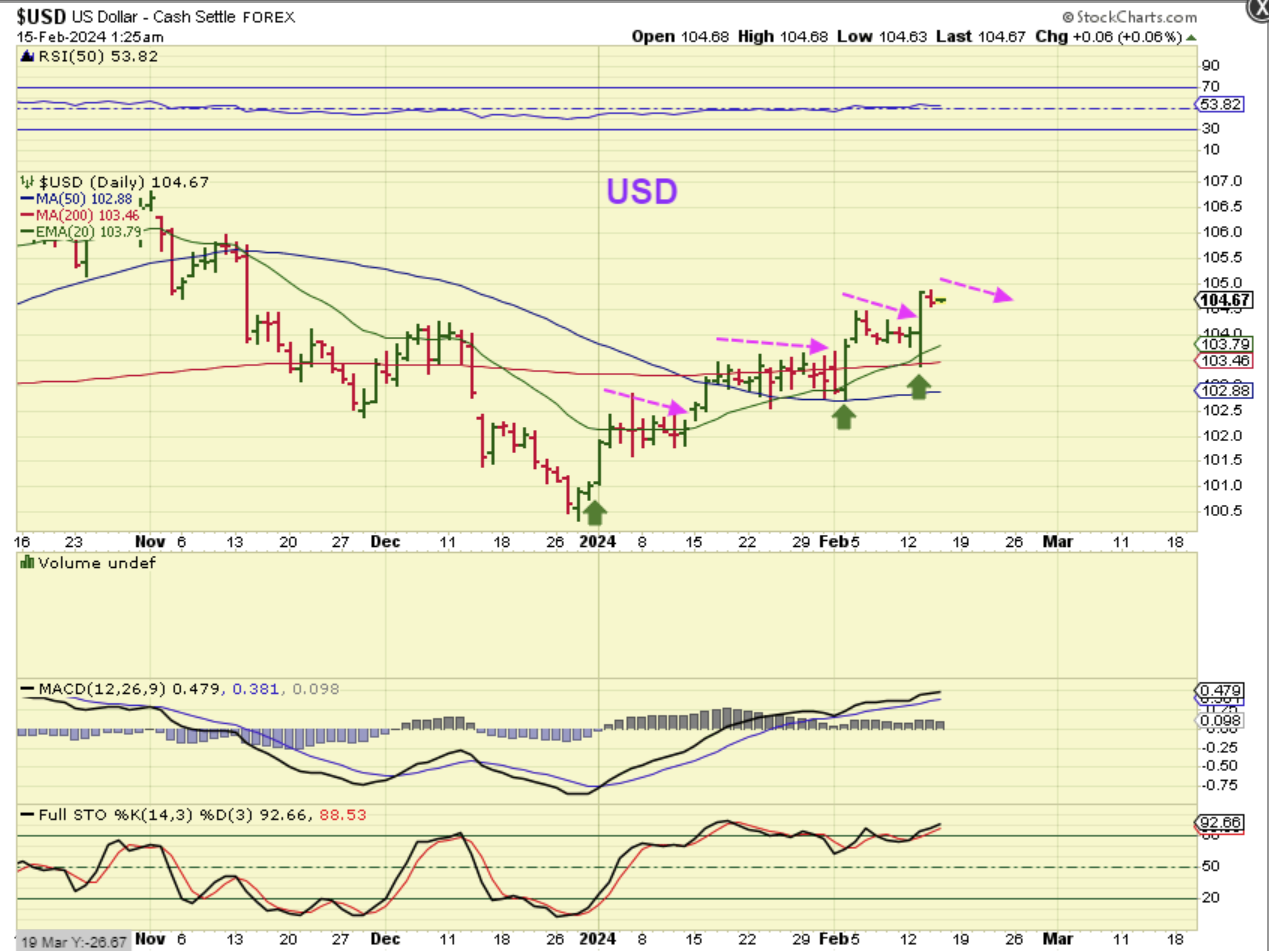
The USD paused on Wednesday…
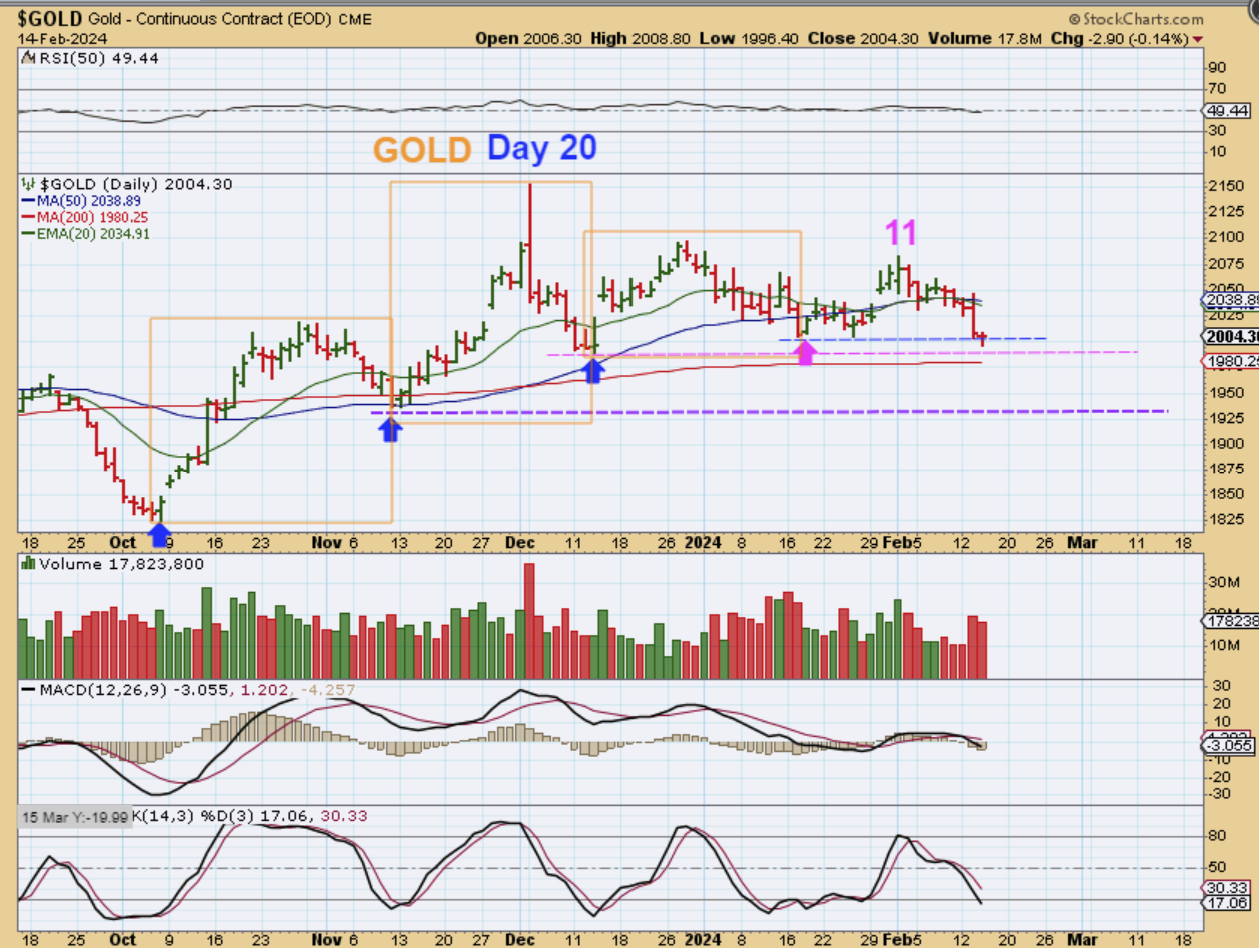
GOLD dropped and reversed, so even though I expect Gold to drop into a dcl, it could be a slower sell off with bounces. This is a failed daily cycle and it is on day 20.
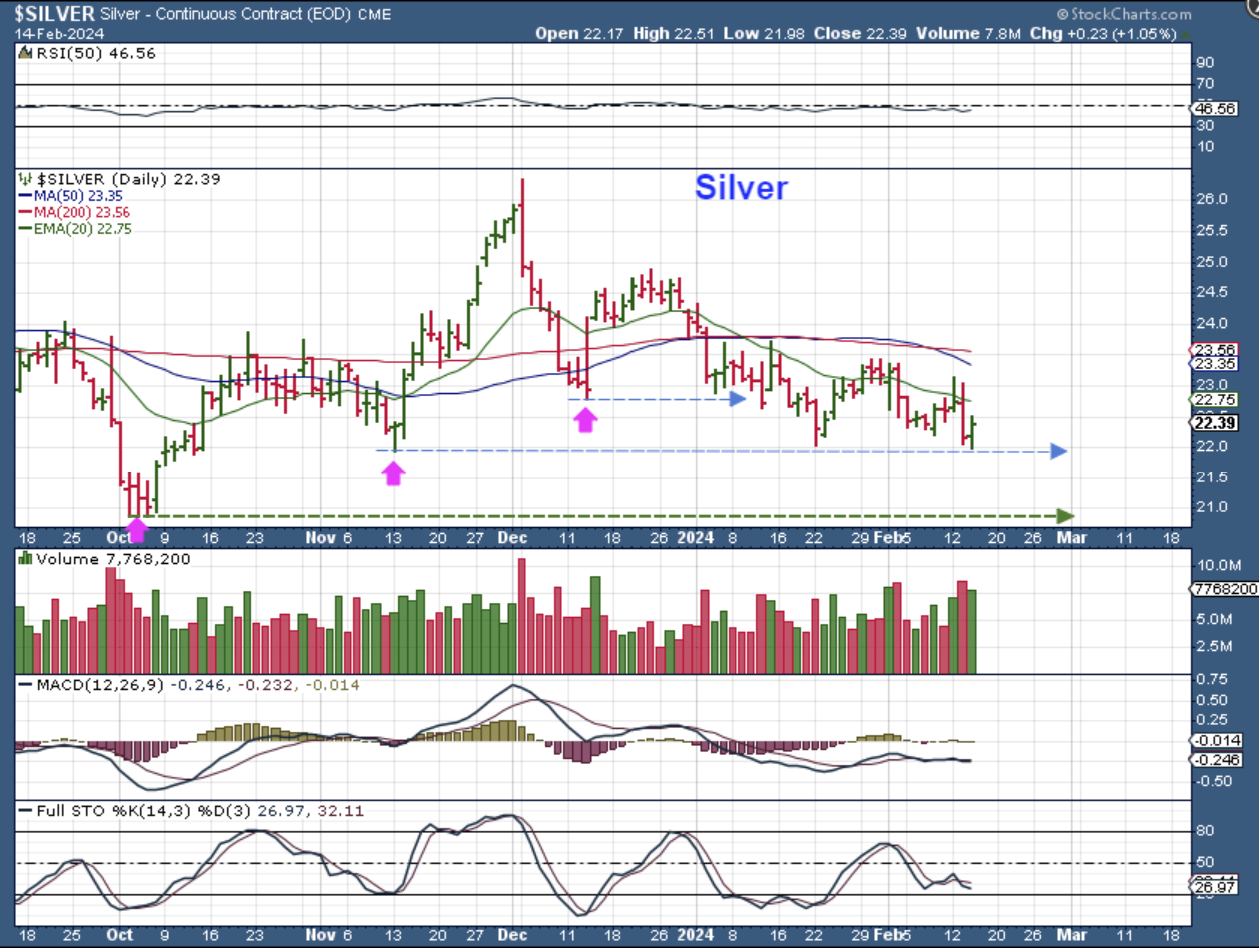
SILVER actually reversed when the USD dipped.
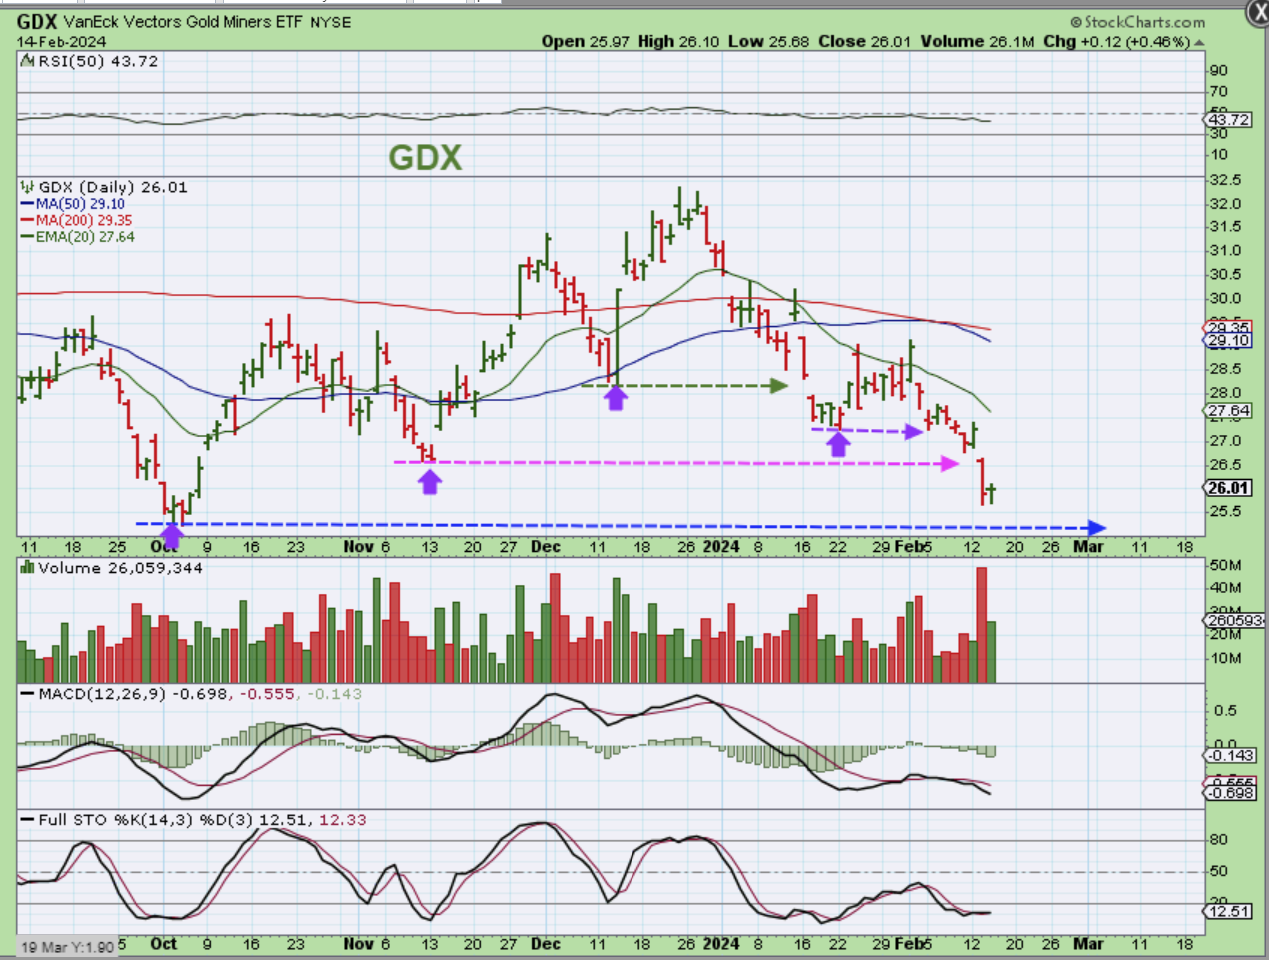
GDX paused in its’ sell off too.
.
The markets sold off with the CPI report on Tuesday, but found support and reversed higher yesterday. I’m hoping that we see the bullish jobless claims numbers along with the other data due to come out, because we still have bullish set ups in the markets (especially the Biotech and Crypto set ups). Oil did a false break out so far and may have its dcl in on day 35 (early), or it may drop 1 more time, and the Precious Metals will remain weak and eventually drop into a dcl and likely an ICL.
.
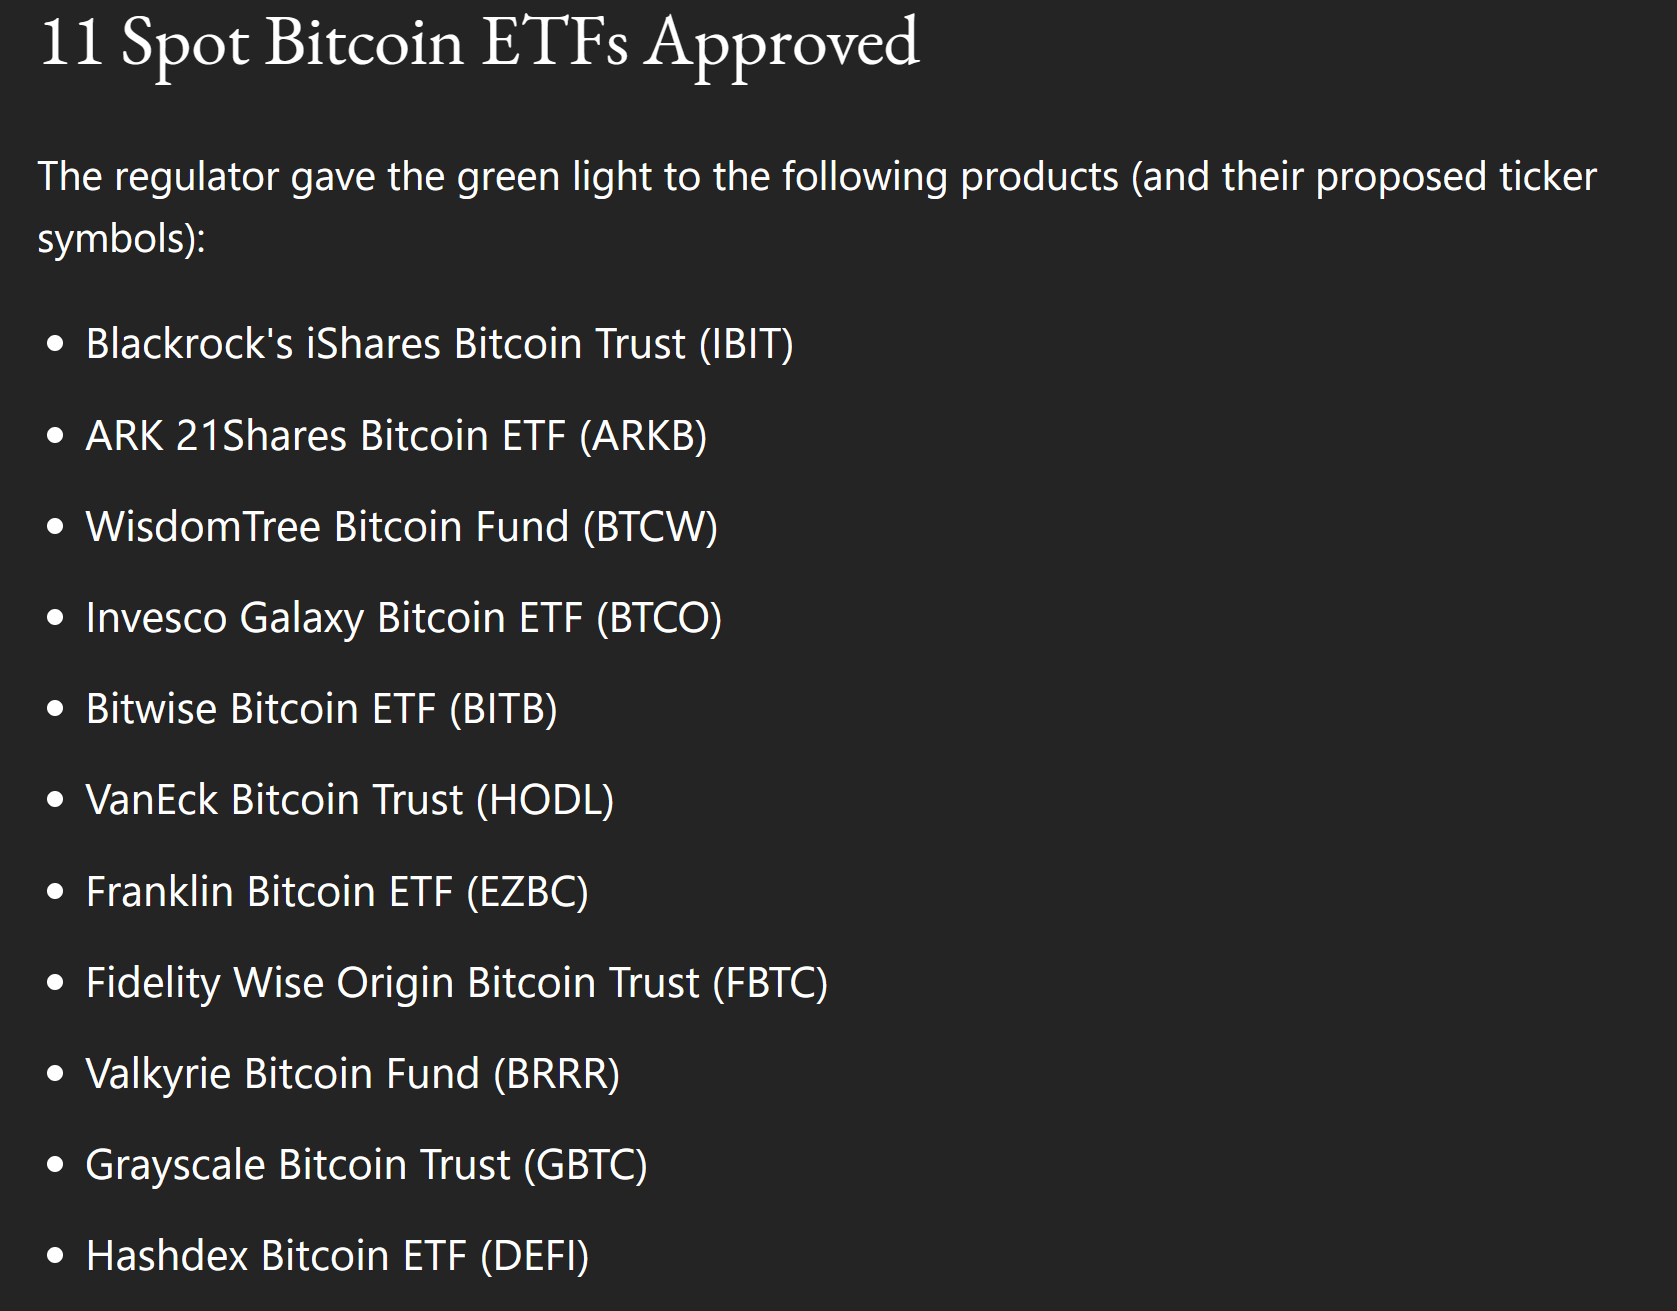
Bitcoin and stock picks are below, Enjoy your Thursday trading!
.
~ALEX
.
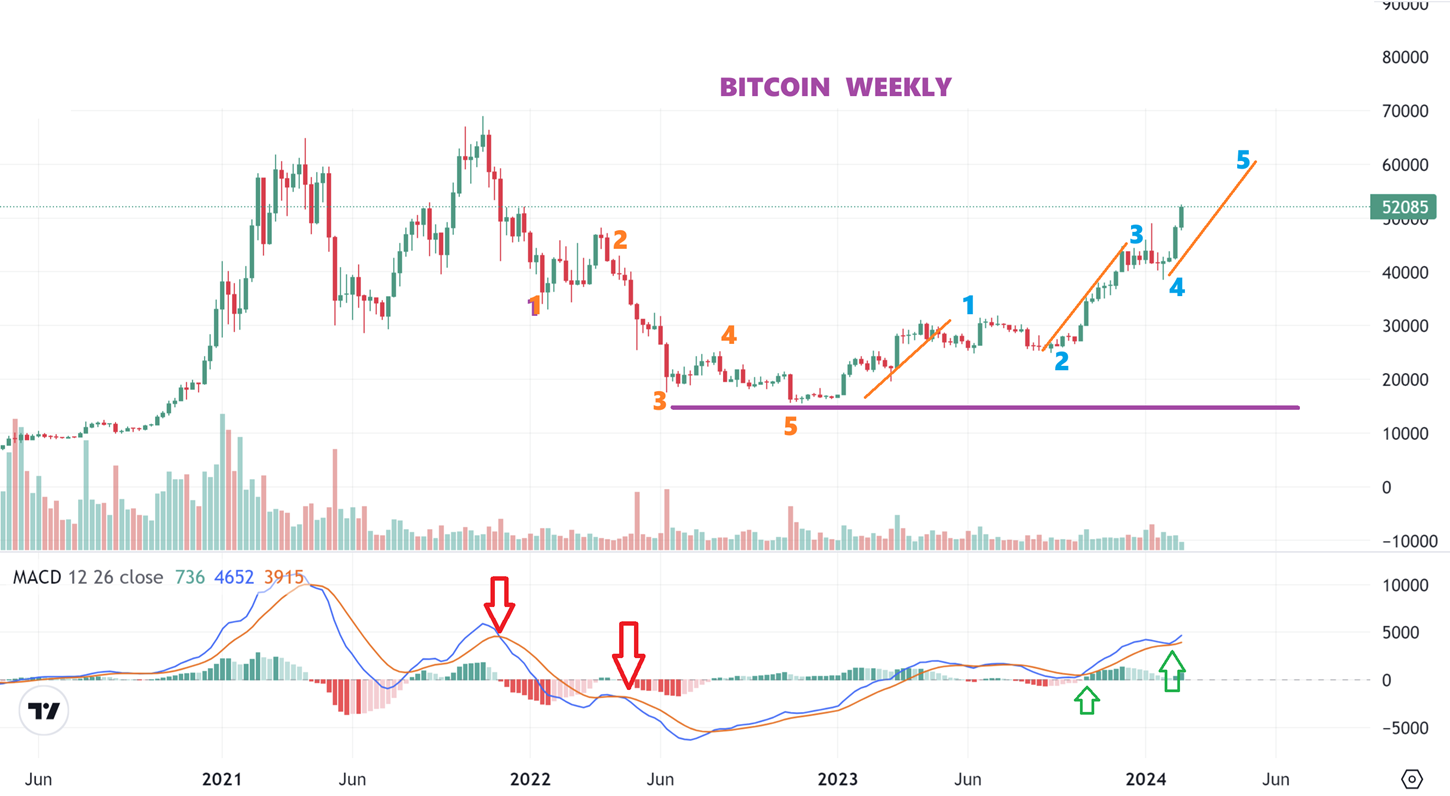
I drew a 5 wave run down sell off into the ICL, and now I drew a 5 wave run higher for BITCOIN on this weekly chart.
1. Notice that the ICL to ‘1’ and then down to ‘2’ on the run higher was a bit of a rounding rally.
2. Then the wave 2-3 was a bit more steeply inclined. The drop to ‘4’ was a sideways consolidation (showing strength).
3. The current run of ‘4’ to ‘5’ is, so far, straight up. In other words, the run out of the lows has been getting more vertical over time and resembles past runs that came months after the halving took place. This should be running to prior highs over time.
Using this chart for BITCOIN, I am again showing prior price levels that affect price. These were prior support / resistance, and we are at the point where Bitcoin has made its way through almost all of the levels to the left. When I look at this …
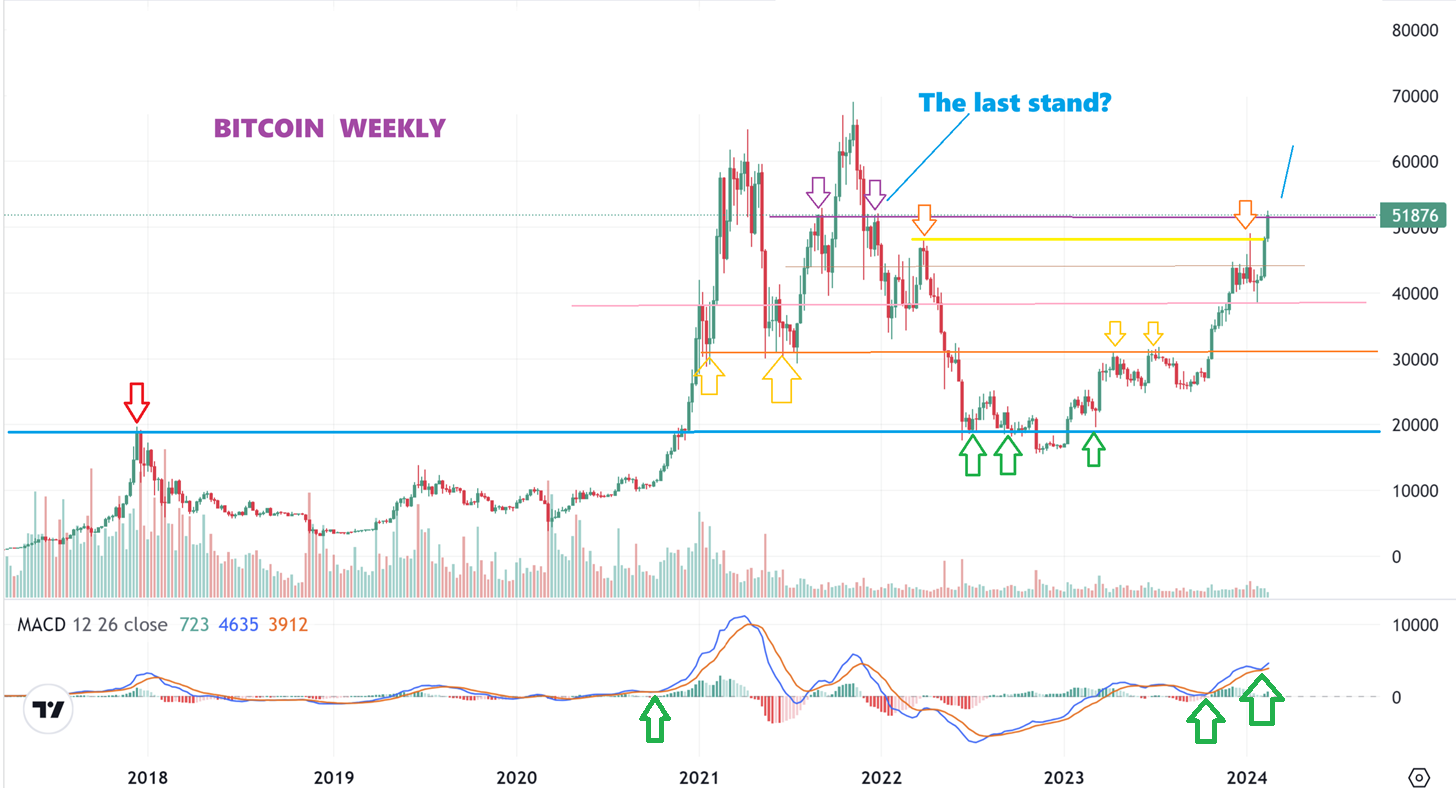
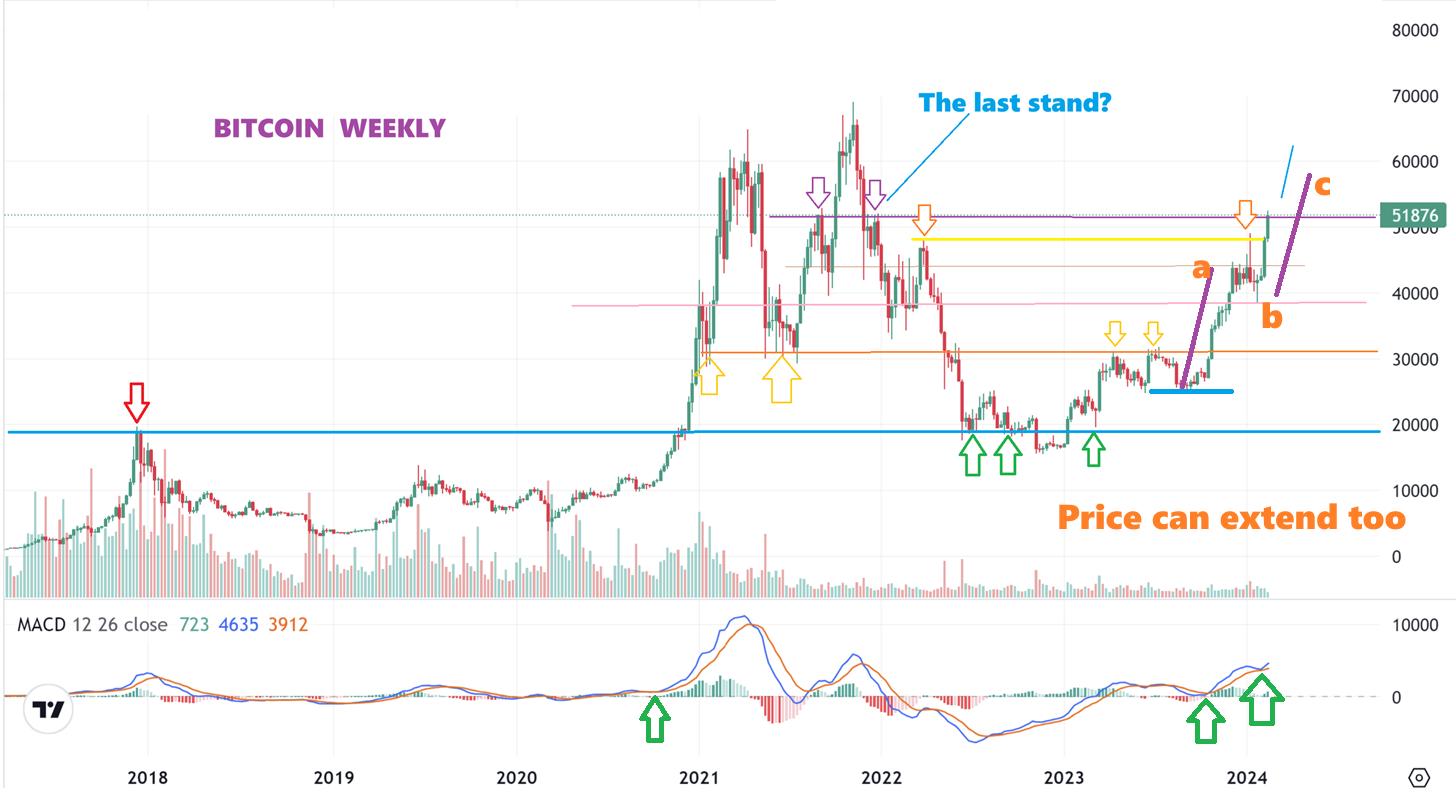
When I look at this, I can draw an a-b-c move that leads to roughly $60,000. These moves can extend, so again, in time this could reach the prior highs. I know that this move looks too steep to be sustained, and it usually is, but look at the run from 2020 to 2021 and you’ll see a steep move there too. The MACD is bullish.
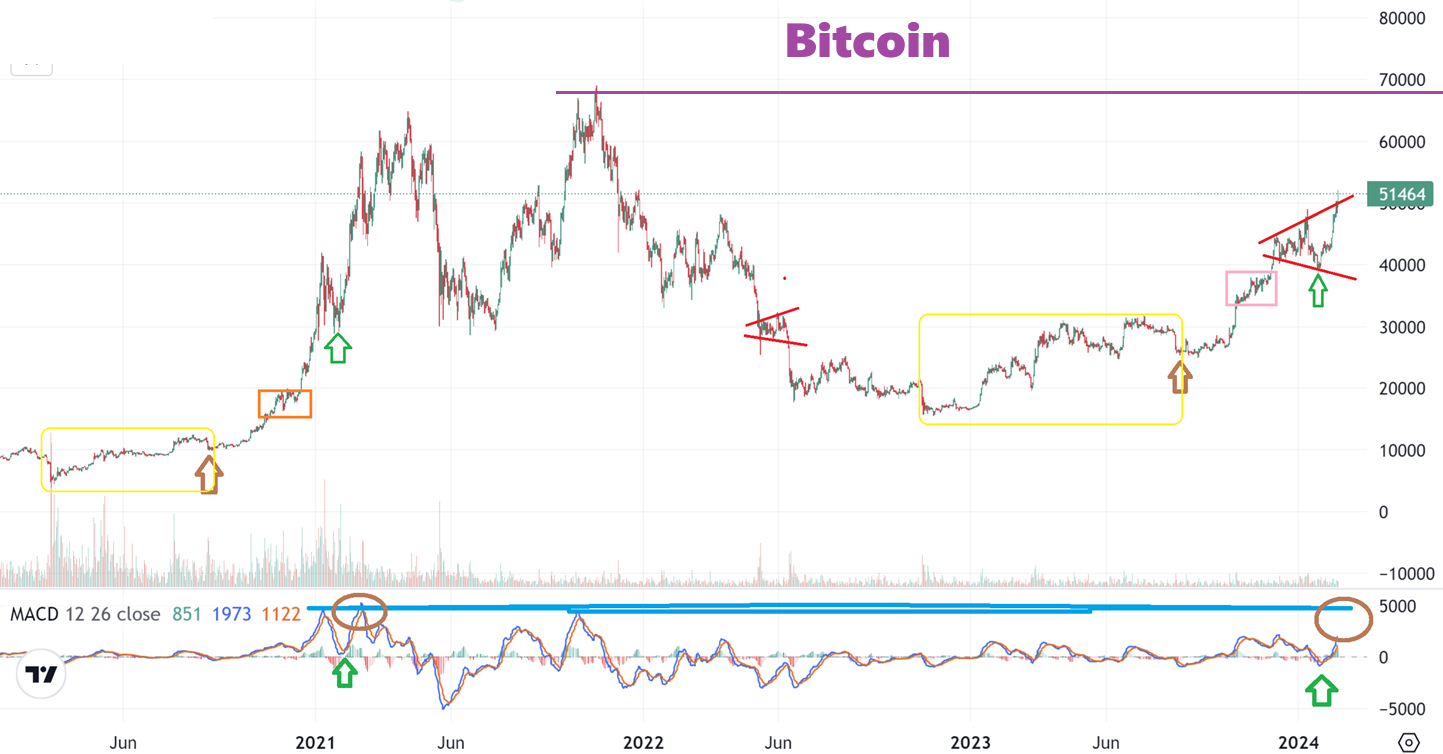
BITCOIN daily. Today is day 23 out of the ICL, and it has been straight up recently. We had that drop after the ETF Approval, and that looks to be an ICL drop, and then the run higher forms a megaphone, so I have mentioned that this could be a breakout of the megaphone and a back test at the 30 day point (1/2 cycle low).
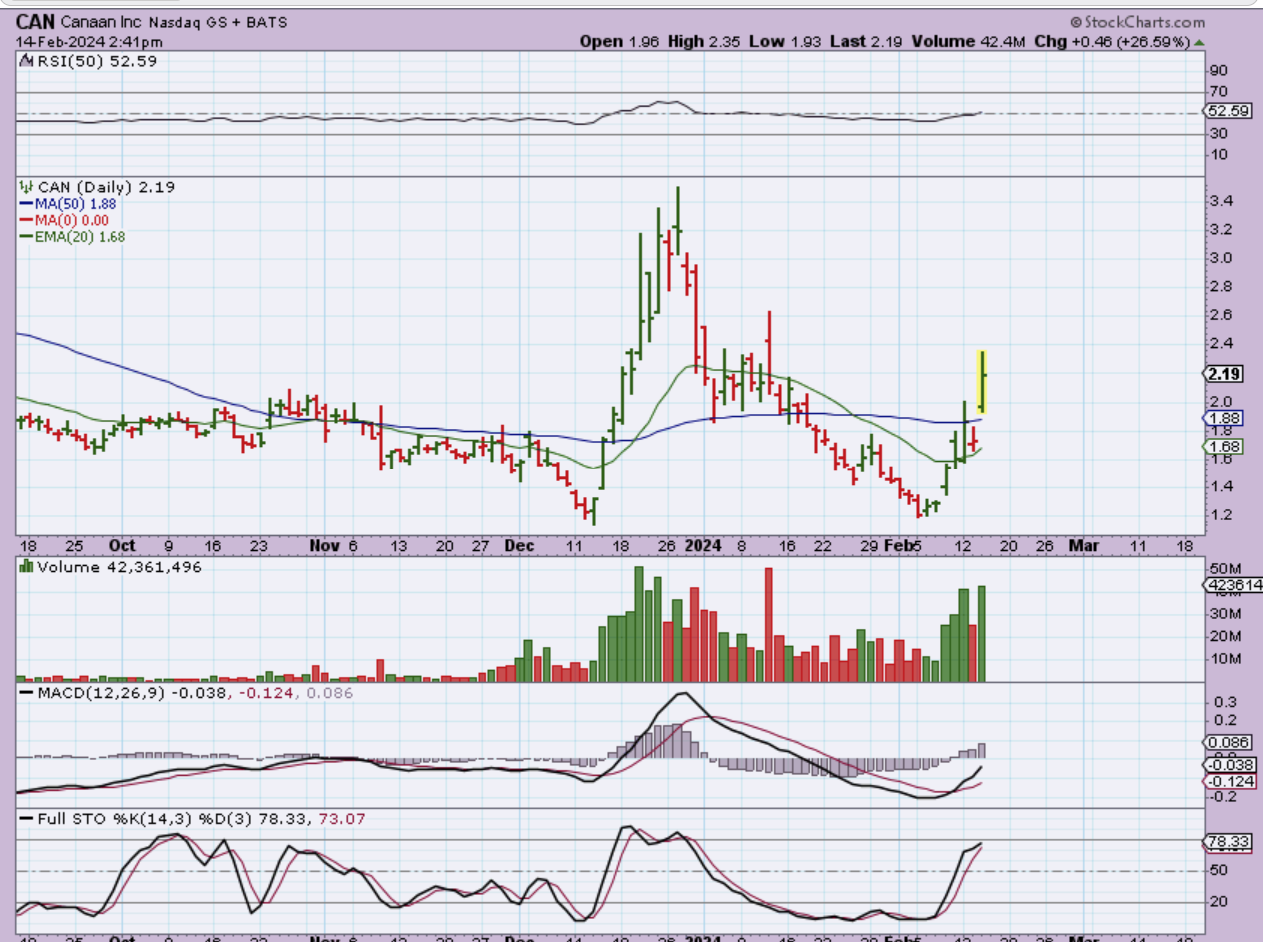
I was discussing how ‘laggers’ that were still near the lows would likely start to play catch up.
CAN was lagging, but in the last 5 days it has almost doubled off of the lows ( $1.20 to $2.40). These can chop and drop, like we saw on Tuesday, but look at the run in December. That can repeat.
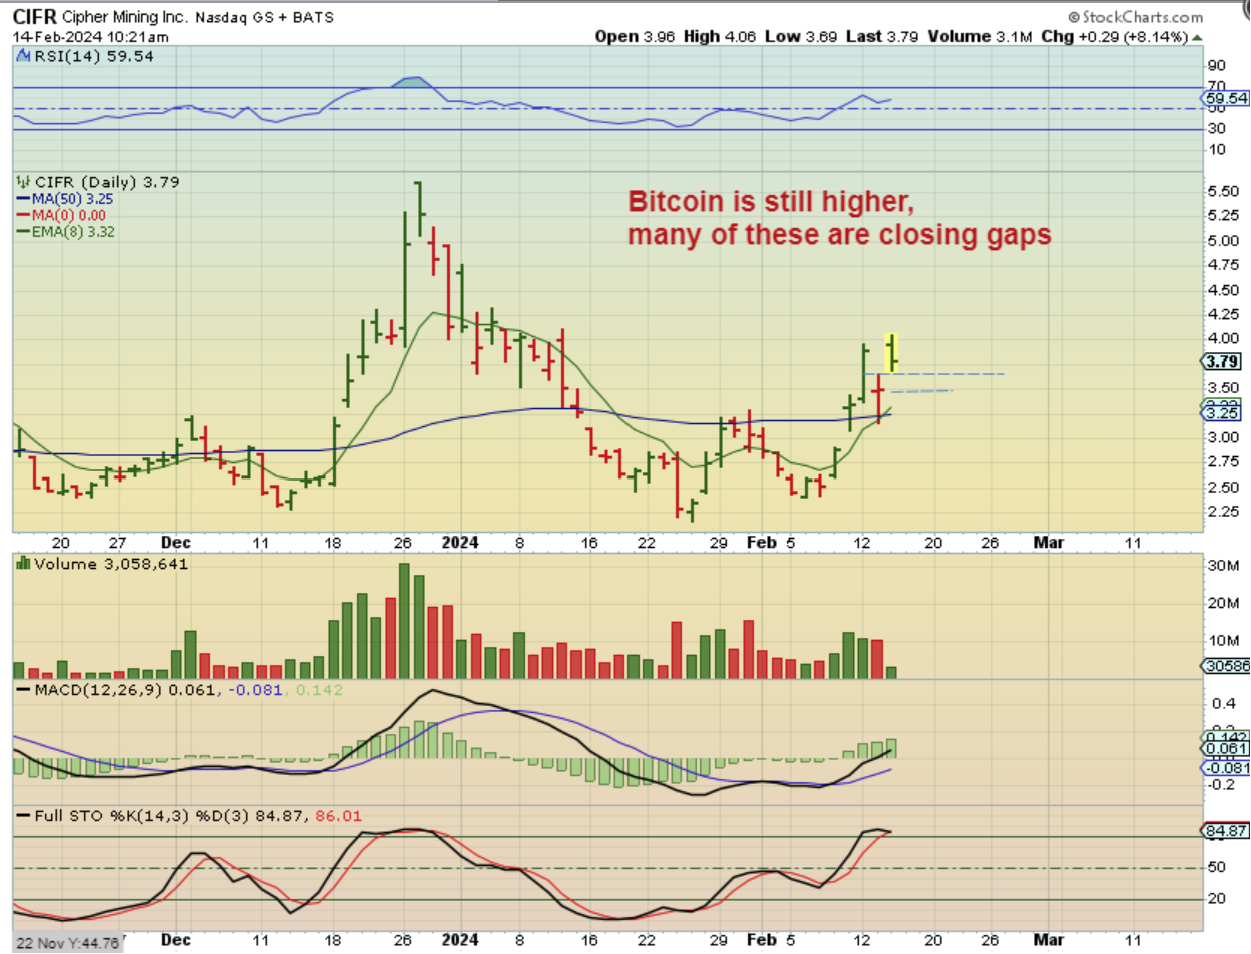
CIFR was near the lows last week, but it just ran from $2.50 to $4.
Yesterdays I used this chart at 10:21 am to show how the large gap open was dropping to close the gap. Sometimes The Crypto Stocks do this after a large gap open, and then buyers push it back up. I was using intraday charts and the fact that Bitcoin was still near the highs to show how these gap fills often reverse back to the highs. Did it?
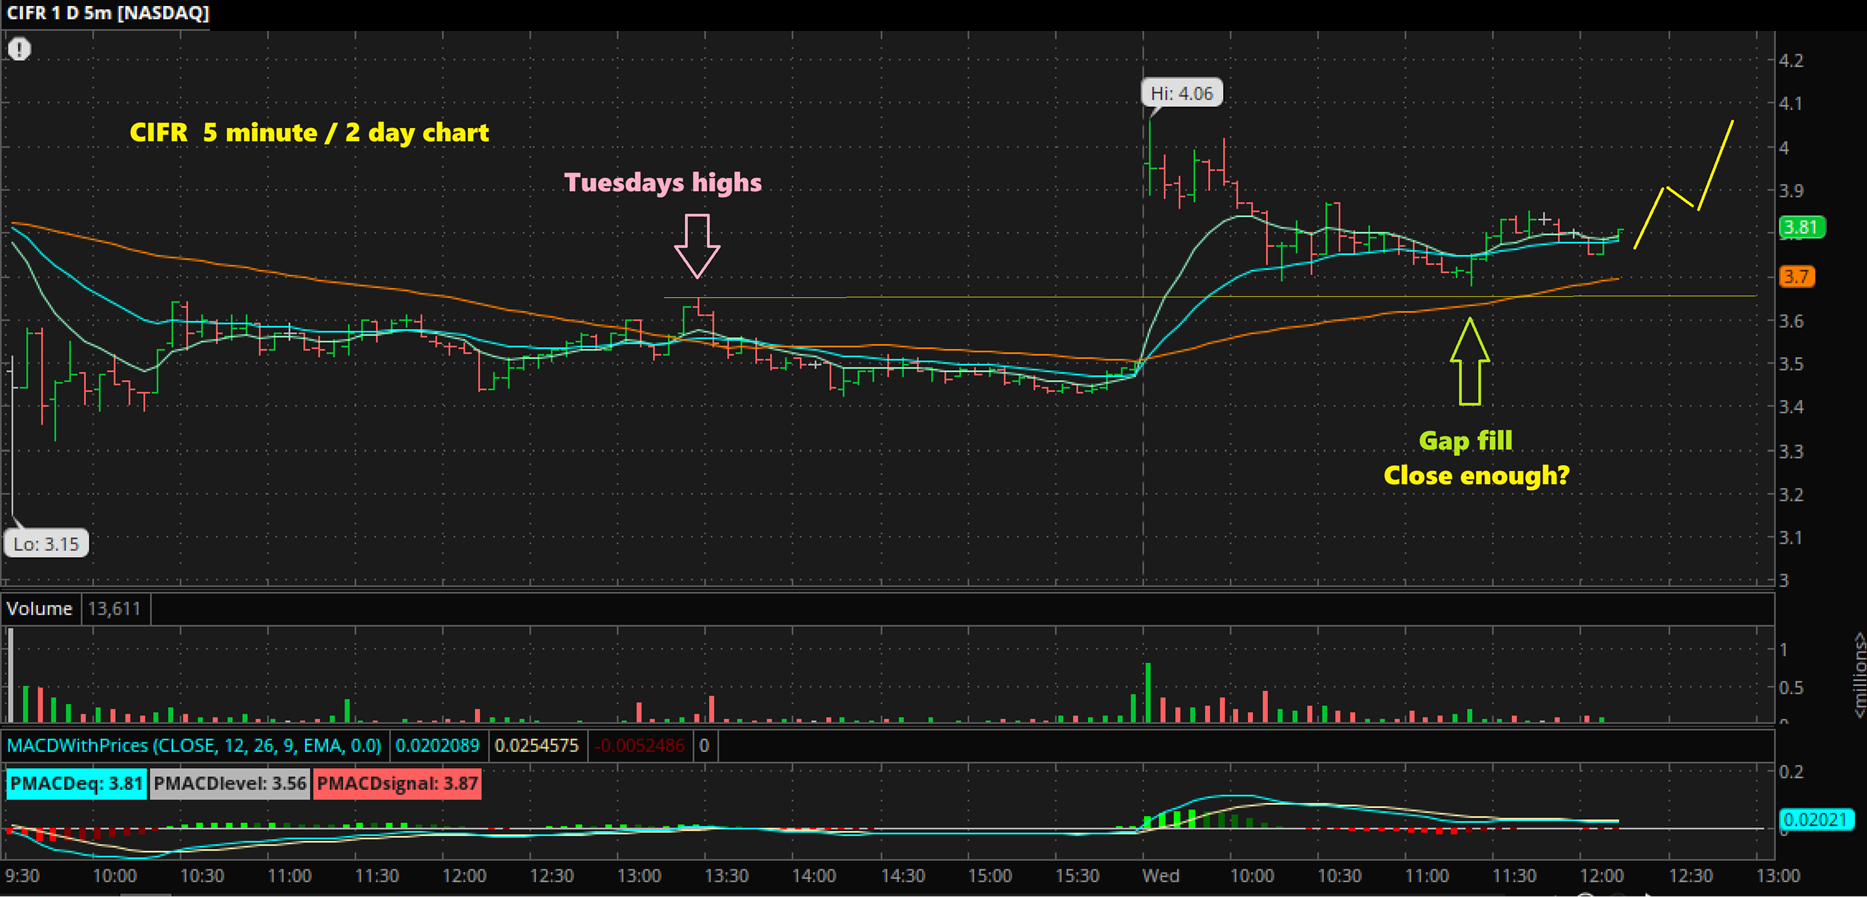
CIFR dropped to the prior days highs, and I posted this intraday chart to show that the gap is closed and it was reversing. This is a 2 day 5 minute chart…
,
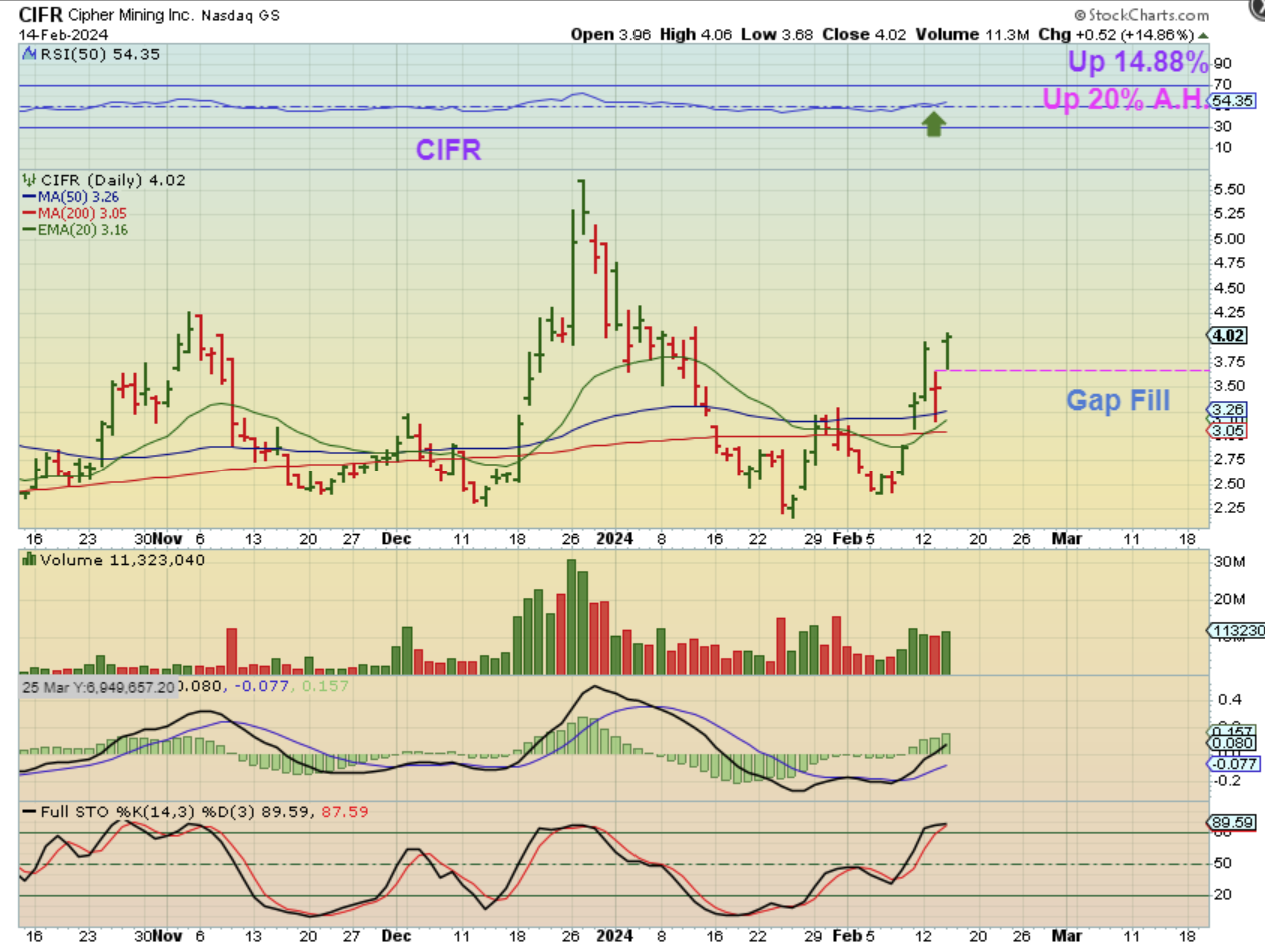
CIFR closed the day back up at the highs (and kept going in after hrs to ‘up 20%’) after a morning to a midday gap fill.
I had mentioned a list of laggers like EBON, SOS, ARBK, HIVE, HUT, WULF, CIFR, SDIG, BTBT, FTFT, NCTY, and so on, and they are starting to run now. LOOK THESE UP. If They were still under the 50sma, that is a clue as to whether they are lagging or not. With Bitcoin racing higher, they should be able to break above and run. Even HUT was under the 50sma, and that was quite surprising.
.
EBON was one of the laggers that I mentioned too. With Bitcoin screaming higher, it was hard to believe that this was at the lows near $8.50, just 5 days ago. It is now starting to push through the moving averages and it was up 21% when I grabbed this yesterday. Are there other laggers? YES…
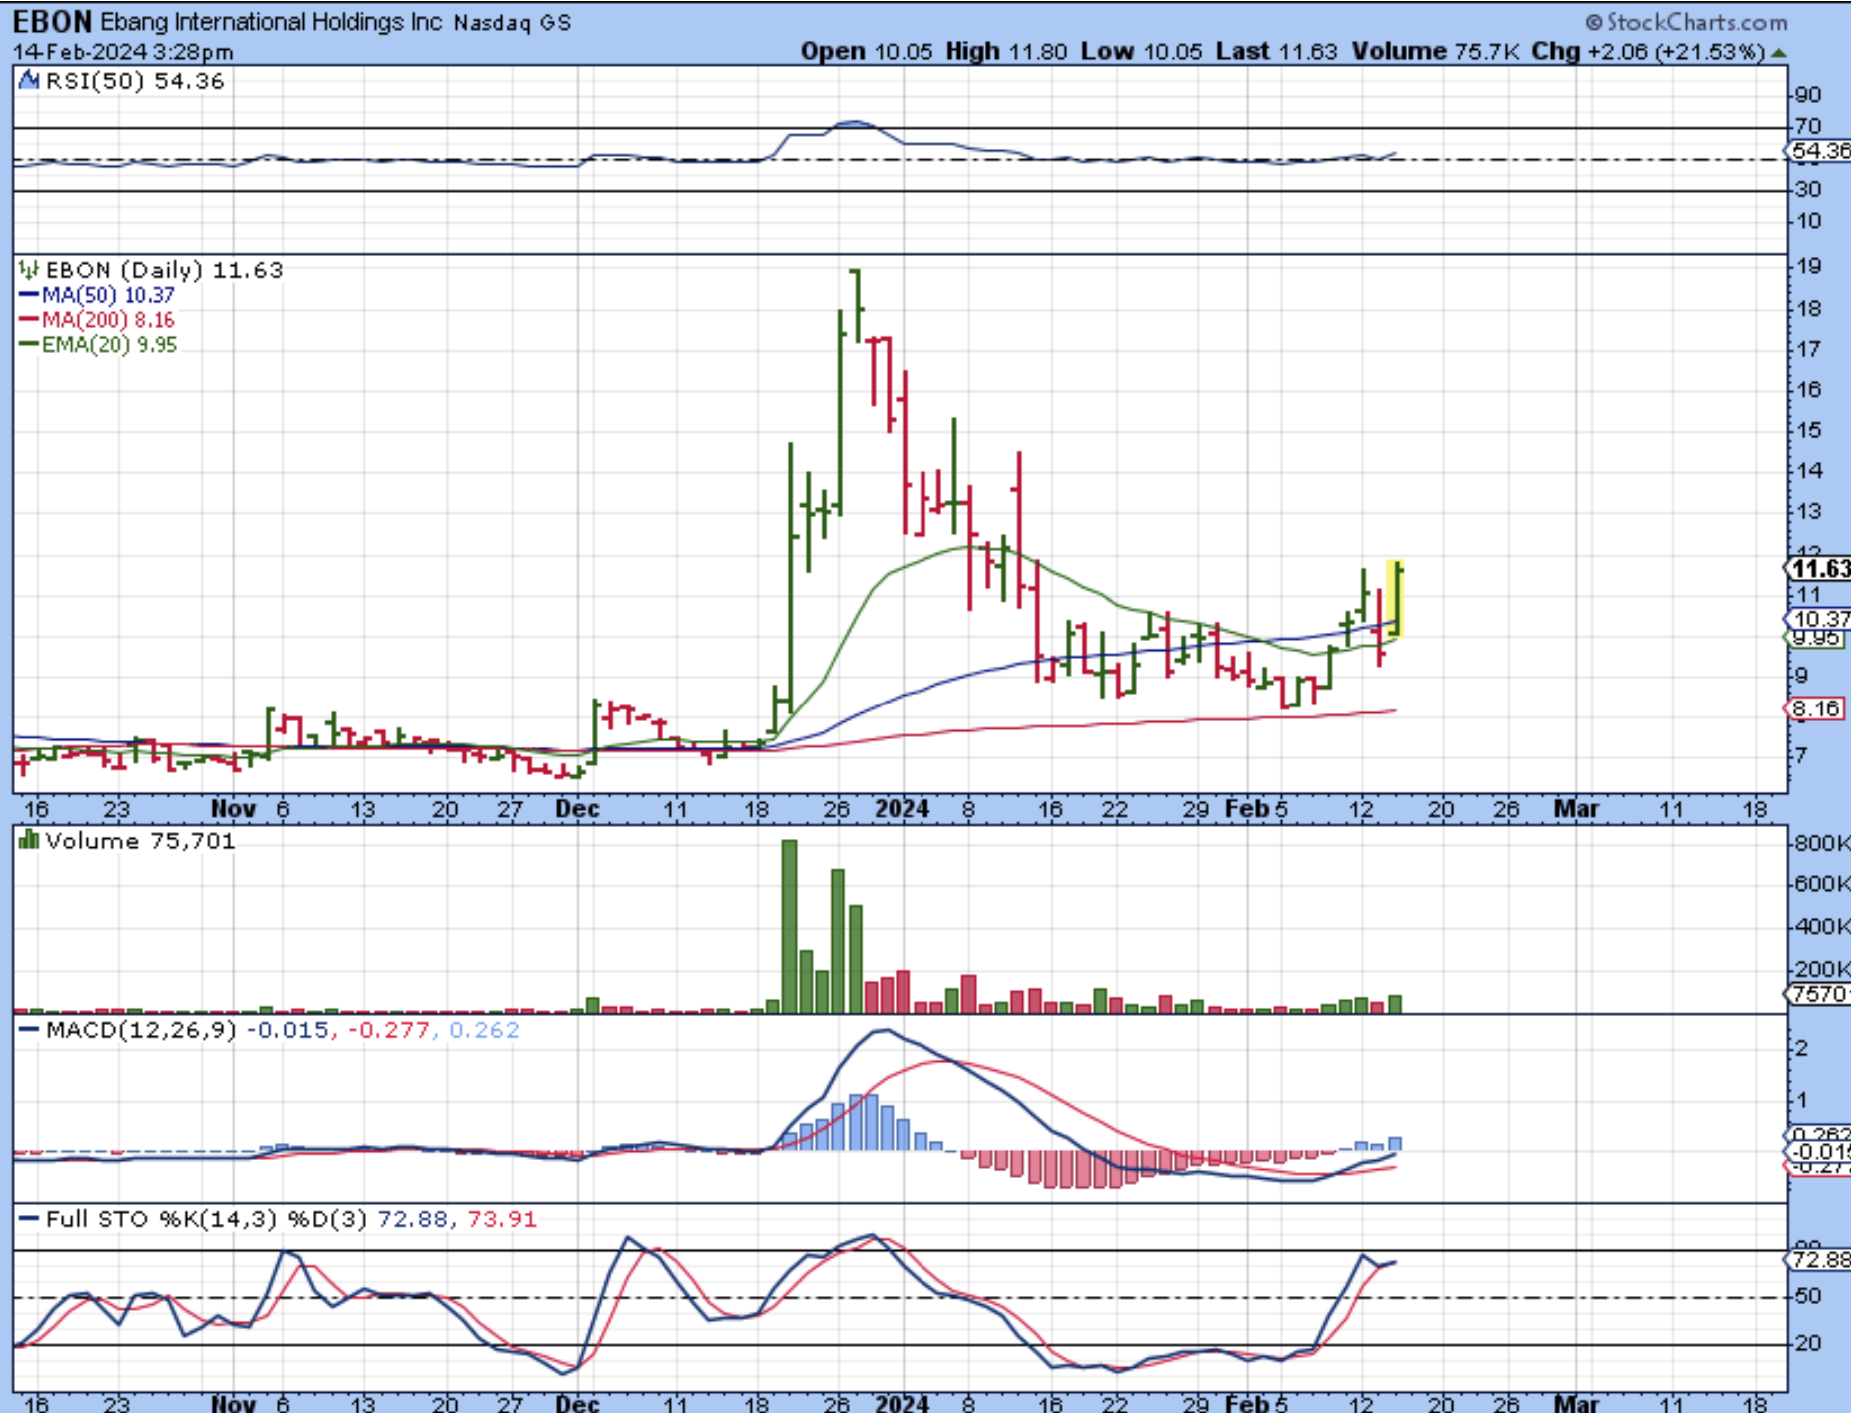
Are there other laggers? YES.
.
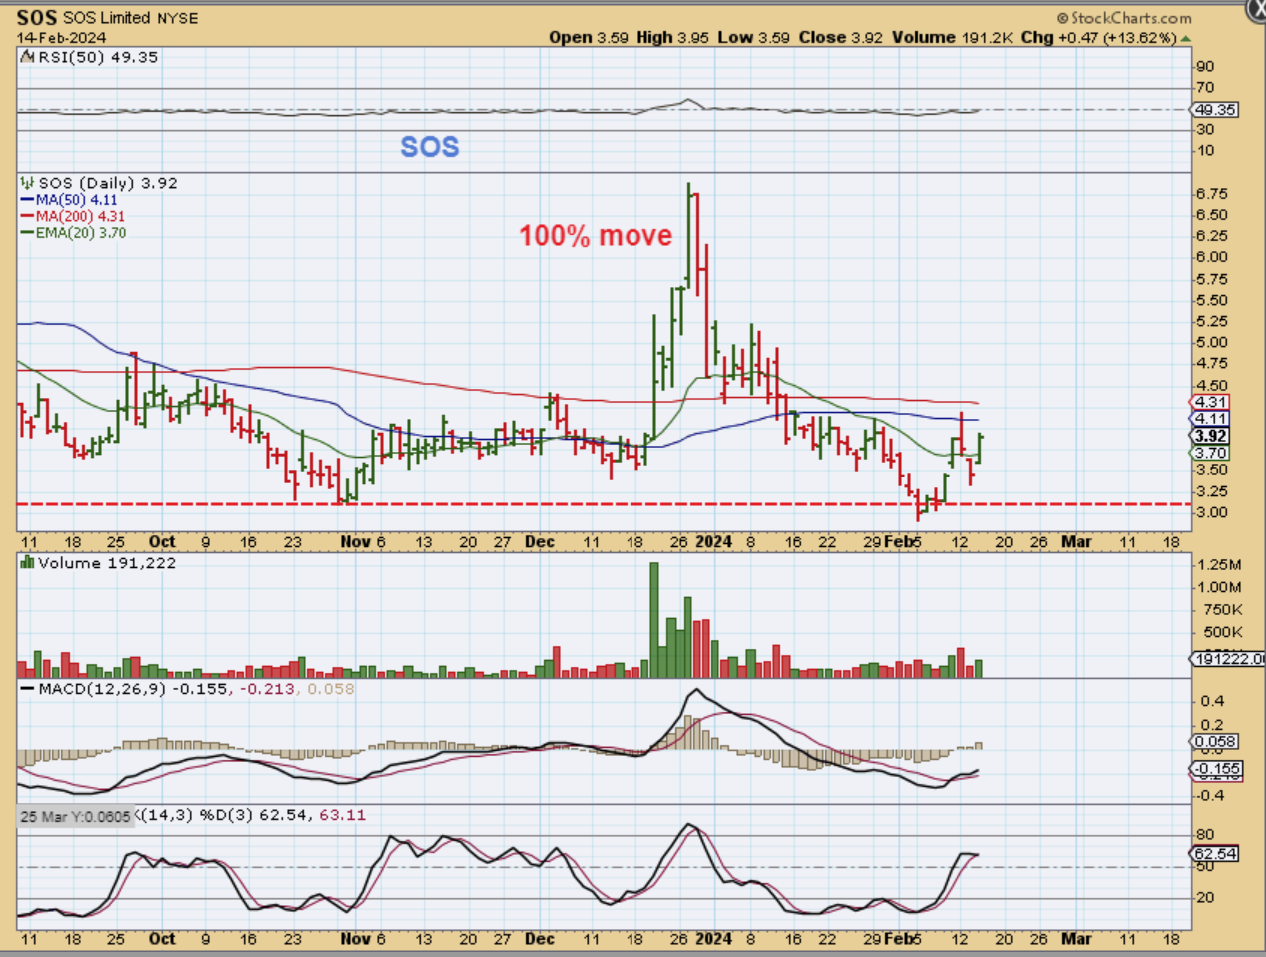
SOS is still at the lows, but looks ready to go. It did this in December too, and pretty much doubled, but don’t go ‘All in’ on one of these, because they may be at the lows because they have a problem? It’s hard to tell, but they can run if you add them to a small basket.
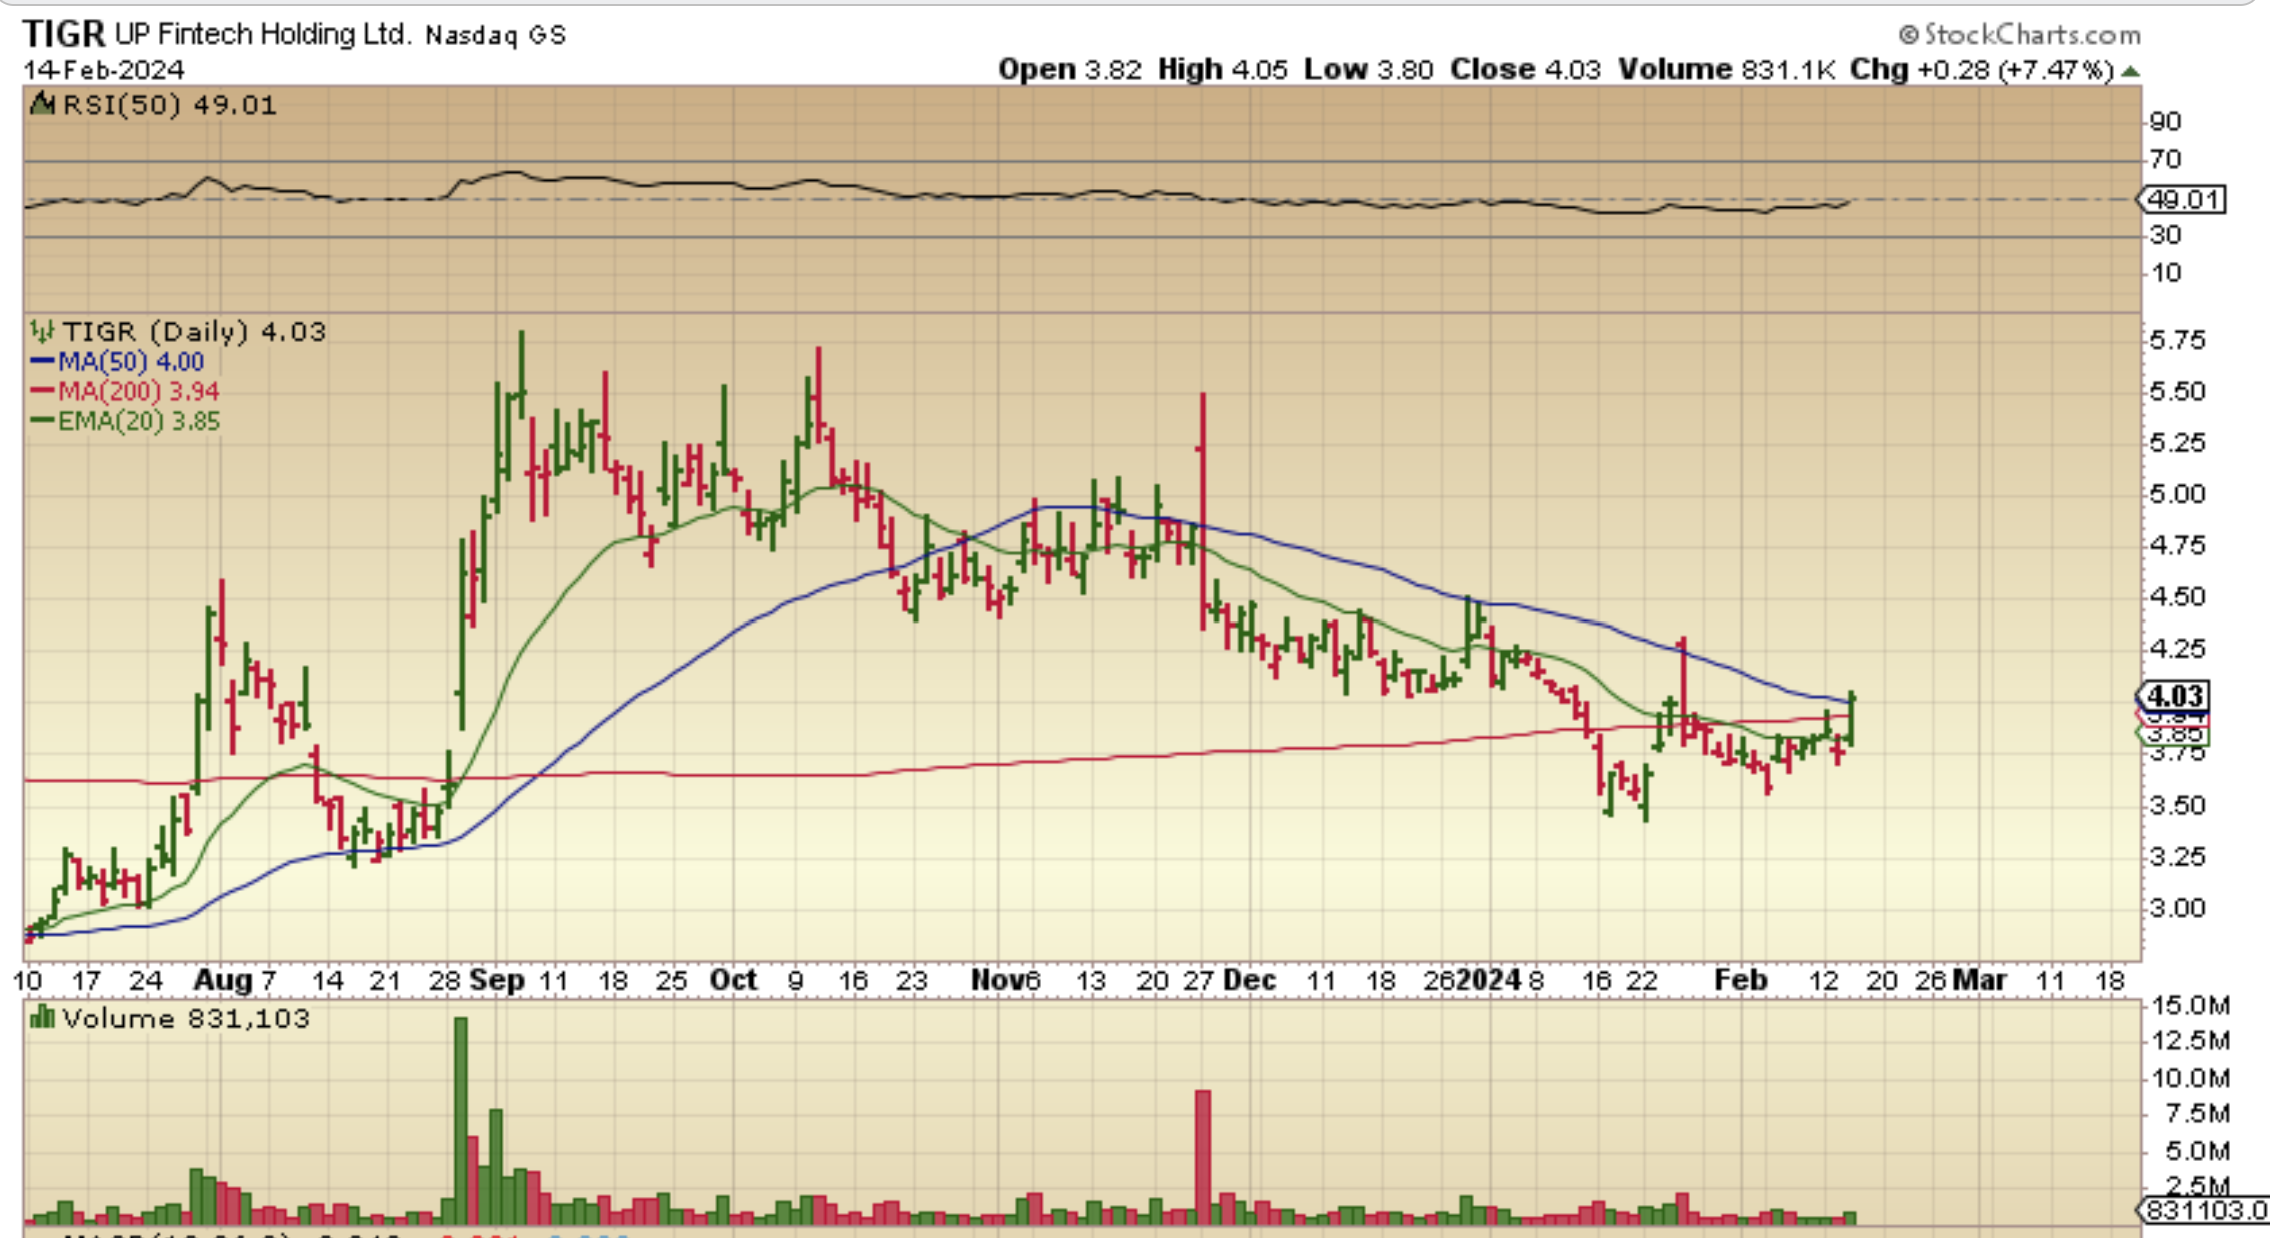
TIGR is another one that I traded in the past. It is still under the 50 & 200sma, but this FINALLY looks ready to go. I didn’t mention it recently , because it didn’t quite look ready, but I do think that it looks ready now.
.
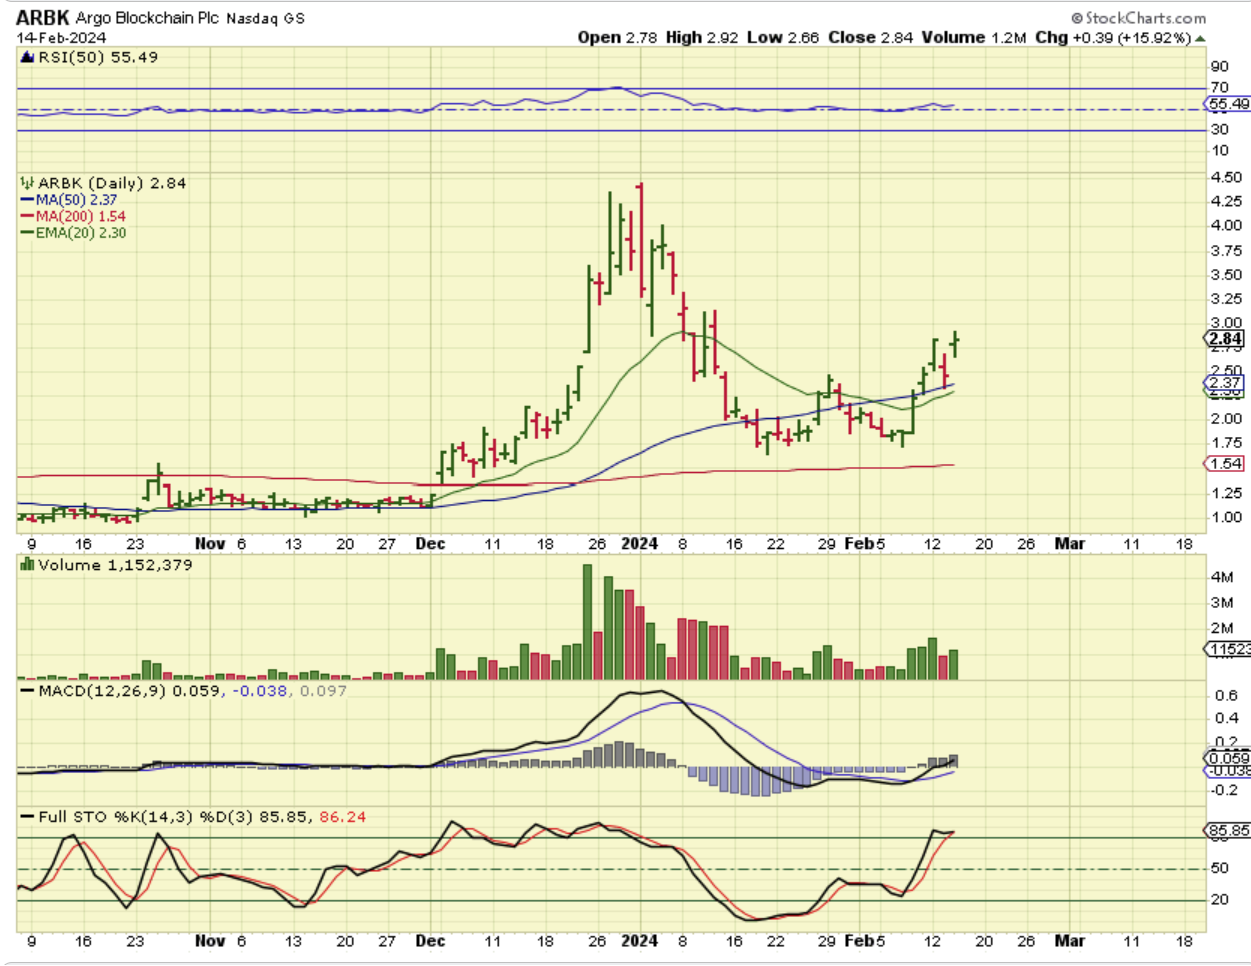
ARBK was mentioned as a lagger 5 days ago, but it has finally started higher. In fact, $1.75 to $3.50 is a 100% move and it is now at $3.
.
AS A REMINDER: I HAD THIS IN THE REPORTS IN JANUARY
.
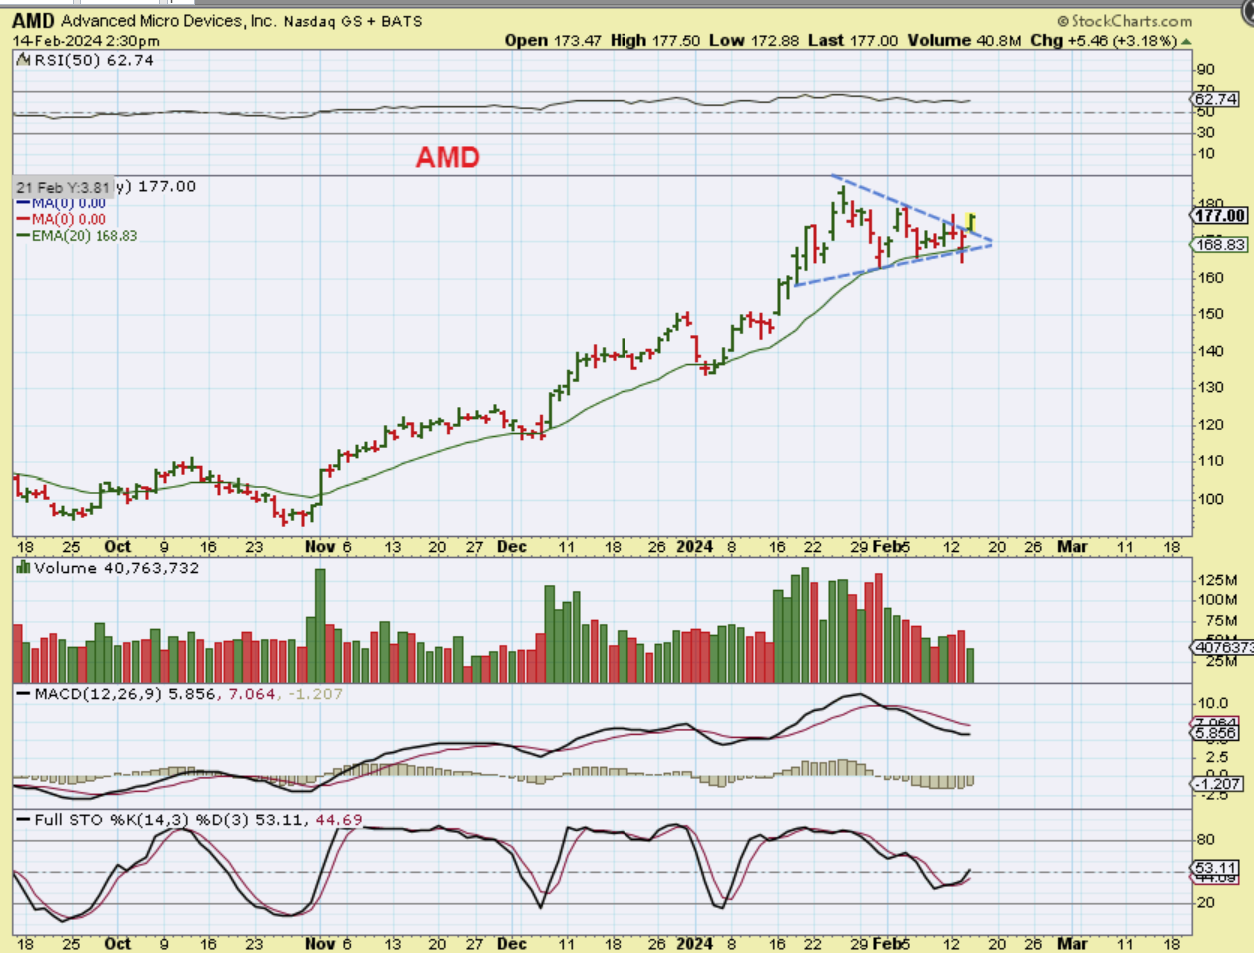
If the Markets continue higher, AMD (Semiconductor) is a buy as it breaks from the triangle that I pointed out last week. TSEM rallied on earnings yesterday too.
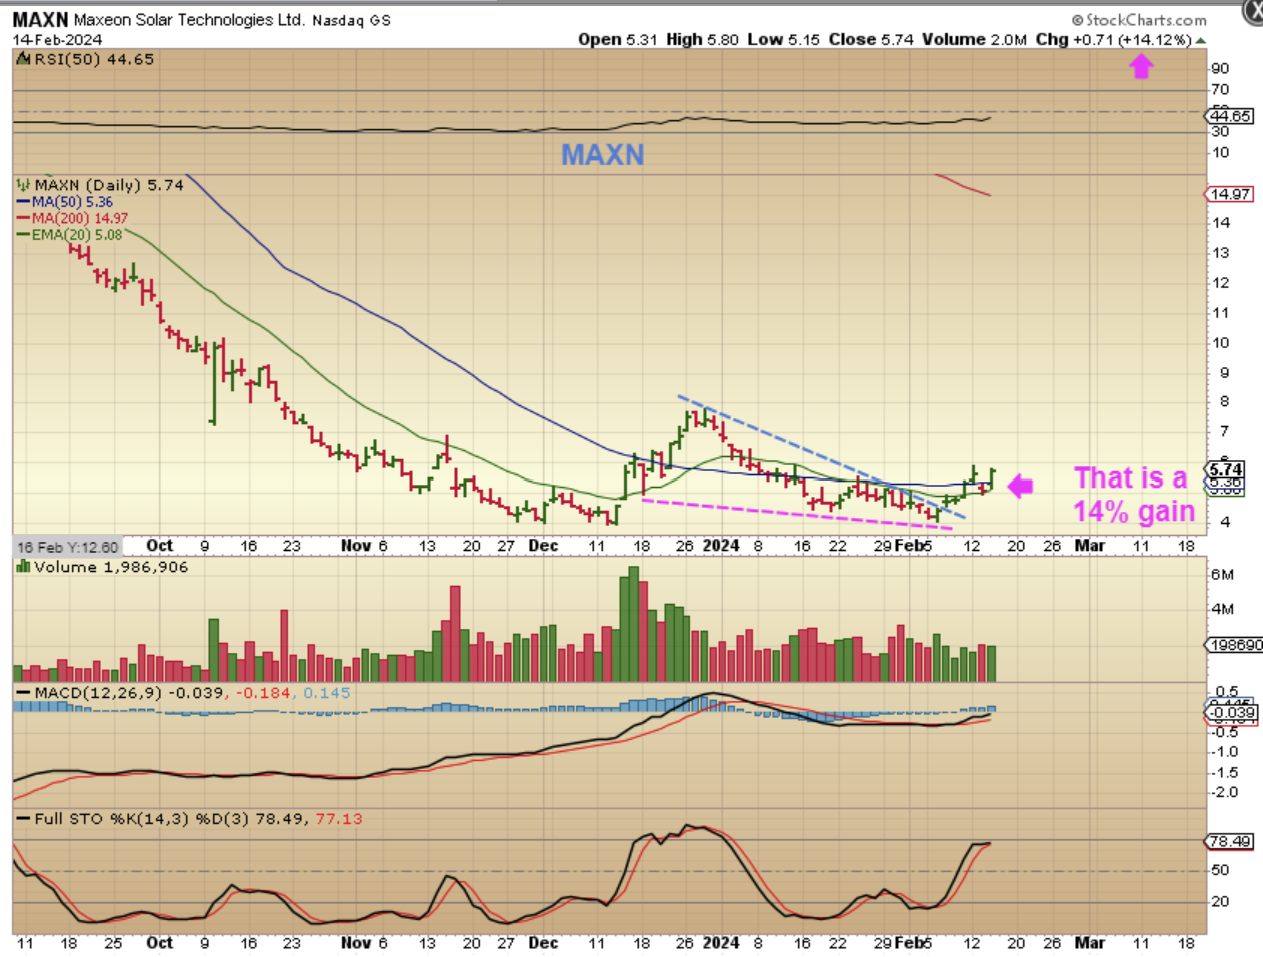
SOLAR STOCKS ARE PERKING UP: Take a look at MAXN, SPWR, CSIQ, RUN, NOVA, FSLR, etc
.
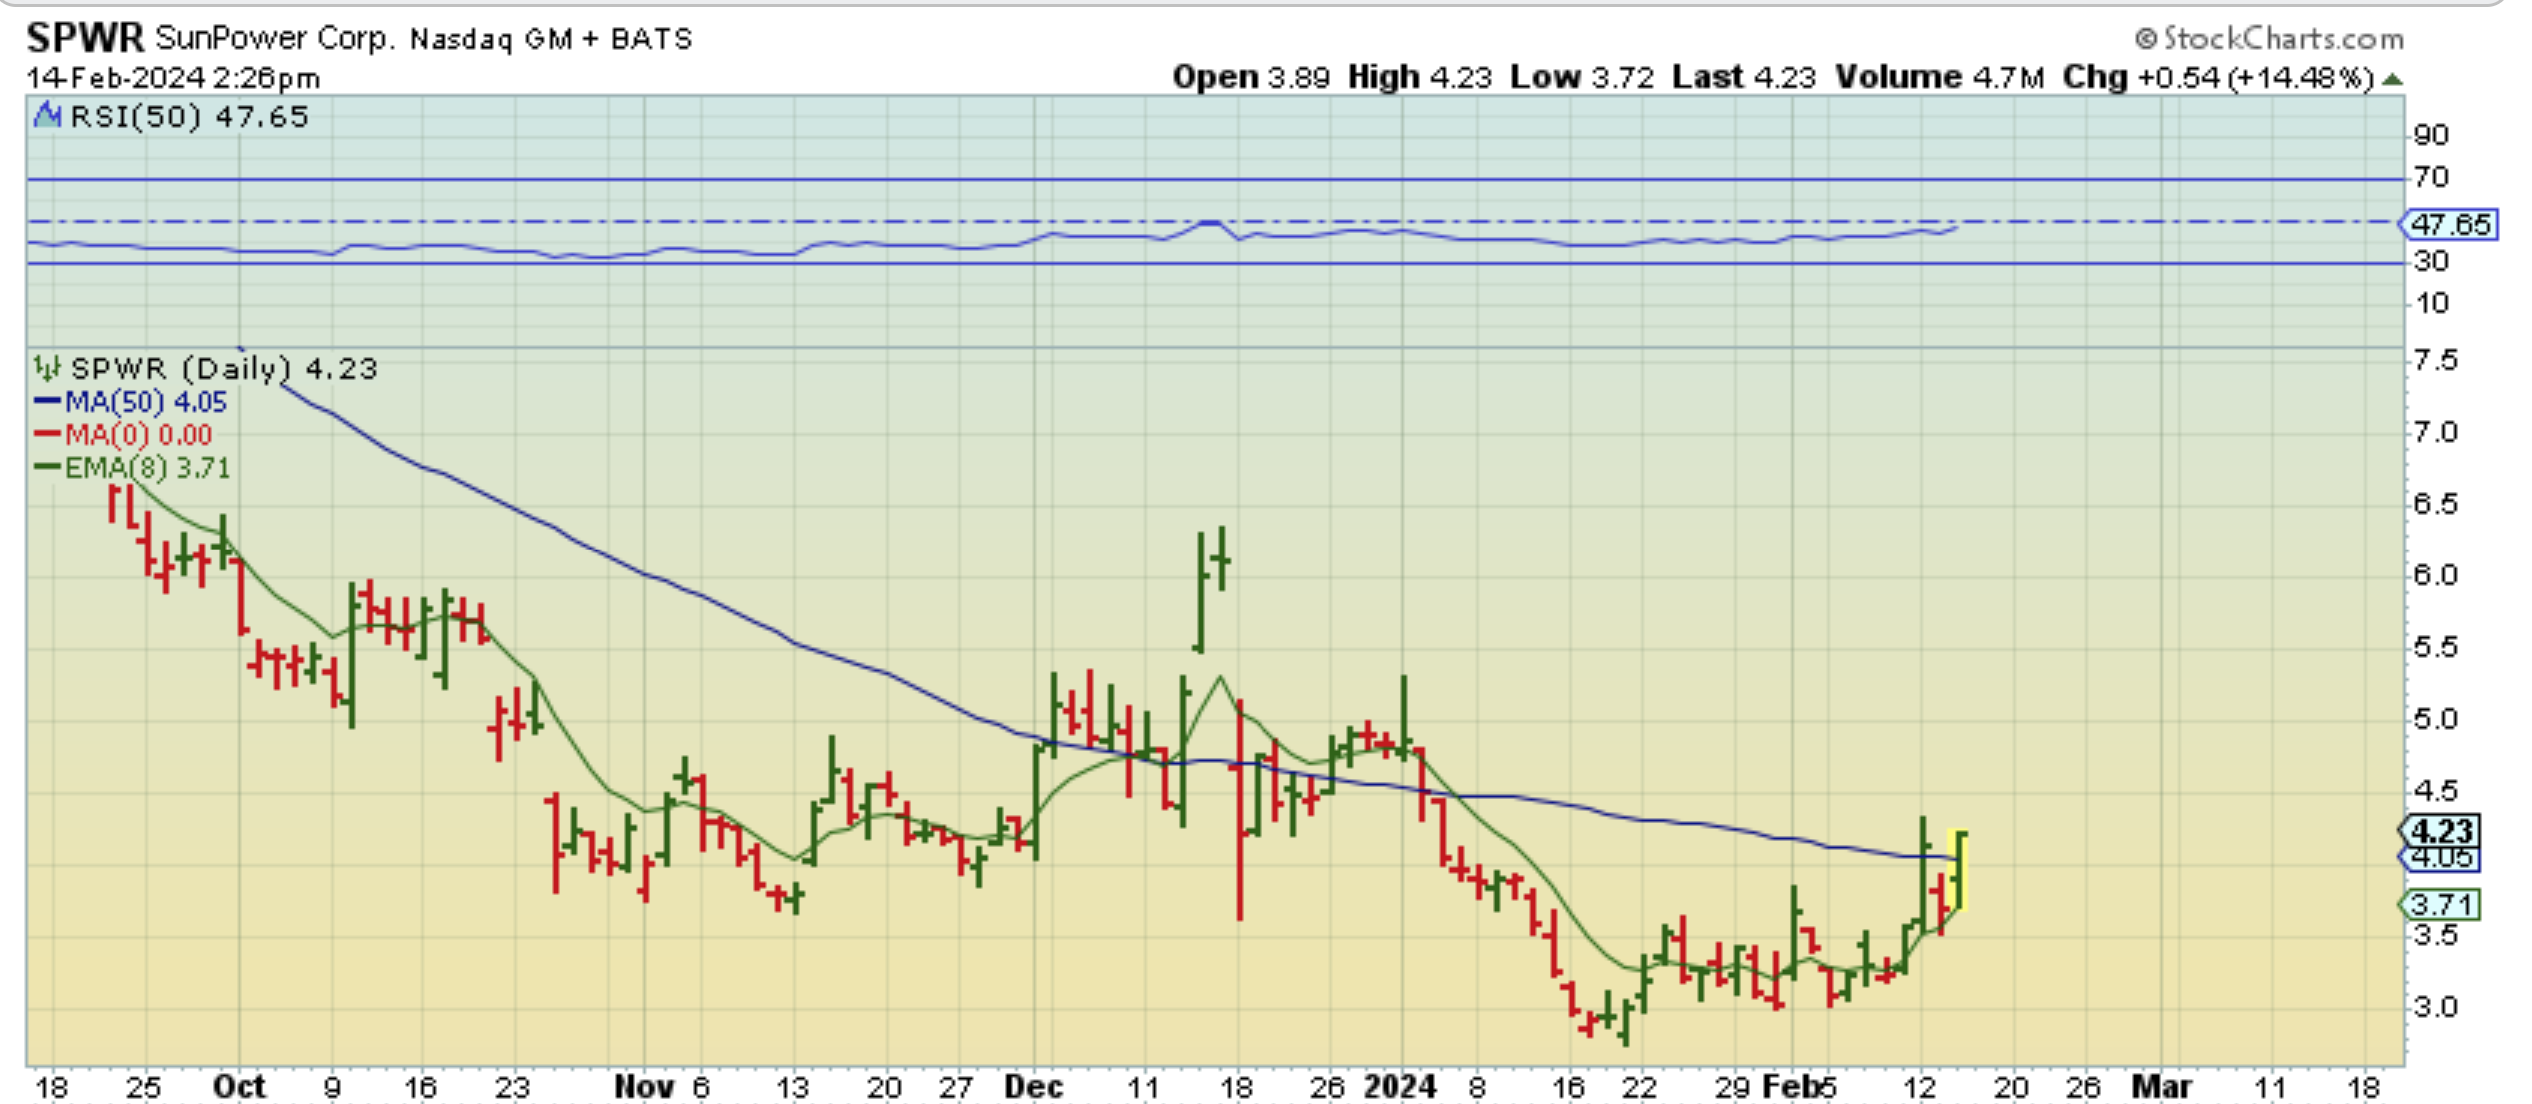
MAXN doesn’t look like much of a move, but this was up 14%, and is a 50sma break out. RUN was up 10%, SPWR was up 14%, etc…
SPWR popped above the 50sma too, and was up 14.48%, so look up your list of Solar Stocks (or the ones that I mentioned above. These are NOT extended, they are buys in this area.
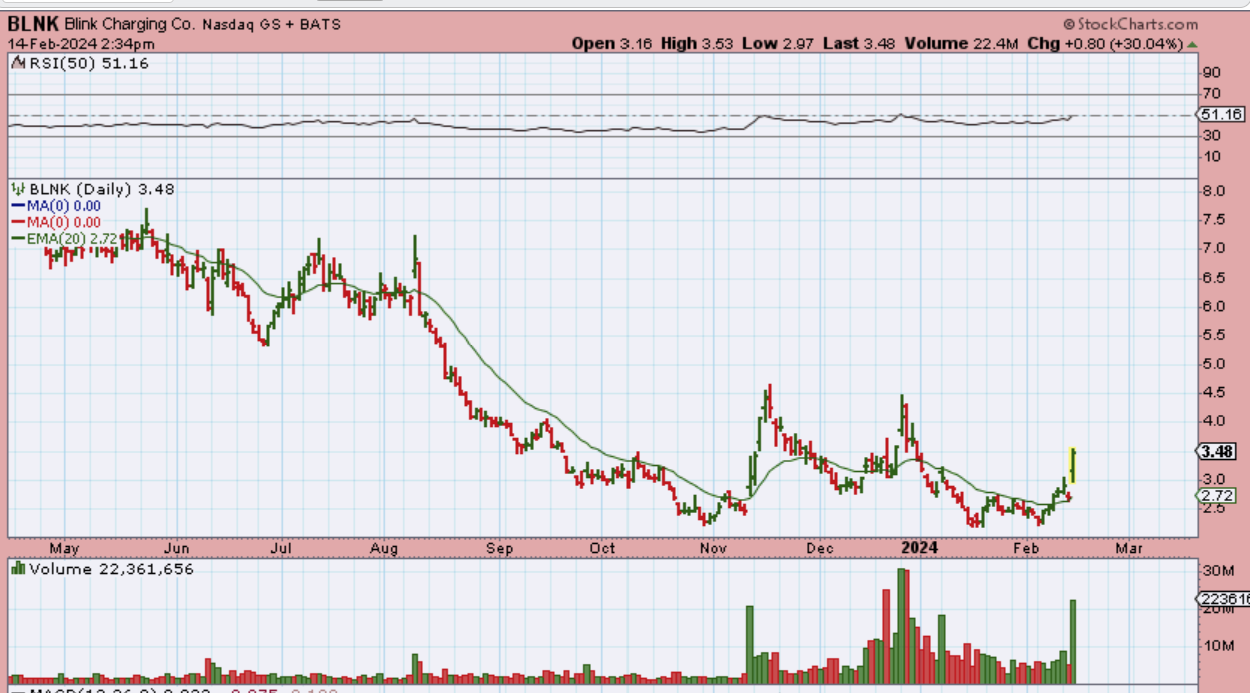
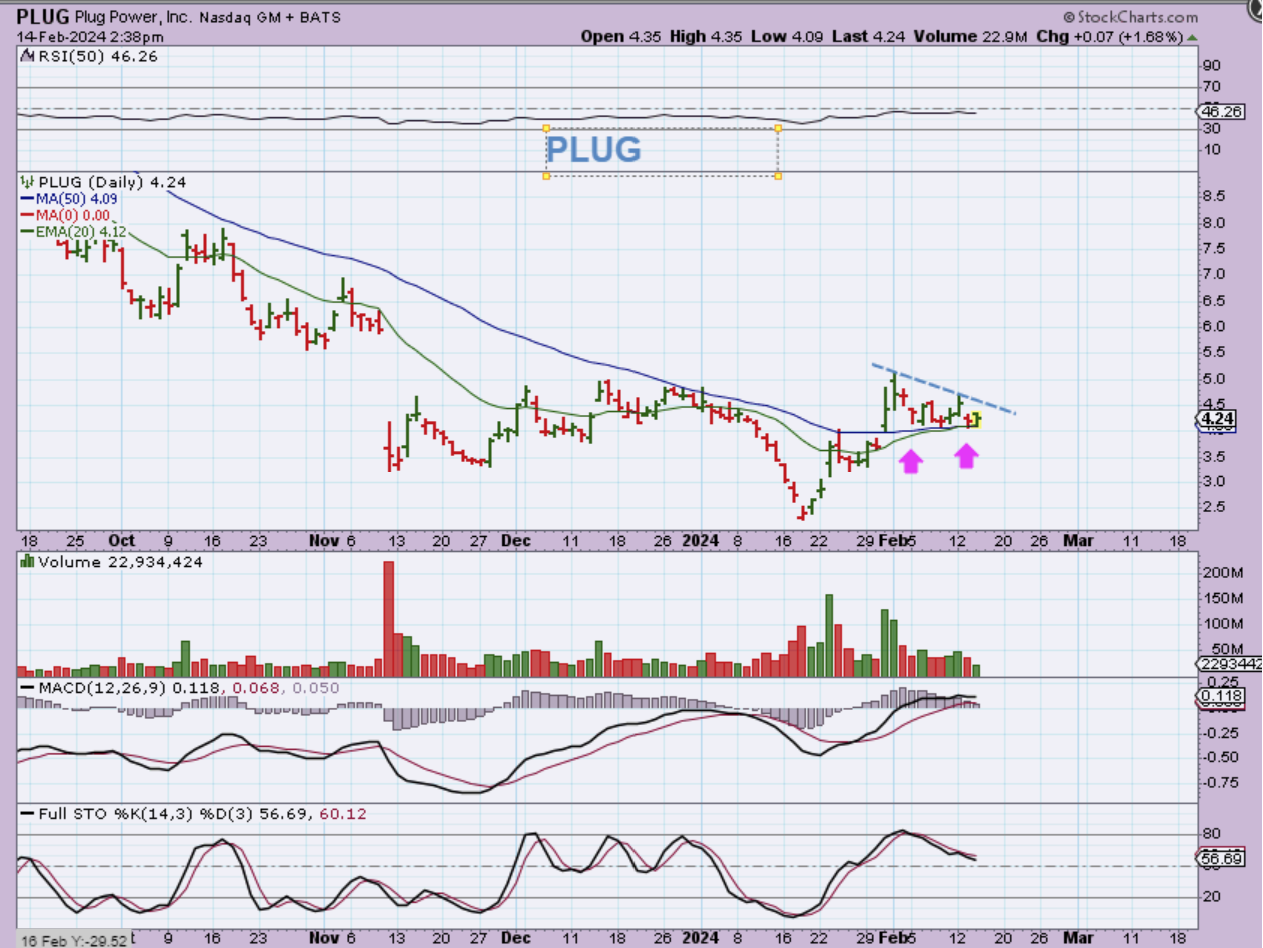
BLNK , FCEL, PLUG and other clean energy stocks seem to be ‘popping’ and bottoming.
PLUG is actually a bullish set up here as it rides along the top of the 50sma. This is a buy in my opinion. That was a $2.50 to $5 run that is consolidating (100%).
.
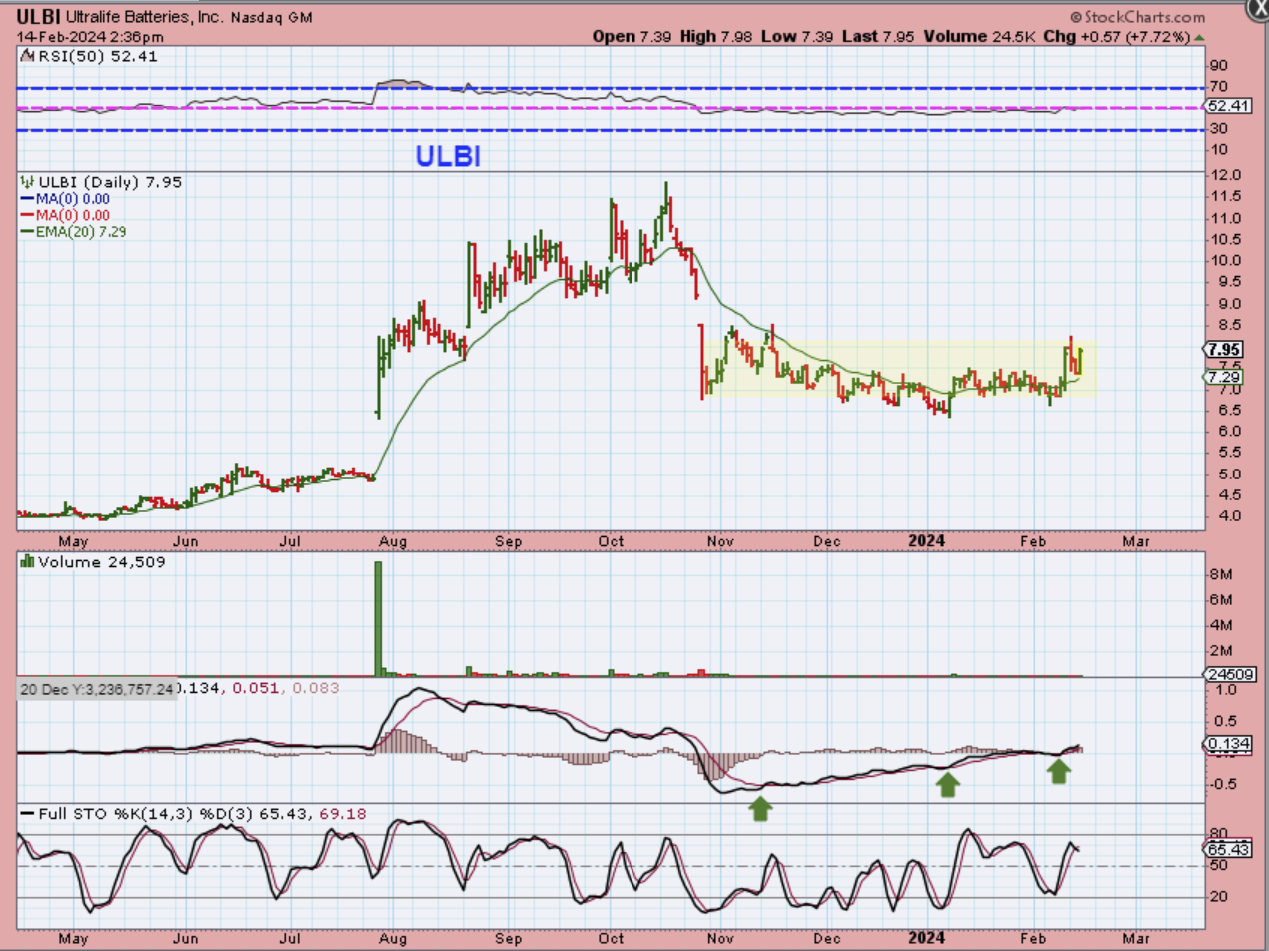
ULBI is on my watchlist and it looks bullish too.
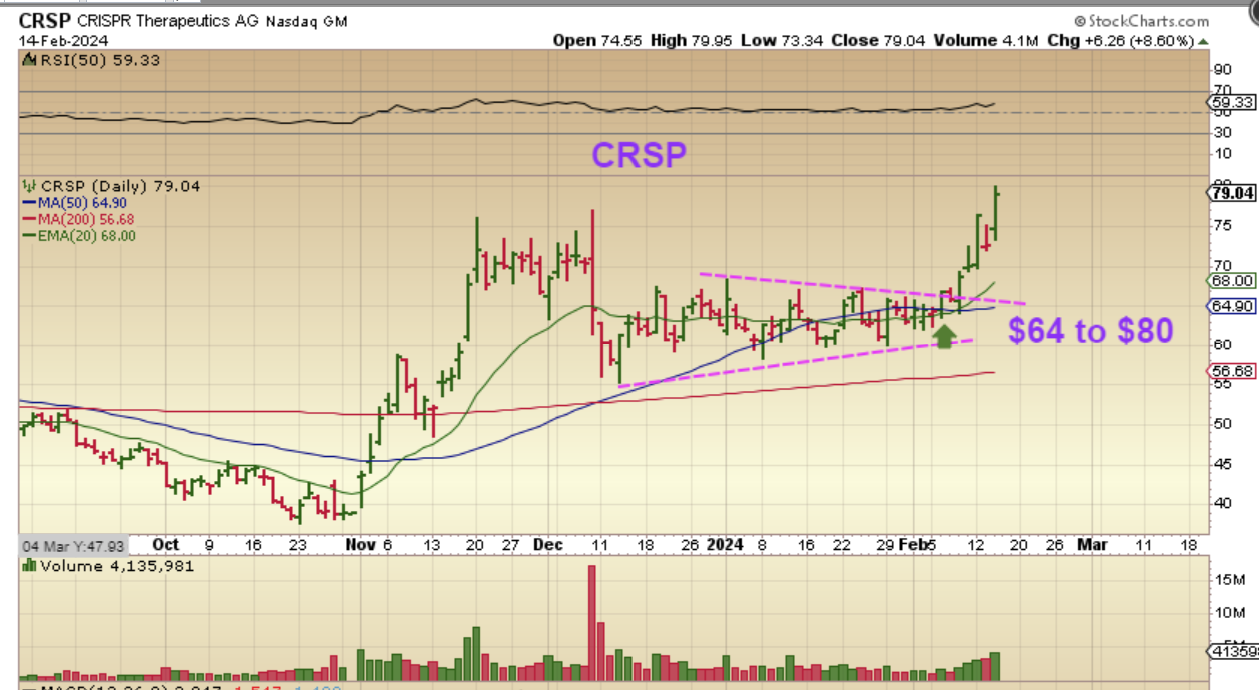
CRSP was a buy here…
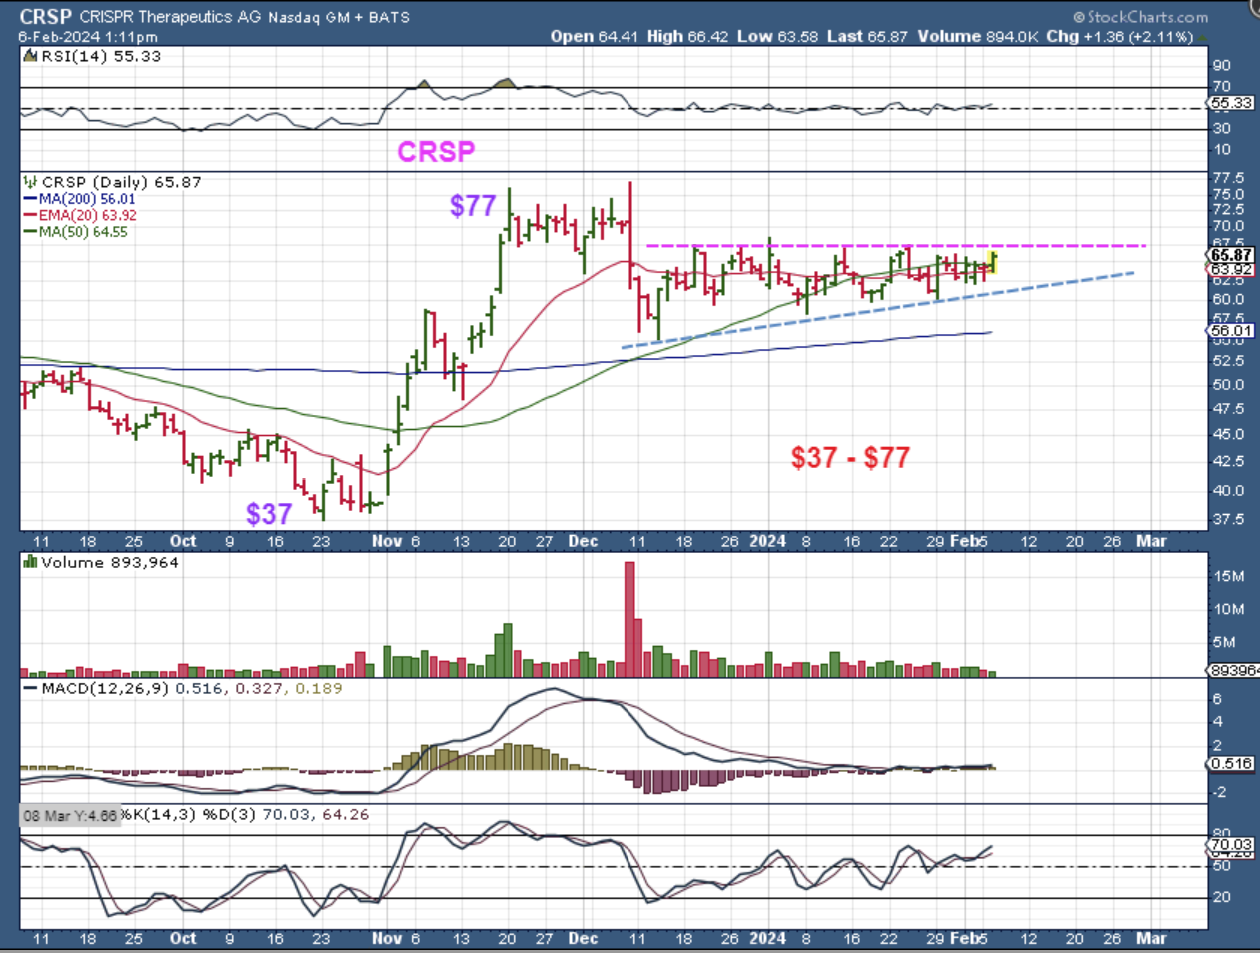
CRSP is running strong…
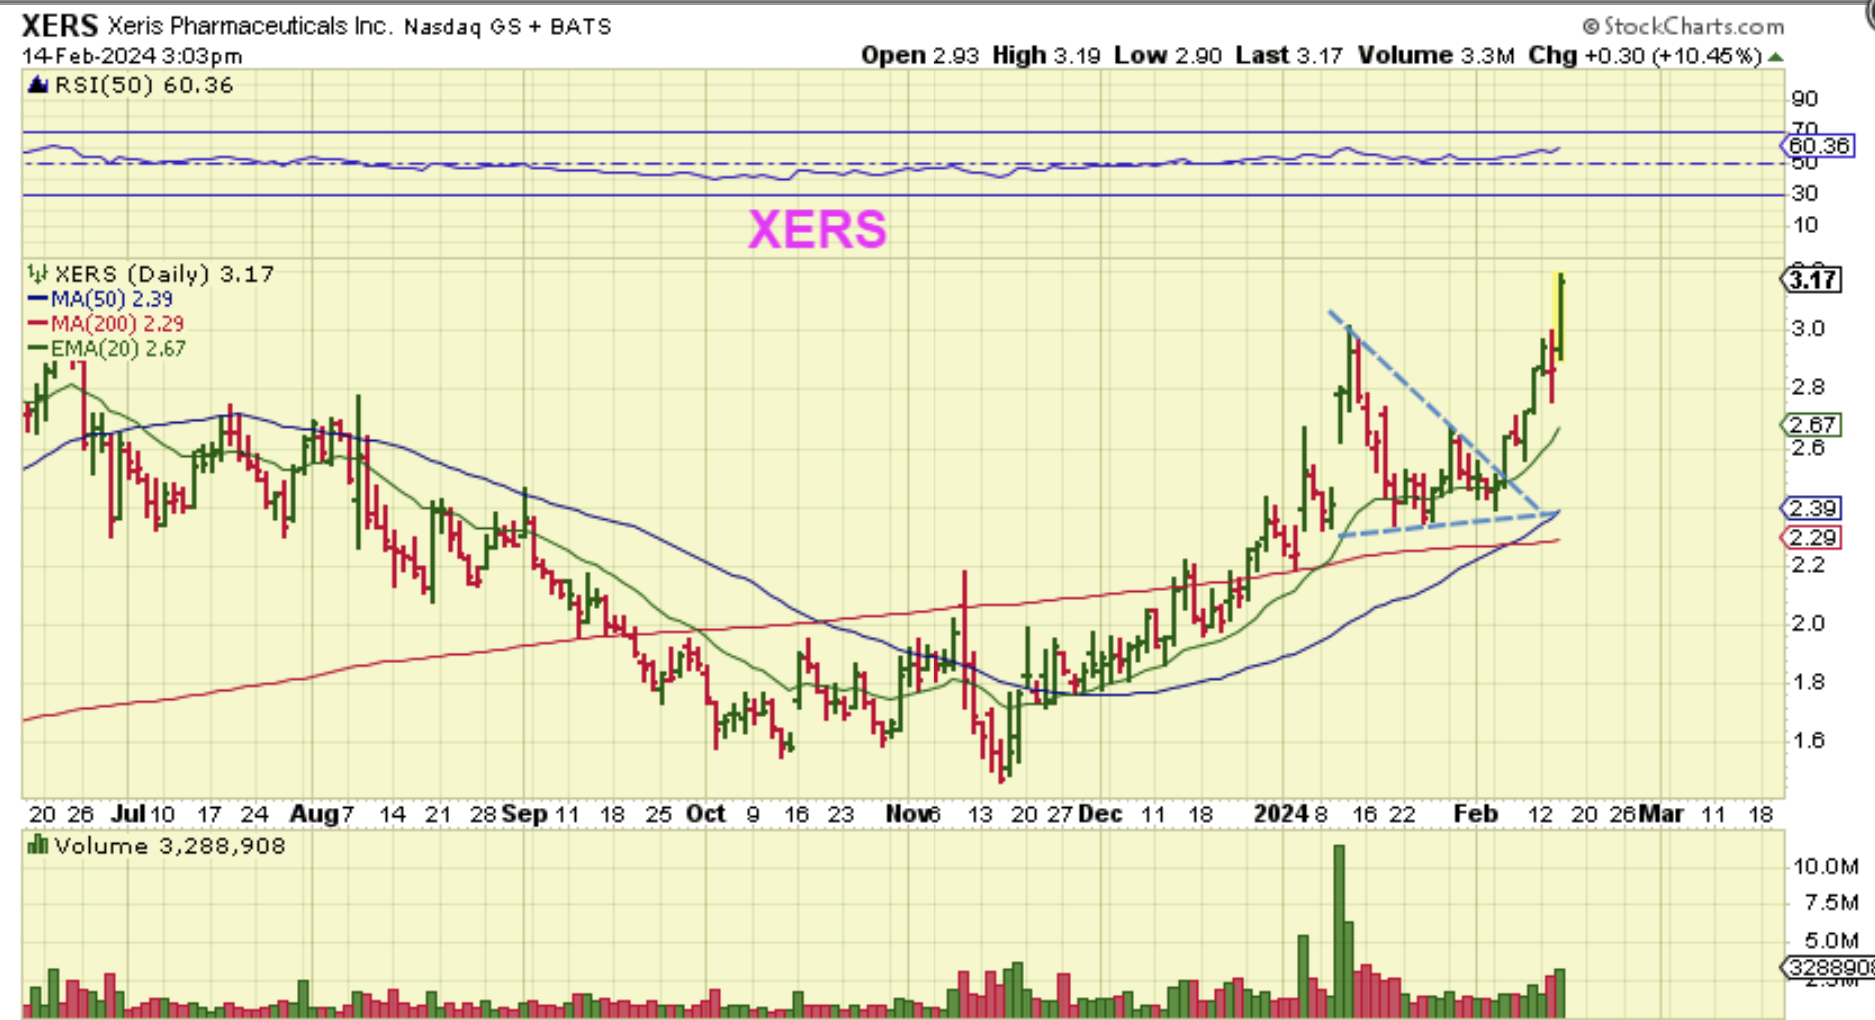
XERS was a buy with this downtrend break.
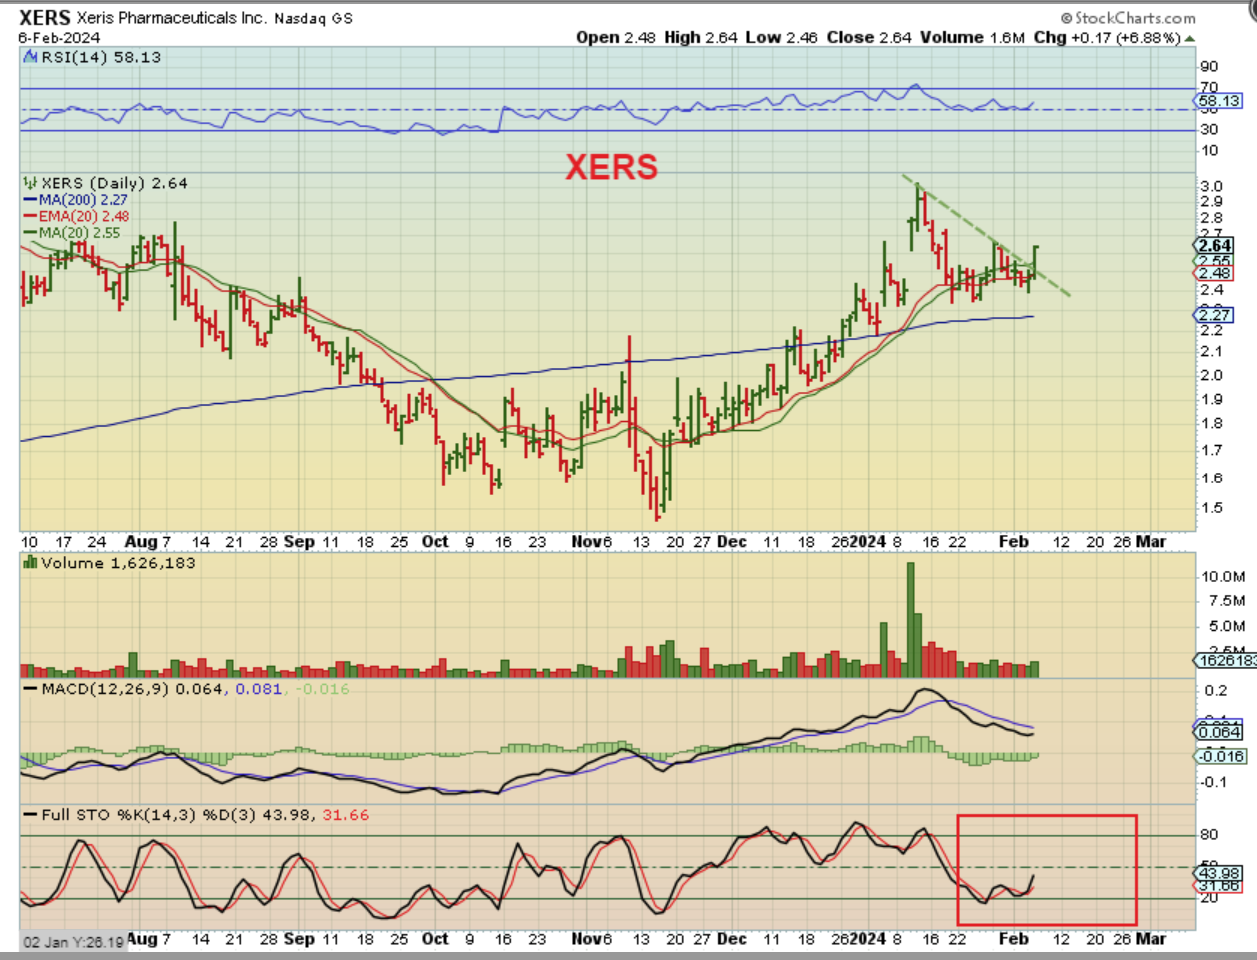
XERS has been running well too.
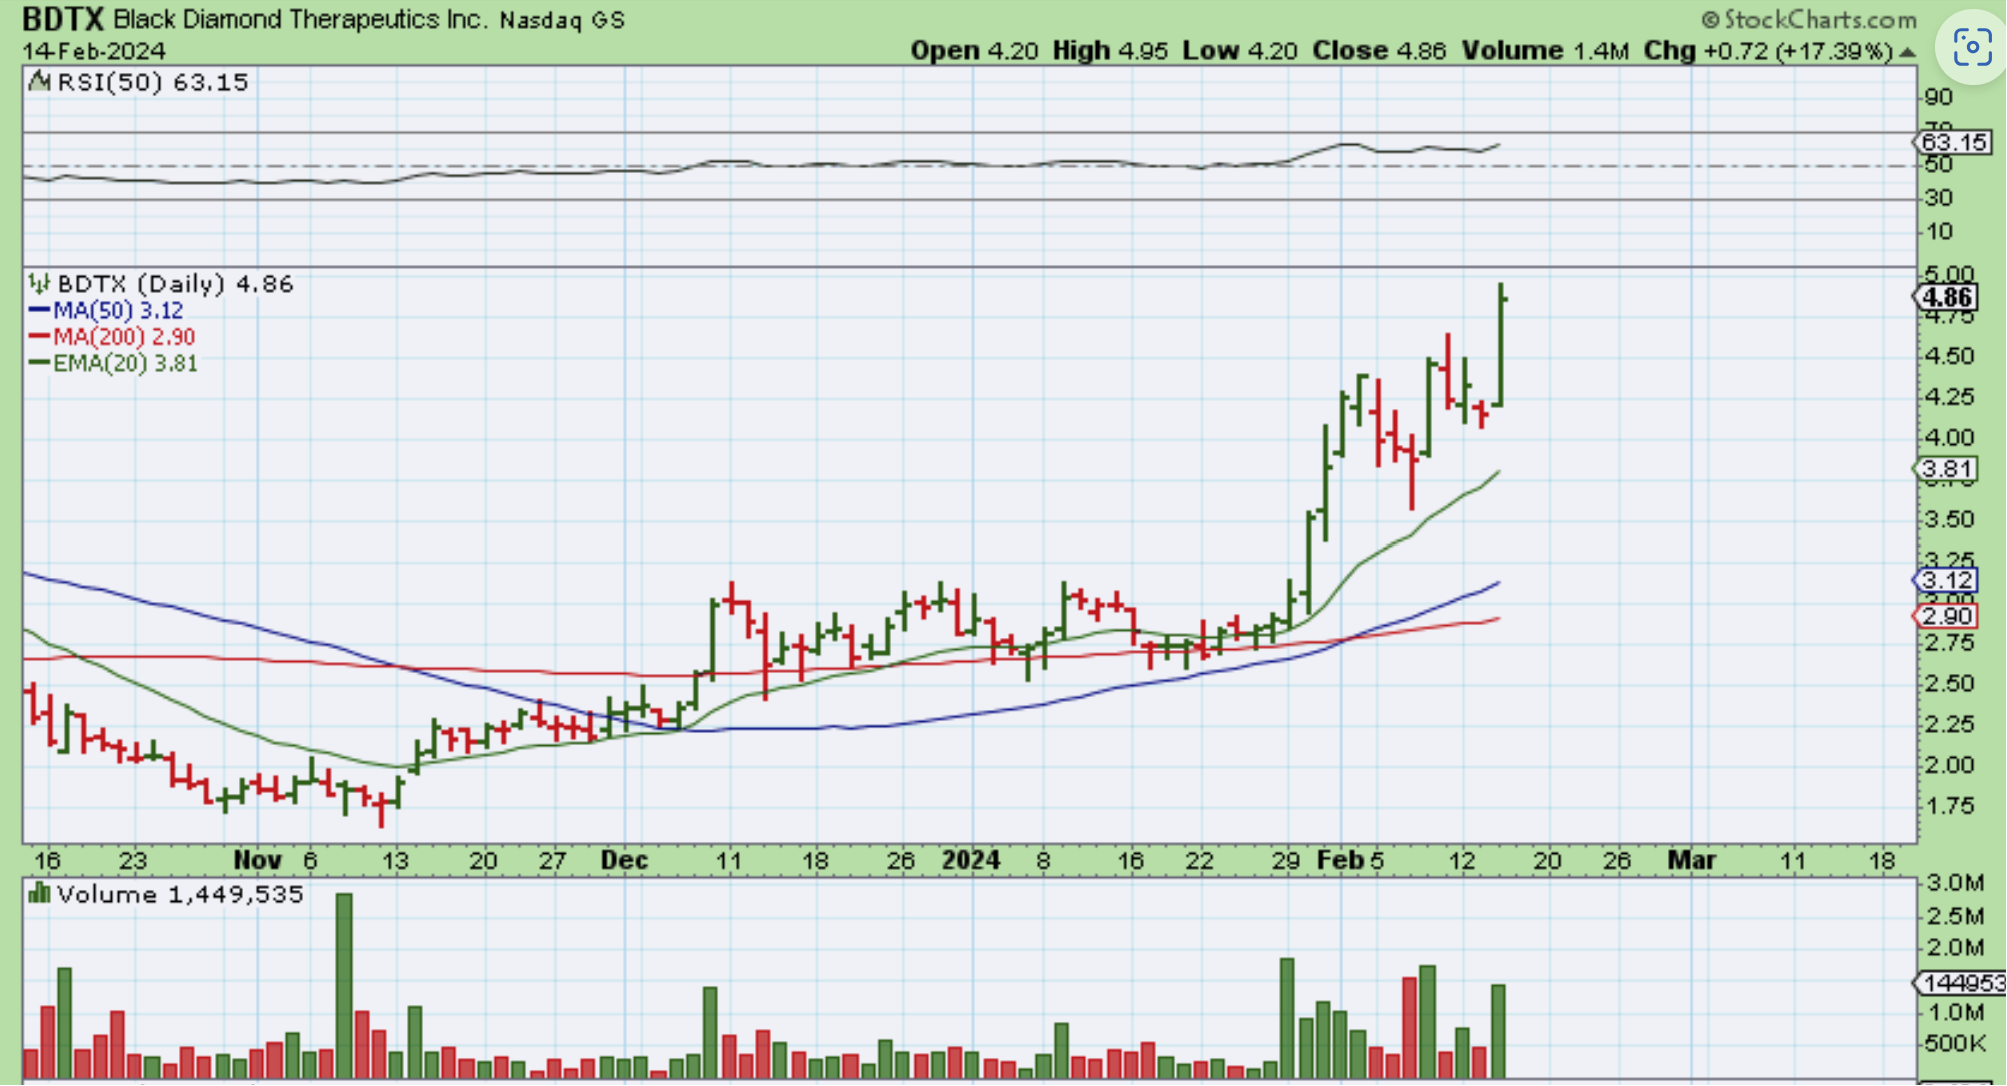
BDTX is running very well too. I think it was Michel that brought this to our attention in the live area. This was like a crypto stock—a rough ride at times, but it is at the highs and had a 20% Pop yesterday, so it was an excellent pick.
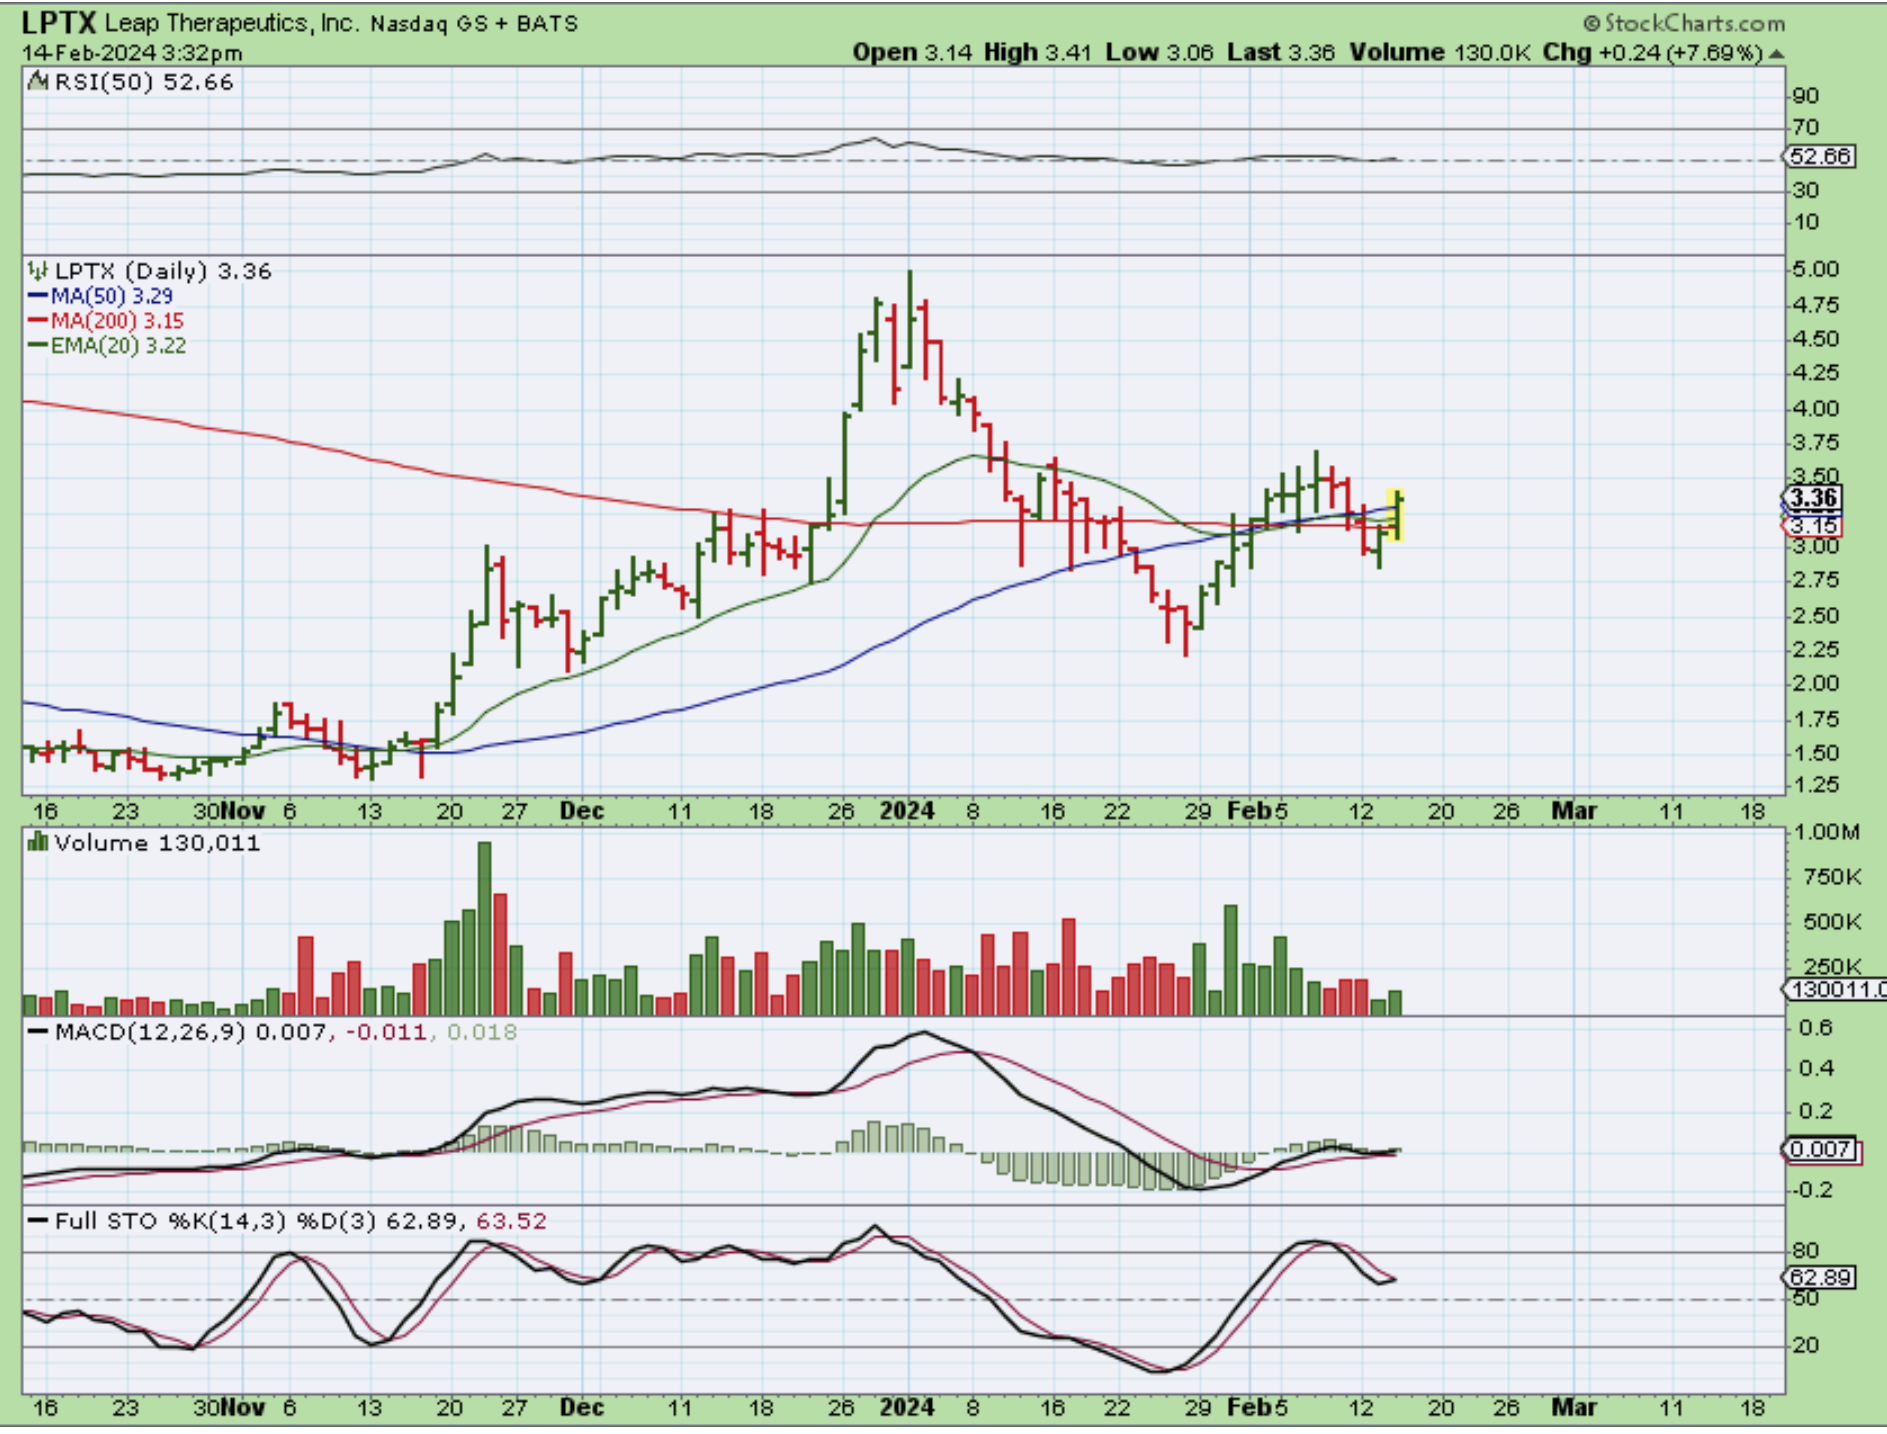
LPTX – This is on my watchlist and I think that it is ready to go, it is a buy. It gained the 50 & 200sma, as well as the 20 ema and it had a nice run November to January. The MACD is bullish.
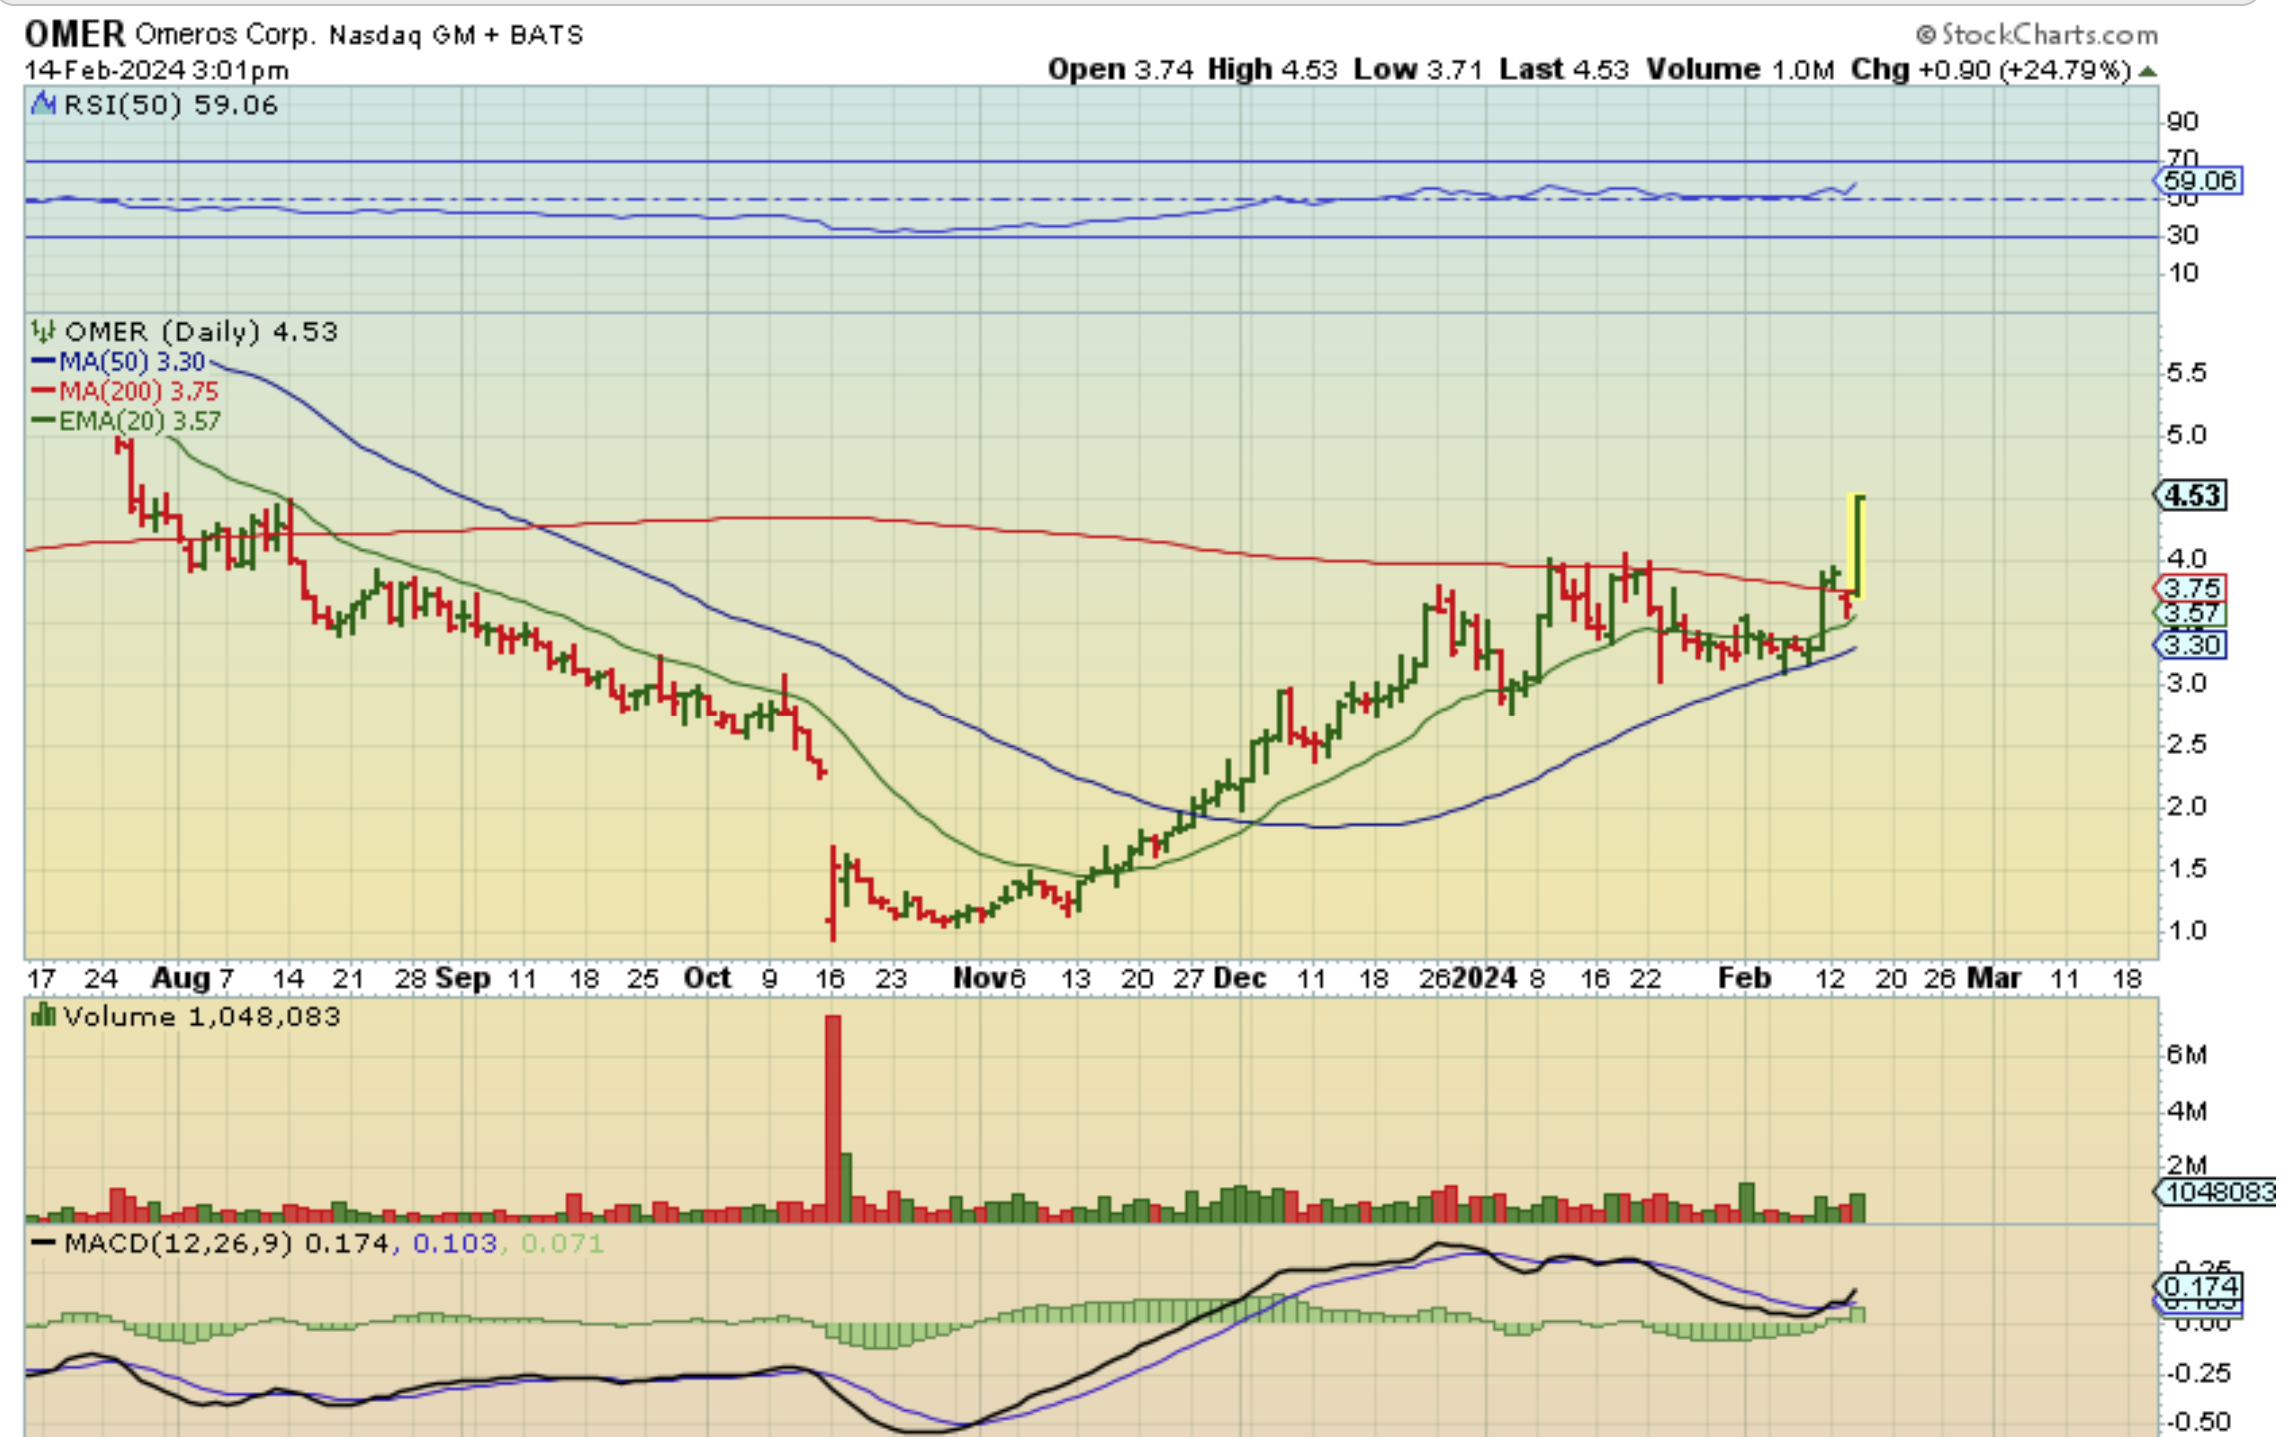
OMER was running under the 200sma, and I was going to buy the breakout. It shot up 25% and I missed it, but this shows the explosive nature of this bullish sector. Buy the dip. This company is Biopharma.
.
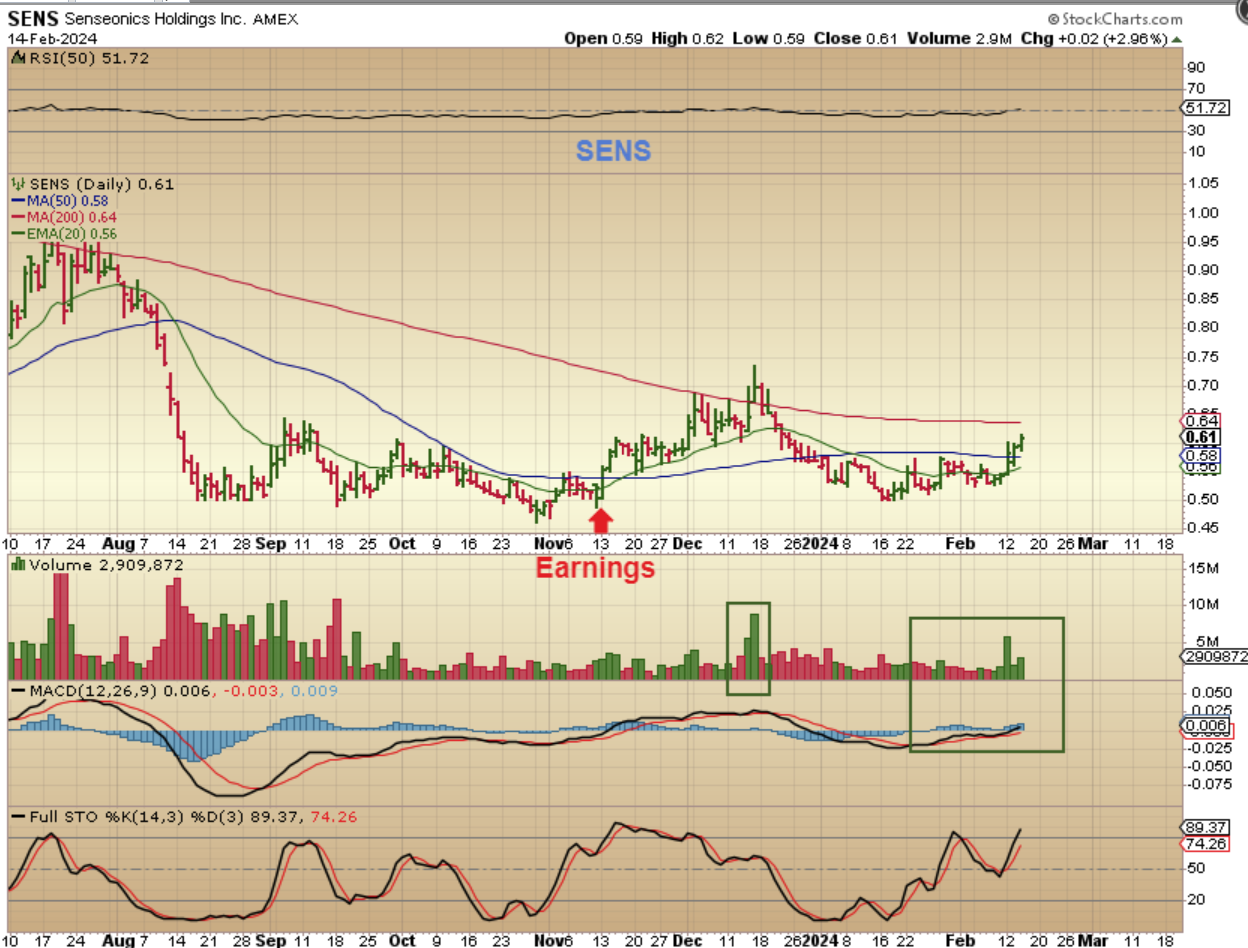
SENS – Some do not like to buy stocks under $1, and this is only 60 cents, but it is a bullish set up too, so I thought that I’d mention it. Senseonics Holdings, Inc. engages in the design, development, and commercialization of an implantable continuous glucose monitoring system for people with diabetes. Its primary product is the brand Eversense, a glucose monitoring device which includes sensors, smart transmitters, and mobile applications.
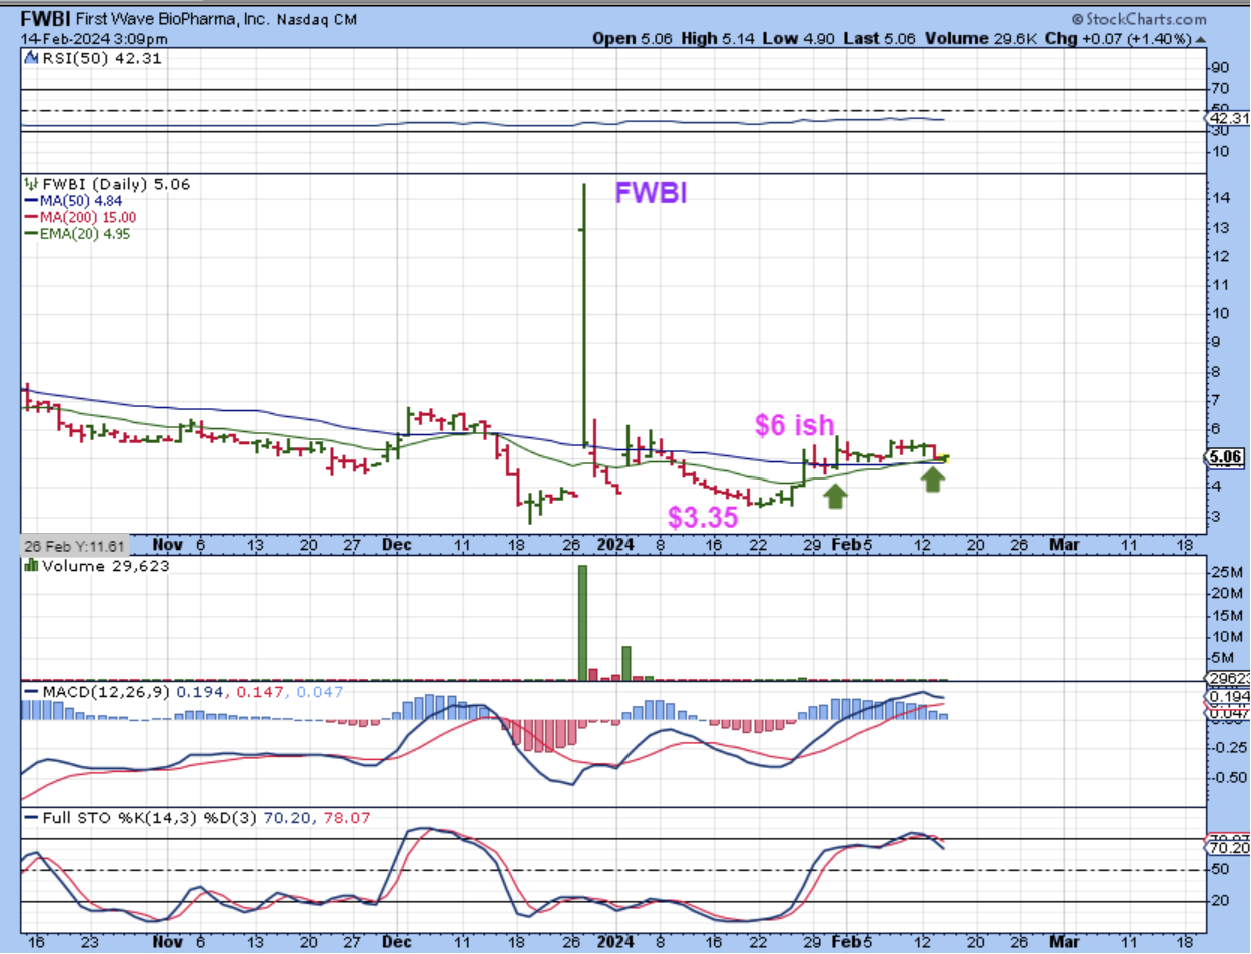
FWBI -This has been riding along the 50sma and I think that one of these days it will run very quickly. They did a reverse split and these can run strong, so put it on your watchlist and if it starts to rise up off of the 50sma, it may be ready to go. I was thinking of…