
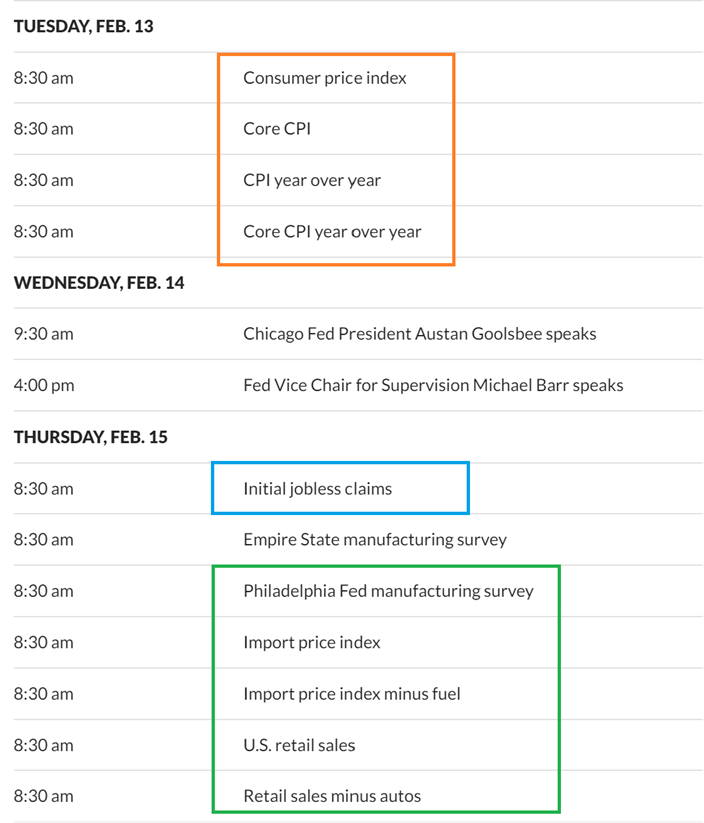
Tuesday February 13th
DATA – We do have Market moving Data this week. To be honest, lately the inflation data and Jobless Claims, Fed Mtg, etc have all been followed by the markets running higher, but we need to remember the ‘timing’ of the daily cycles too. Coming out of an ICL or DCL, we would have had plenty of time before a dip was due. With that in mind, we do still have ‘some’ time, but a dcl will come due soon, so I will cover the General Markets specifically with that in mind. This DATA CAN push the markets higher, but time is running out too…
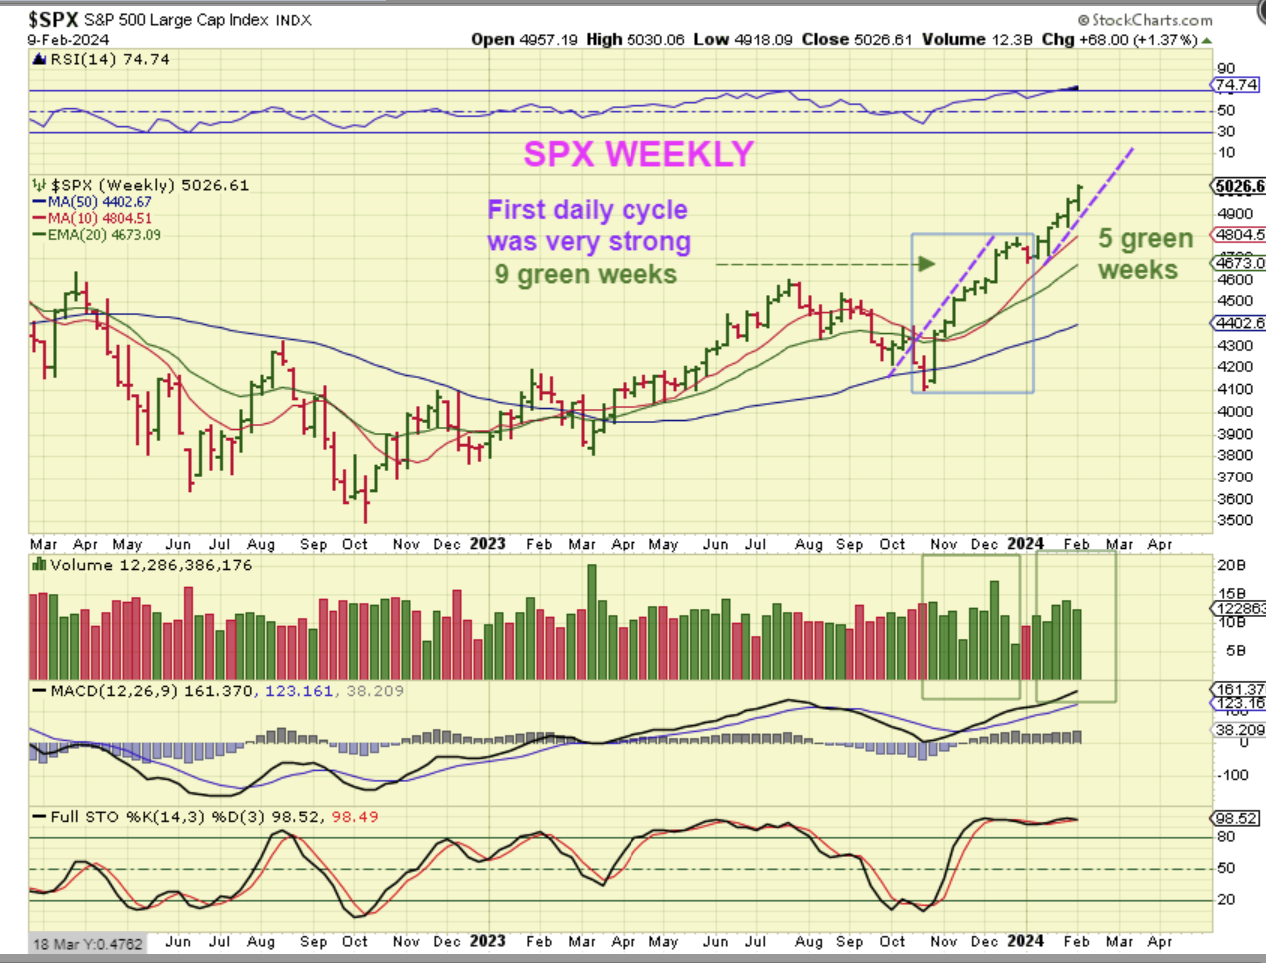
So to start I wanted to point out the undeniable strength in our 2 daily cycles out of the ICL.
.
SPX WEEKLY –Notice 9 weeks higher out of the ICL, a 1 week dip. and then 5 weeks higher out of that dcl and this is week 6. Could we do another ‘9 week run’ and then a 1 day dip to a dcl? I cannot say no, so we’d use a trailing stop, but this is week 6 and we’ll look at the daily charts for clues…
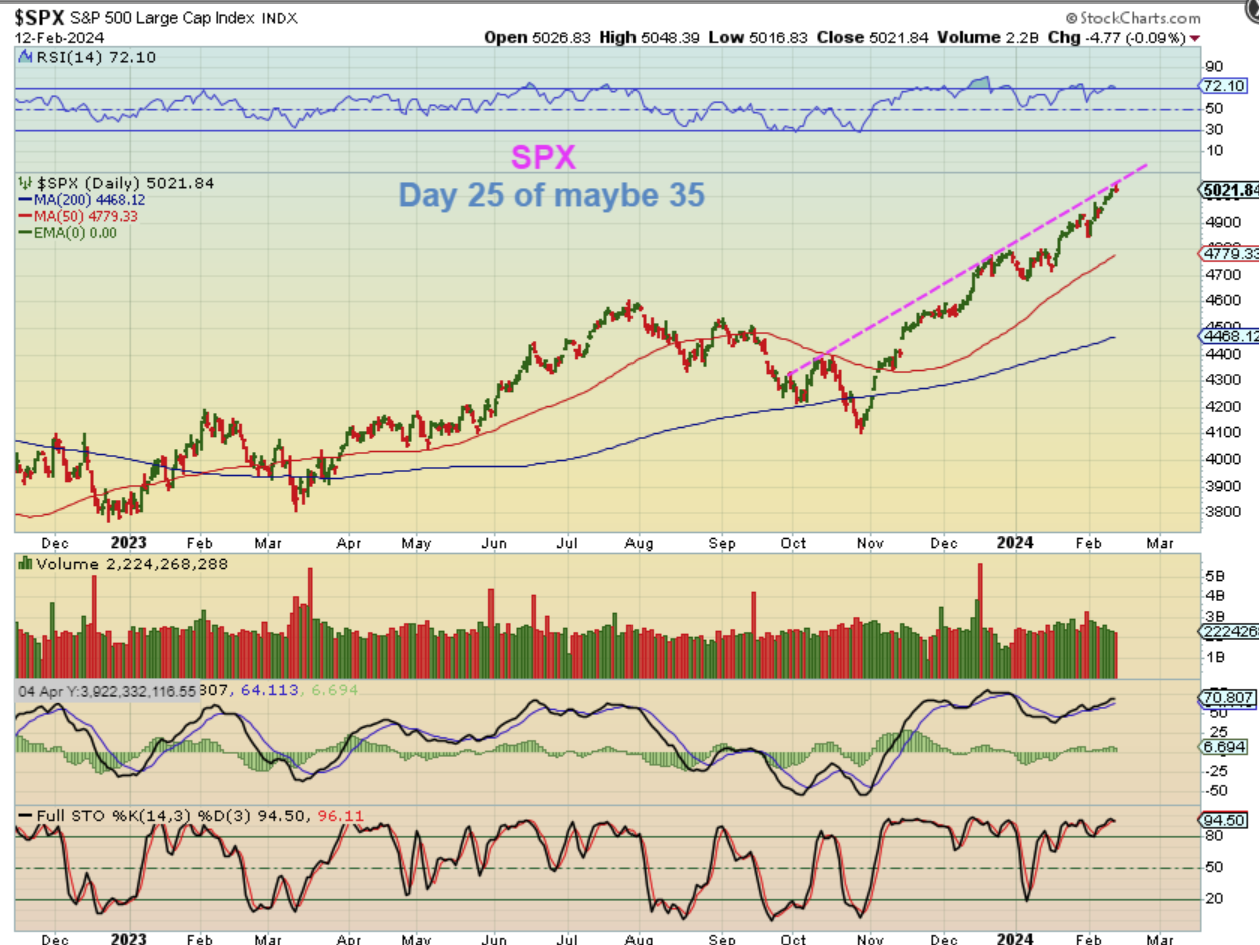
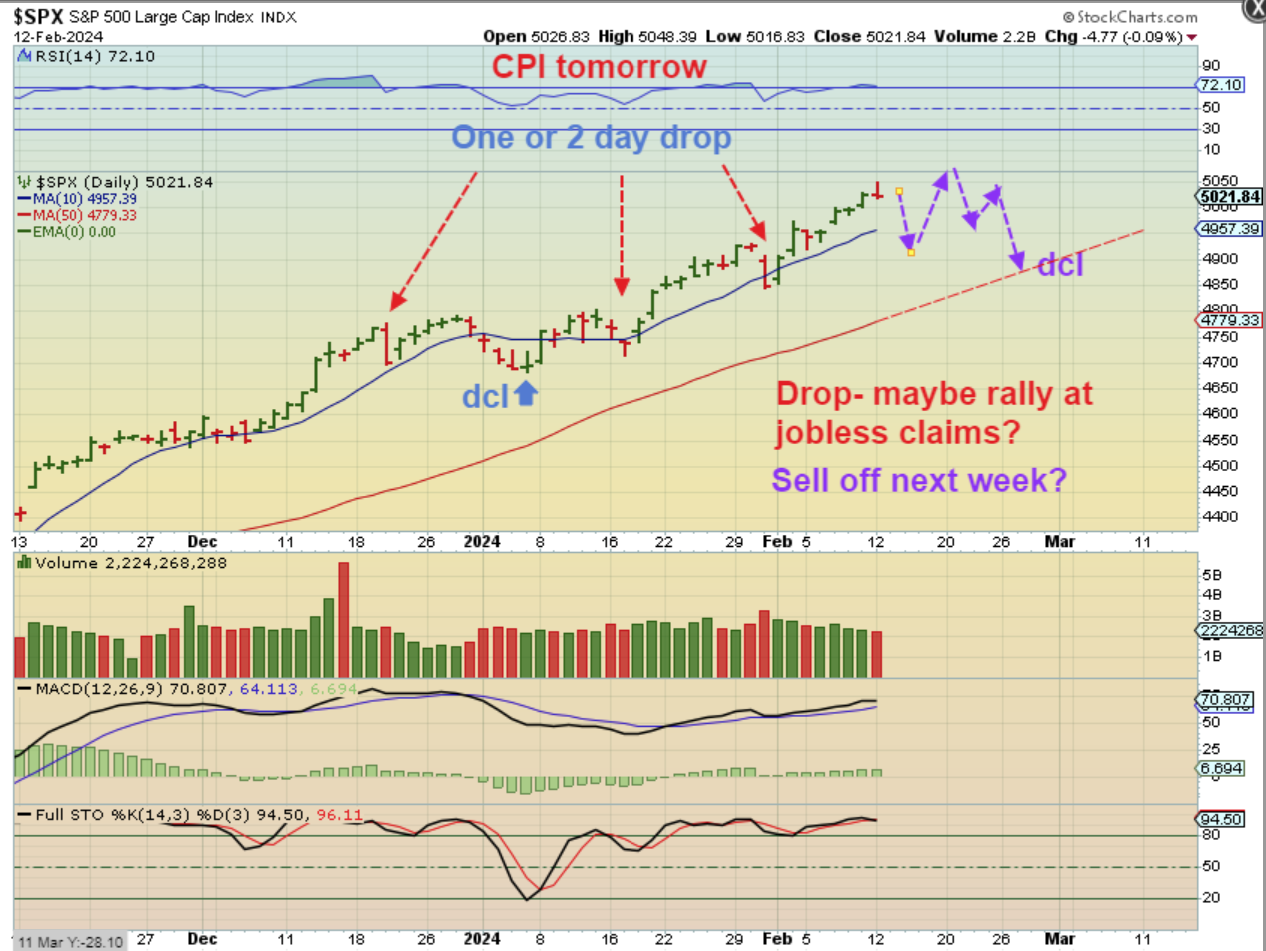
THE SPX Daily shows a very steep climb and we are on day 25 of 35 or 40 (maybe even more). It CAN keep climbing, but let’s just be aware of the timing and possibilities.
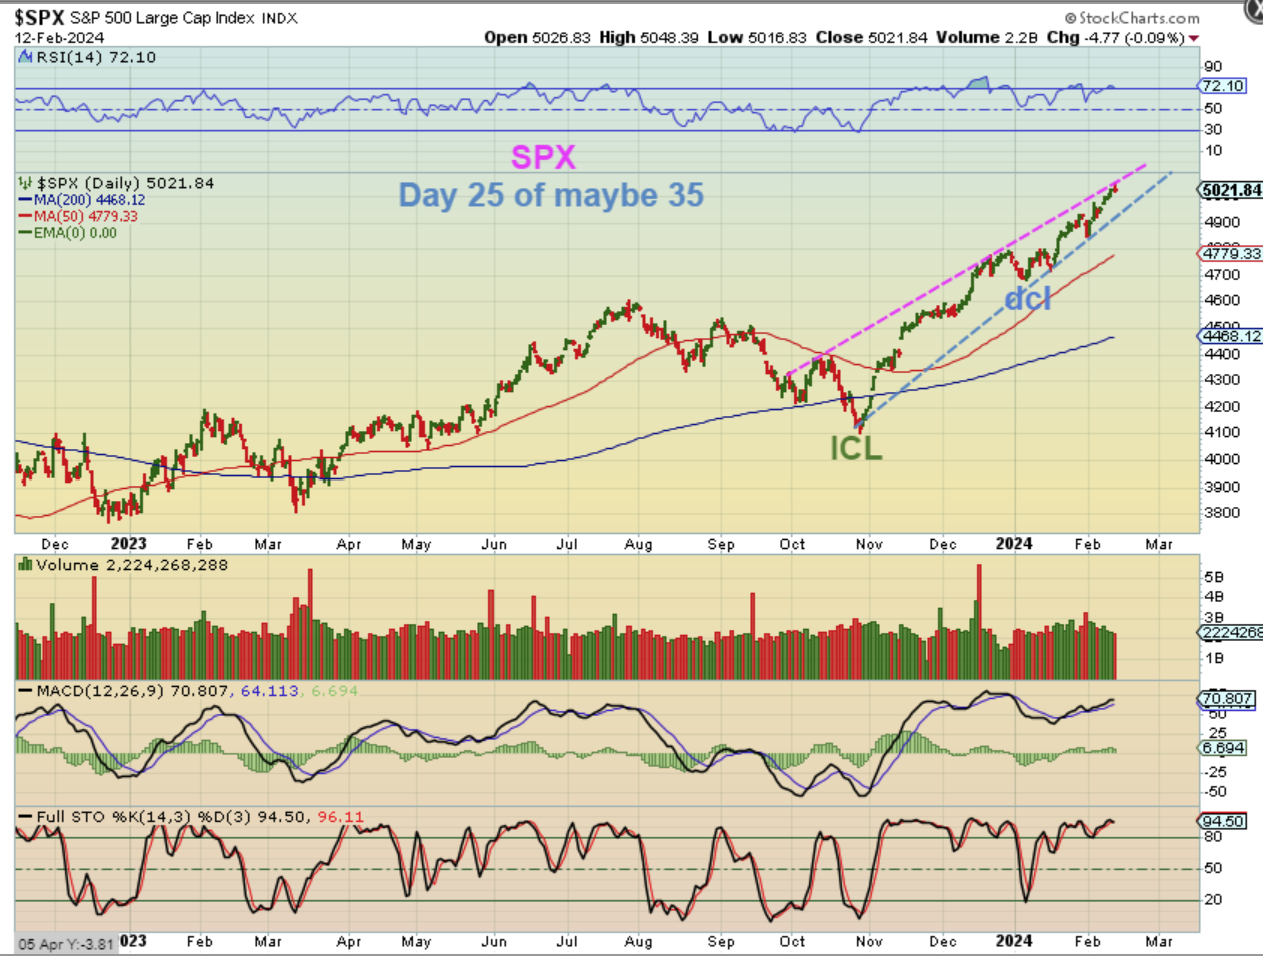
SPX – As a cautionary note, the move from our ICL to our DCL to now resembles a bearish rising wedge, and they are bearish because they are unsustainable. Again, it can go higher in this apex, but for how long? We’ll see.
.
JUST 2 IDEAS – 2 GUESSES, but this is not a prediction, it is just an idea of how things might play out with our DATA and dcl coming down the road: This is what I do to prepare me mentally for what may happen.
.
SPX #1 Guess – We have seen 1 day drops to or through the 10sma, and then it bounces back. Monday was a pop & Drop, so
1. Could we get a 1 day drop on CPI Data,
2. And then rally back on the Jobless claims
3. And then roll over into a dcl next week? Maybe. I’ve drawn that here.
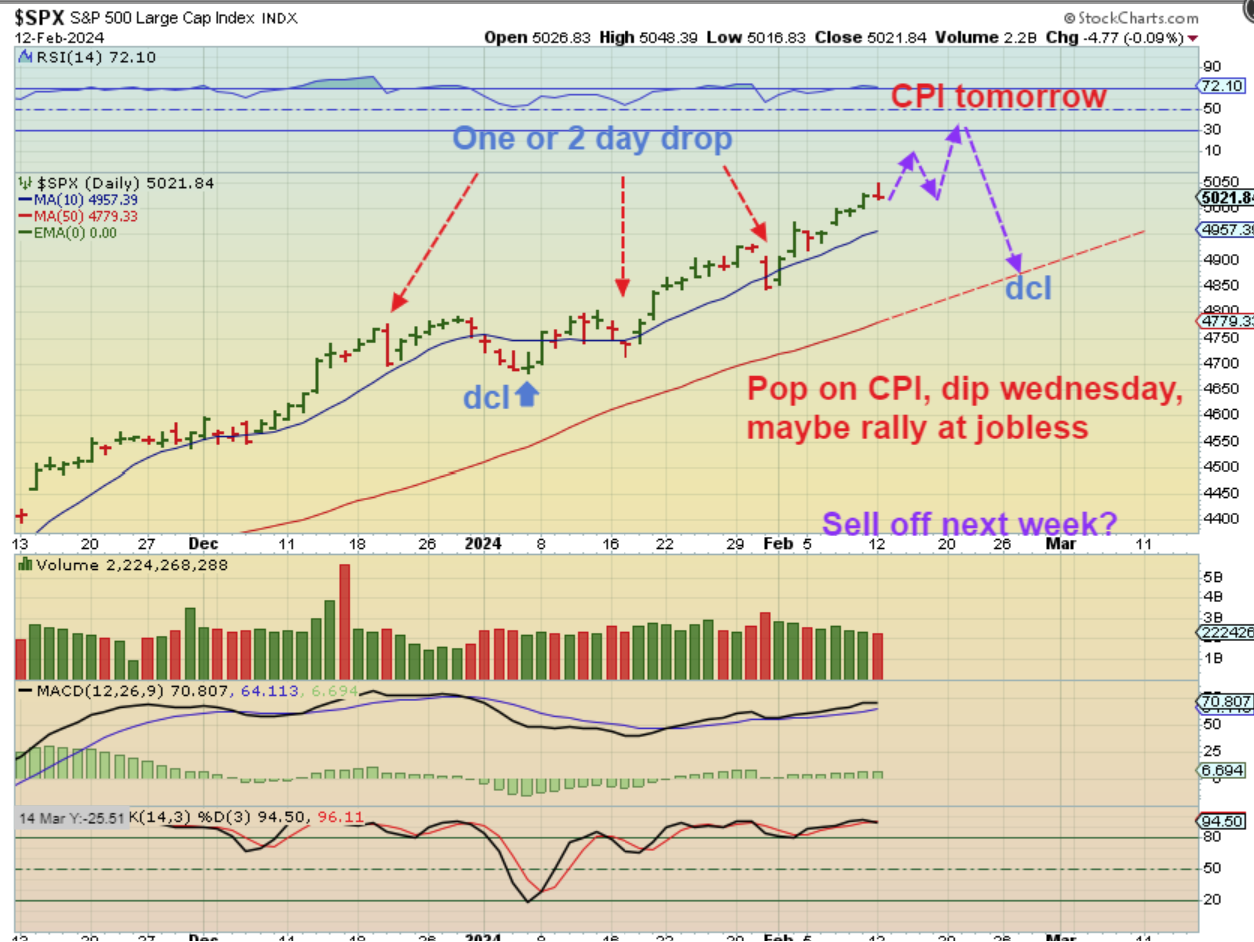
SPX #2 Guess – We could rally if the CPI looks as though Inflation is weakening.
1. We could run higher this week on CPI & Jobless Claims,
2. And then roll over next week.
.
TIME WILL TELL, but our stock picks and trades are still running higher, these markets are very bullishly inclined, and I’ll review a few of the trades that we have had at the end of the report.
.
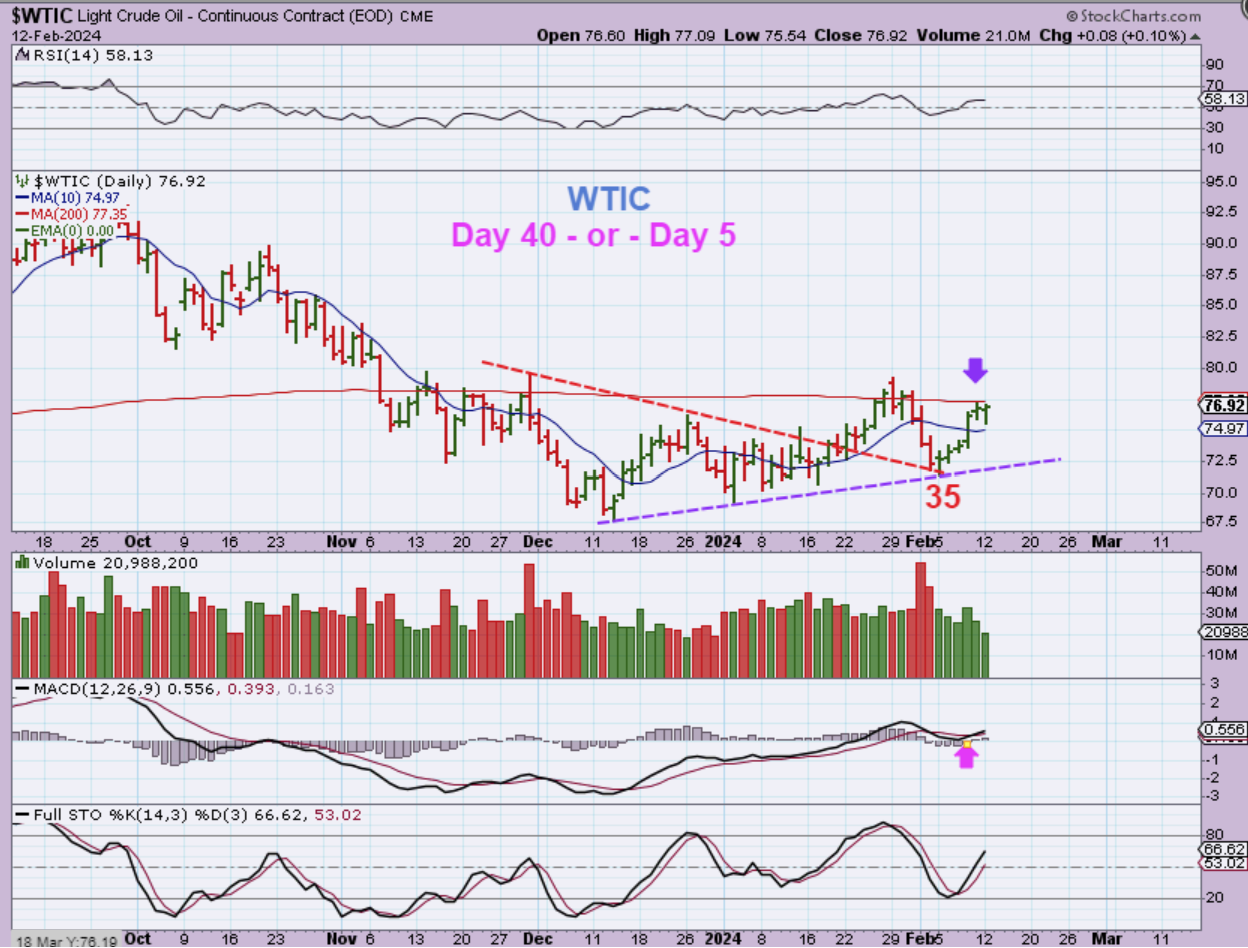
WTIC is at resistance, as expected. Where it goes from here will tell us if we have that day 35 dcl, or one more trip lower. I did say that it looked like capitulation selling into day 35, and good volume moving higher. The MACD and RSI became Bullish too, so we might have a dcl here.
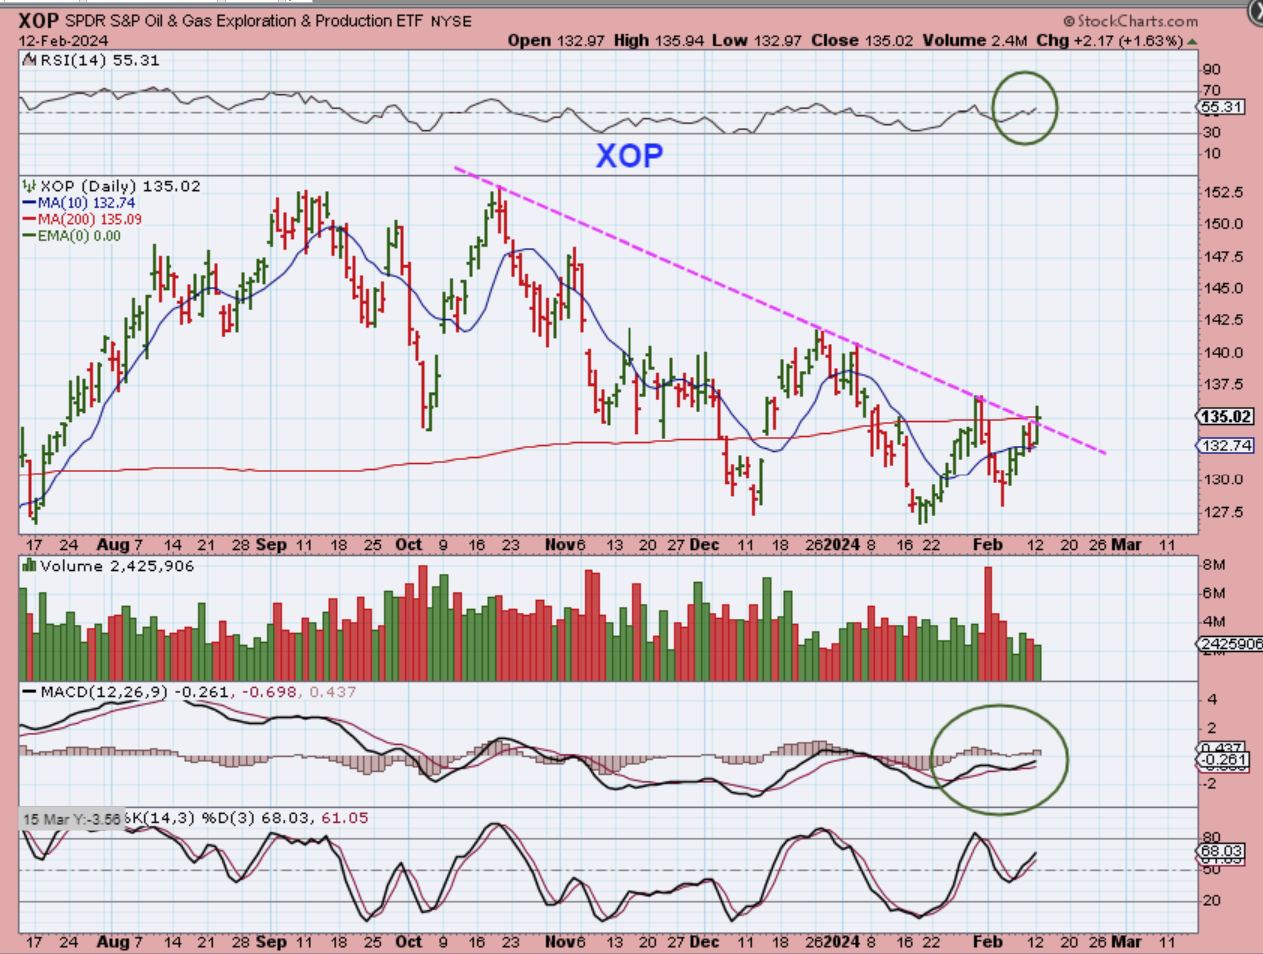
XOP – The Oil Stocks are trying to breakout above the 200sma and downtrend line. That breakout is bullish. That may be giving us a clue that OIl did put in a dcl. This is a bullish looking set up and GUSH is the leveraged trade.
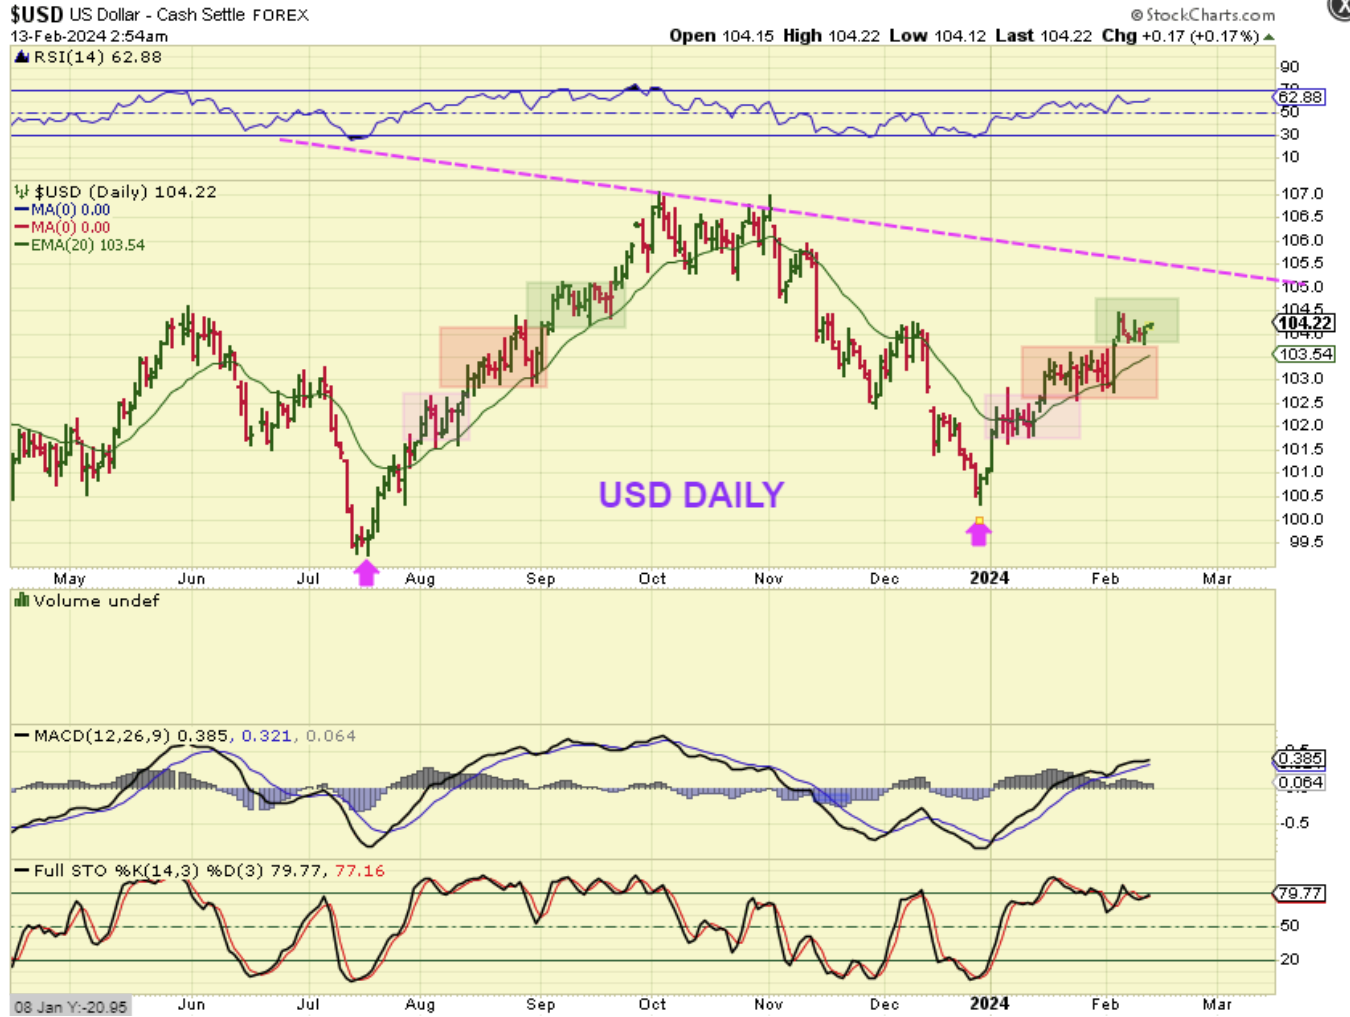
The USD continues to move higher, but is also choppy and sideways at times. I have pointed out that 105 is a possible target and this run looks similar to the last run out of an ICL.
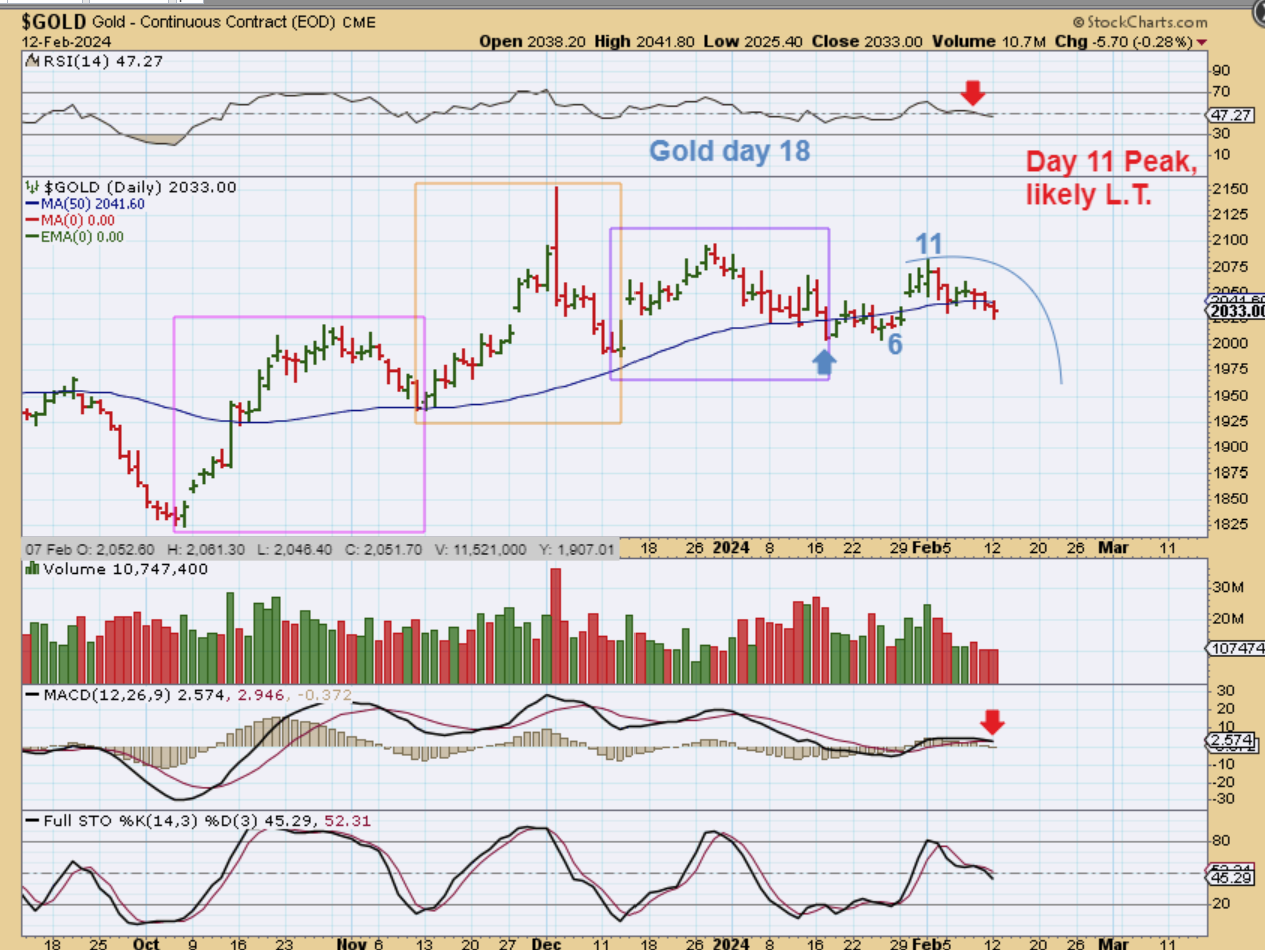
The USD bumped higher and GOLD dropped slightly lower, but it also lost the 50sma. With a day 11 ‘peak’ and it being on day 18, Gold could be starting to weaken and starting to drop into its next dcl. It is also possible that CPI Numbers cause a POP, but I really do not expect a rally.
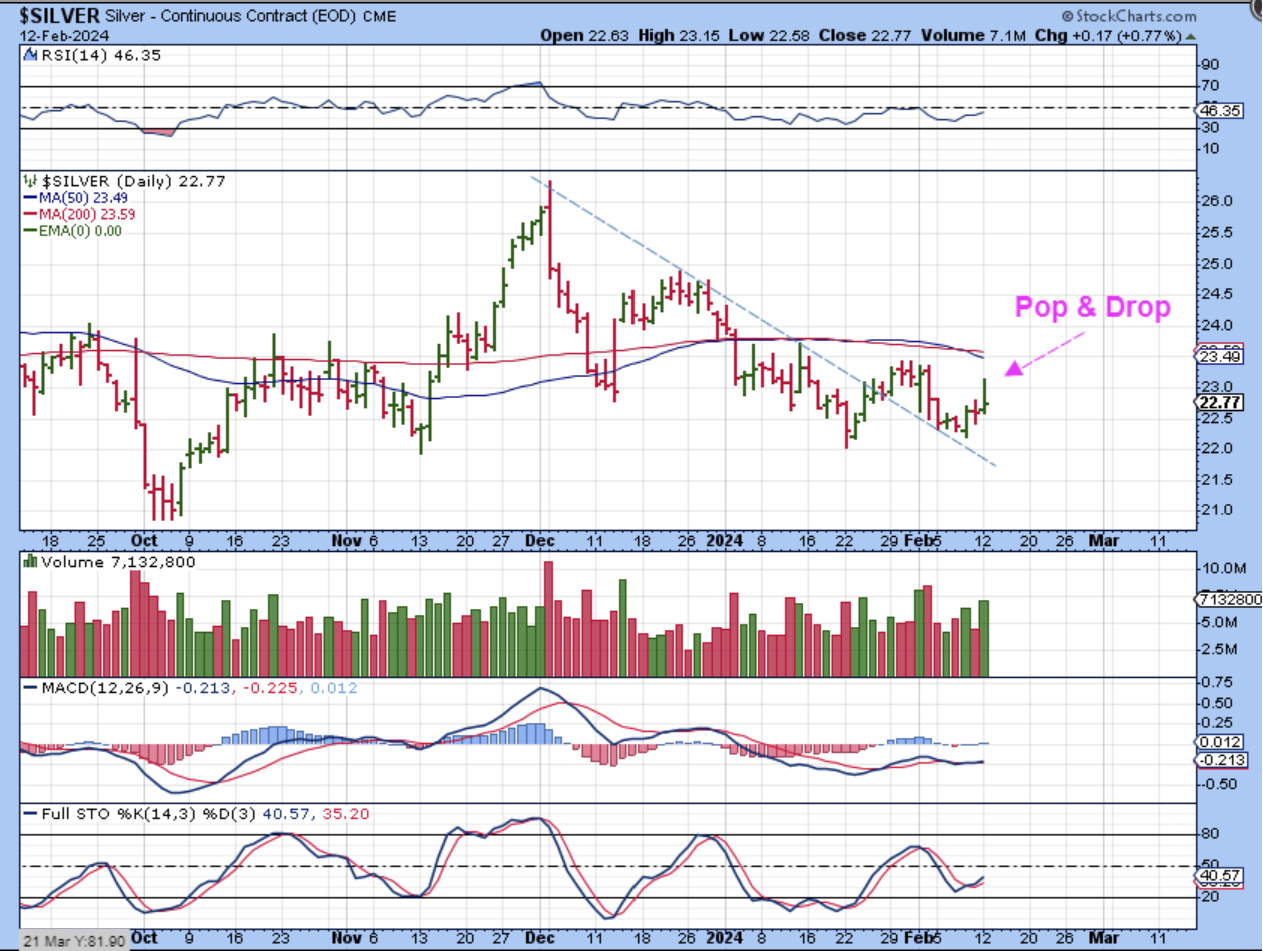
SILVER did a surprise Pop on Monday morning, and I captured this chart. I didn’t expect it to get above the 50 & 200sma, but it was interesting seeing Silver do this with Gold down.
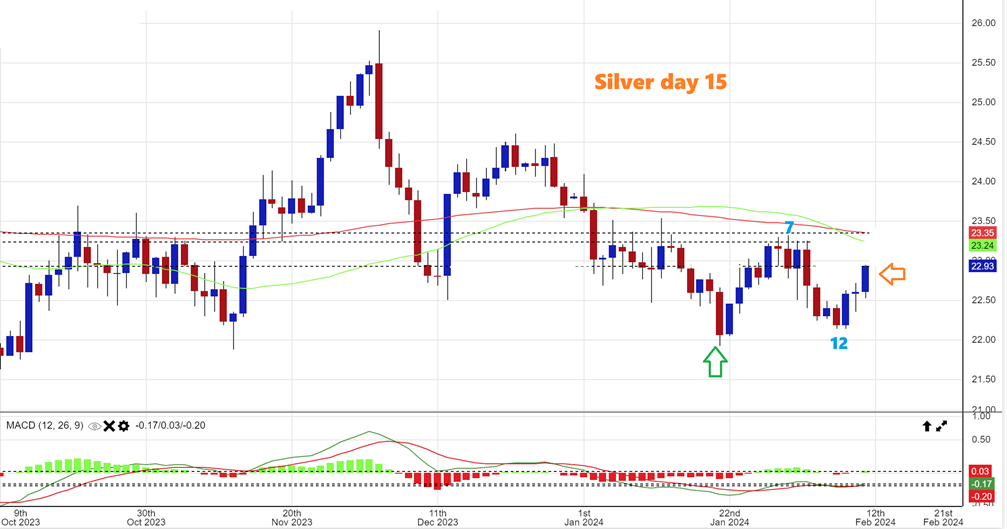
…and then it gave up almost all of the gains by the close.
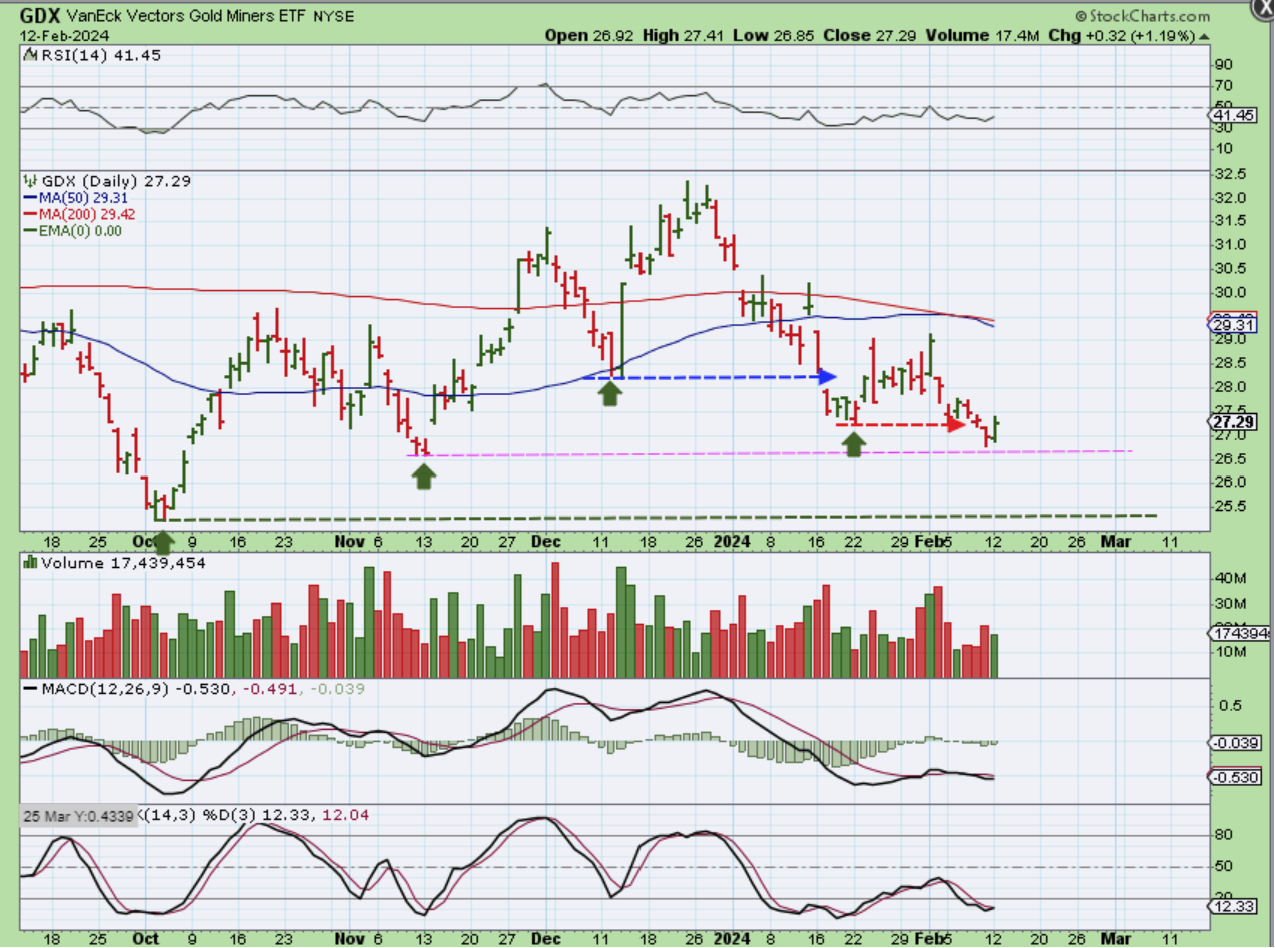
THE GDX also ‘popped’ with Silver and was actually able to hold on to a 1.19% gain but notice how GDX has already broken below the last 2 DCLs (Blue arrow and Red Arrow). That is a failure and a sign of weakness.
.
Today the CPI Numbers come out at 8:30 a.m. ET, and lately the reaction has been bullish. We’ll see where the futures are at that time. I discussed Crypto last week and in the weekend report, and it had another excellent day, so I’ll discuss that below along with some other stuff’. Even if you don’t trade or care about Bitcoin, keep reading, I have a lesson (a pattern) to share with you, and a little extra education is always worth the time, right? 🙂 Enjoy your Tuesday trading, these markets are bullish, until they are not (& they have been very bullish).
.
~ALEX
.
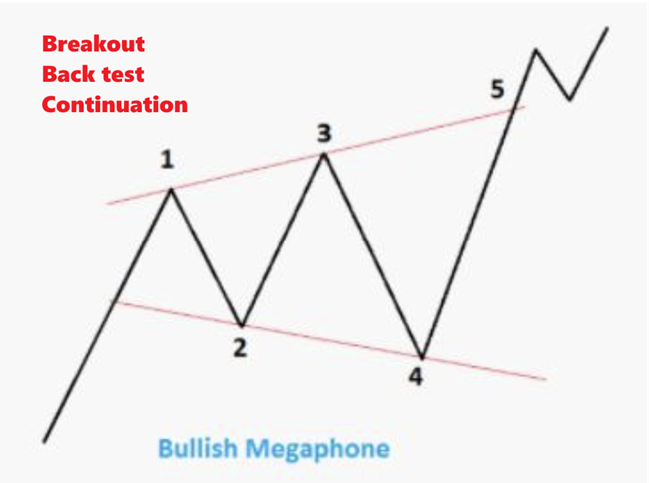
I wanted to show you what we call a Megaphone Pattern (or Bullhorn Pattern). They can break out higher, back test, and rally in a continuation phase (as shown here). I will now show you an actual example that I dug up…
.
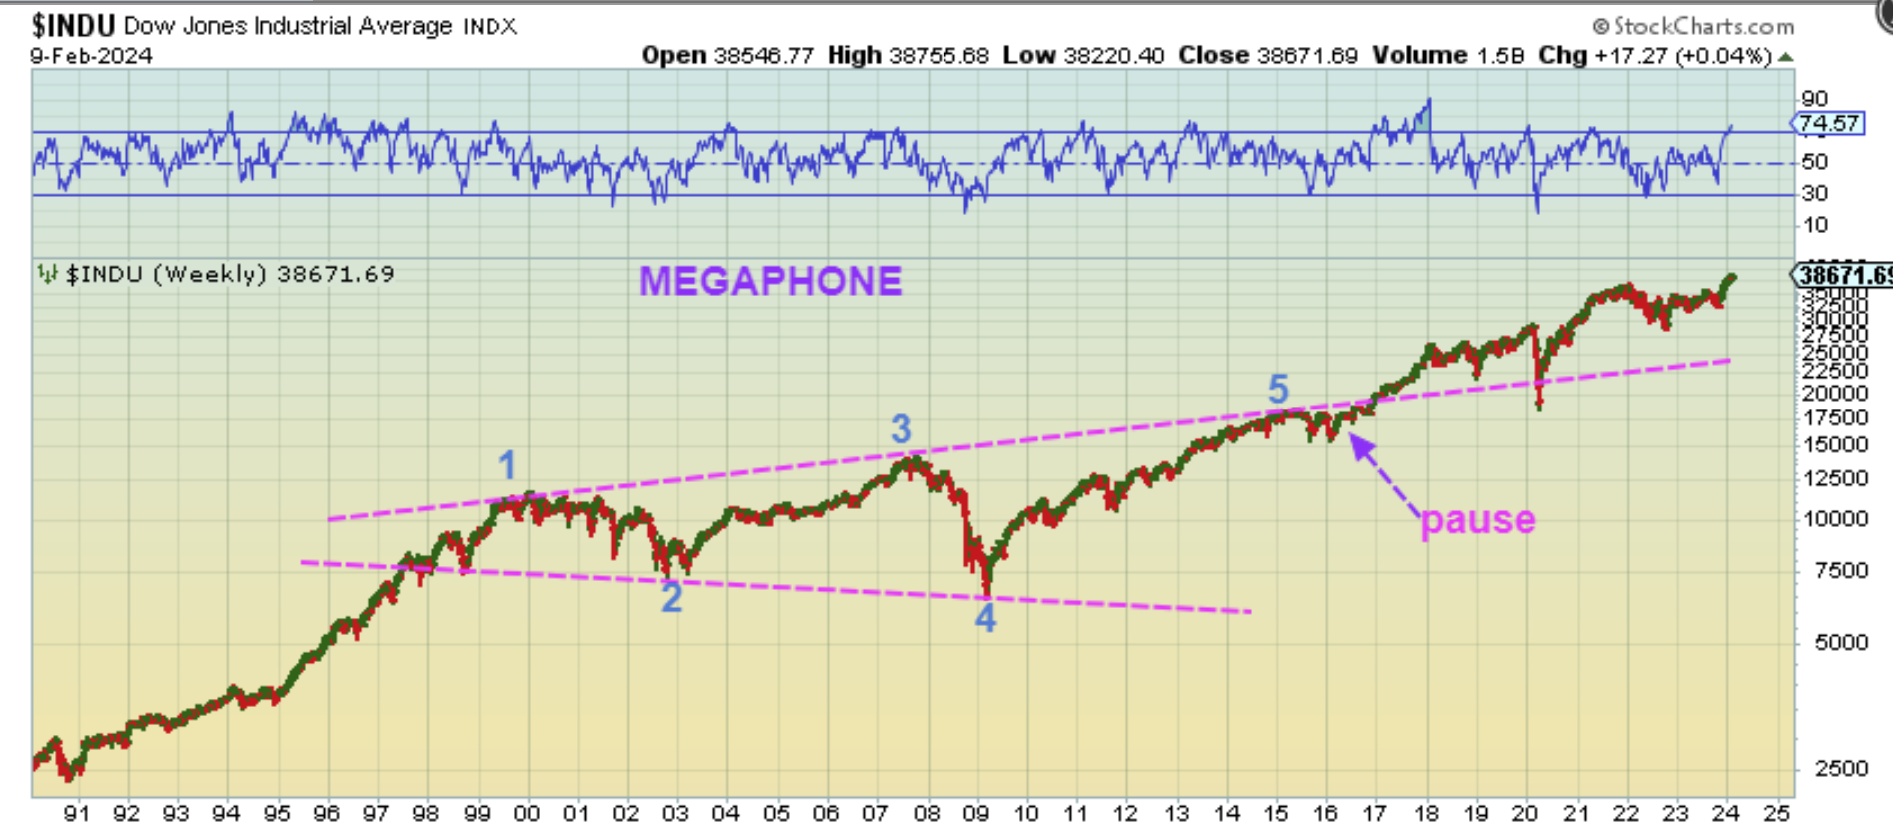
So this is the Dow Jones and in its major bull run, it formed a long-term Megaphone, as explained above. You see the 5 waves up that had higher highs and lower lows. THAT ‘break down to new lows’ in wave ‘4’ & rally to ‘5’ forms the megaphone.
1. The Dows wave 4 broke below wave 2, and it makes it look weak.
2. The rally out of 4 was much stronger than expected as it ran to all new highs!
That forms the wave 5 of the Megaphone, and then it continued higher. So…
.
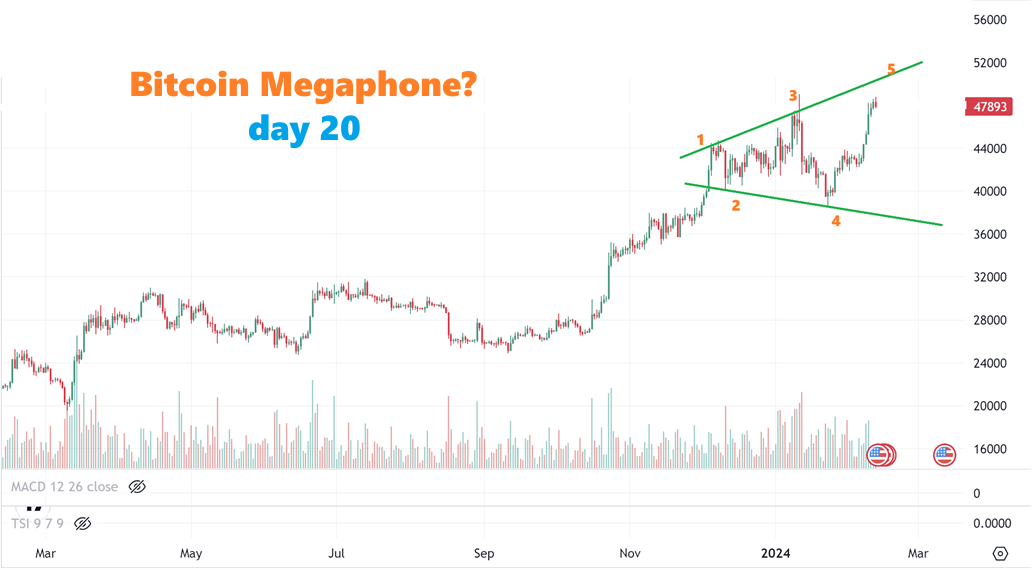
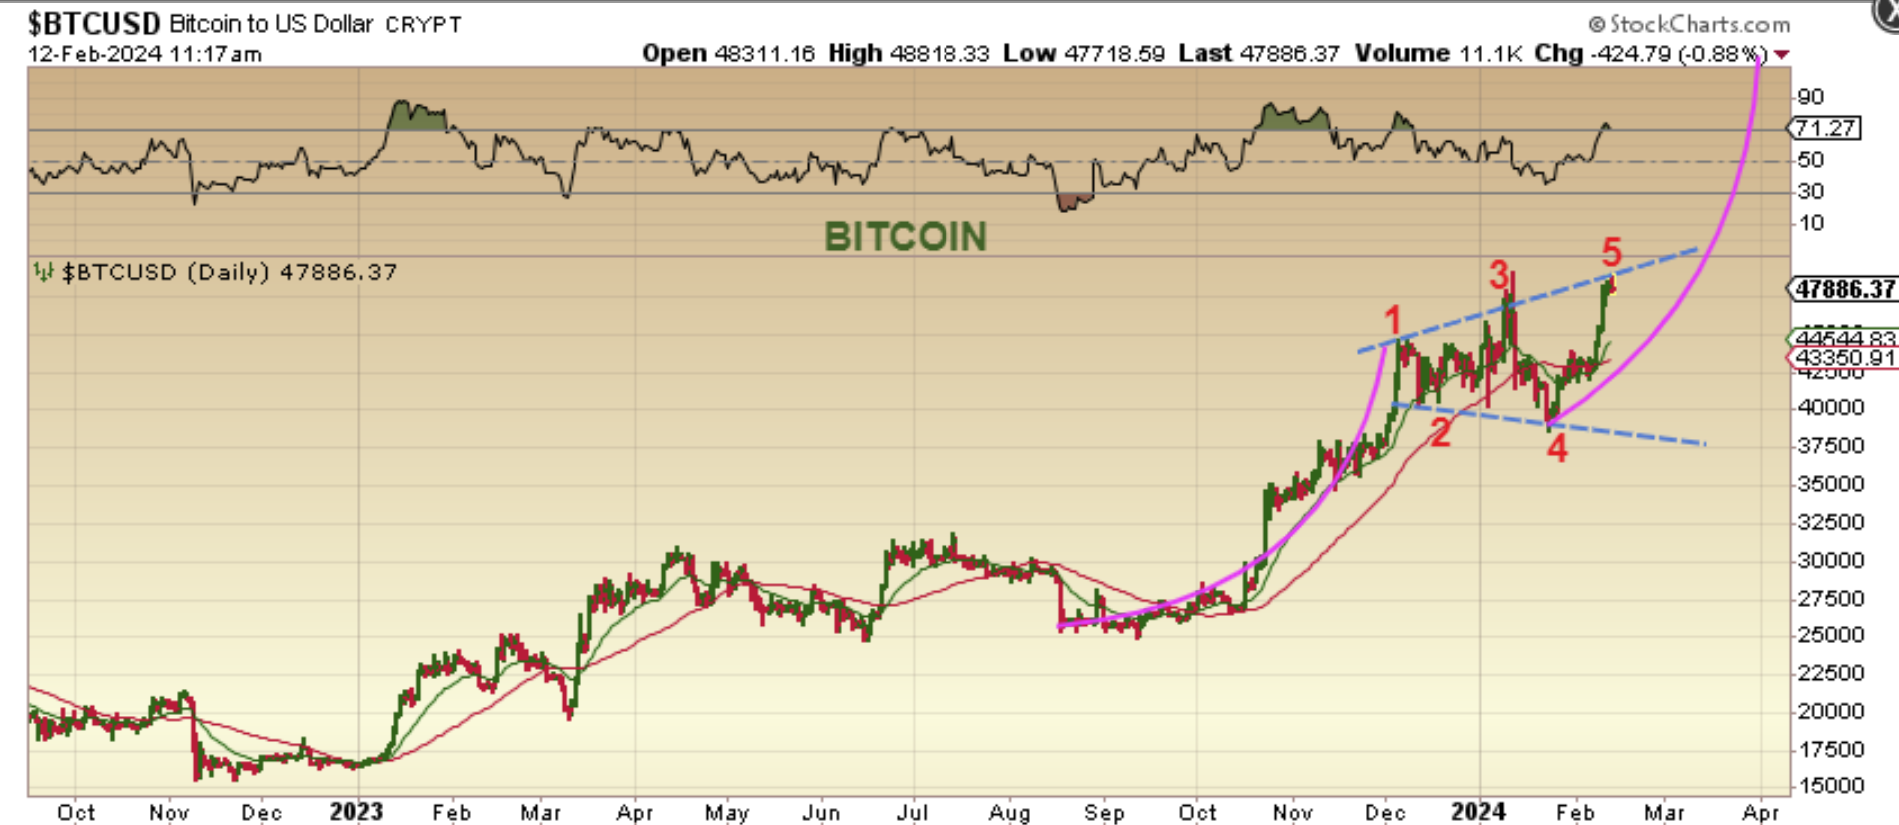
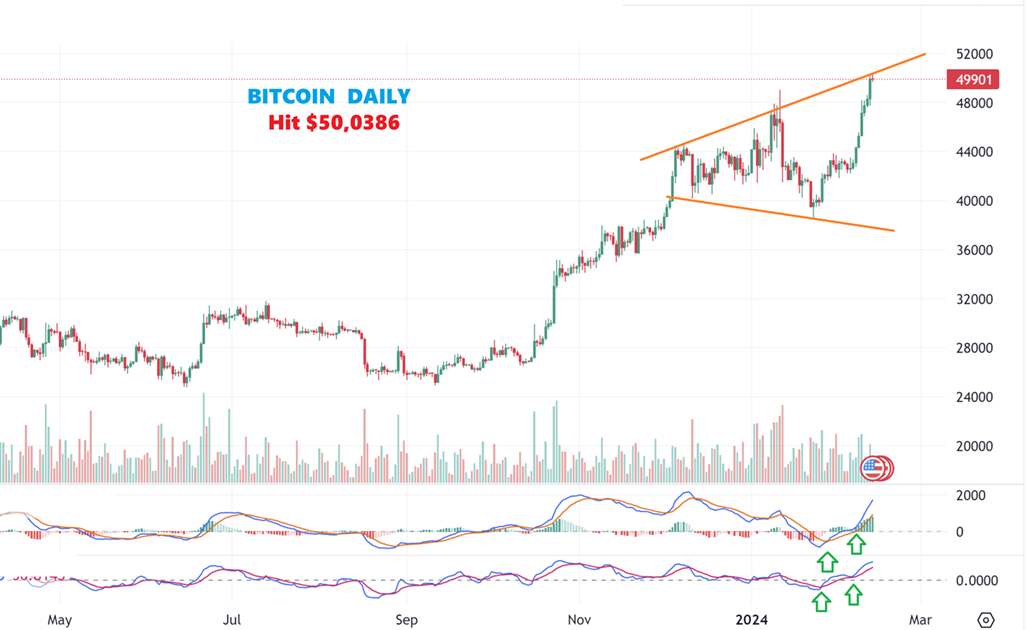
I started thinking: Is that what we have with BITCOIN? I grabbed this Monday Midday…
A Megaphone in Bitcoin that leads to new highs? I do see a wave 4 break of wave 2 and now we were rallying toward ‘3’ highs. I also started thinking that if we are only on day 20 of a 60 day daily cycle, wouldn’t this really extend higher to new highs and beyond? It Could. Maybe it breaks out and back tests on day 30 as a 1/2 cycle low & then continues. It is very possible and matches my weekend report using the weekly charts.
Now for a sidenote: I have seen Megaphones break down. I do like to keep all of the facts in the back of my mind. 🙂
.
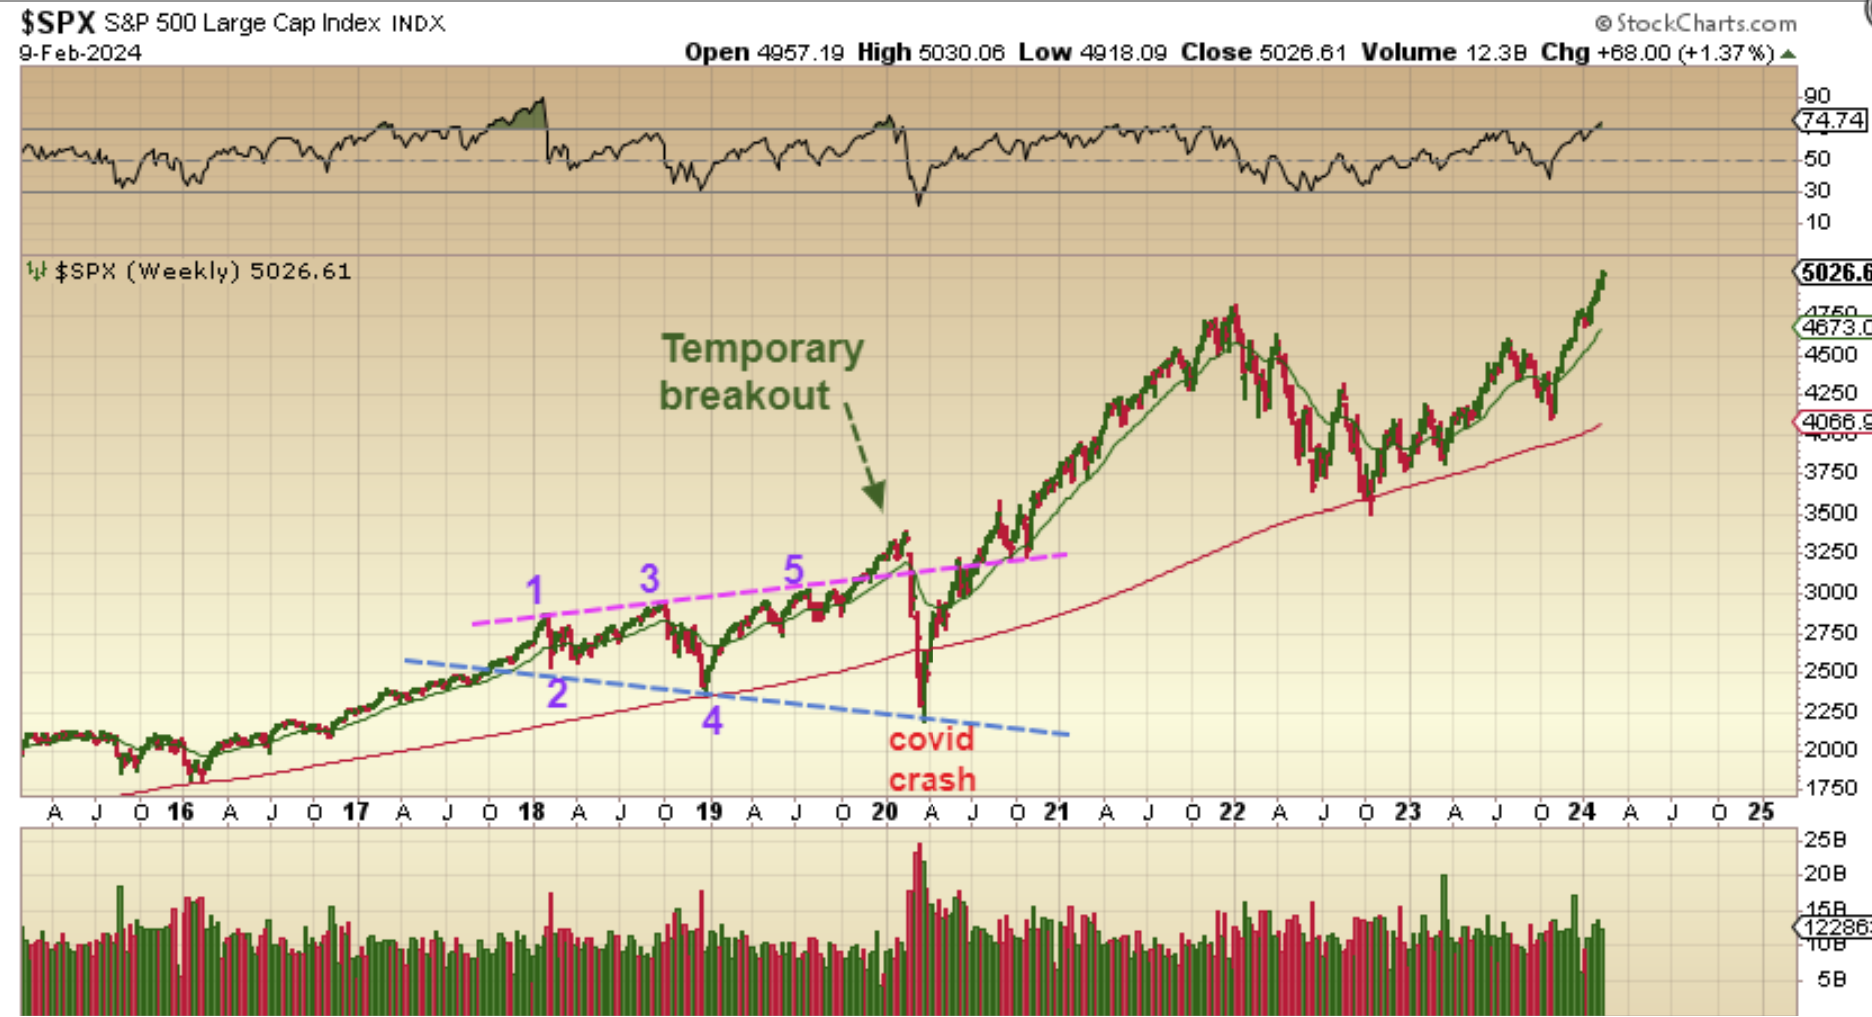
The SPX formed a megaphone pattern, and it broke out too, but instead of a back test, it then got caught up in the COVID crash. So we got a ‘false breakout’ and I find it very interesting that the Covid crash landed right at the bottom of the bullhorn and then it took off like a rocket again.
.
Now back to BITCOIN – In the weekend report I mentioned that the Weekly Chart looked very bullish and could run to the former highs above $60,000. That would be part of the Megaphone run too.
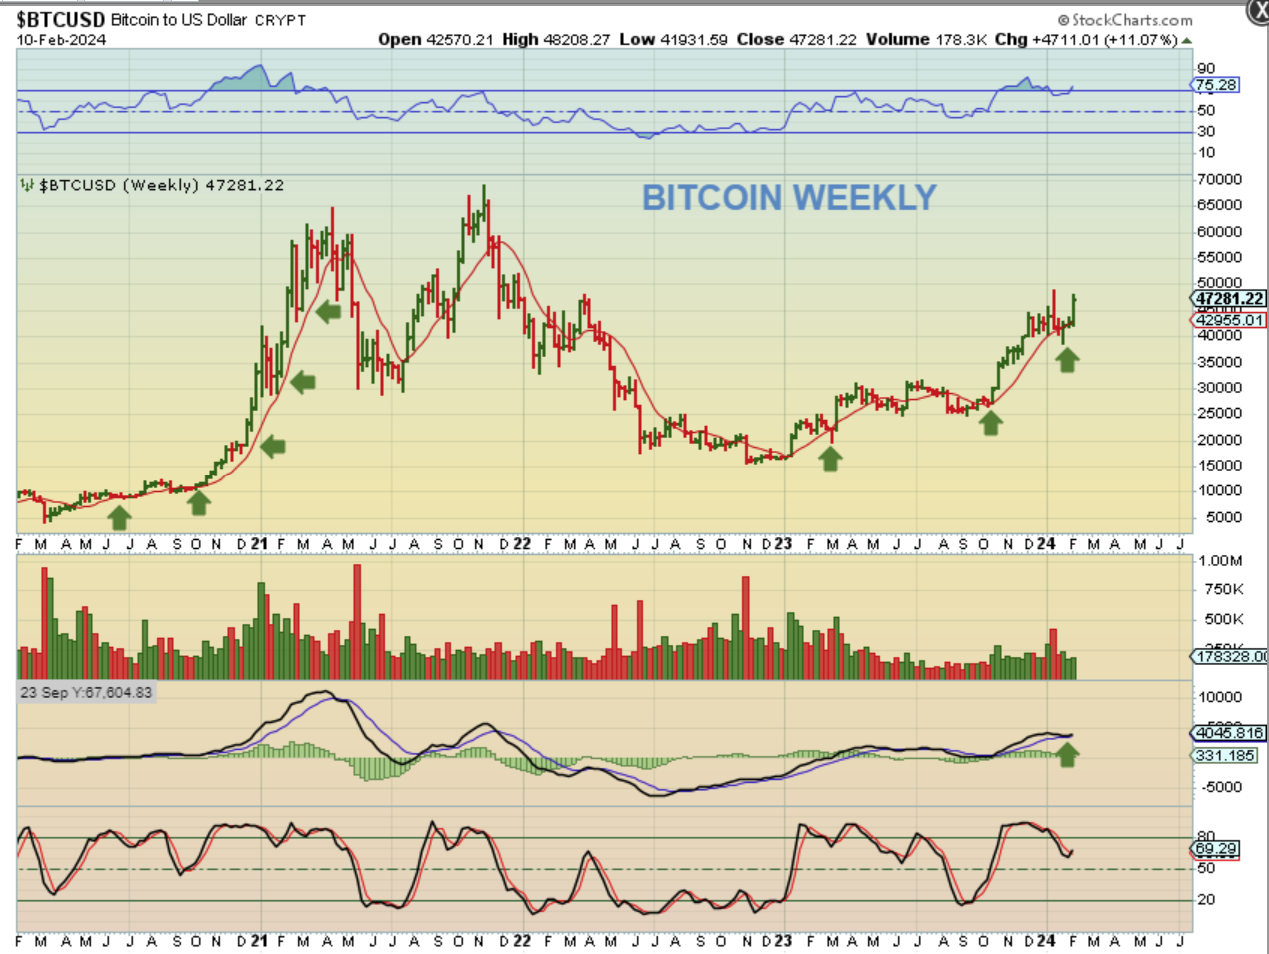
With a Bullish breakout of a Megaphone pattern, with ‘4’ as a possible a-b-c ICL, $60,000 could happen.
.
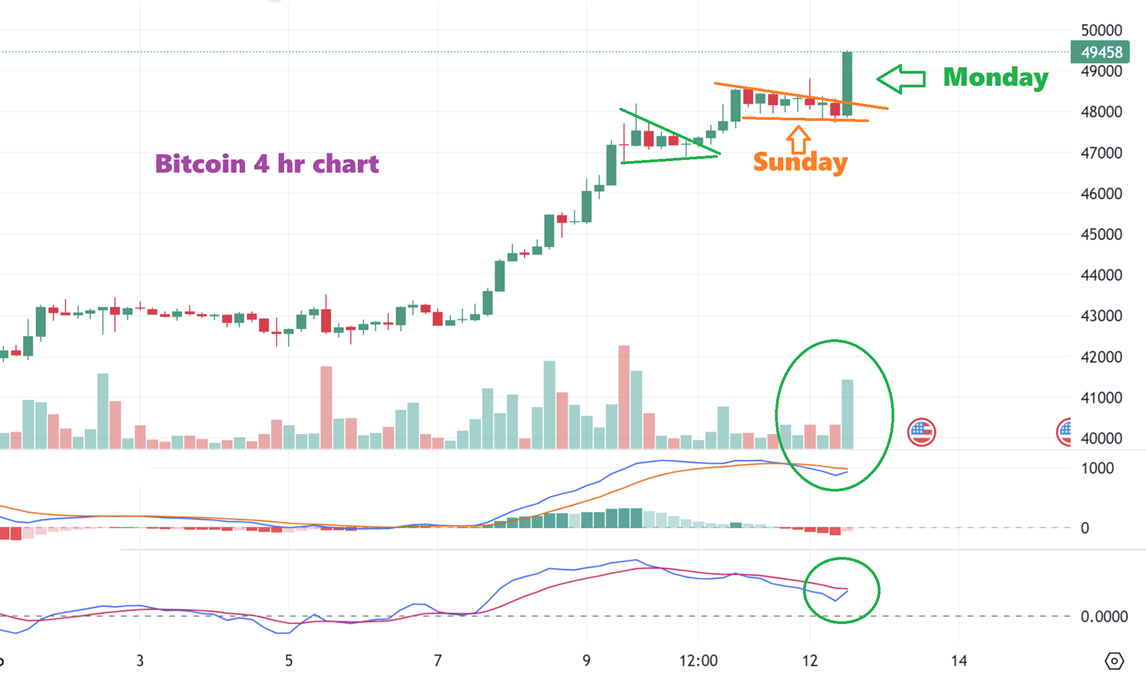
So BITCOIN crawled sideways on Sunday and Monday morning and crypto stocks were actually red by the open. Then Bitcoin suddenly Popped and Crypto-stocks started to run again, many up over 10-15%. I posted this 4 hr chart to show that break higher.
BITCOIN LIVE: This is 6 a.m. ET Tuesday and Bitcoin has already tagged the $50,000 mark. It may pullback or stall and churn sideways before running higher, we’ll see.
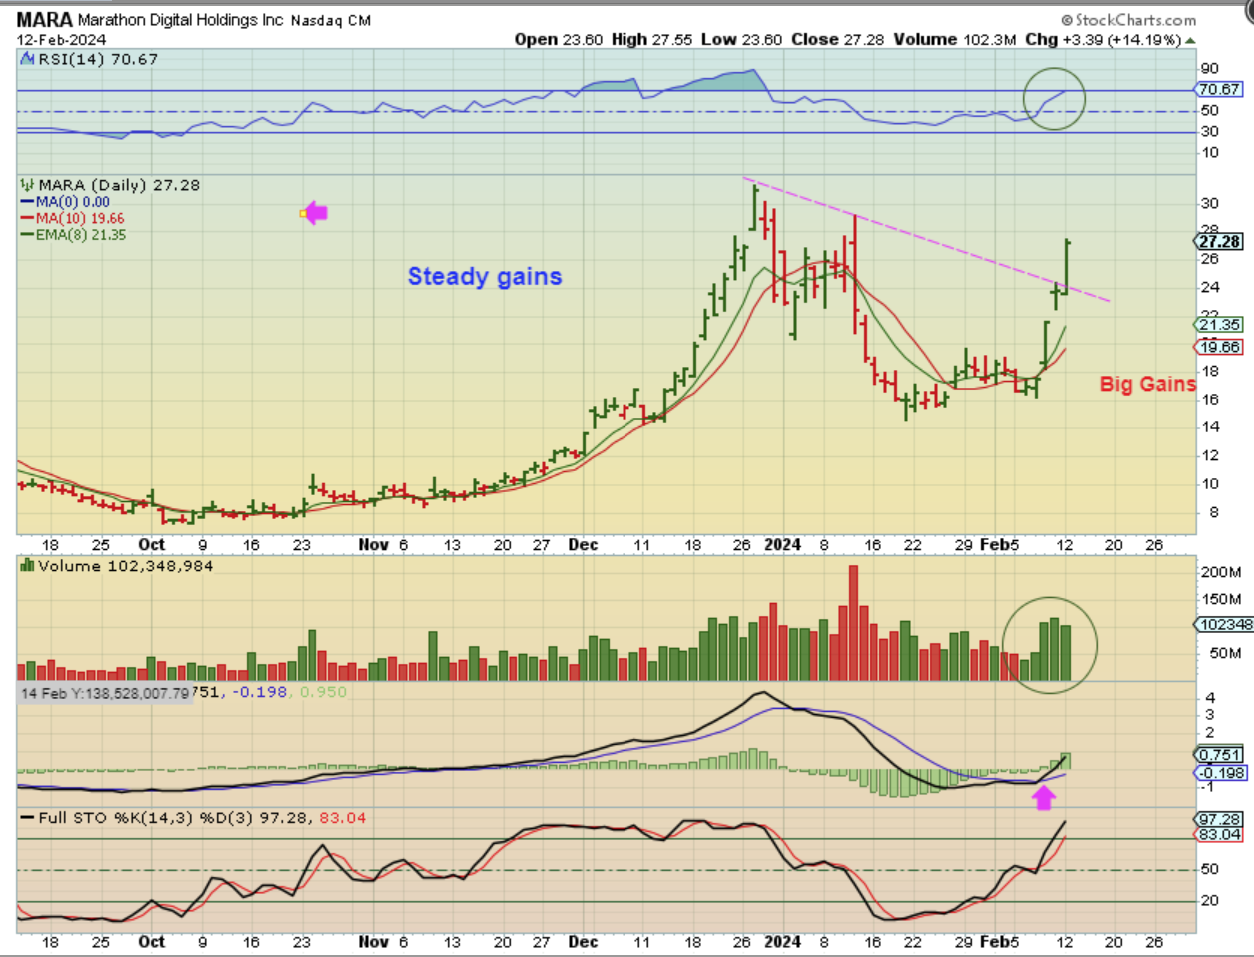
MARA – Notice that it had no gap open in the morning, but it surely did take off after Bitcoin started to run again. These opened slightly down and as Bitcoin rallied, they rallied too. This was a very quick recovery from near $14 to $27. Notice that when it peaked it also dropped from over $30 to $14 in 1 month. These can drop very fast and recover very fast, so they may not be what everyone should trade.
.
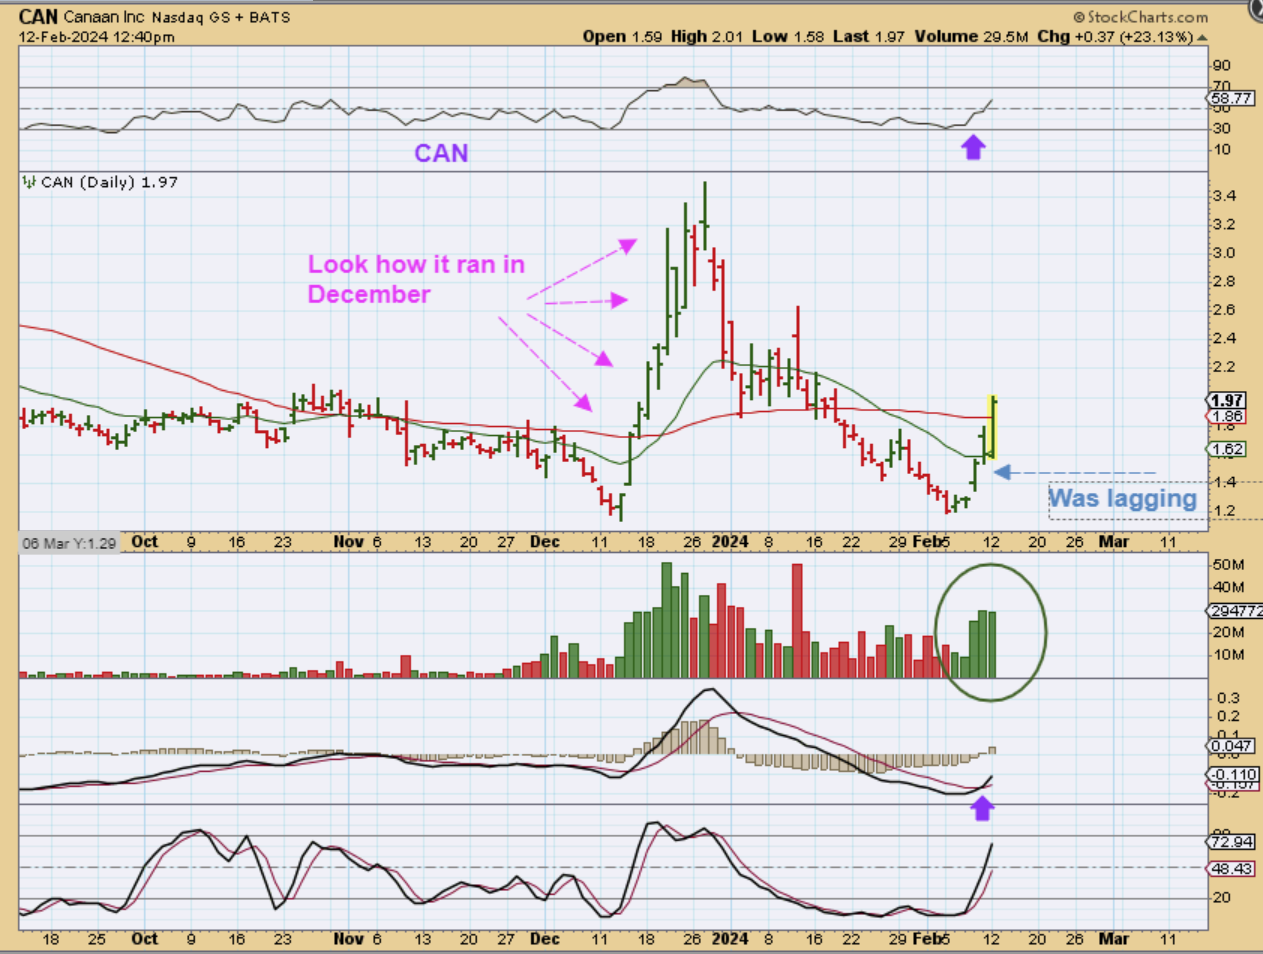
I was pointing out laggers like CAN, EBON, HUT, HIVE, etc. They were still near the lows last week-
So CAN was a lagger, still near the lows, still under all of its moving averages on Monday. I wanted to show how quickly they can play catch up. Yesterday by midday I captured this chart showing it up 23%.
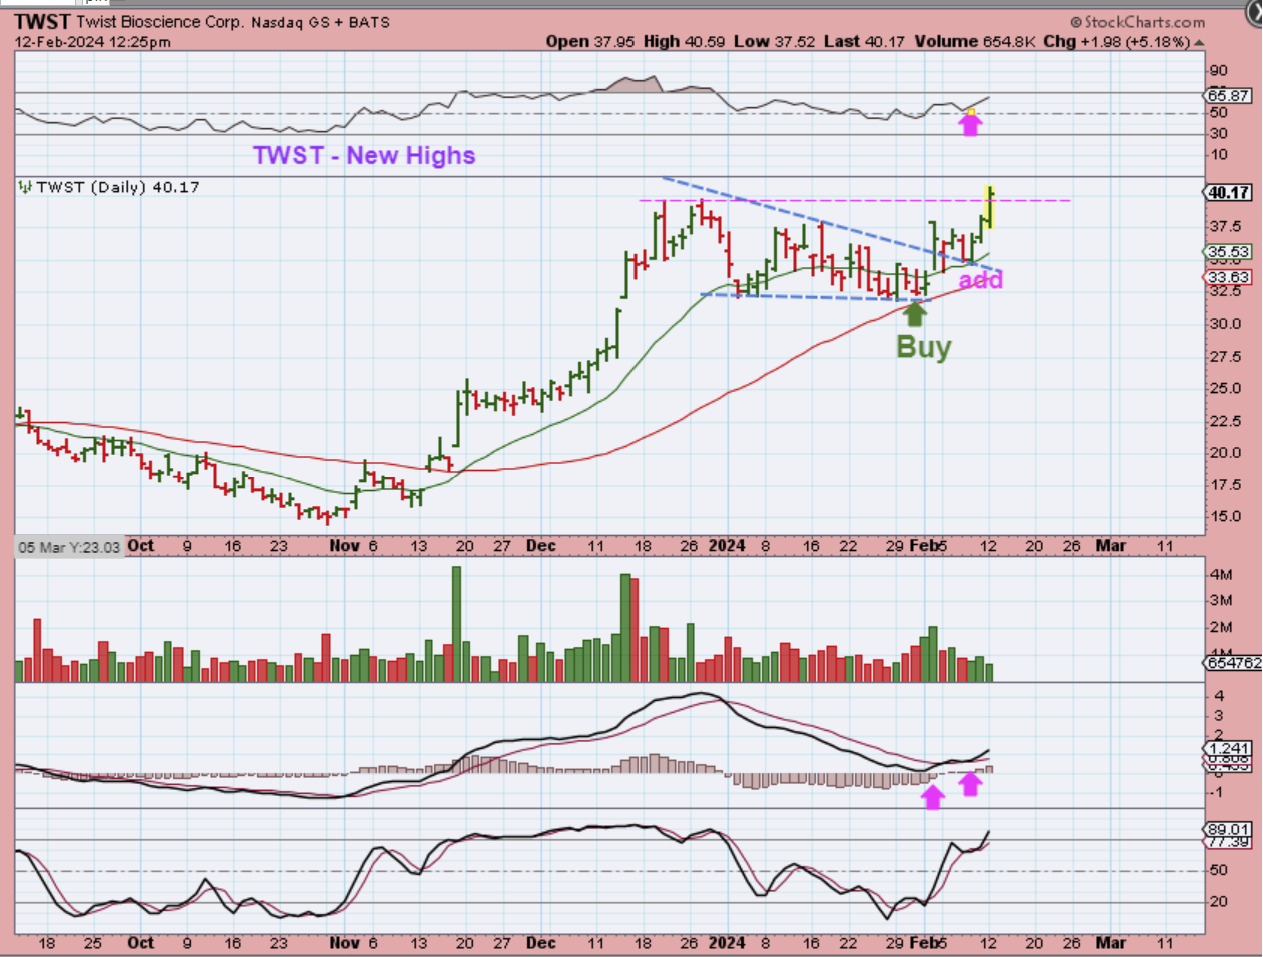
Recently I said that even though the General Markets are coming due for a drop into a dcl, Biotech and Pharma seem to recently put in a low ( I mentioned IBB, XBI, and LABU. I then pointed out some companies like TWST, CRSP, RNA, etc.
TWST was actually mentioned by me a few times in December as a bull flag ($24). It then rallied and consolidated…
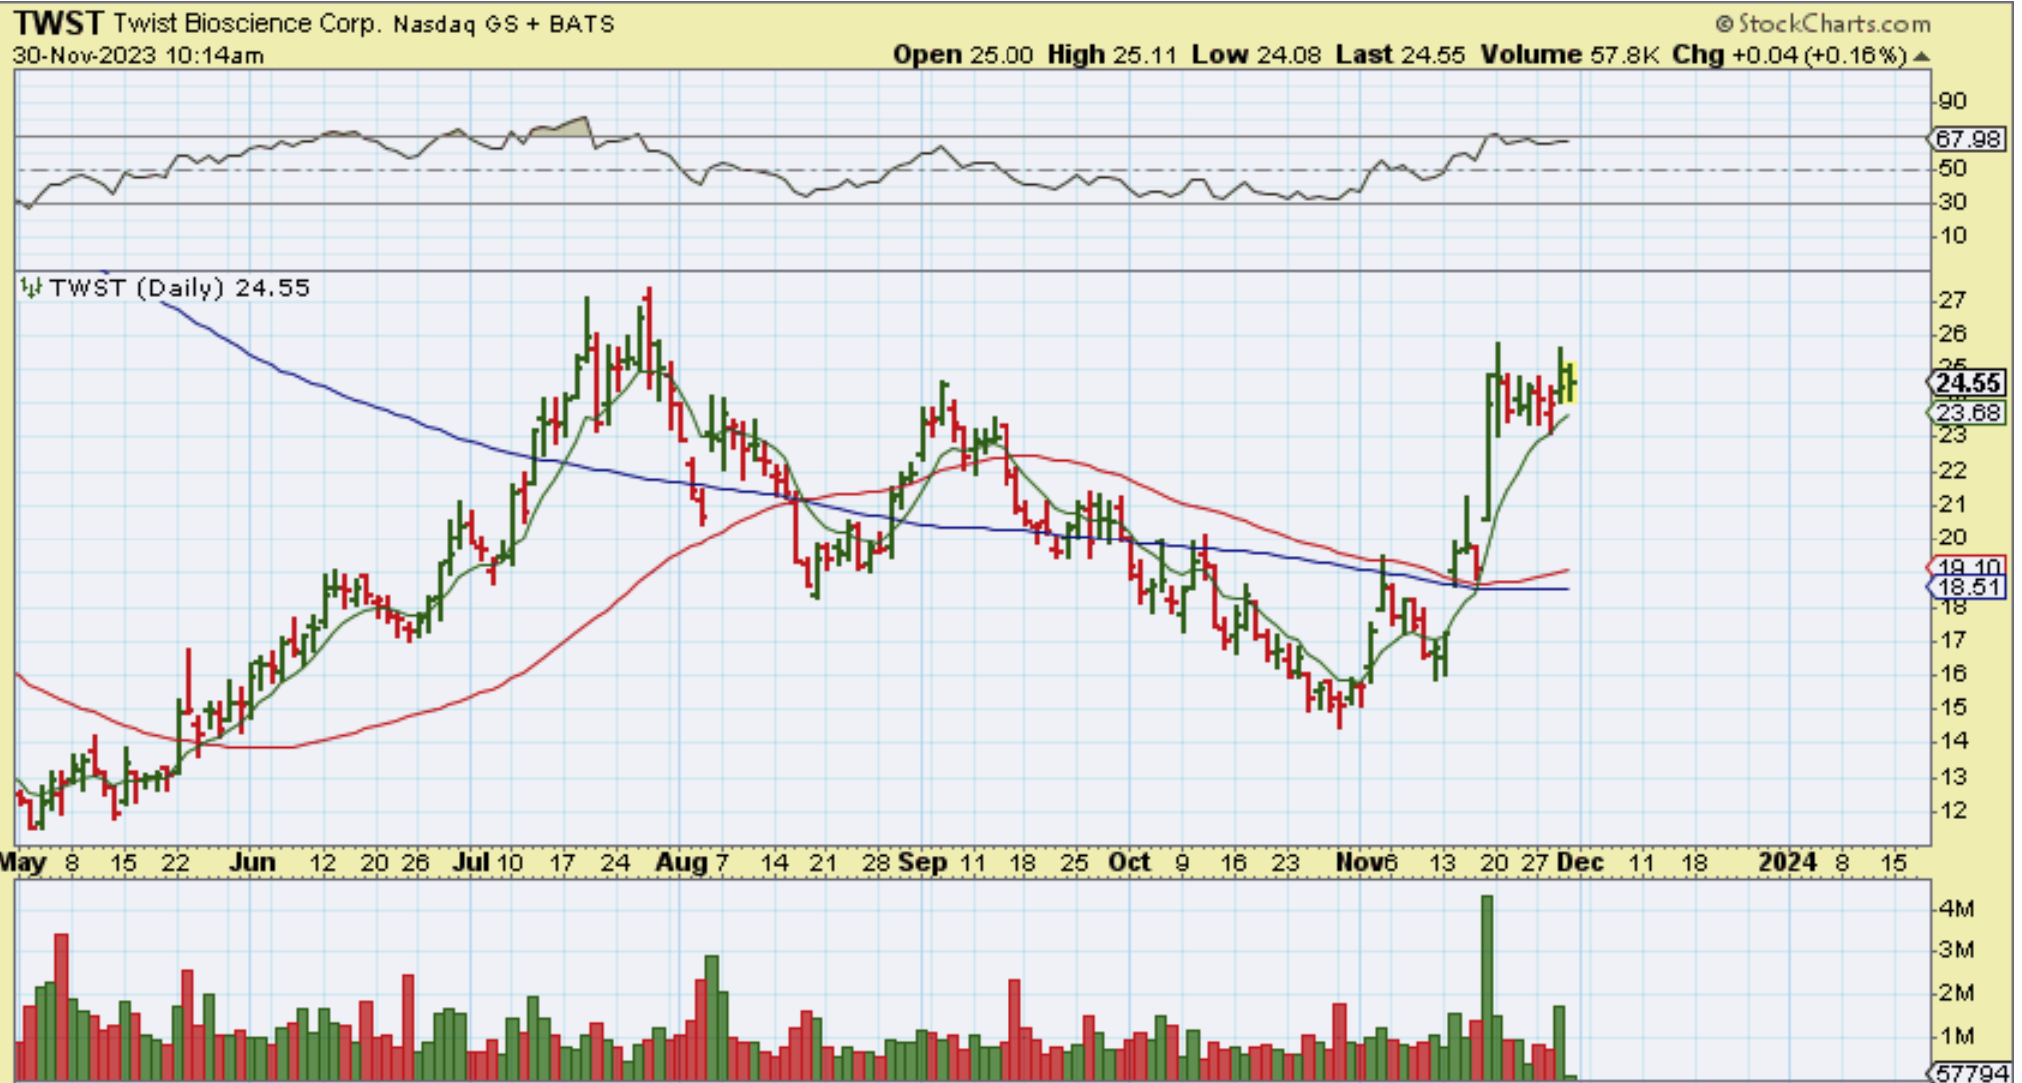
TWST was then pointed out as a buy recently as it breaks from that consolidation over to the 50sma. It has now moved from $32 to $40 and looks good.
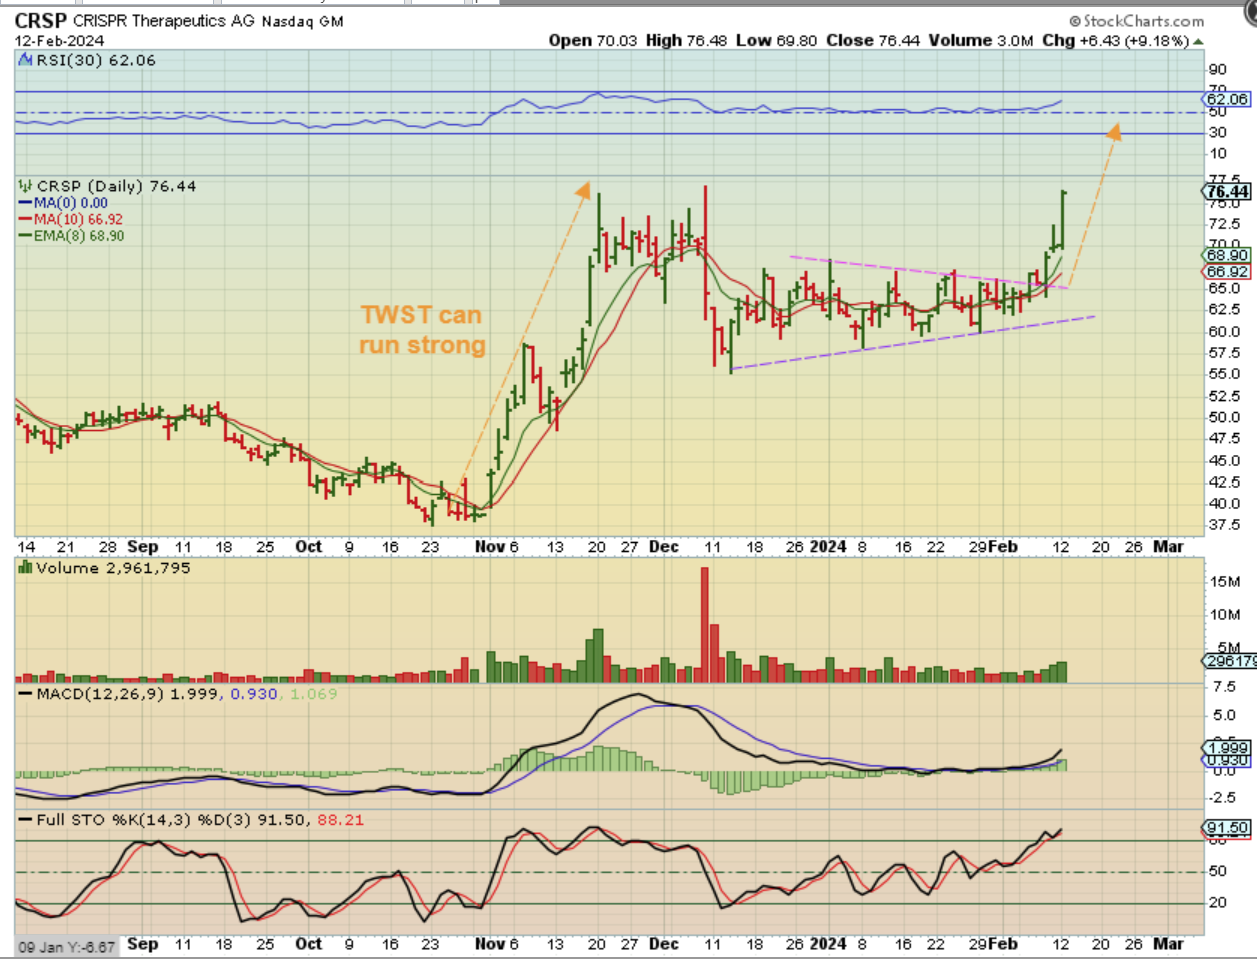
You may recall the buy with this pattern last week and it has run from the $62 area to $74 by Monday morning. It closed the day even higher. CRSP closed up over 9% and is now at $76 and by the way…
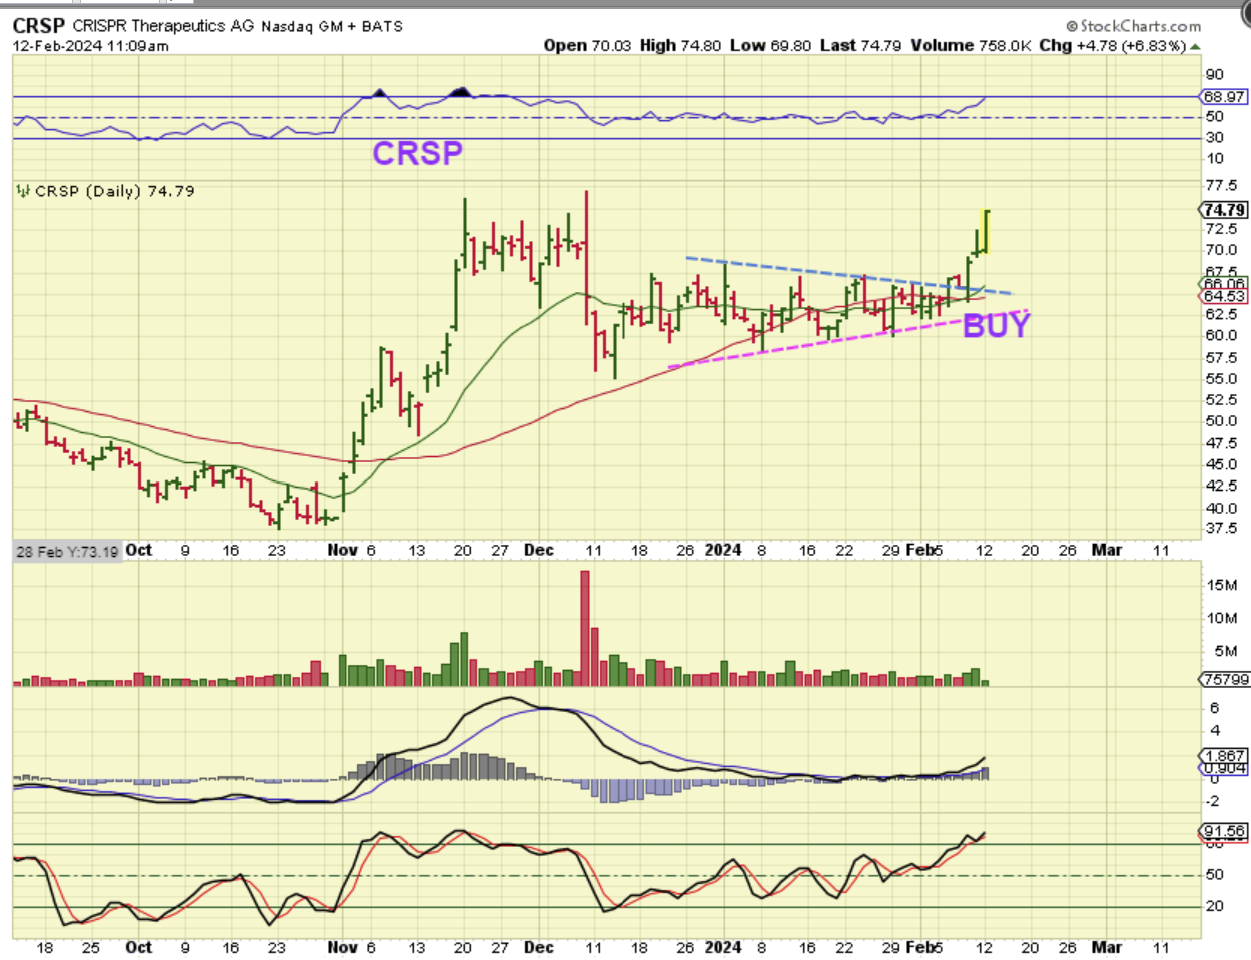
CRSP ran very strongly from $37 to $77 in November, so I think that this can move even higher if you are holding it.
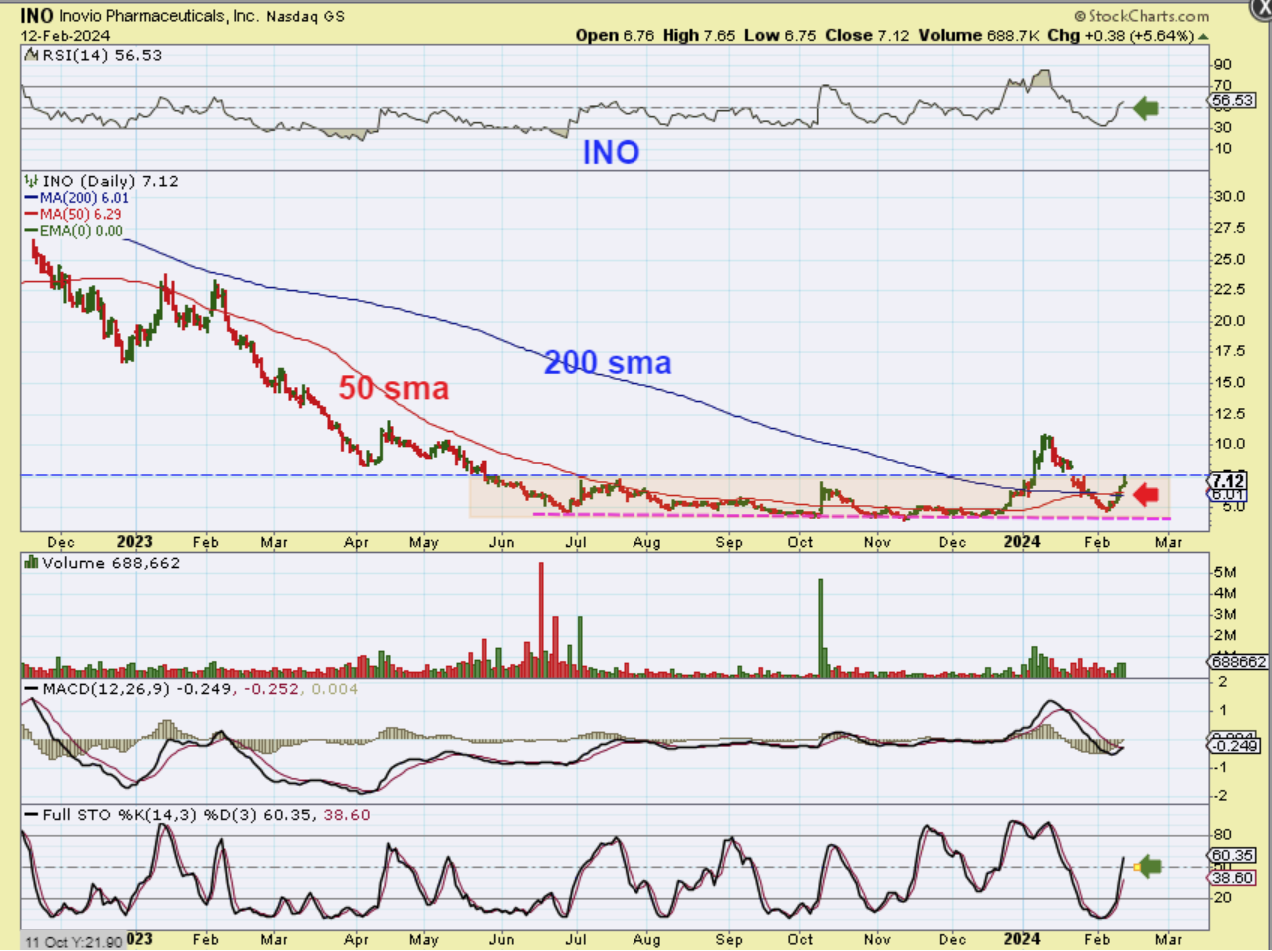
INO – This one is a bit tricky, maybe a little more risky (?), because they did reverse split recently. Those can move quickly higher and it has started to come out of the lows from $4.75 to $7.65 in days.
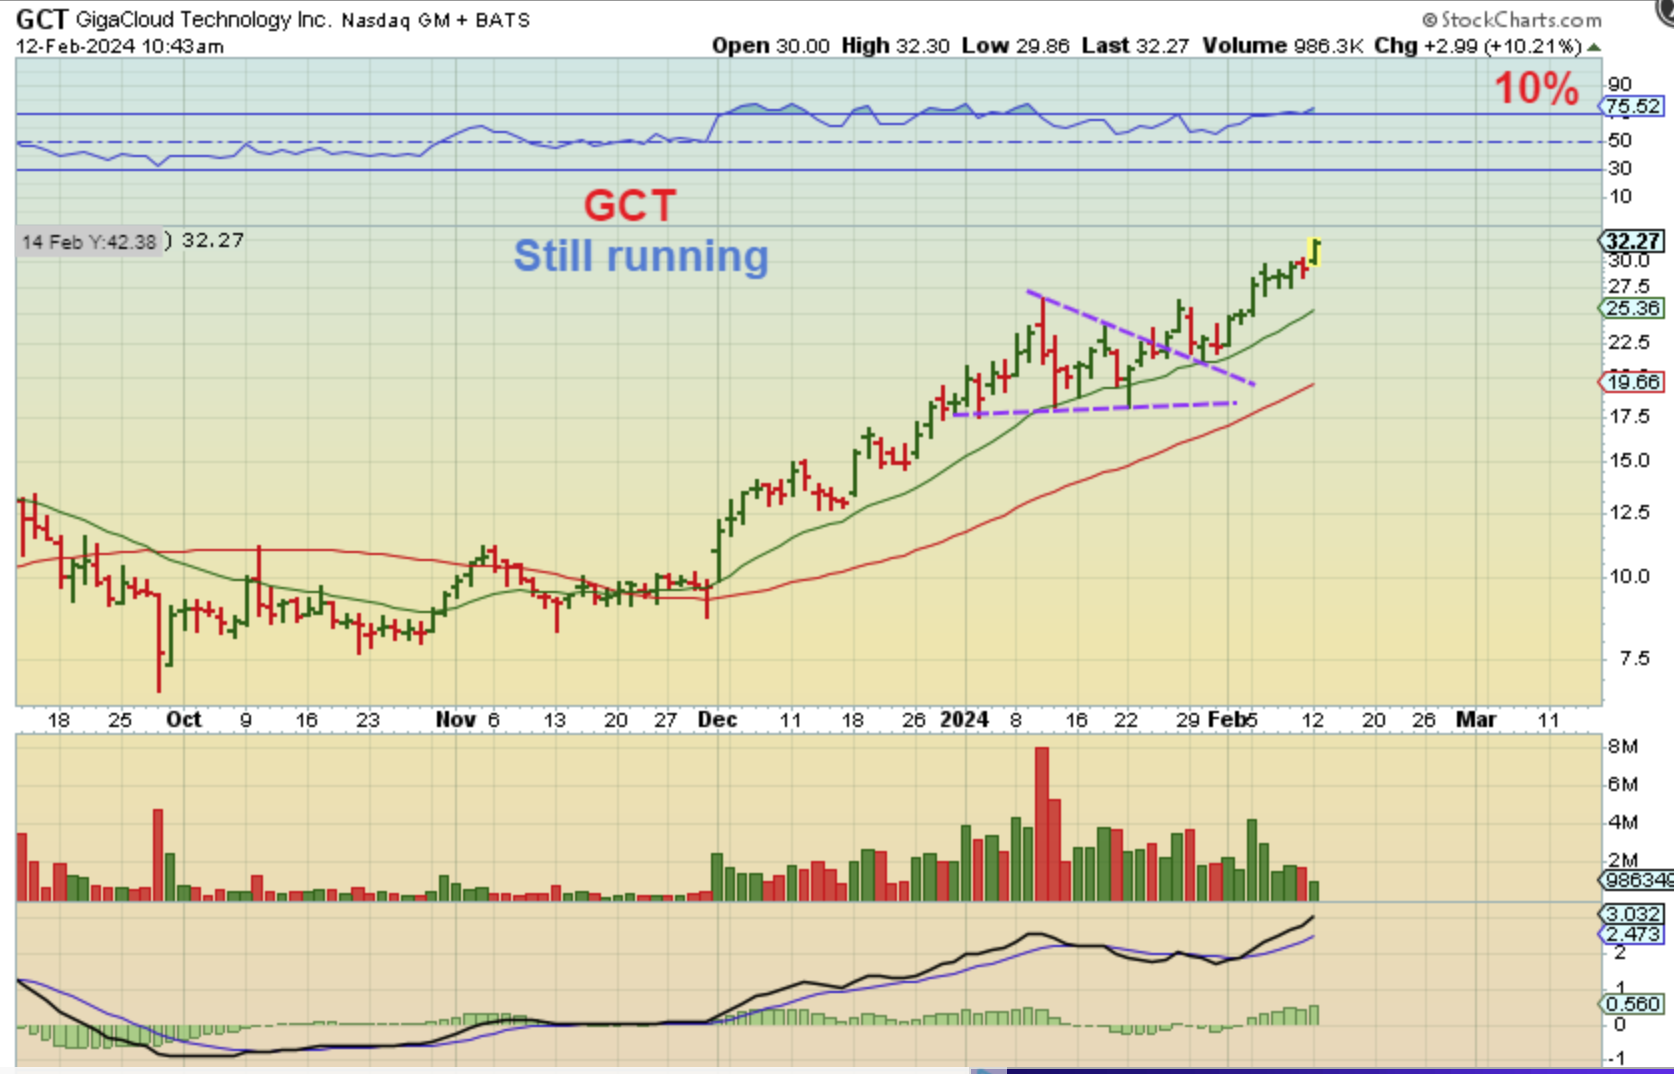
GCT was pointed out as a buy and it is still running too. I’d just raise stops.
.
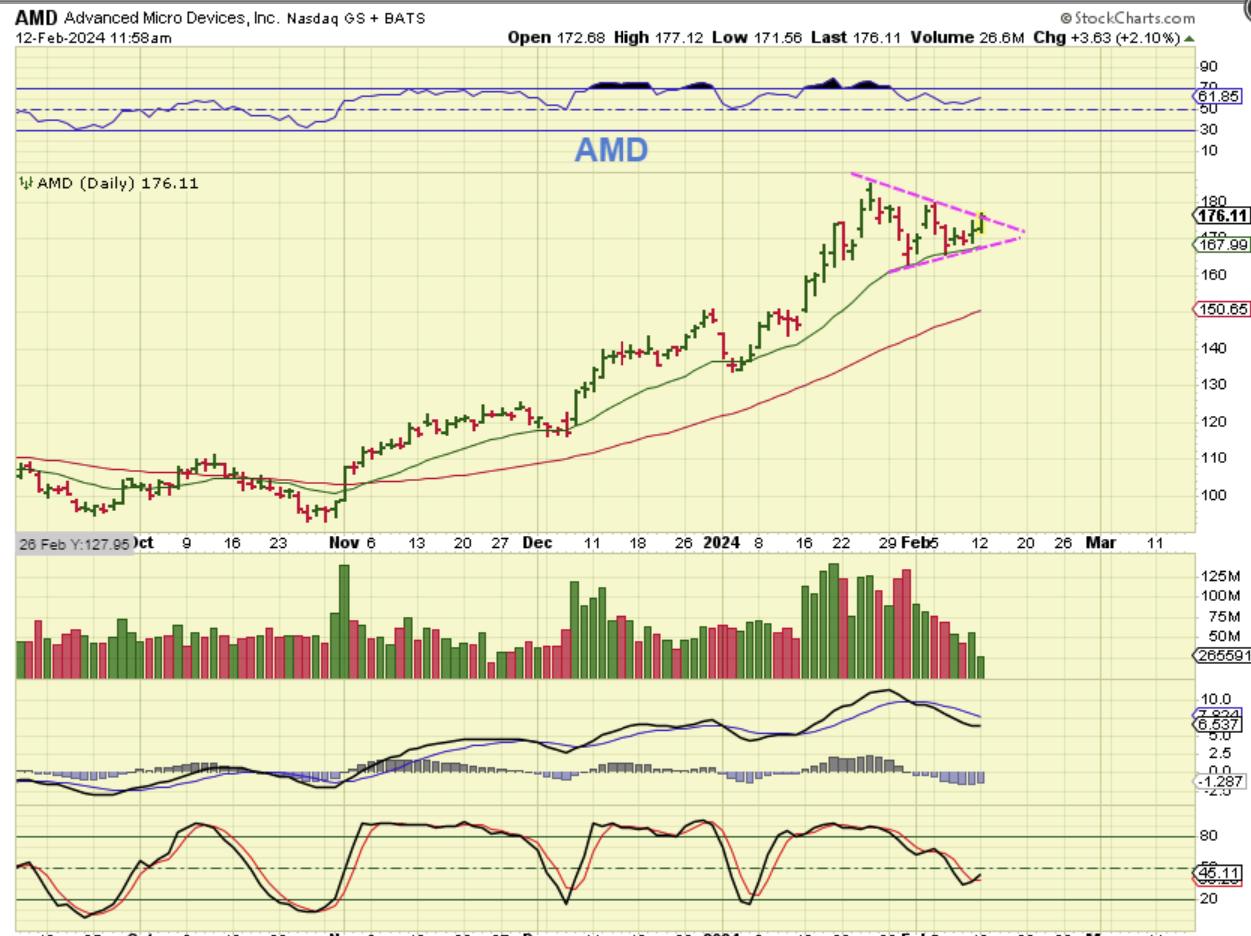
AMD actually looks ready to breakout from a triangle formation. It’s hard to buy when the General Markets have a dcl ahead, but this is a buy with a stop under the 20ema or triangles apex. Look how quickly it ran in January from $130 to $185. That could happen before the dcl comes due.
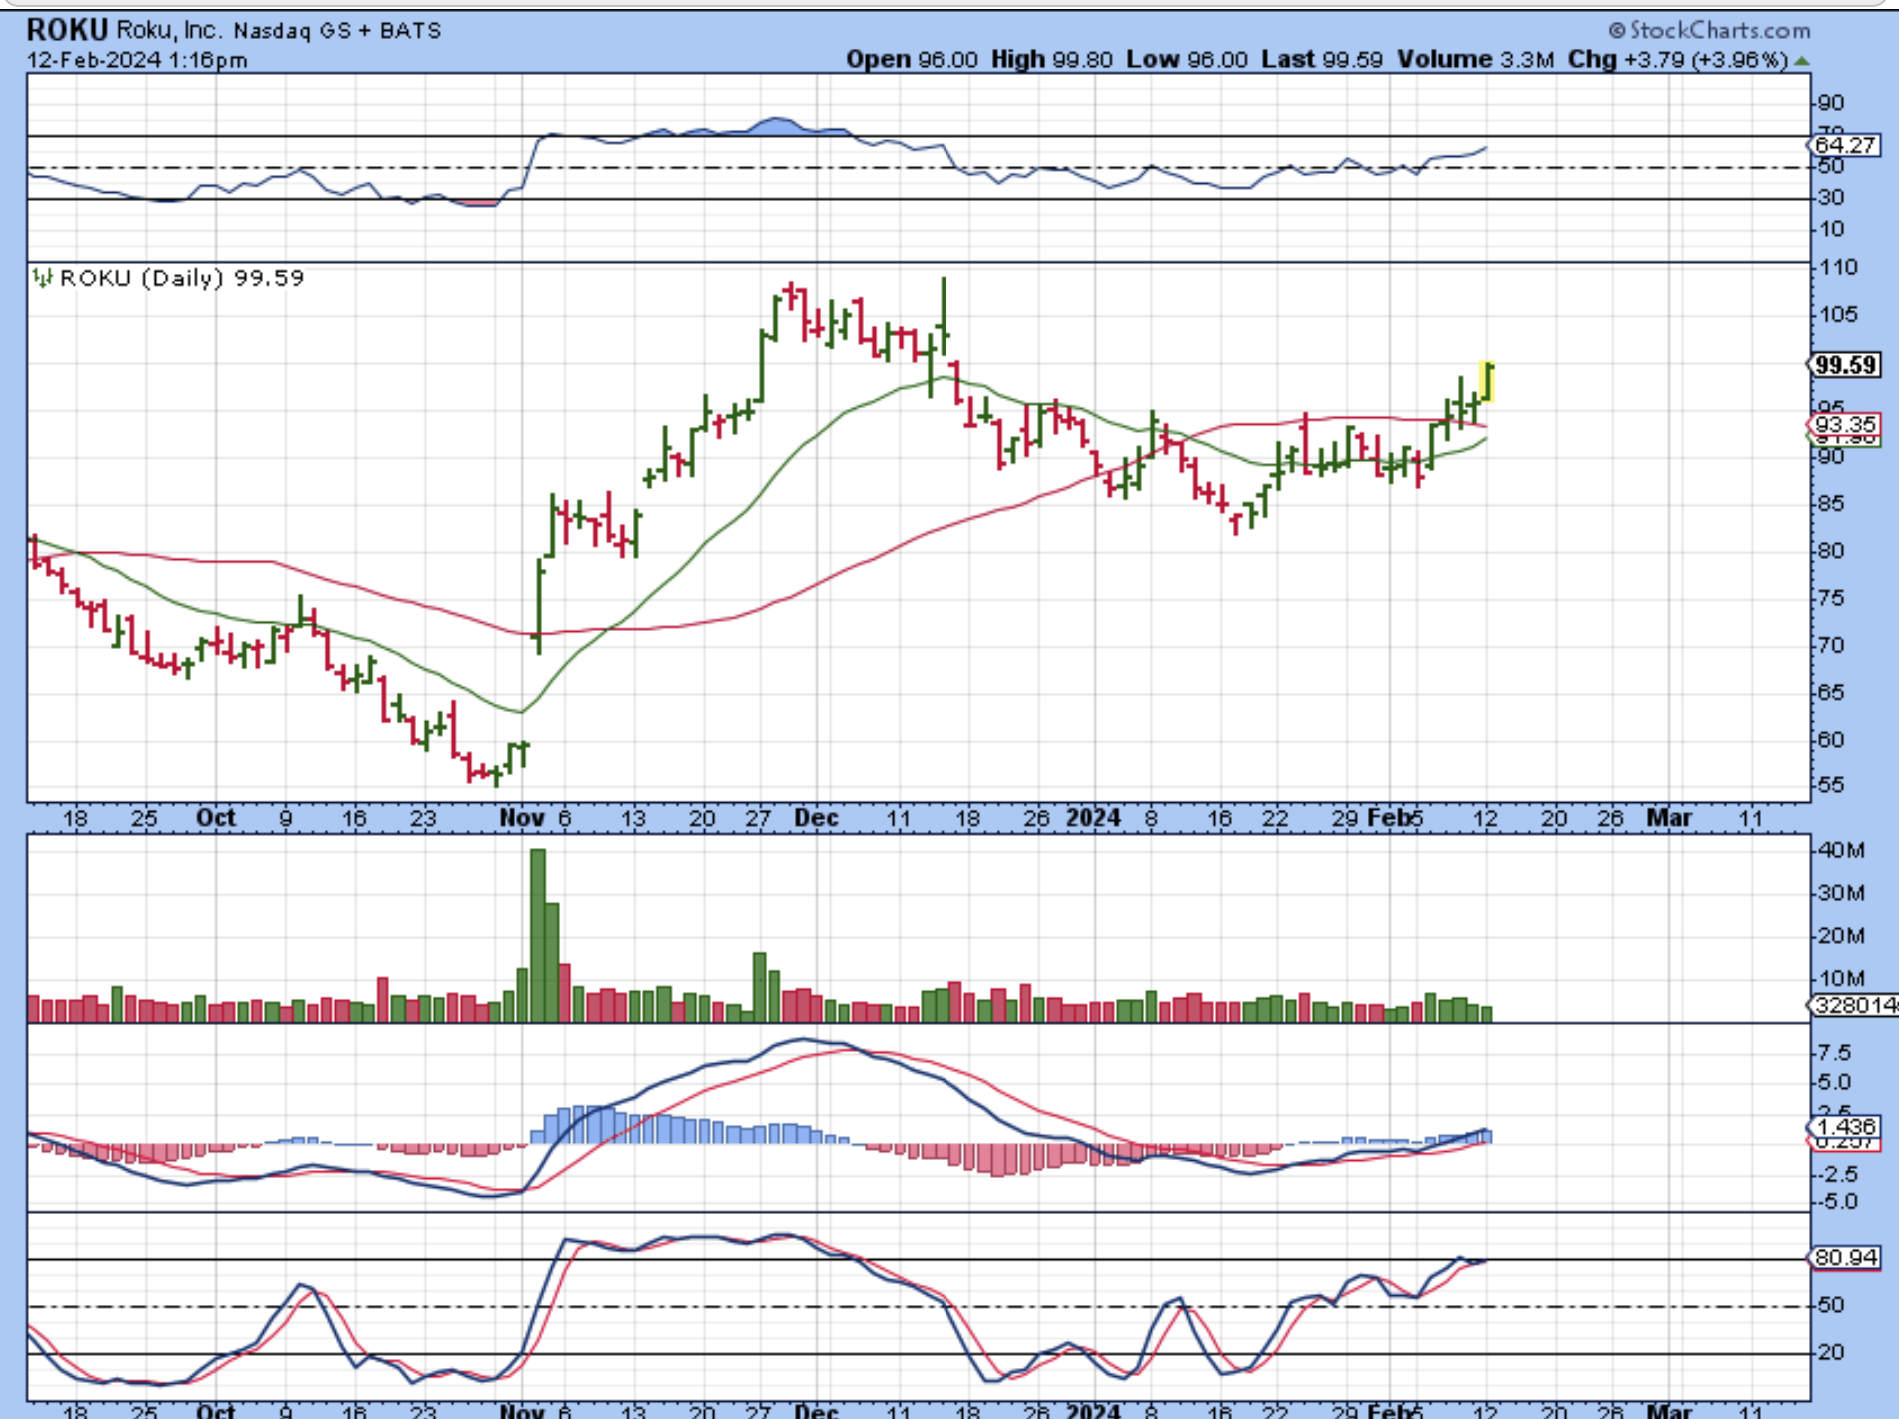
ROKU paused on me last week, but seems to be starting to move higher now. They have earnings in 2 days, and I don’t like to hold heavy positions during earnings. Do you see the LARGE GAP OPEN in November? That was a result of their last earnings though. It was up 30% that day and ran from $55 to $106 in 3-4 weeks.
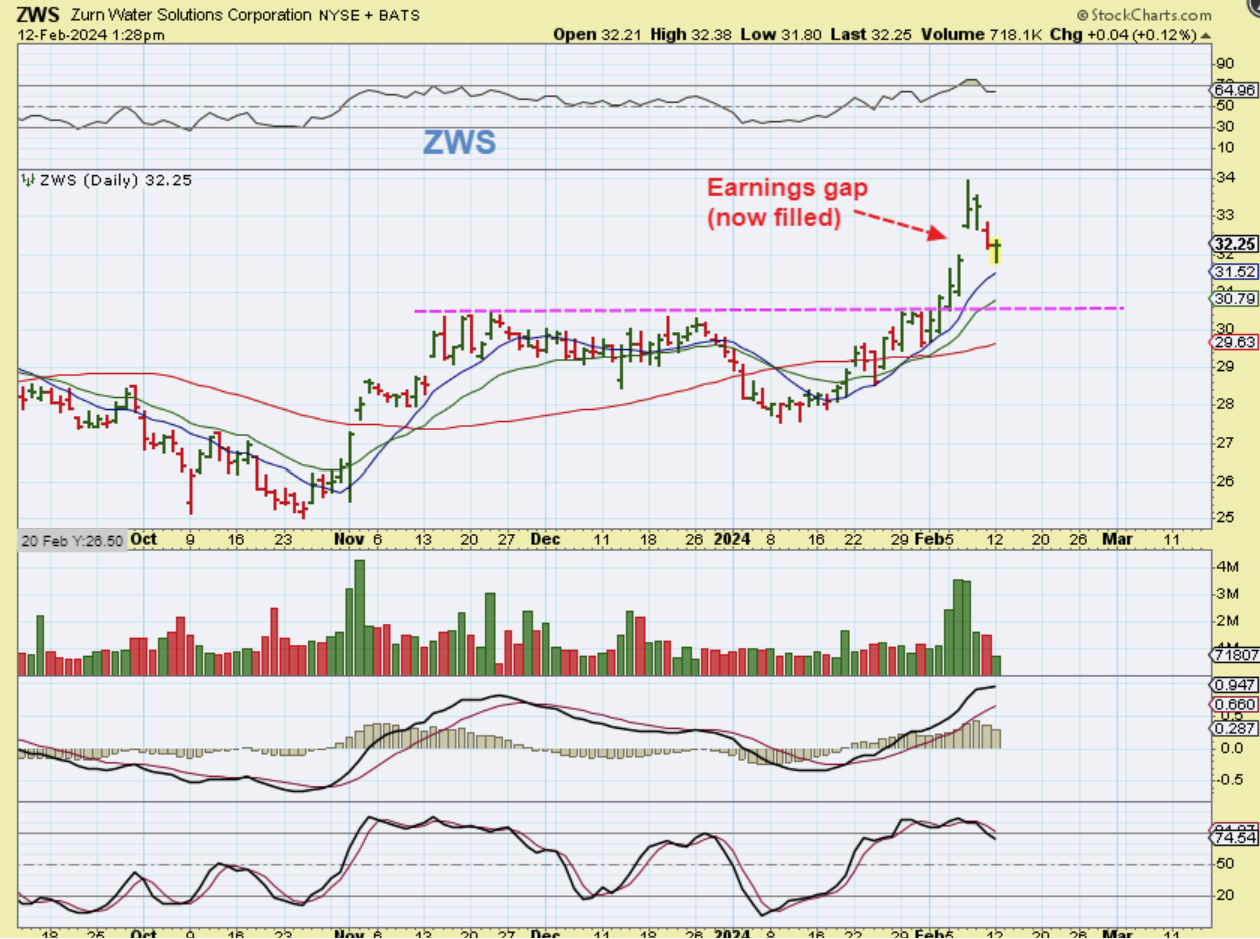
ZWS was in the reports as it broke to new highs…
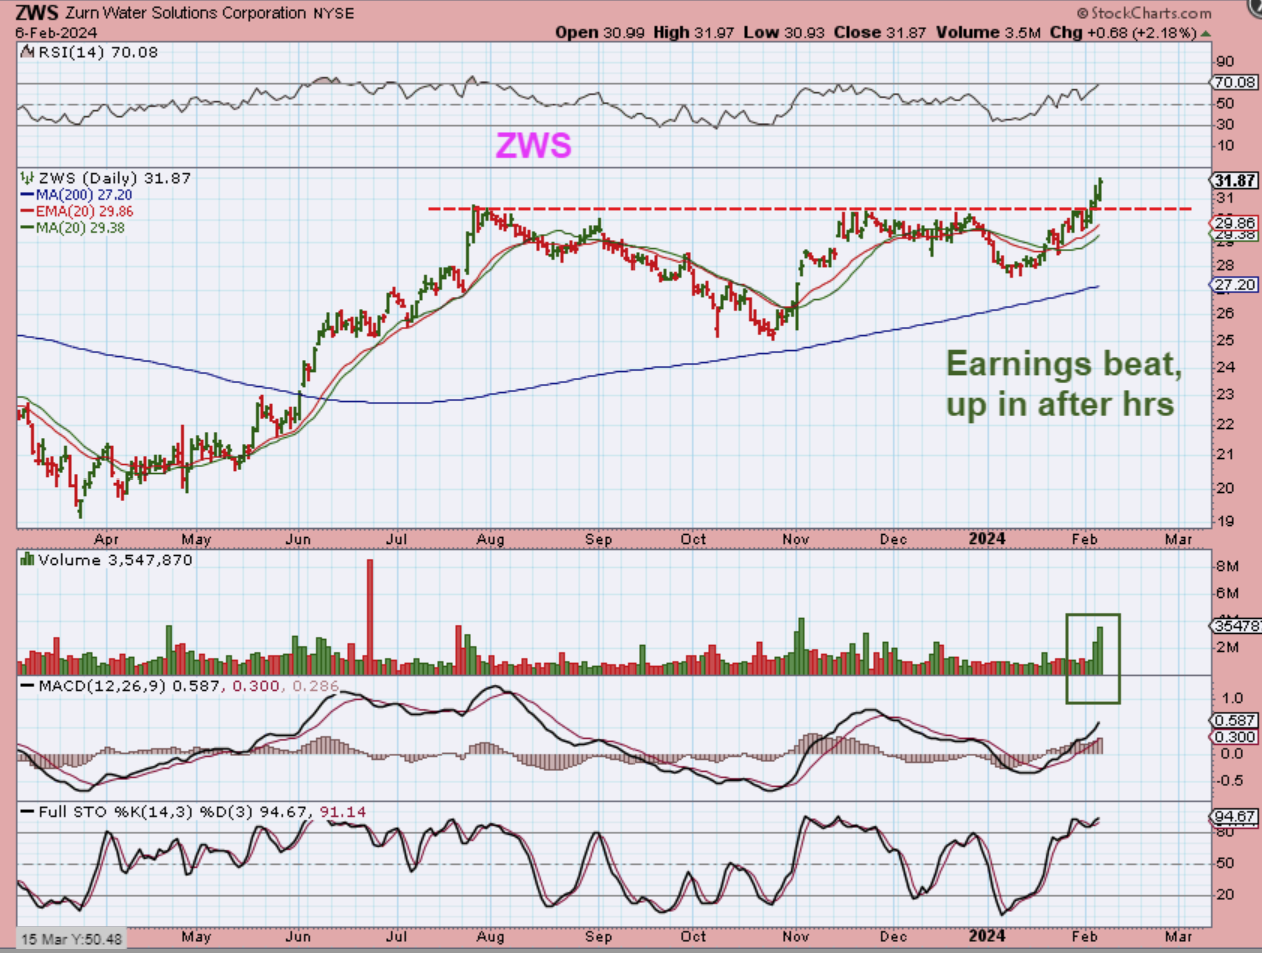
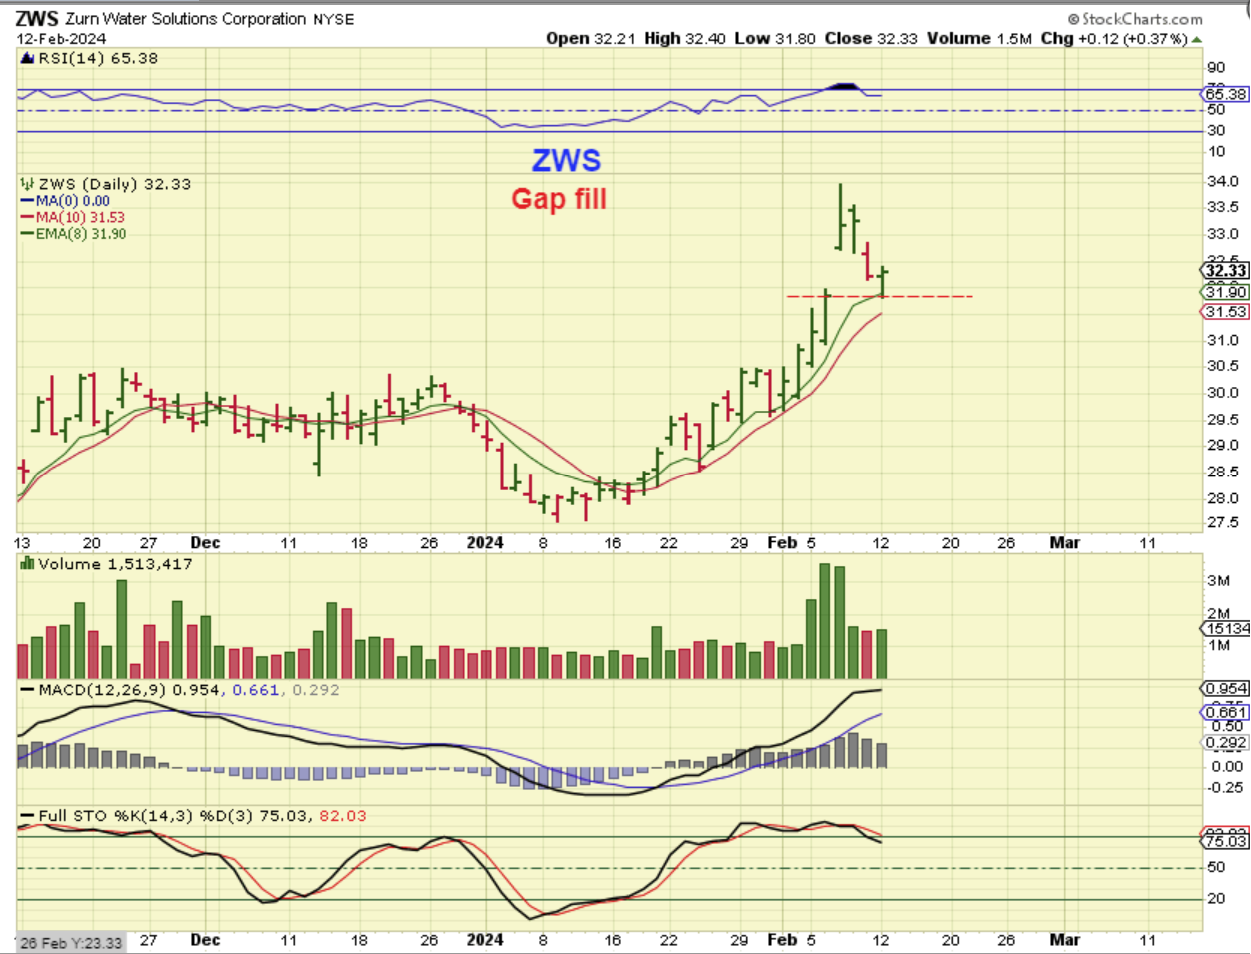
ZWS and after a large earning Gap open, it just closed that gap and put in a reversal, so I posted this yesterday midday when it was at $32.25.
ZWS closed as a reversal at $32.33.
.

