February 10th Weekend Report – Rest Up!
Rest up, we have had the Bulls running strong and we likely have another busy week ahead! 🙂
We had another week of very bullish action in the General Market Sectors that were already bullish. Oil has been choppy but it started to break higher, and we’ll discuss that too. The Choppy Precious Metals Sector remained choppy and I expect that to stay the same until we get a dip into our next ICL. In the crypto sector, you may be surprised to see that basically Crypto stocks were DOWN ON MONDAY and even Tuesday – Many did not look good at all, they looked weak on Monday, but suddenly they rallied strongly after Bitcoin broke from a pennant. That will be discussed in detail as the Weekend Review as possibly the start of a very big move higher. Let’s go to the chart…
.
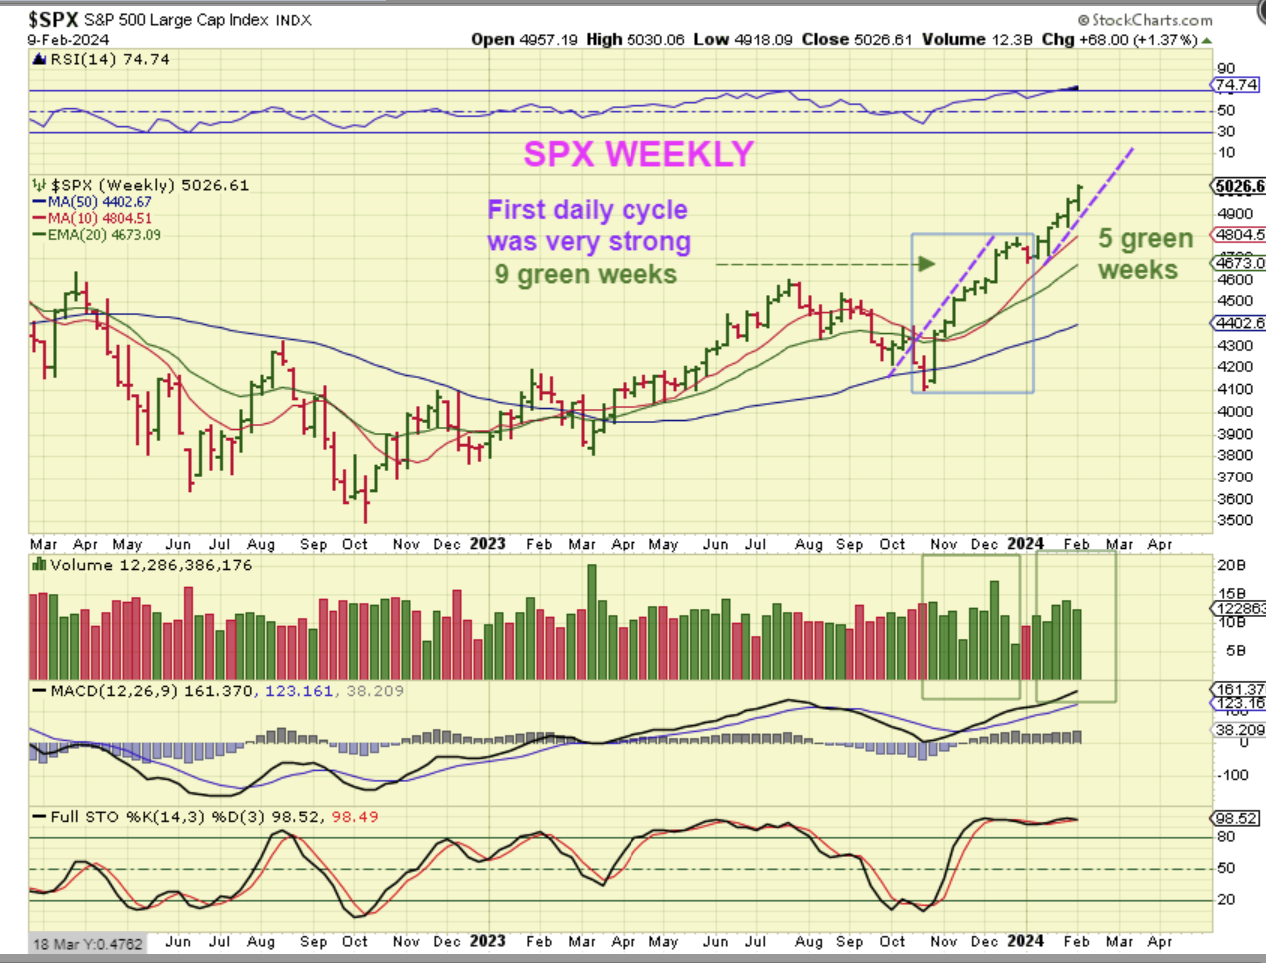
SPX WEEKLY – All I can say is that the General Markets remained bullish. We did expect this, since we were midway through the 2nd daily cycle. CAN IT CONTINUE? It could. Let’s discuss that…
.
Friday was day 24 of maybe 35 -40 days, so we could ride higher this week using stops at the 10sma or 20 ema.
Now let’s just say that we expect a dcl at day 37… we could start to dip anywhere, but let’s say that we go higher until day 32 and then roll over. That is 9 days away and that’s actually 2 weeks away, so yes this can go higher (but it is a 2nd daily cycle, so it could peak even this week, so we use stops).
.
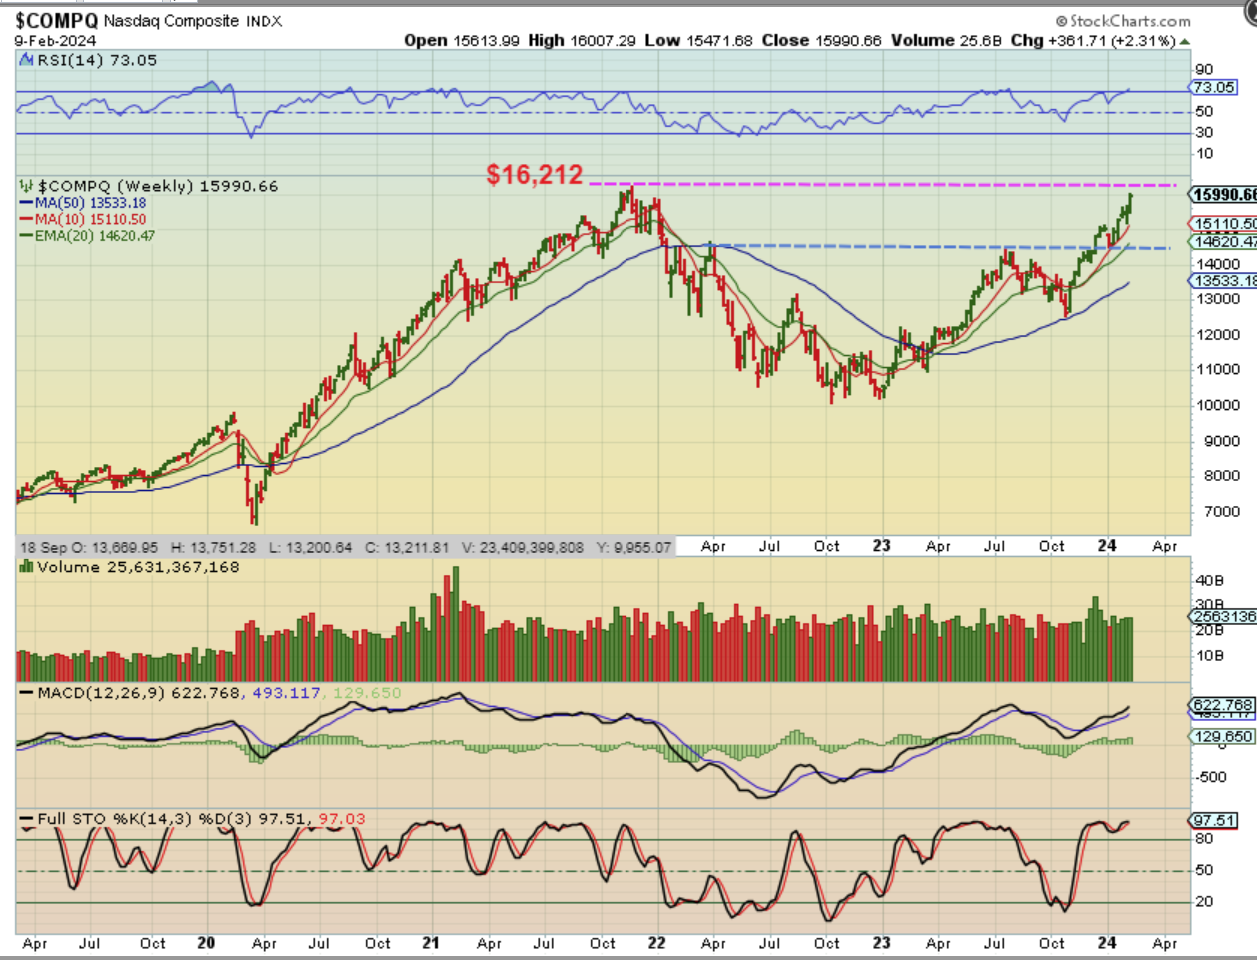
NASDAQ WEEKLY – I mentioned a few weeks ago that the NASDAQ would likely try to run to former highs at 16,212 ( The SPX was already there). We are almost there now and it still could happen as this daily cycle ‘peaks’, and then we’ll drop into a dcl.
.
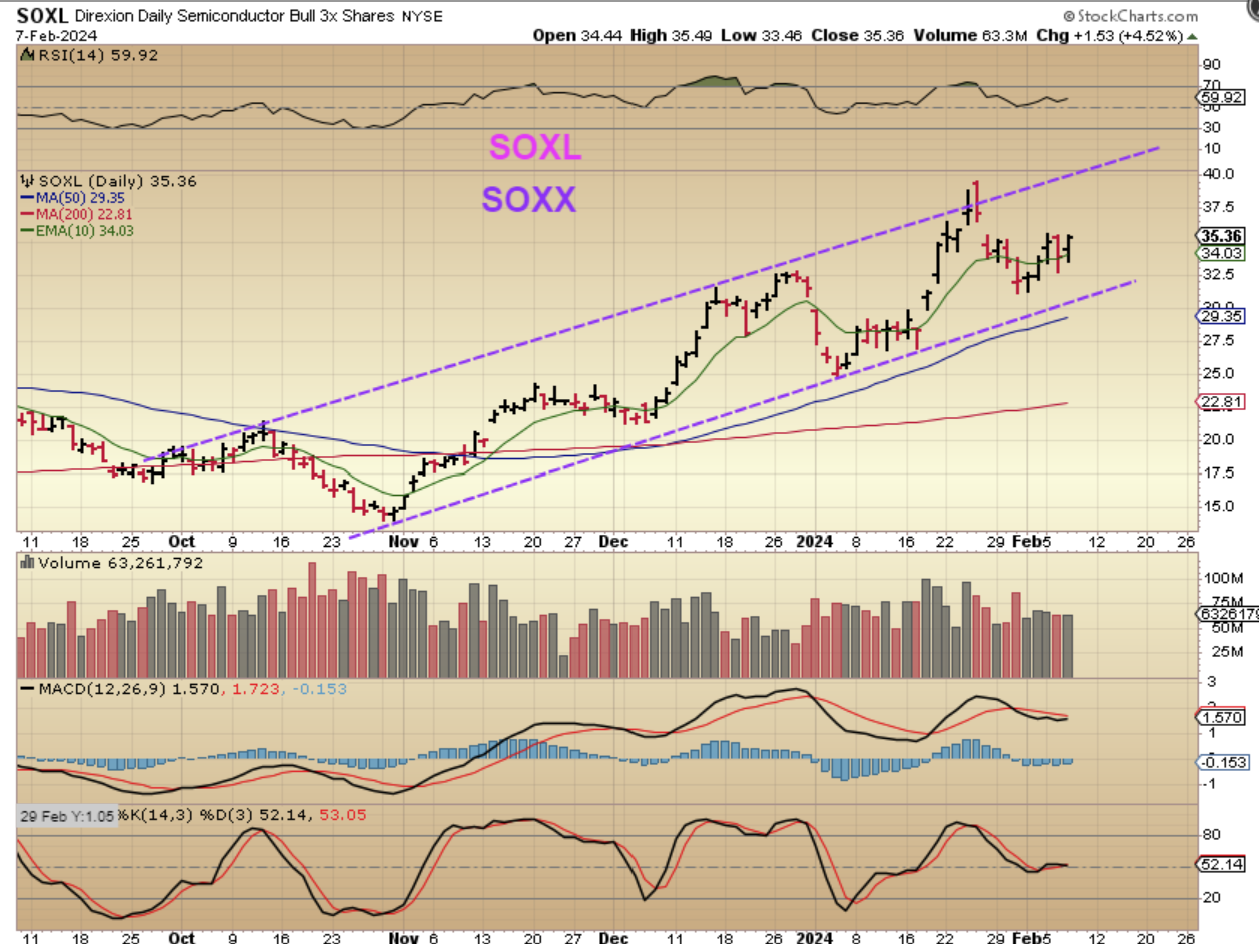
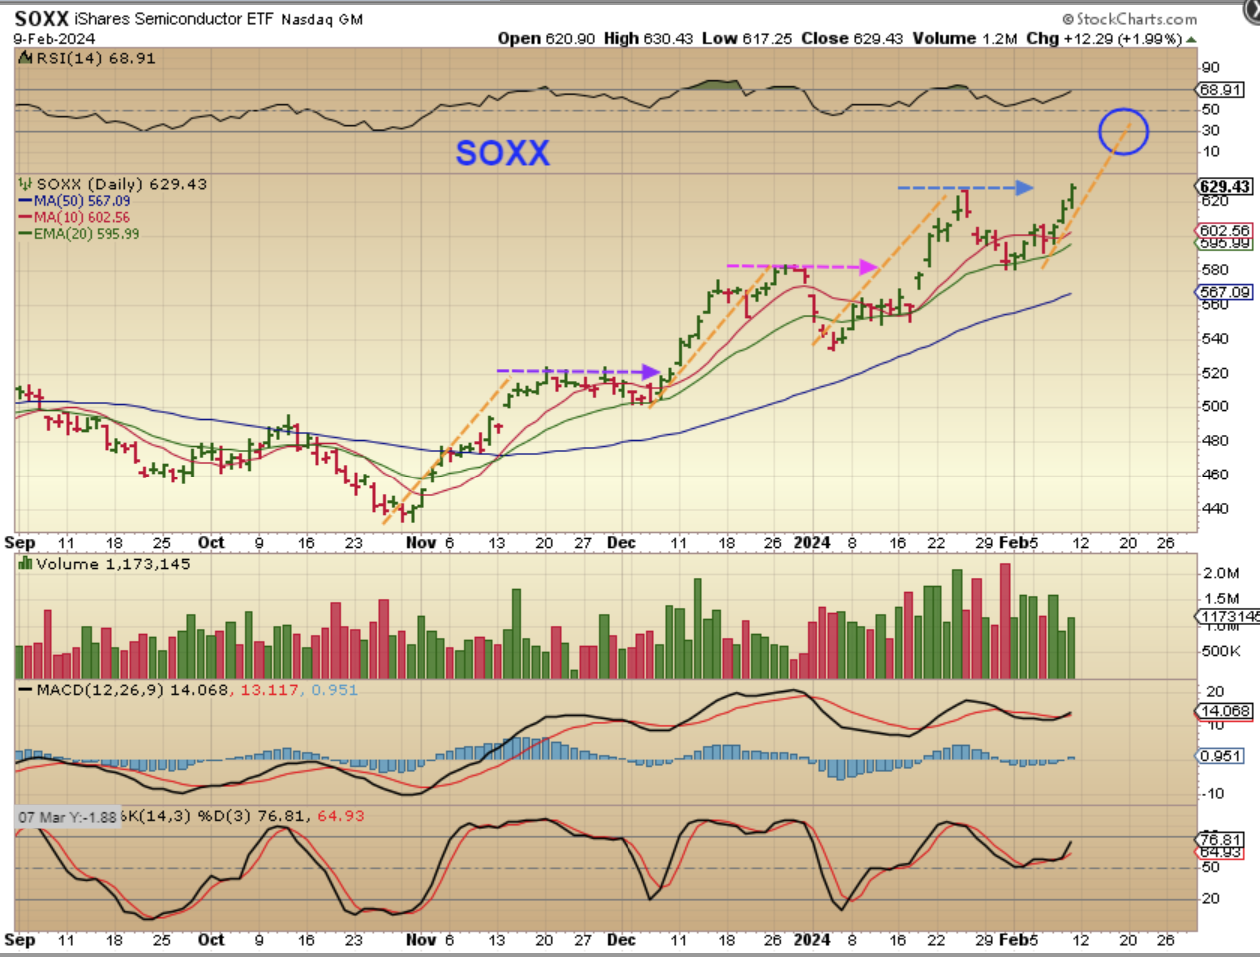
Using this chart a few Days ago I pointed out that the SPX & QQQ were already at the January highs, but I said that the SOXX (or SOXL) was not. I mentioned that it could play catch up and that SOXL is a good buy, since it makes good gains that way. And now…
.
SOXX DAILY – The SOXX did make it up the Jan highs this week, and for the SOXL that was 11% gains…
.
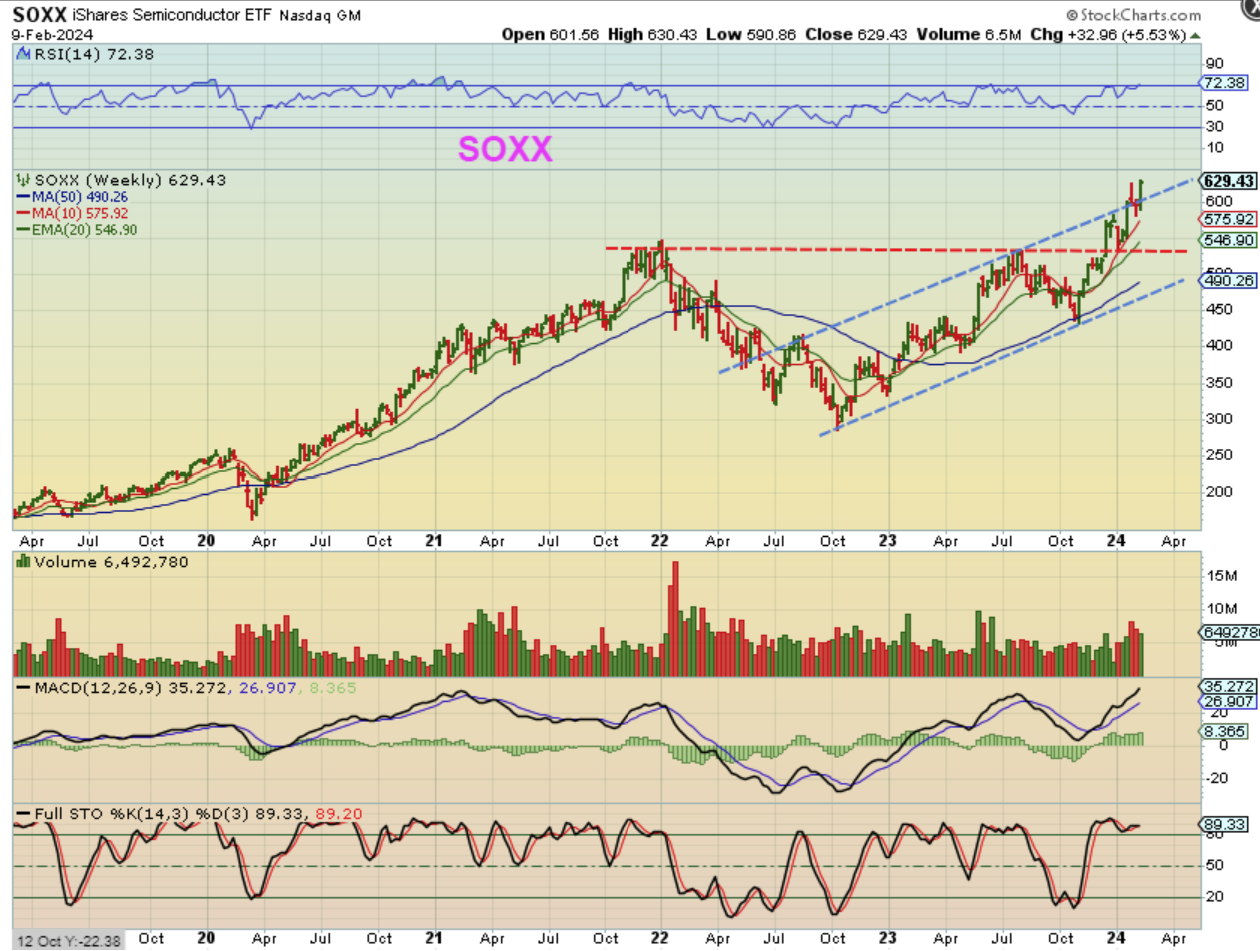
SOXX WEEKLY – Notice that in the bigger picture, The SOXX was up 5.53%, so The SOXL was up 3x that or 17% this week. That was a good trade and it can continue a little higher with the QQQ & SPX moving higher. SOXX is at new all-time highs, well above the 2021-2022 highs.
.
OILS ICL?
.
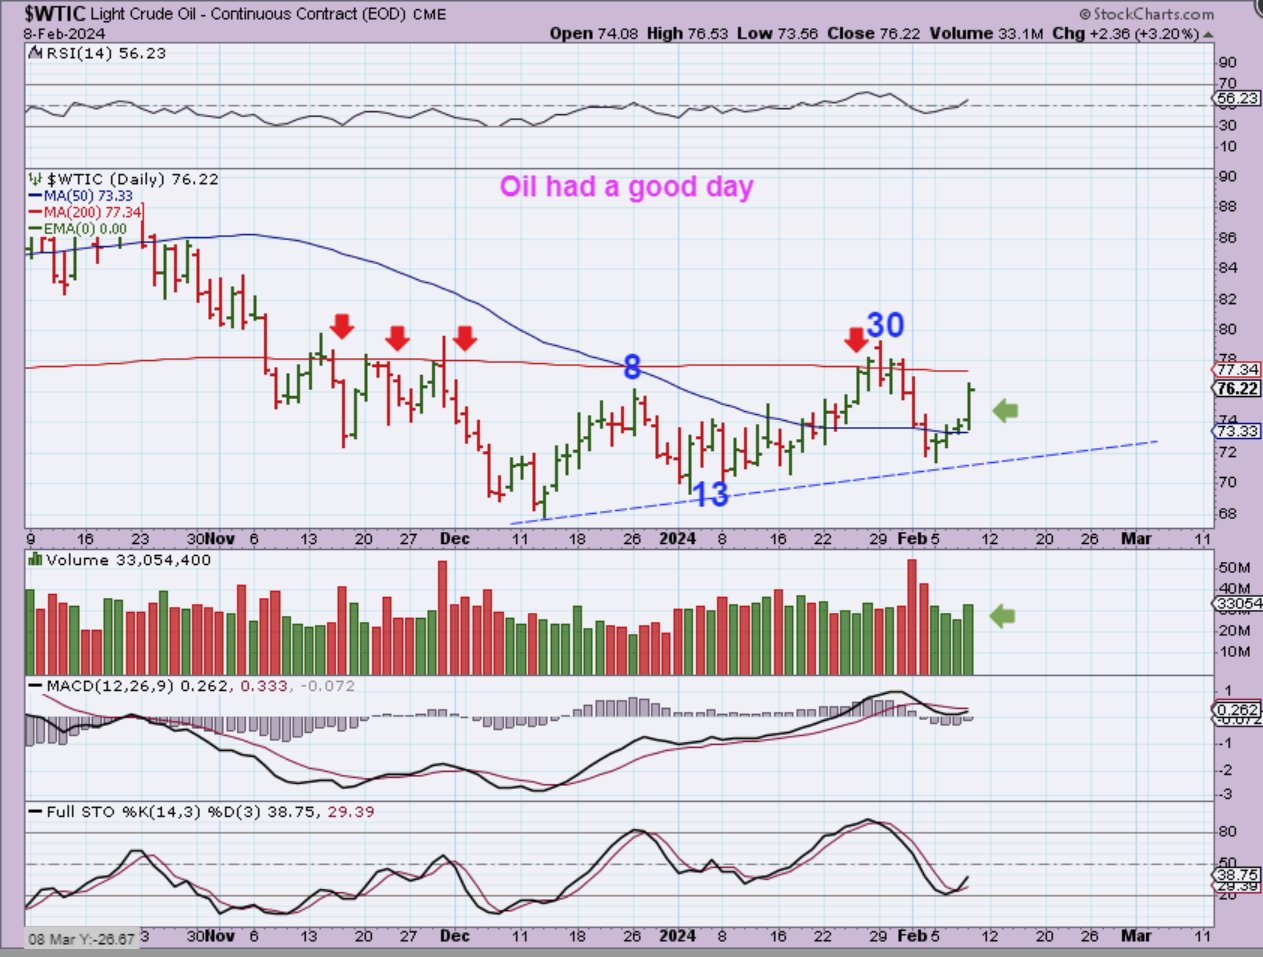
On Friday I said:
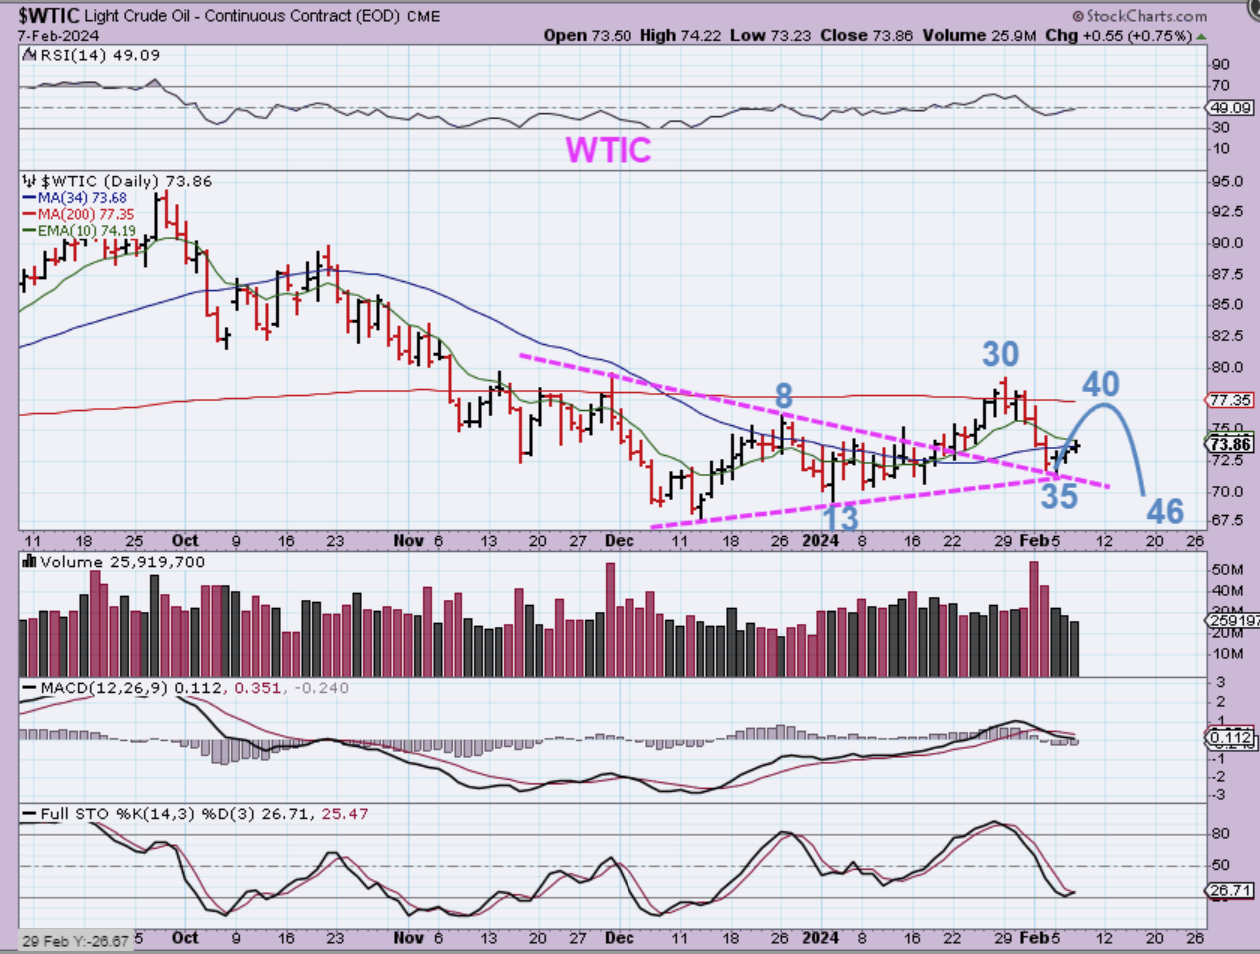
WTIC – Oil made its last low on day 35. In the past that has been a little early, but yesterdays move was over 3% and the volume looked good. It also looks to have capitulated into that low, with a heavy volume drop, so Oil MIGHT have a dcl. UCO & USO looked good, you can try to buy with a stop around the 50sma, or see if it pauses and crawls along the 200sma and buy then too.
.
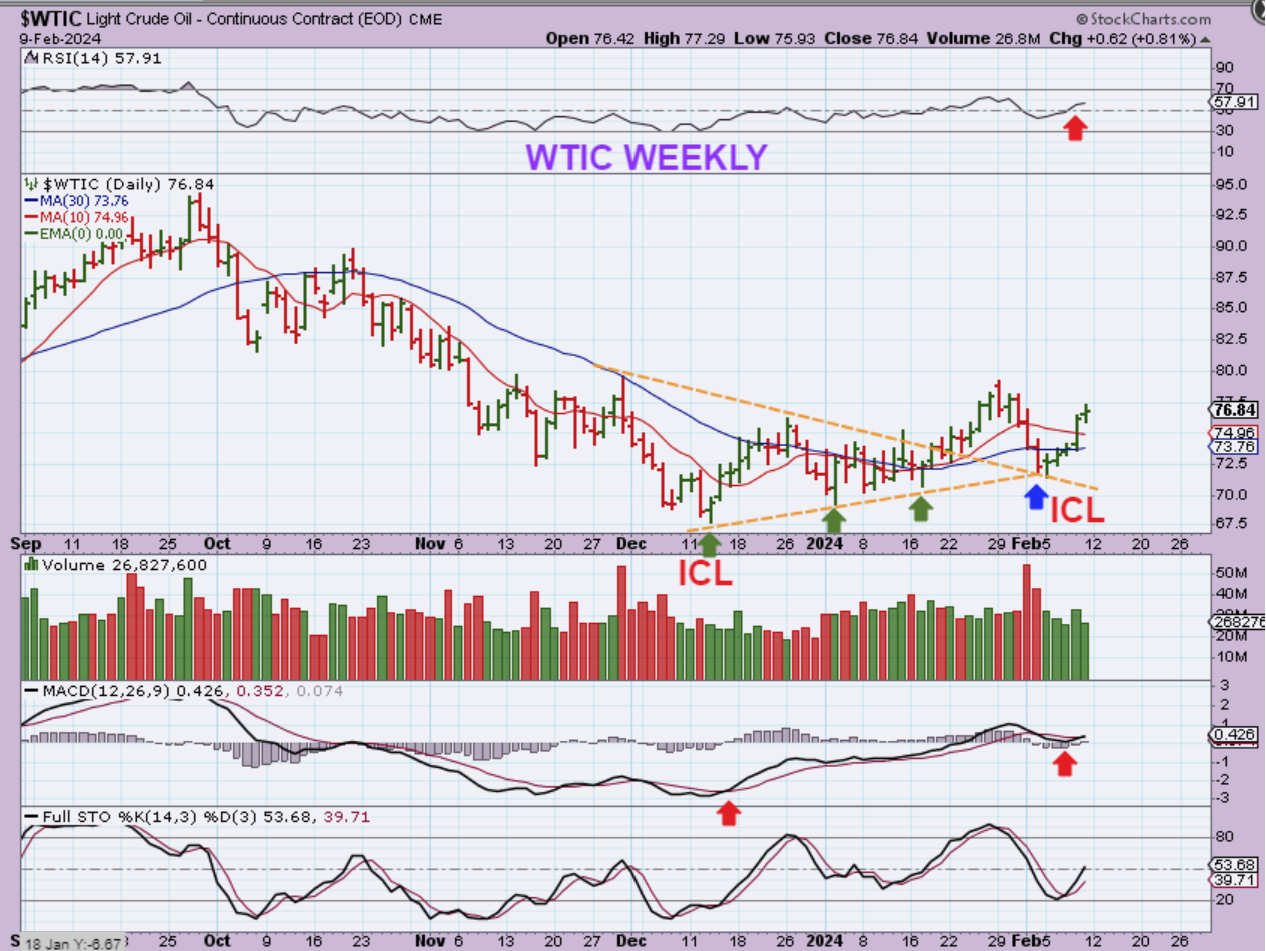
WTIC DAILY (not weekly, as stated on the chart). – Oil didn’t move much higher on Friday and is still under that 200 sma (not shown). I am thinking that Oil really may have already put in an dcl if this continues higher, above that 200sma. It still may be early though, since that last low was only at day 35 at the lows and we have seen 45-50 days lately. Next week should let us know either with follow through or a pull back again.
.
WTIC – This is the alternative idea drawn for you on Feb 7th, and this is what we will look for as a possibility next week.
.
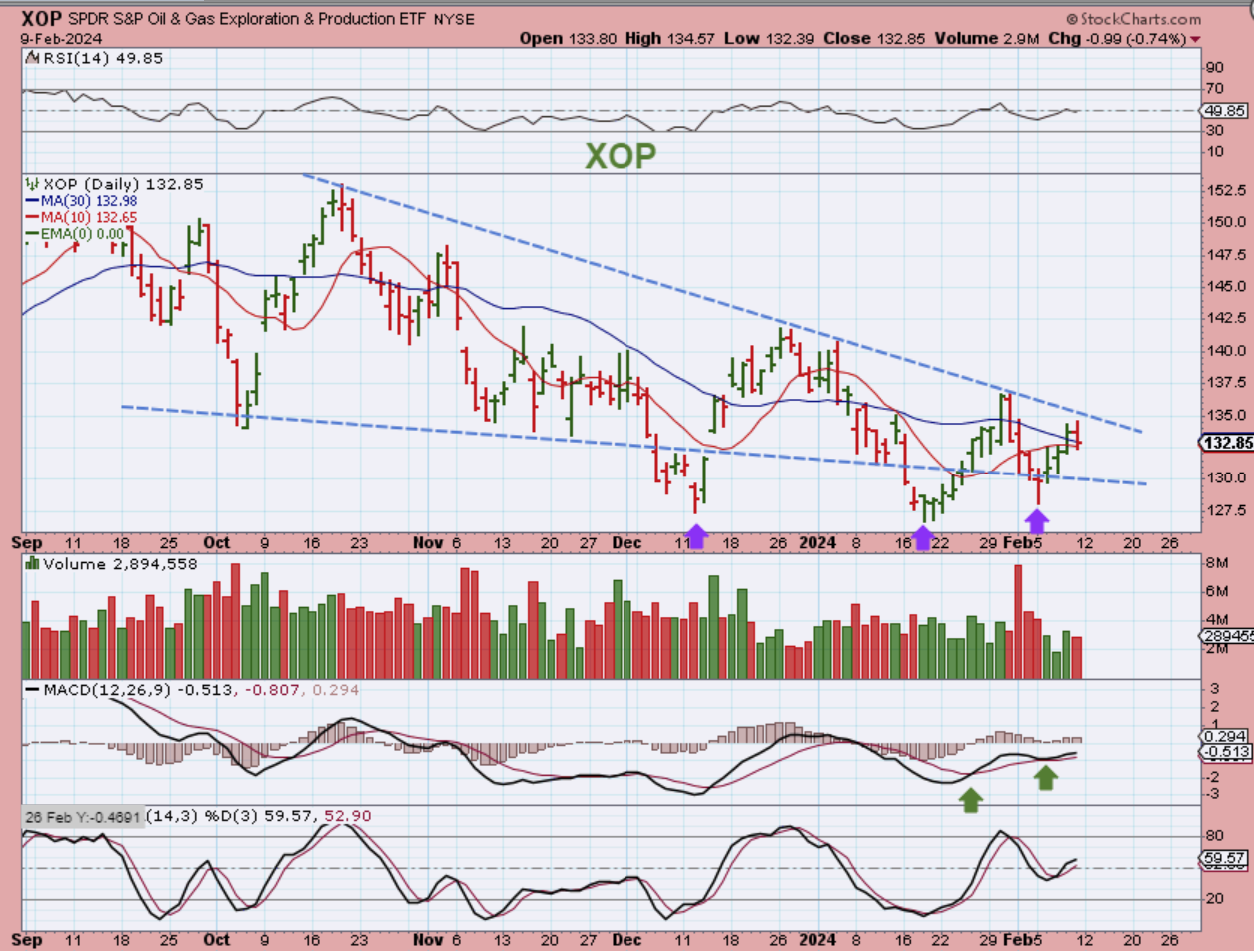
XOP DAILY – With Oil possibly breaking out or rolling over into one final drop next week, we see that The XOP has a similar set up, but it did drop on Friday. It is a bullish set up longer term, but short term it could go either way. Fridays drop here may be signaling that Oil will drop next week.
.
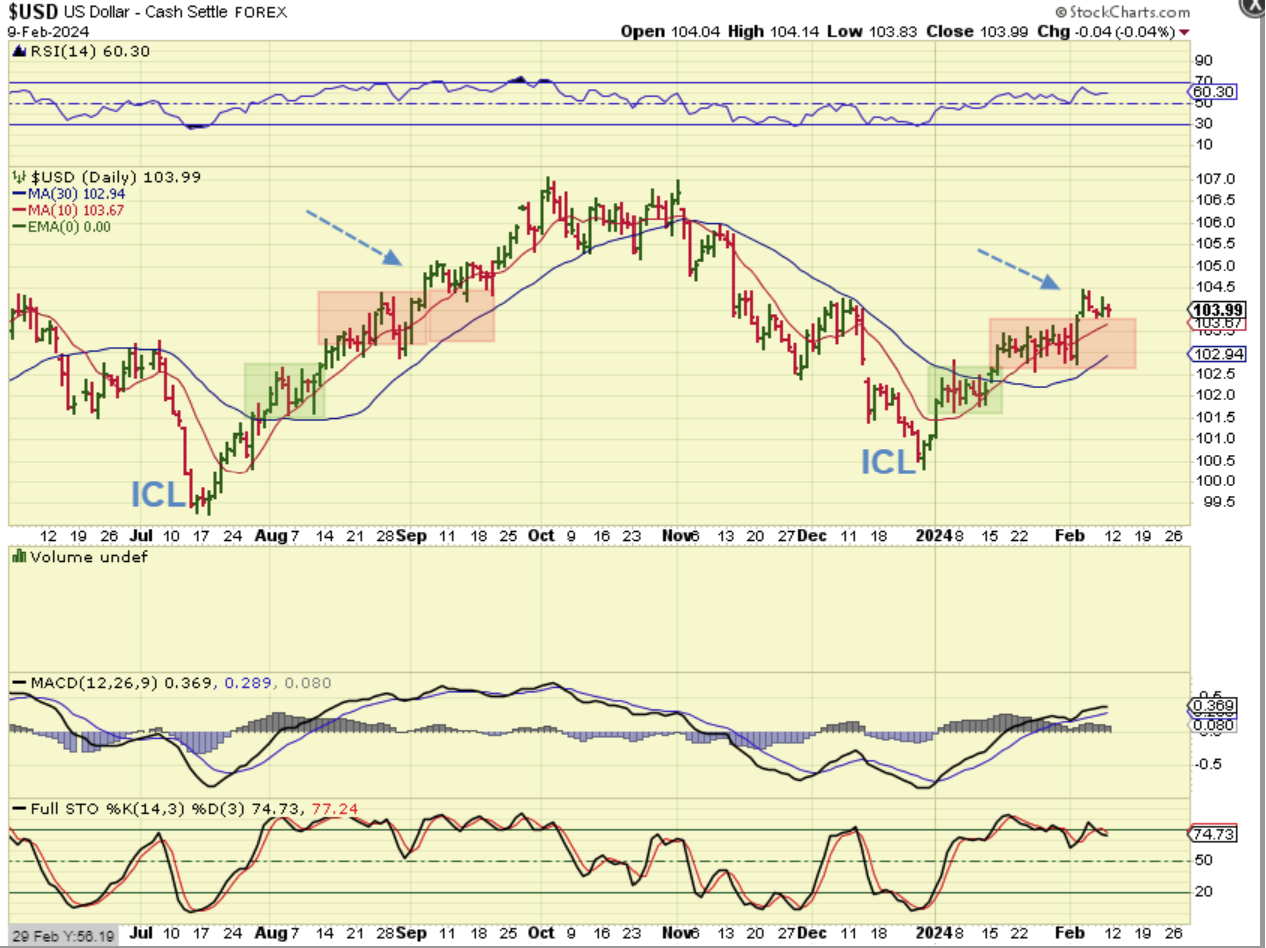
THE USD DAILY – The USD is working its way higher out of an ICL, and is at $103.99. I said that…
.
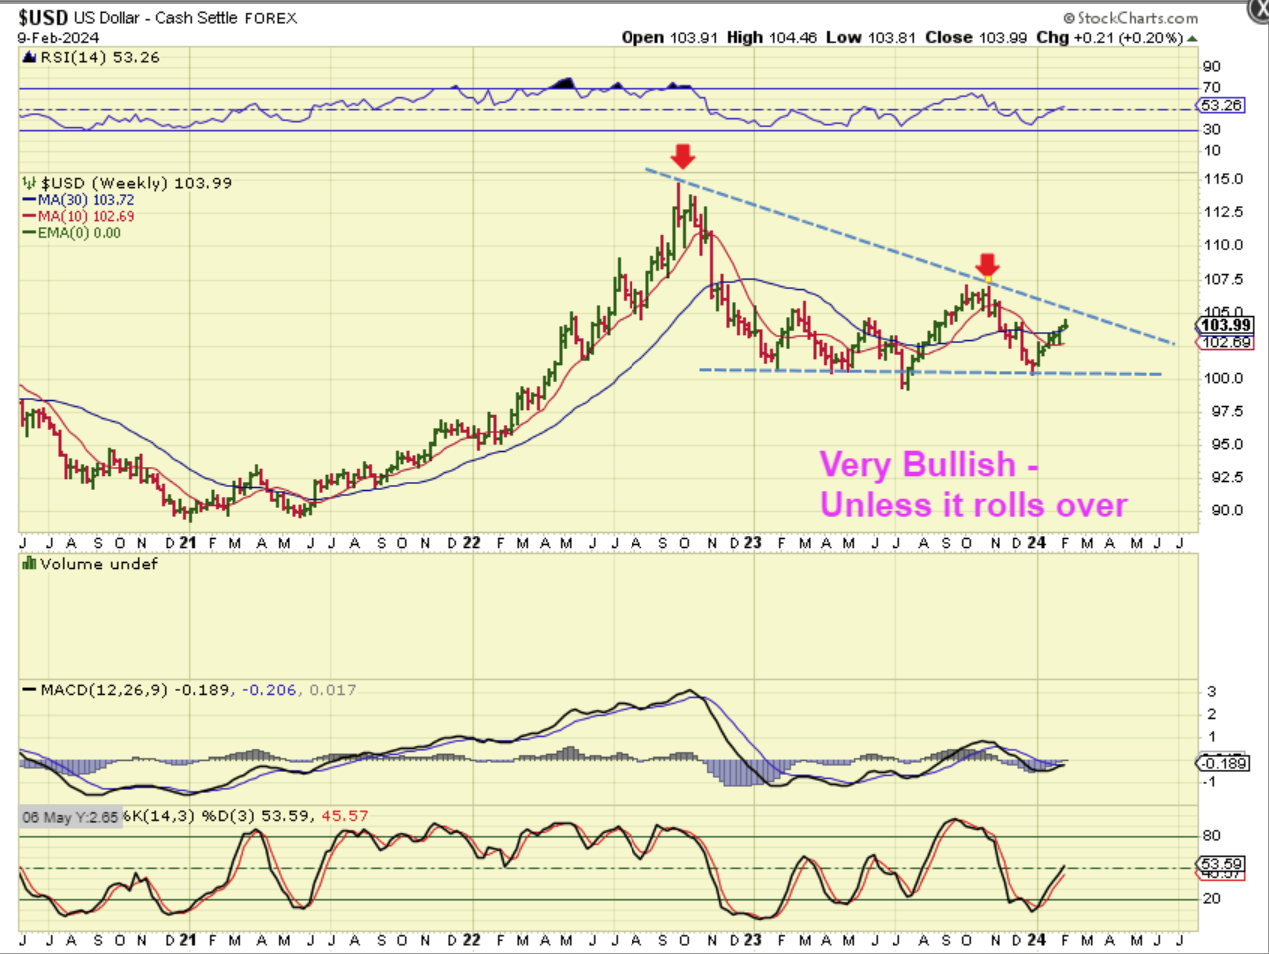
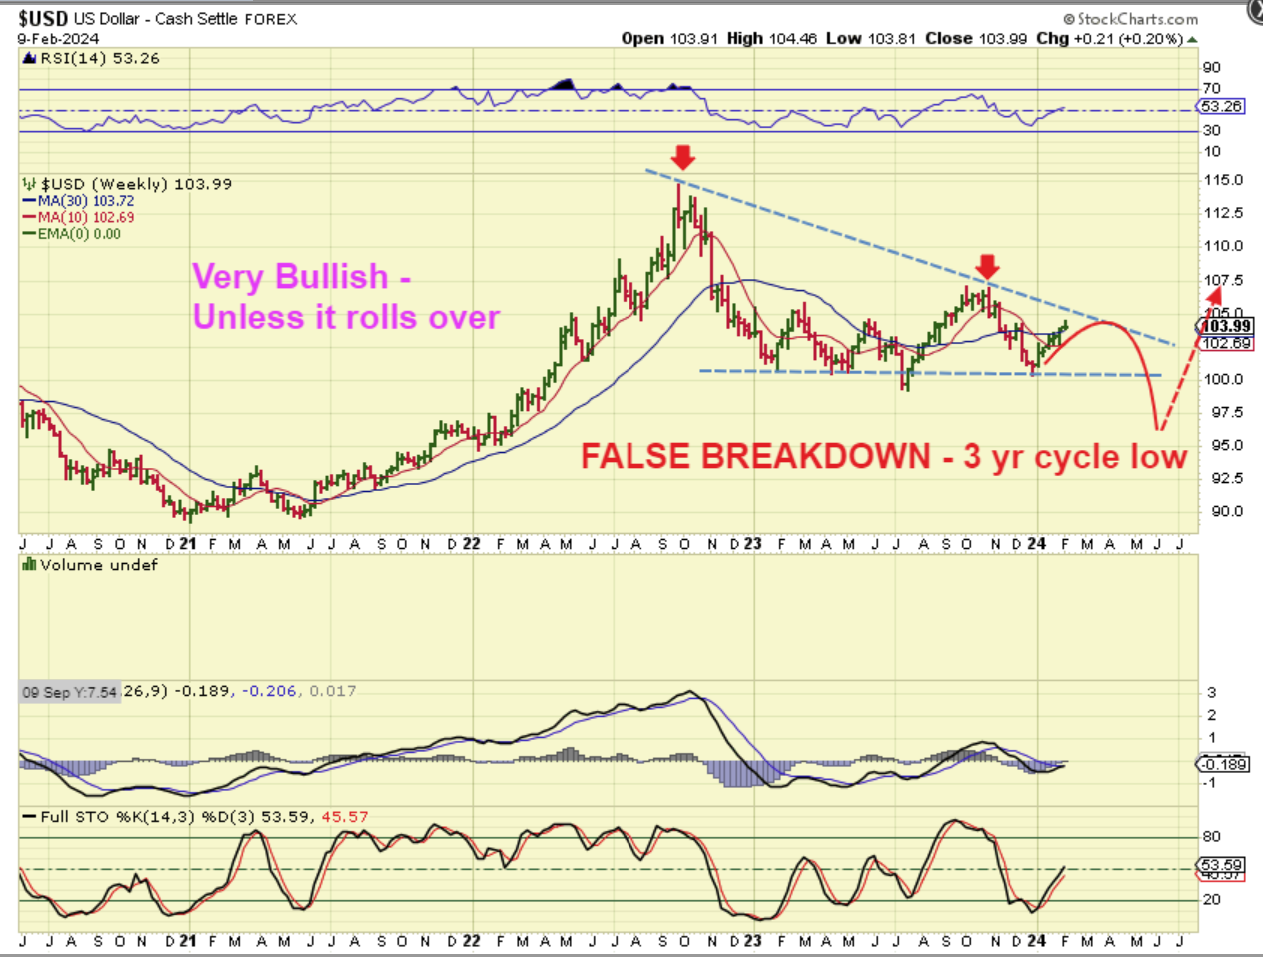
USD WEEKLY – I thought that the USD would run to about $105 and then it could stall, chop, and find some resistance. Please read the chart…
.
USD WEEKLY – So that is a very bullish set up , but it should roll over like this if the 3 yr cycle low is still ahead. Please read the chart.
.
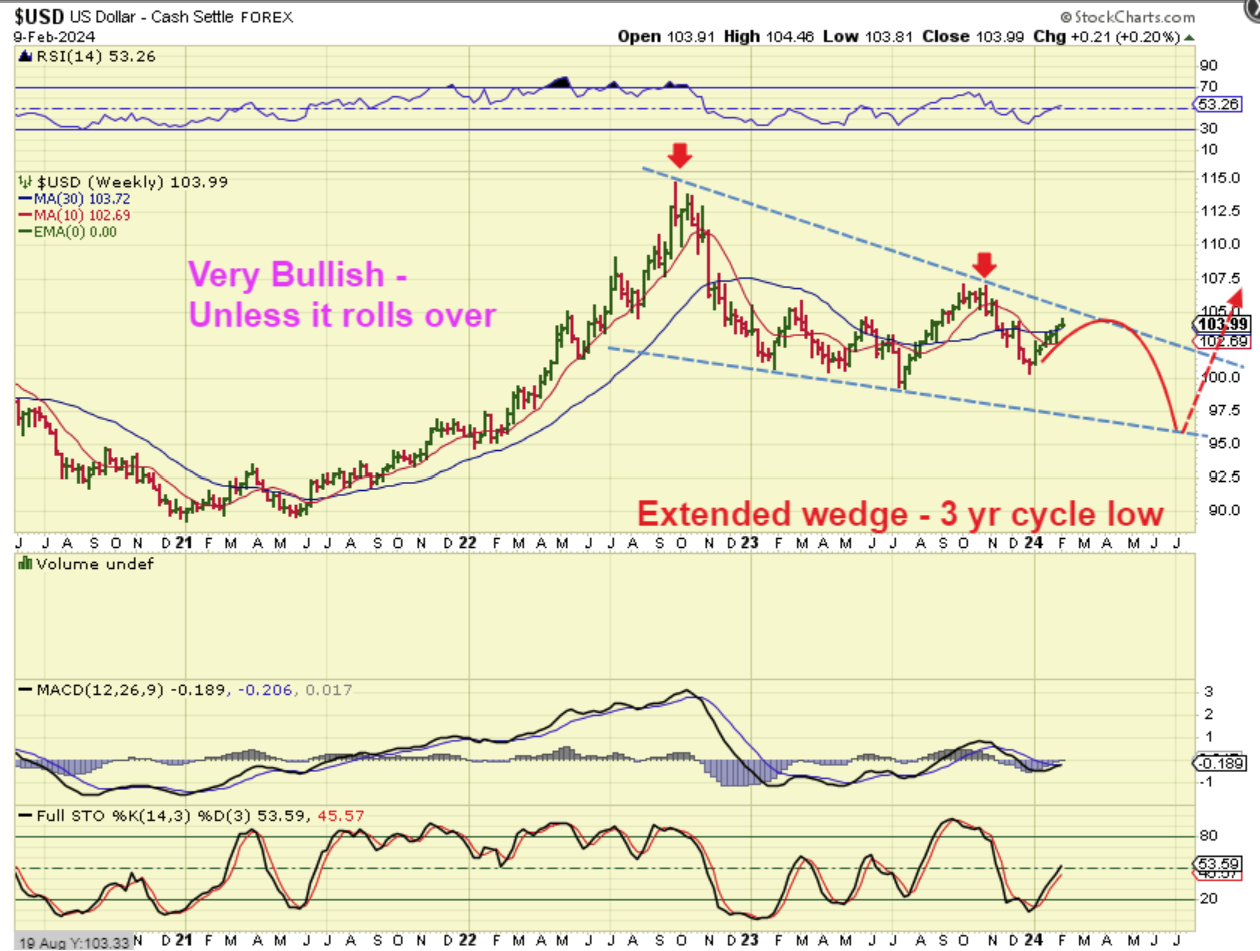
USD WEEKLY – In fact, that wedge could become ‘extended’ as this drops down over time into the next ICL and 3 year cycle low. If this happens, Gold will breakout to new All-Time highs. So let’s go to Gold…
.
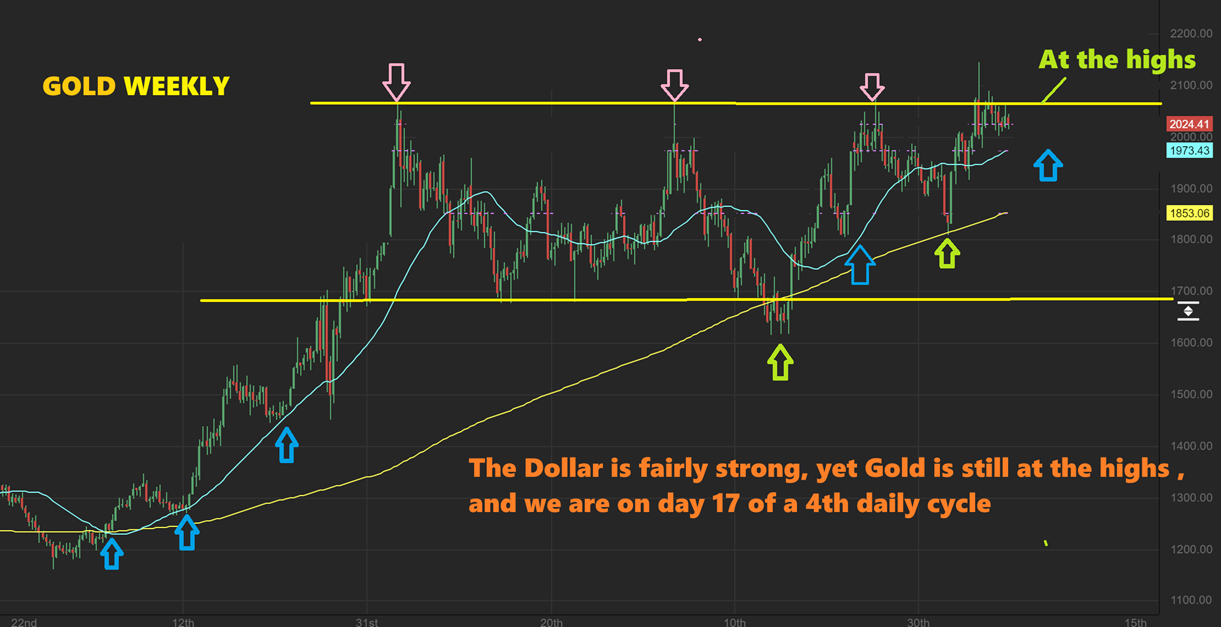
GOLD WEEKLY – I love that Gold is still hanging round at all-time highs. Why? We are midway through the 4th daily cycle, so Gold should be week and dropping into an ICL. Right now, it is showing strength and a lack of volatility, and that is bullish in the big picture. Read the chart.
.
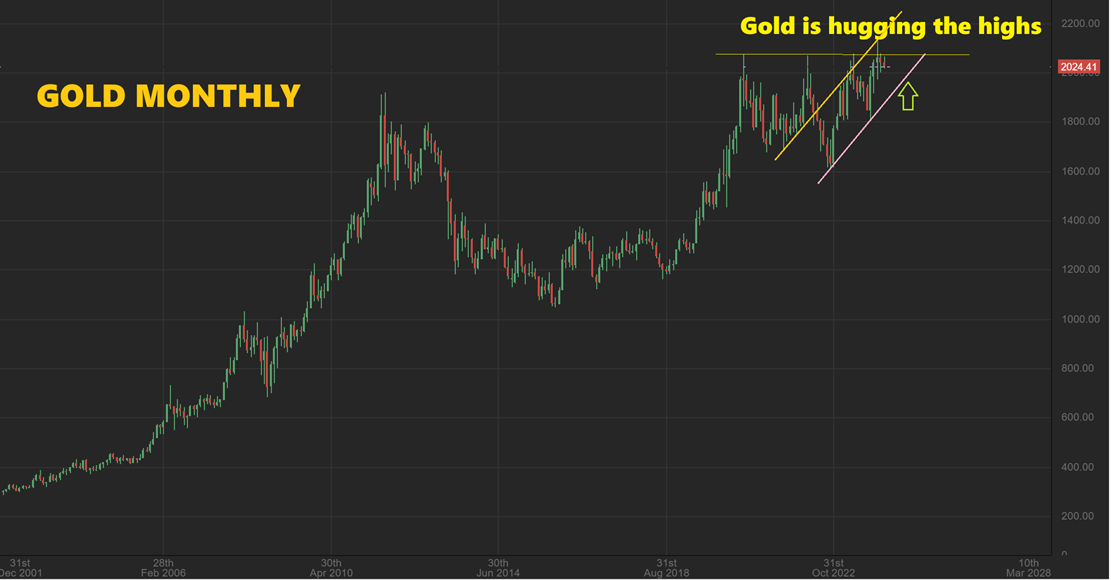
GOLD MONTHLY – On the Monthly chart, Gold is AT the highs. You can see that channel that I drew connecting the prior 2 lows. Gold can drop to the Magenta line for the next ICL and this chart remains perfectly normal and bullish. It could then easily break to new highs from that point.
.
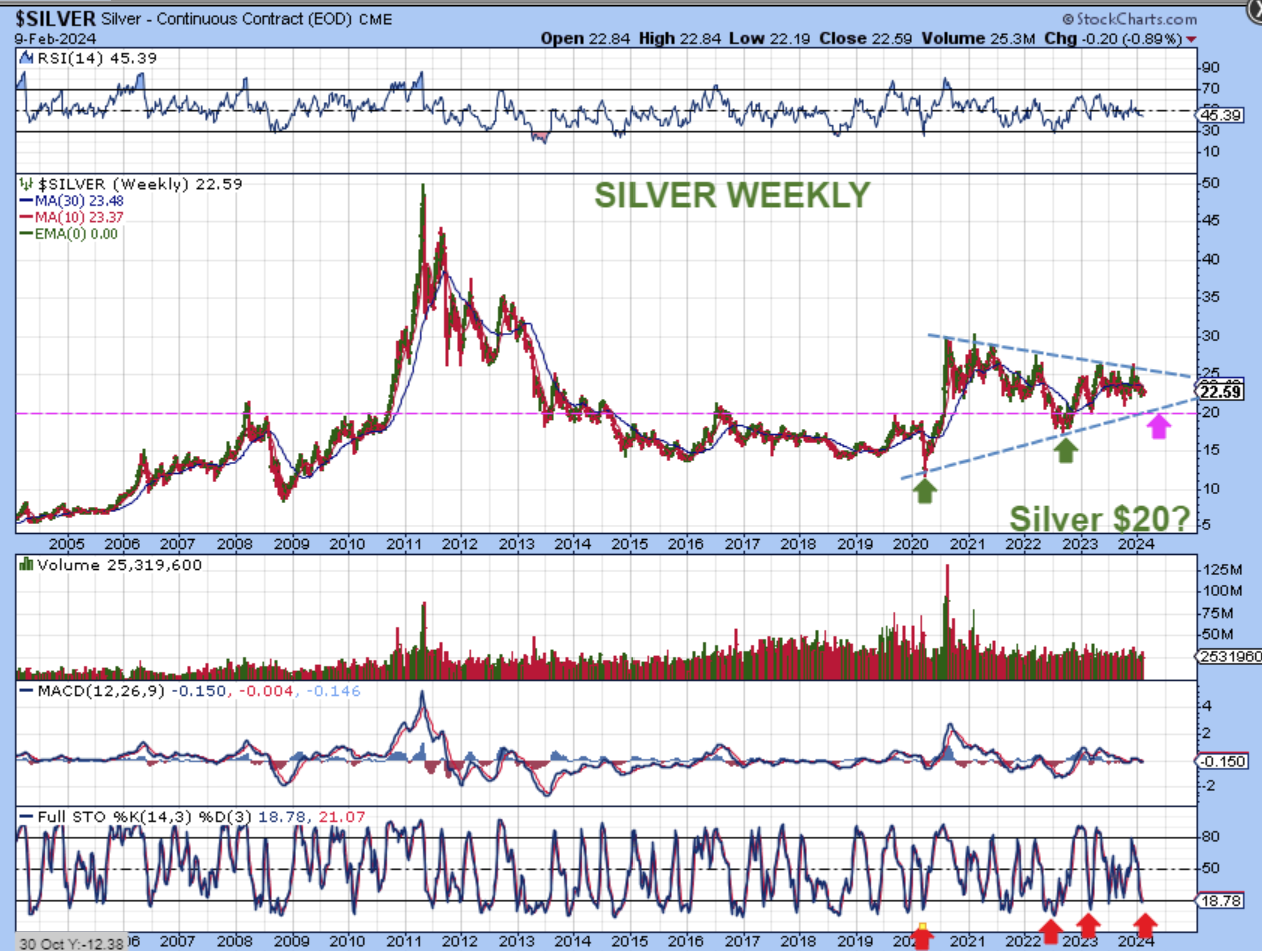
SILVER WEEKLY – Silver has been weaker than Gold, choppy and frustrating if you are in it or hoping to buy, but we here at Chartfreak know that this is the ‘time’ for another drop. We are in the 4th daily cycle and expecting a drop into an ICL. Look at the blue and the Magenta lines. It may be that Silver drops to $20ish.
.
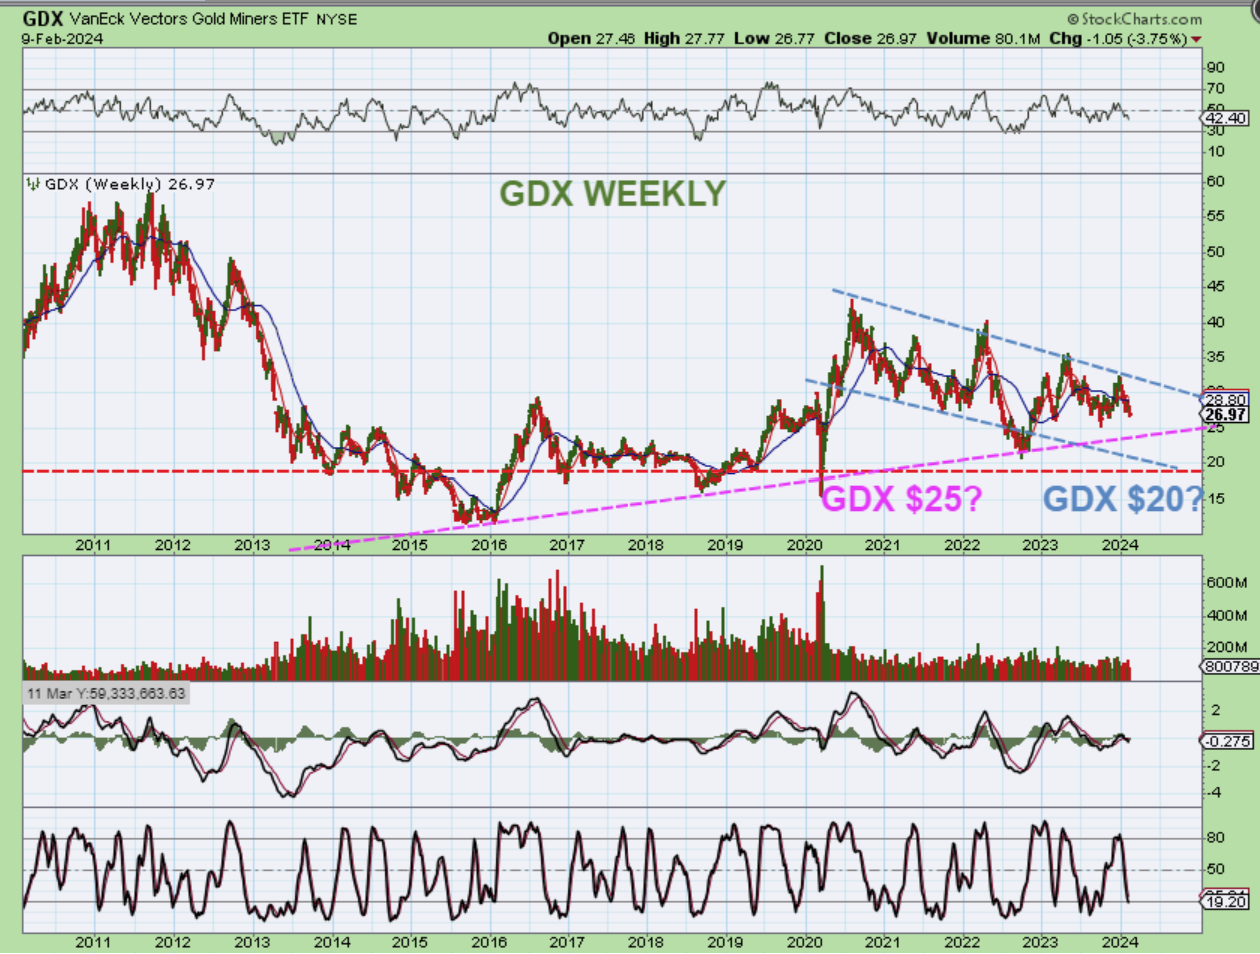
GDX WEEKLY – I drew an up trending Magenta line, and a downward sloping channel using a Blue lower line. One acting as support would put price at $25, and the other would be around $20.
.
The last 2 weeks of trading ( or simply being long the markets) has been very good. Actually, the General Markets have performed very well since the ICL in Oct 2023 (15 weeks almost straight up!). That makes it very right translated, so after an eventual dip into a dcl, the 3rd daily cycle is a buy too. With Oil back at the lows on day 35, the first daily cycle did more of a round trip than a rally, but the 2nd daily cycle might be worth trading if you like the energy sector. That low may be in place at day 35, but I tend to think that it is still ahead with one more dip. We should know this week, and I’ll cover that in my daily reports.
We are patiently waiting for those deep meaningful lows (ICL) in the Precious Metals sector, but that may be a couple of weeks away. And what about Bitcoin and the Crypto sector? Going into this week, everything seemed normal as Bitcoin had dipped into a dcl and was bouncing out of those lows into a pennant, but toward the end of this week, Crypto Stocks joined in and Bitcoin stretched out. Let’s discuss that below. Hope all are having a great weekend!
.
~ALEX
.
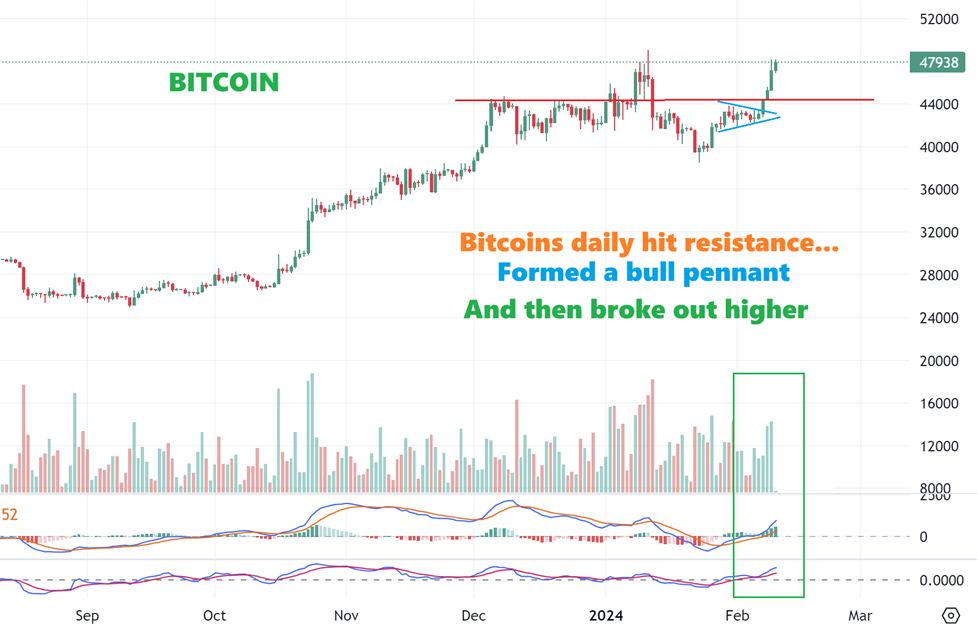
BITCOIN ‘Peaked’ and sold off after the ETF Approval in January, and dropped into a dcl at the green arrow. It did not look like a normal ICL drop, so it seemed that price would bounce out of that dcl and then roll over into a deeper ICL. As it worked its way higher, it started to chop sideways and formed a pennant. Pennants are bullish if they break higher, so I started to discuss this may be changing to bullish again (But Crypto Stocks Dropped 7% on Monday and didn’t look bullish).
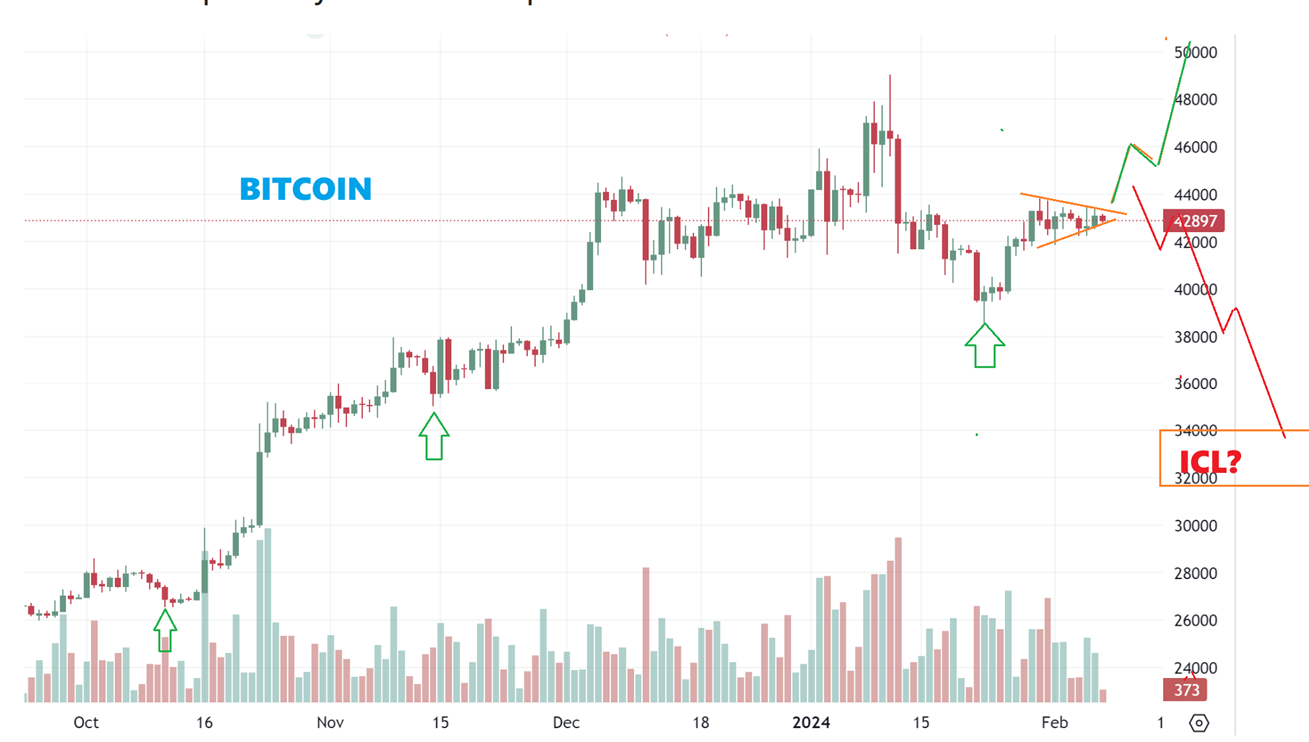
BITCOIN then broke higher from that pennant on this chart, but even then, most Crypto stocks only moved up 1-2%. I mentioned that we need to keep an eye on this breakout (It had a measured target back to the approval highs, see the yellow lines). This is what I wrote:
.
WULF and MARA were only up 2%, RIOT was up 4%, which is odd for this sector on such a nice breakout, but a few other crypto stocks were up a little bit more. I am keeping my eyes on this area today too.
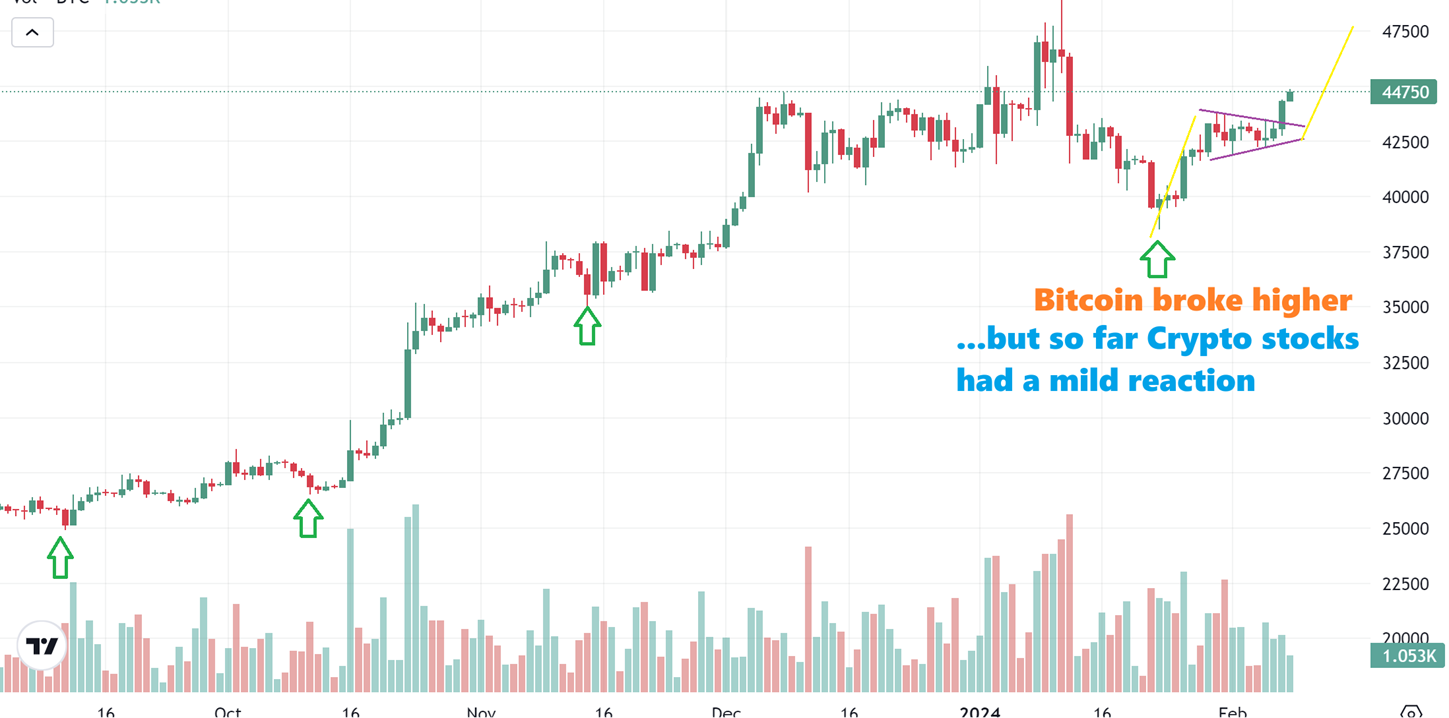
BITCOIN kept running, and volume was growing, as seen on this chart. THAT makes it look legitimate. Also, Crypto Stocks started to run on Wednesday, so now this was looking very real, as in: “Surprises to the upside”. I pointed out some crypto stocks and I day traded several of these, and they were up 2-3% in the morning after attempting a gap fill, but closed up 14-20%. That still gives you 10-15% gains. So now as of the end of last week, MARA, RIOT, CLSK, BTBT, WULF, BITF, etc are acting VERY MUCH like they did in past runs, so we do need to discuss that. They are up quite a bit, but still at the lows. —but lets stick with Bitcoin for right now…
.
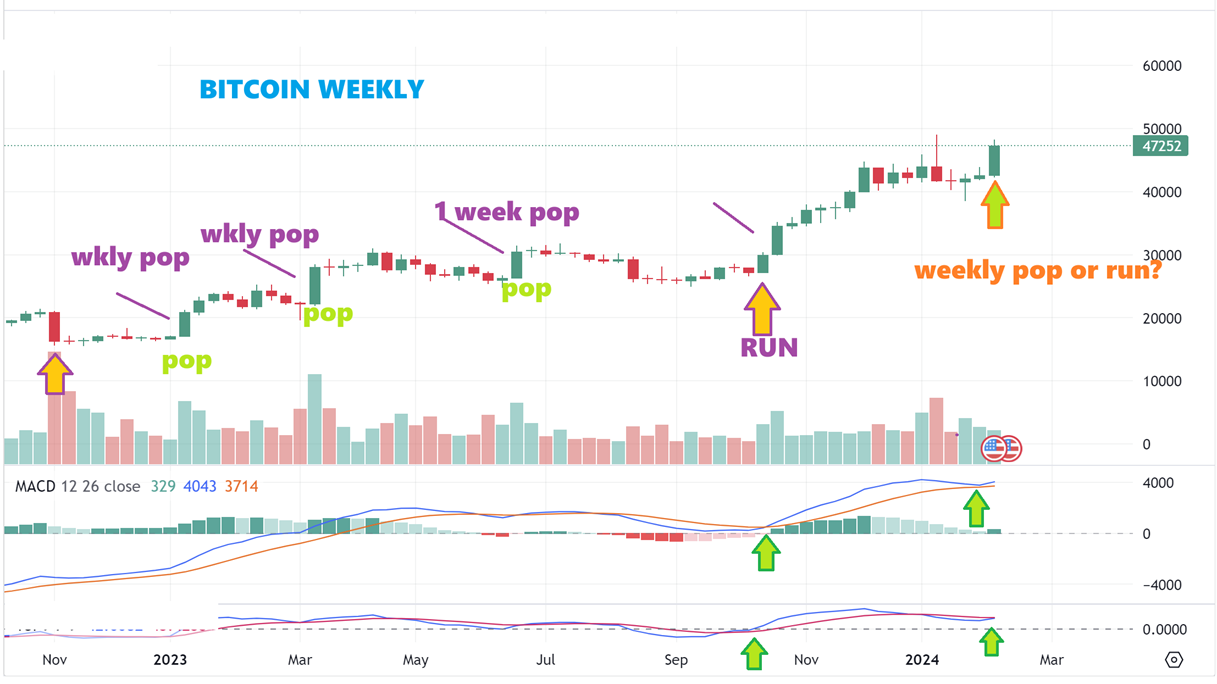
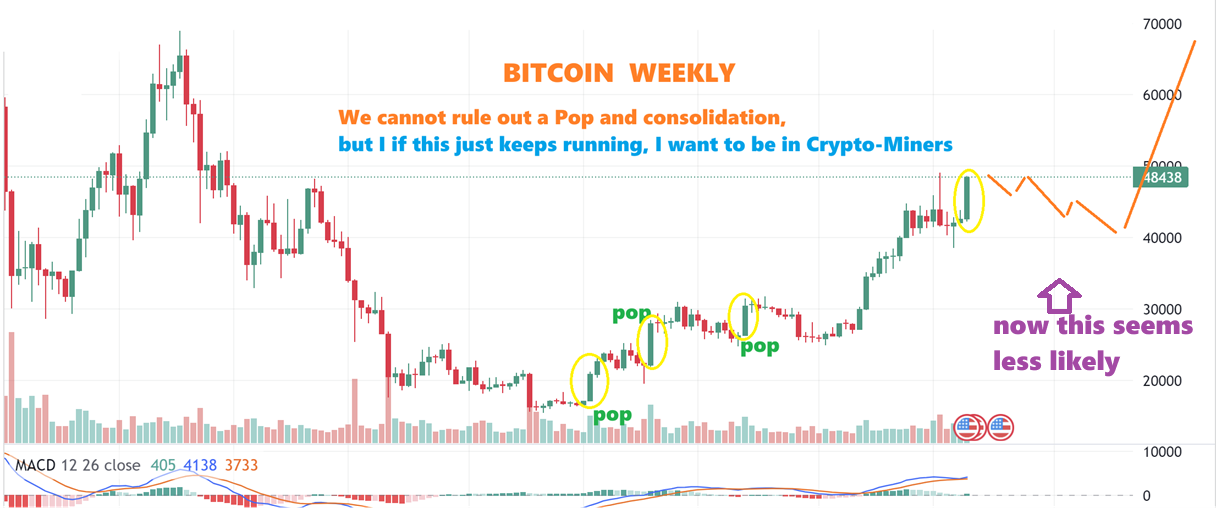
BITCOIN WEEKLY– What I am showing here is that I have seen quite a few “1 week POPs” in Bitcoin that were followed by a lot of chop and consolidation. So it is reasonable to think that this might now just chop sideways or eventually lower like all of those other POPS on this chart, right? Please look at the chart and see those Pops and the chop that followed. That said, I think this is different…
..
.
I have constantly been comparing this run with the 2020 year ‘post halving’ rally, and I have stated that it looks like we are already making that run due to the ETF approval. It may be a very extended run with the halving added on later in the year. A double strong rally could be in store, so…
.
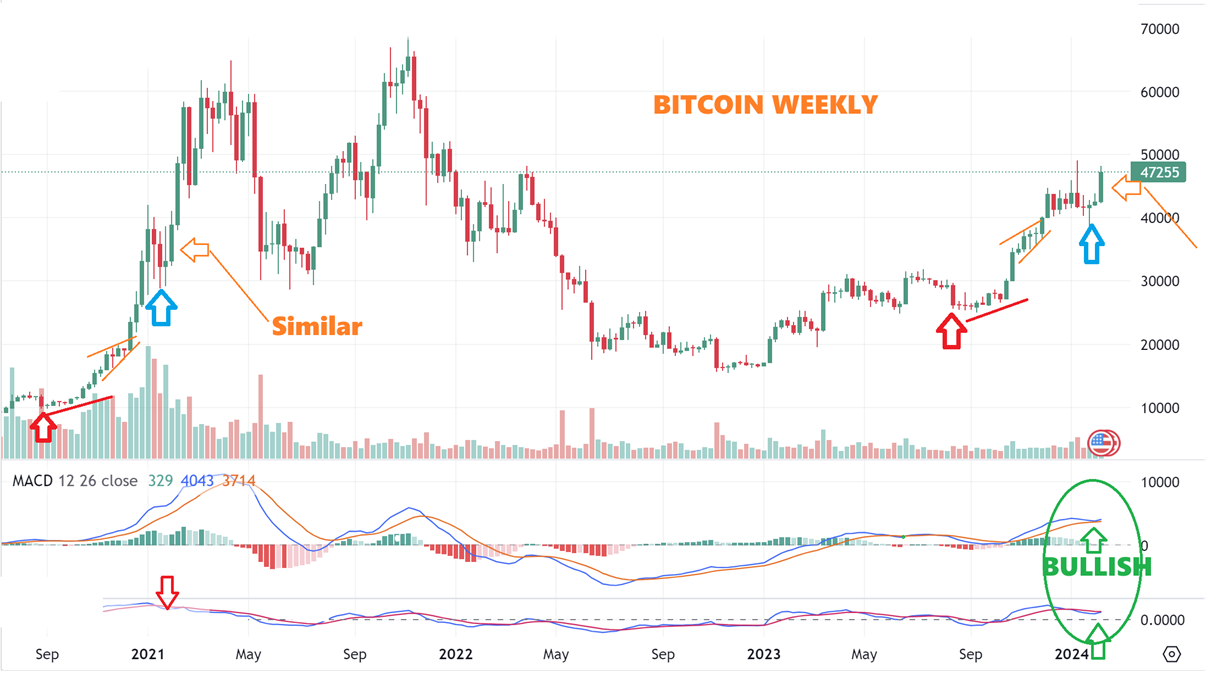
BITCOIN WEEKLY- Look again at the similarities (not EXACT, but very similar), and remember that I didn’t just find this recently, I have been pointing it out for months now as we go along, and it keeps matching what we had on that strong run. Please follow along…
1. Start with The RED arrow ‘shake out’ drop’.
2. Followed by a bunch of small candles and chop along that Red Line.
3. A bullish consolidation that resembled a ‘running correction‘ as it rallied.
4. A pause and dip with a weekly reversal candle (Blue Arrow).
5. Next in 2020 it just ripped higher. The first candle out of that reversal is ‘similar’ to what we had last week. This may just run away.
.
This is the same chart, but I wanted to show you 1 thing different now than with that 2020 run.
The first candle out of that blue reversal candle is ‘similar’ to what we had last week, but the lower indicators started to look tired in 2020-2021 and it started to drop at the blue arrow, right? Currently, with the extended sideways chop, that indicator is starting to turn back up. That is why I think this may run, and not be a 1 week pop followed by consolidation. It has already done a multiweek consolidation.
.
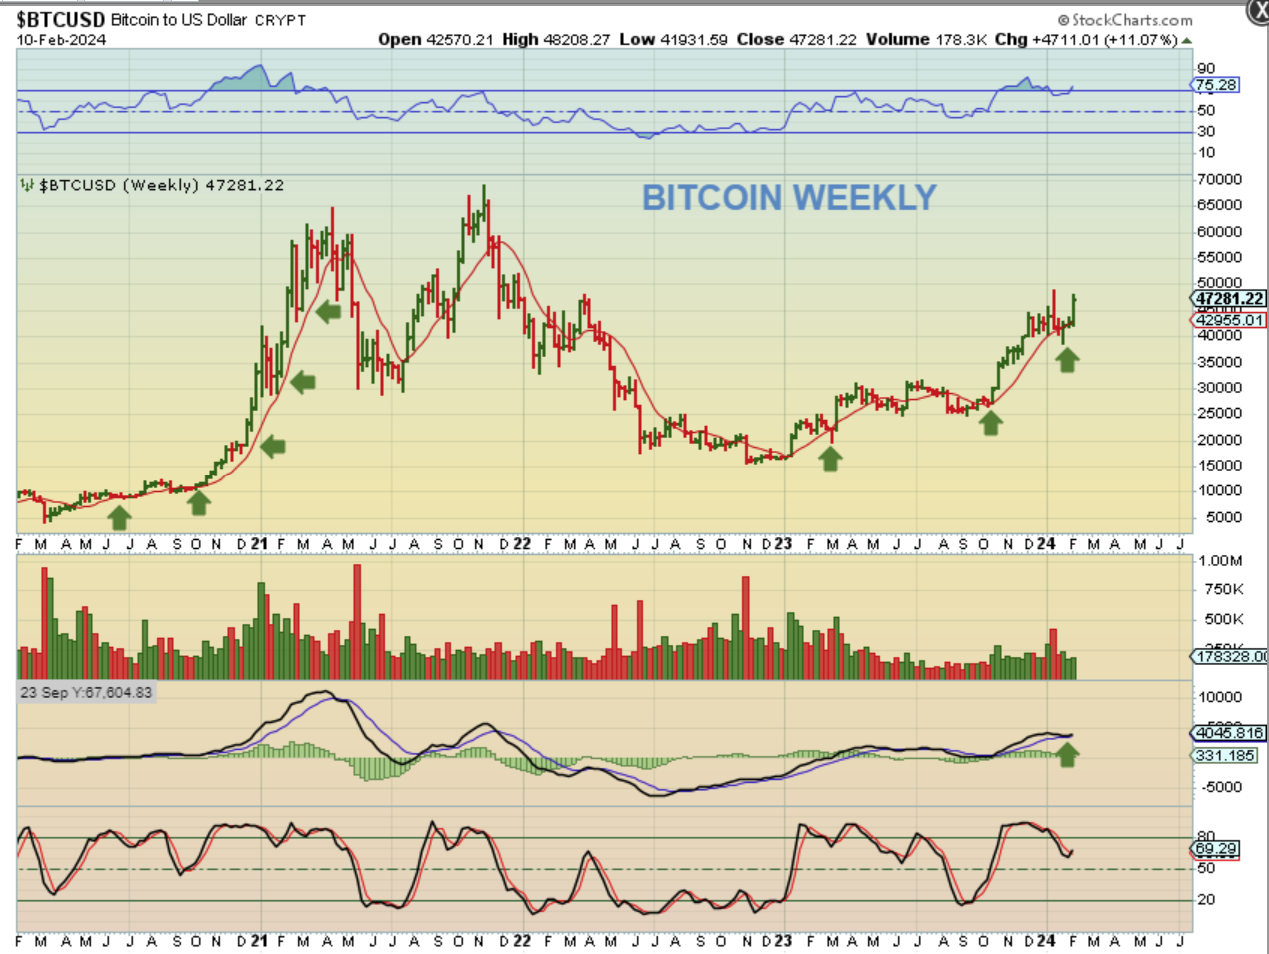
Now for a simple WEEKLY BITCOIN CHART:
1. The red line held price rather nicely on the 2020 run higher.
2. Last week Bitcoin broke through and then recovered, sitting on that line last week. The weekly MACD can be seen doing a ‘kiss’ and not a cross under. This chart looks very bullish after last week.
.
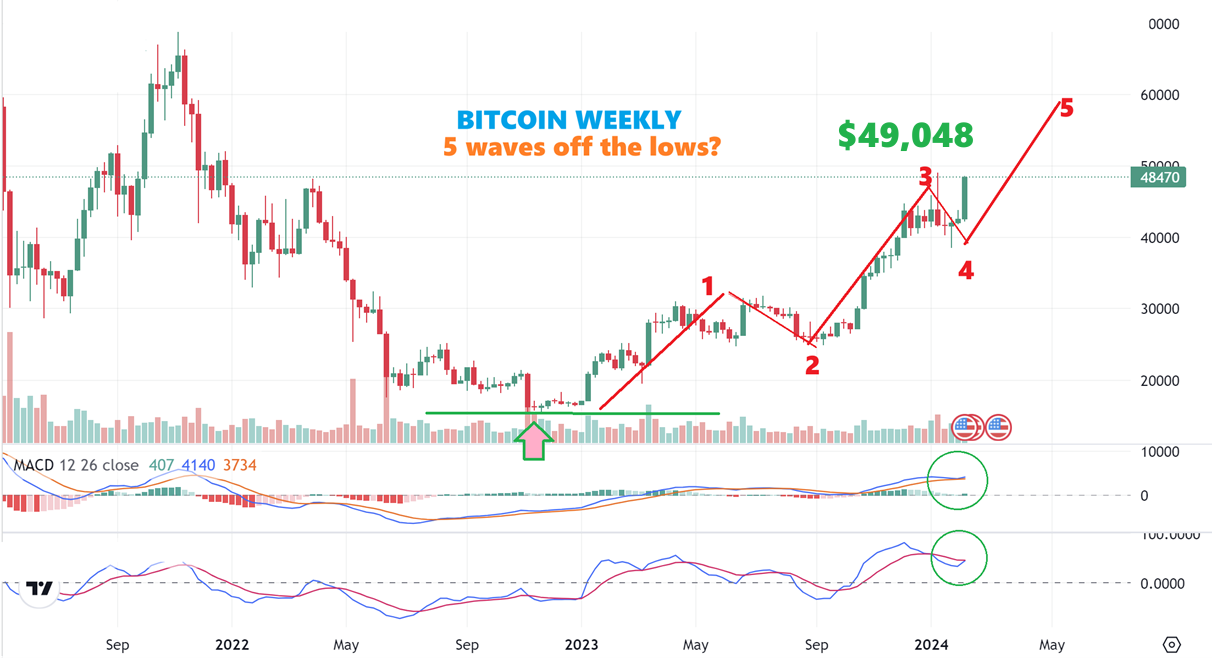
BITCOIN WEEKLY– Finally, The above charts were as of Saturday. Now this is Bitcoin as of Sunday morning Eastern Time.
The prior high with that ETF approval (that I labelled as wave 3) was $49,048. If we just saw a dcl drop with that 3-4 wave, and then we break above those wave 3 prior highs of $49,048, then this would look like another run to the 2021 highs has started as wave 5 and yes, that was above $60,000.
.
As a cautionary note: I still cannot rule out that we get one of those POPS that is followed by Chop, since we have seen that in the past as seen on this chart.
That said, if this is just going to just run like the chart ABOVE?? If we break above those $49,049 highs? I want to own some crypto stocks. I traded a few last week and they make 1 day gains of 15-25%, and that added up to 30% gains for the week. You will see that below, please continue…
CRYPTO MINERS
.

Next I want to show you something beautiful about these crypto miners and crypto related stocks. They are up quite a bit, but actually still near the lows. Let’s discuss this sector…
.
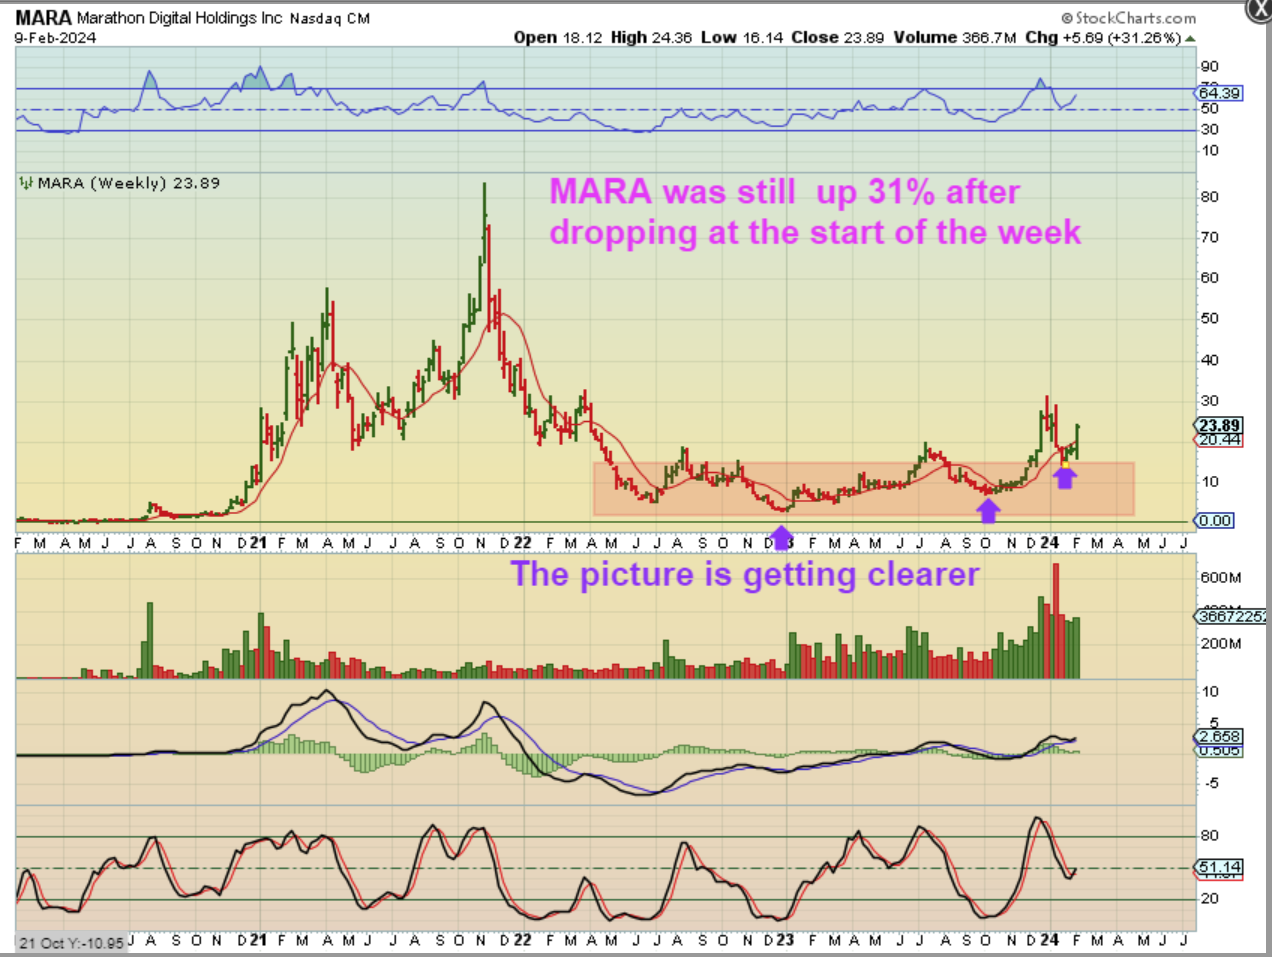
MARA WEEKLY– Take a look at that base on MARA!
MARA was actually down on Monday, but by the end of the week, it had surged 31%. I have often mentioned that ‘MARA and RIOT traded near $80 in 2021’. If Bitcoin is going to run like I think it is in 2024, these stocks run quickly too. Note: Yes, they can drop 10% in a day, these can become and have been choppy during the Bitcoin sideways move, but when they start running 30% in a week, it may be time to take notice.
.
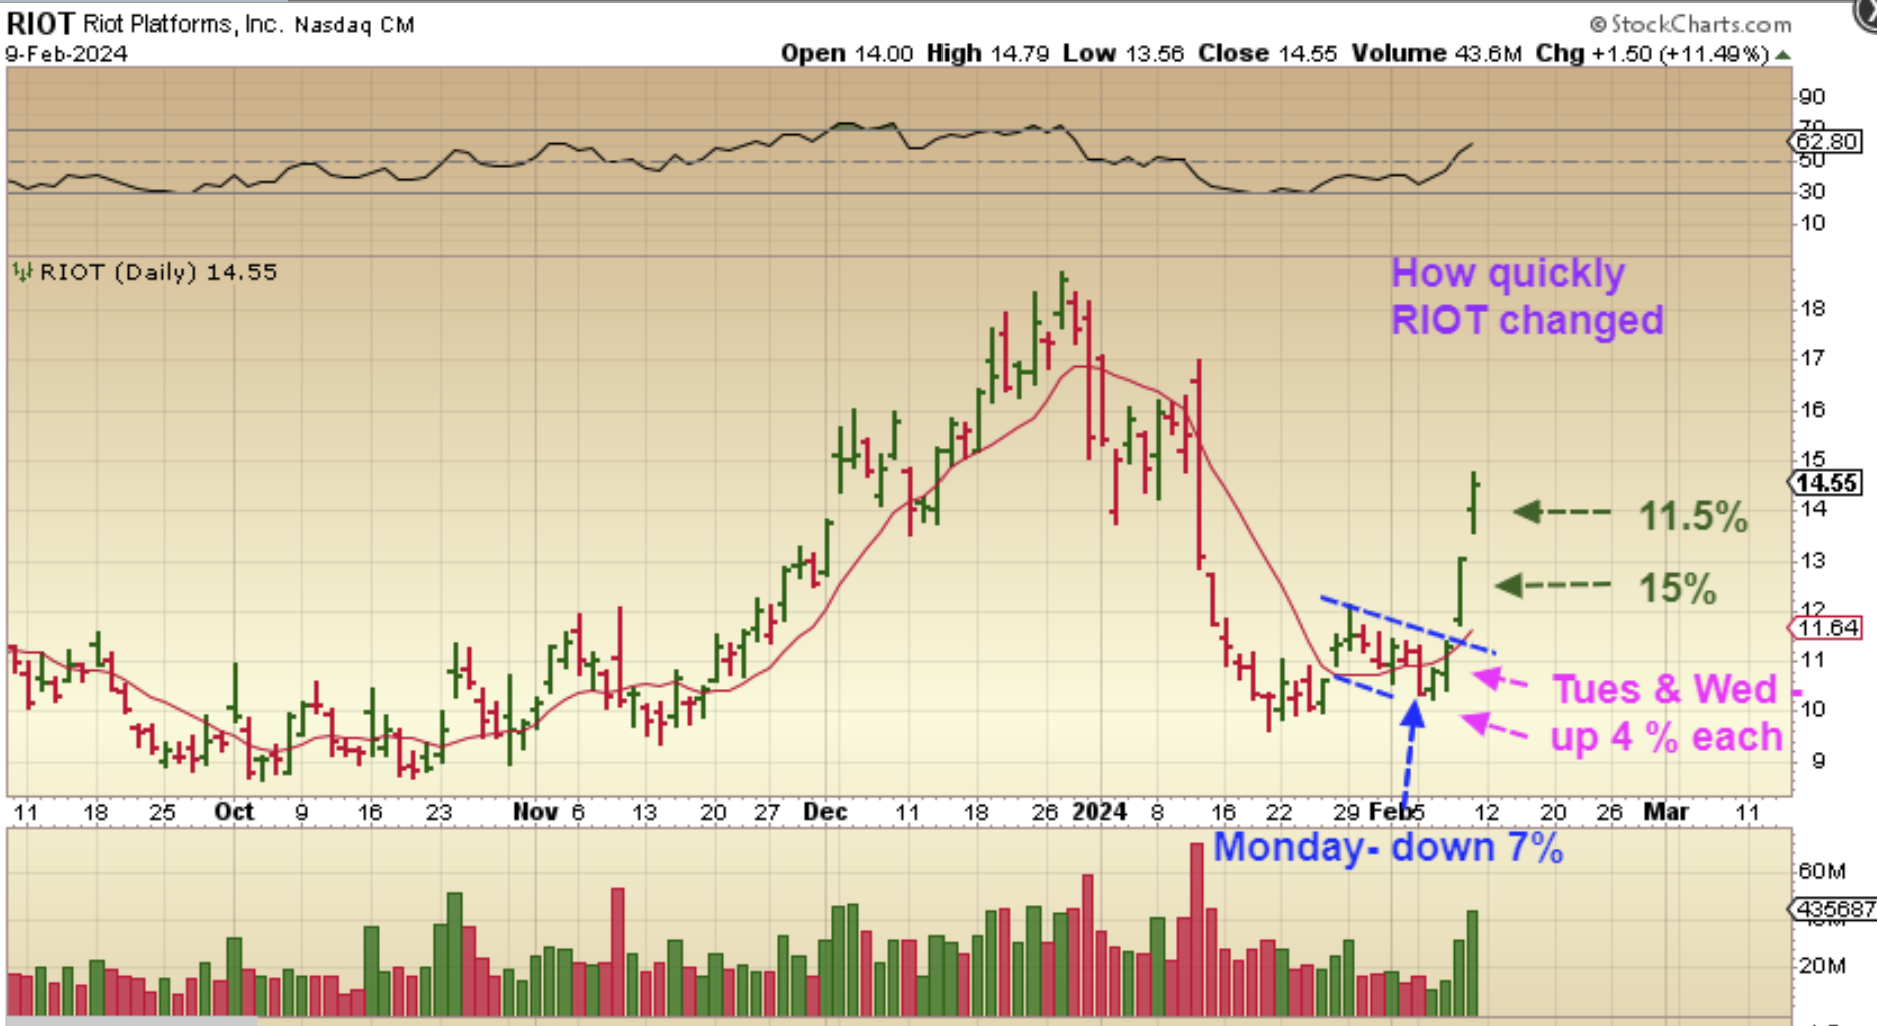
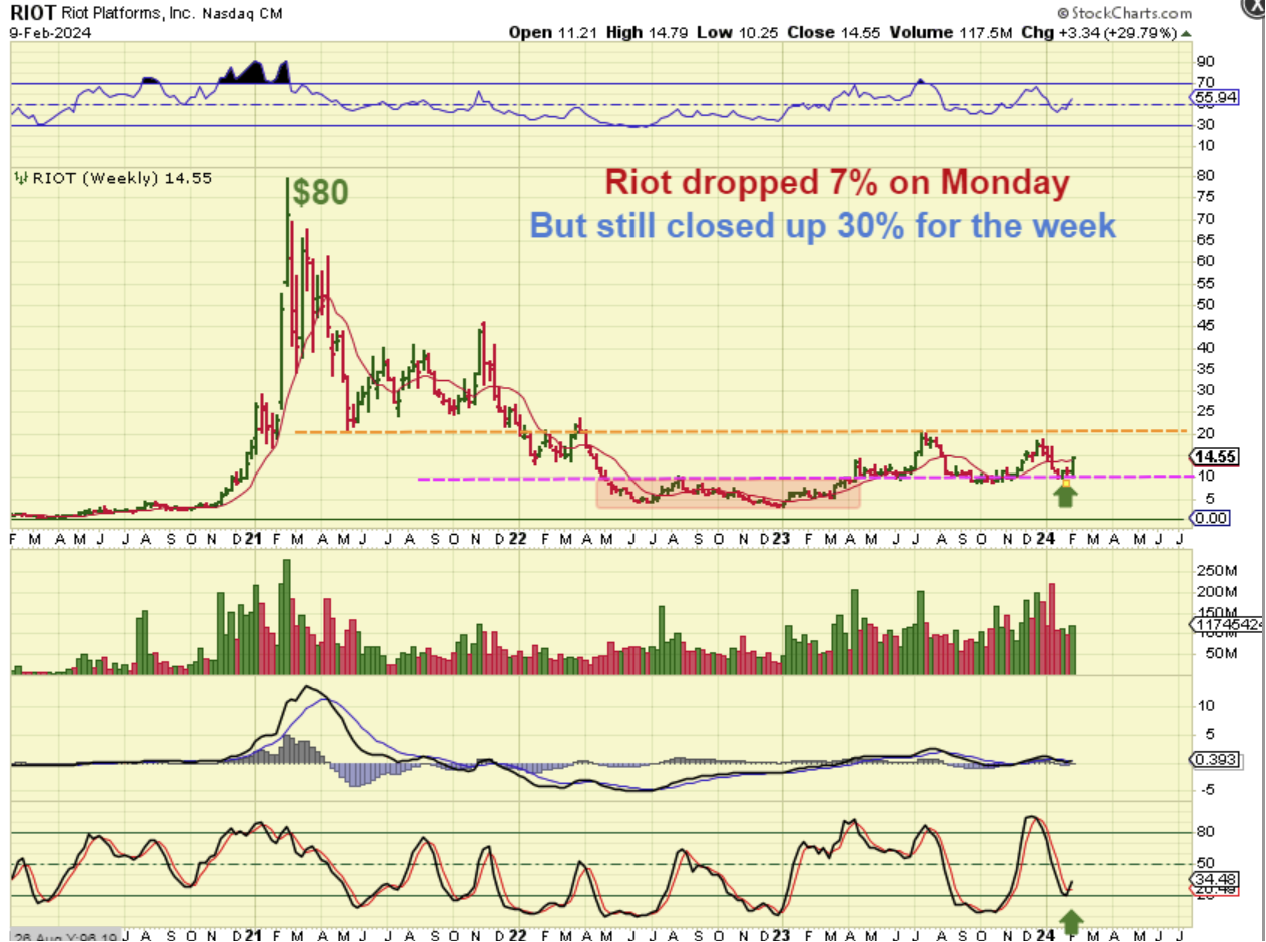
I want to show you how quickly this sector changed using RIOT:
Riot actually dropped 7% on Monday, it gained 4% on Tuesday and 4% on Wednesday (so that was really just a tad more than break even for the week by Wednesdays close), but Thursday and Friday it added over 26%+ . That was only on the last 2 days of last week alone. So…
.
RIOT WEEKLY– So RIOT gained almost 30% on the week, even after a 7% drop on Monday. These may be very hard to buy & hold for that reason, but when they are in a bullish run, they make up the gains very quickly. RIOT fell to $10, but it is back to $14.55 and look at the upside potential in 2024. It would have been extremely hard to hold this last drop of almost $19 to $9.50, but it is recovering quickly.
.
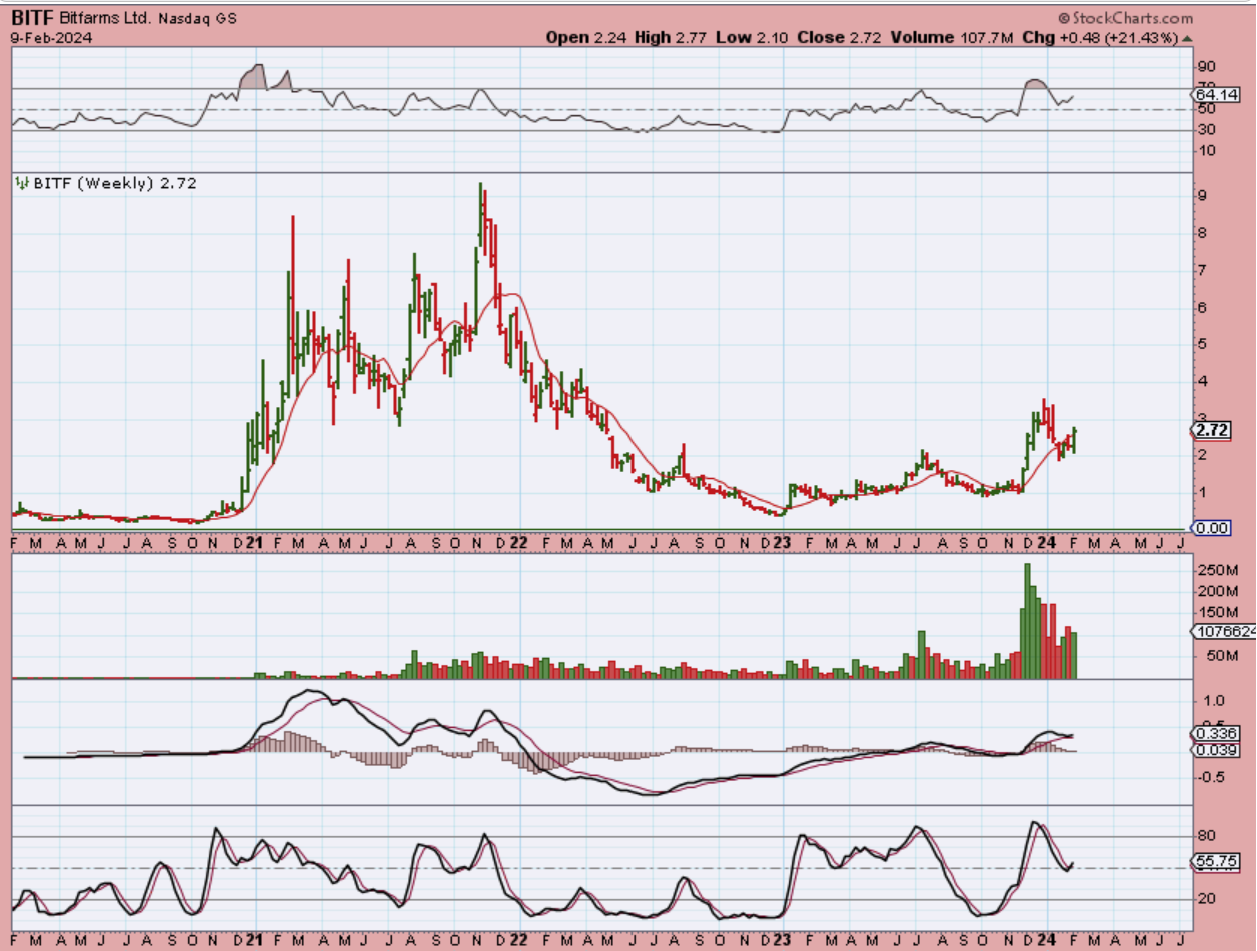
BITF WEEKLY– BITF had a very strong 200% plus run in December. It gave 1/2 of that back in the recent drop from $3.50 to $1.88, but just last week it was up 21.43%, and we are back to $2.72! So again, when these run, the gains add up quickly despite some big dips and even big down days.
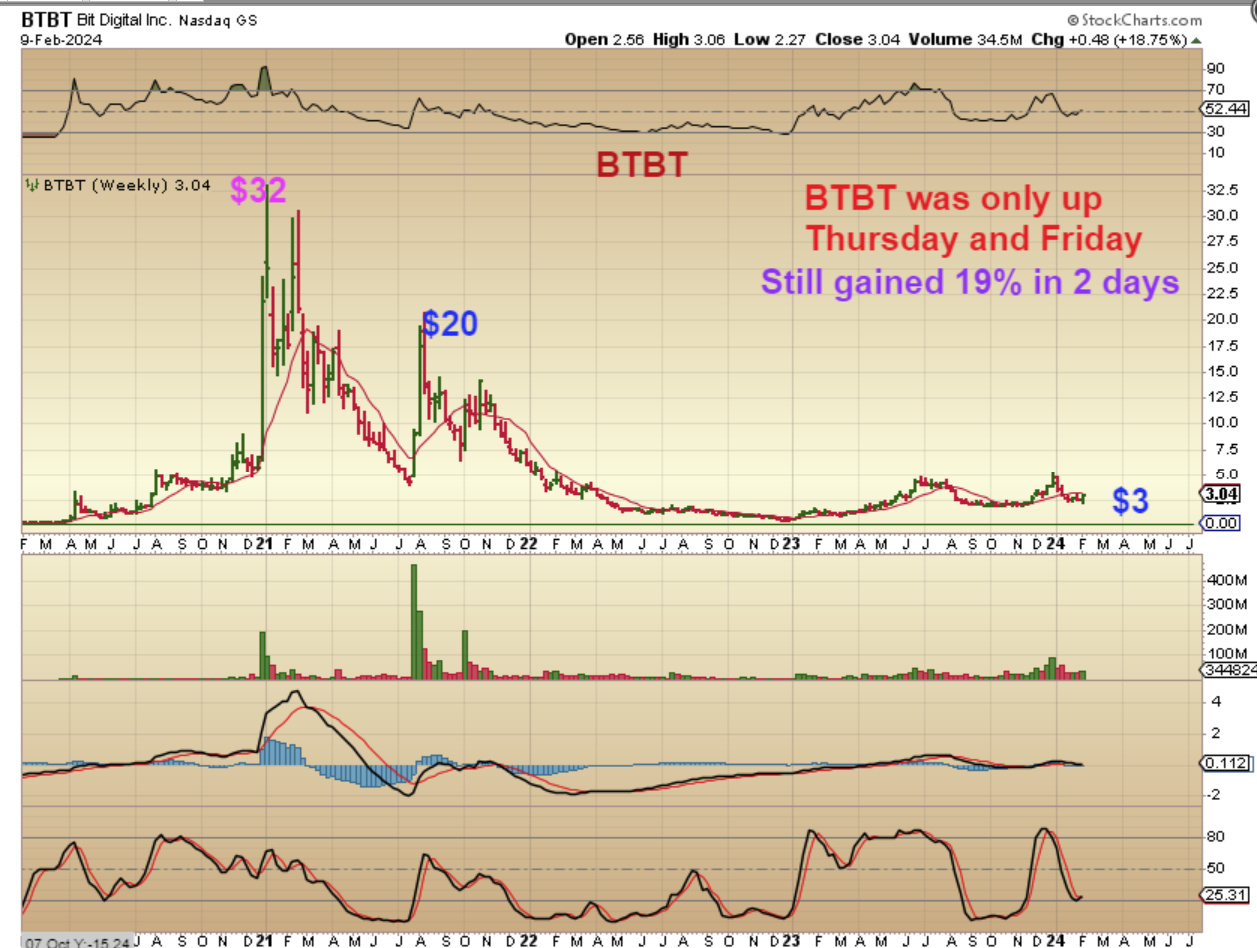
BTBT was a lagger, because it was only up Thursday and Friday, but in those 2 days it added 19% gains. When I look at this weekly chart, it looks like I am looking at a big lagger, since it is still in the lows of the 2nd stage base. Upside potential for 2024 is big if it can start & steadily run higher.
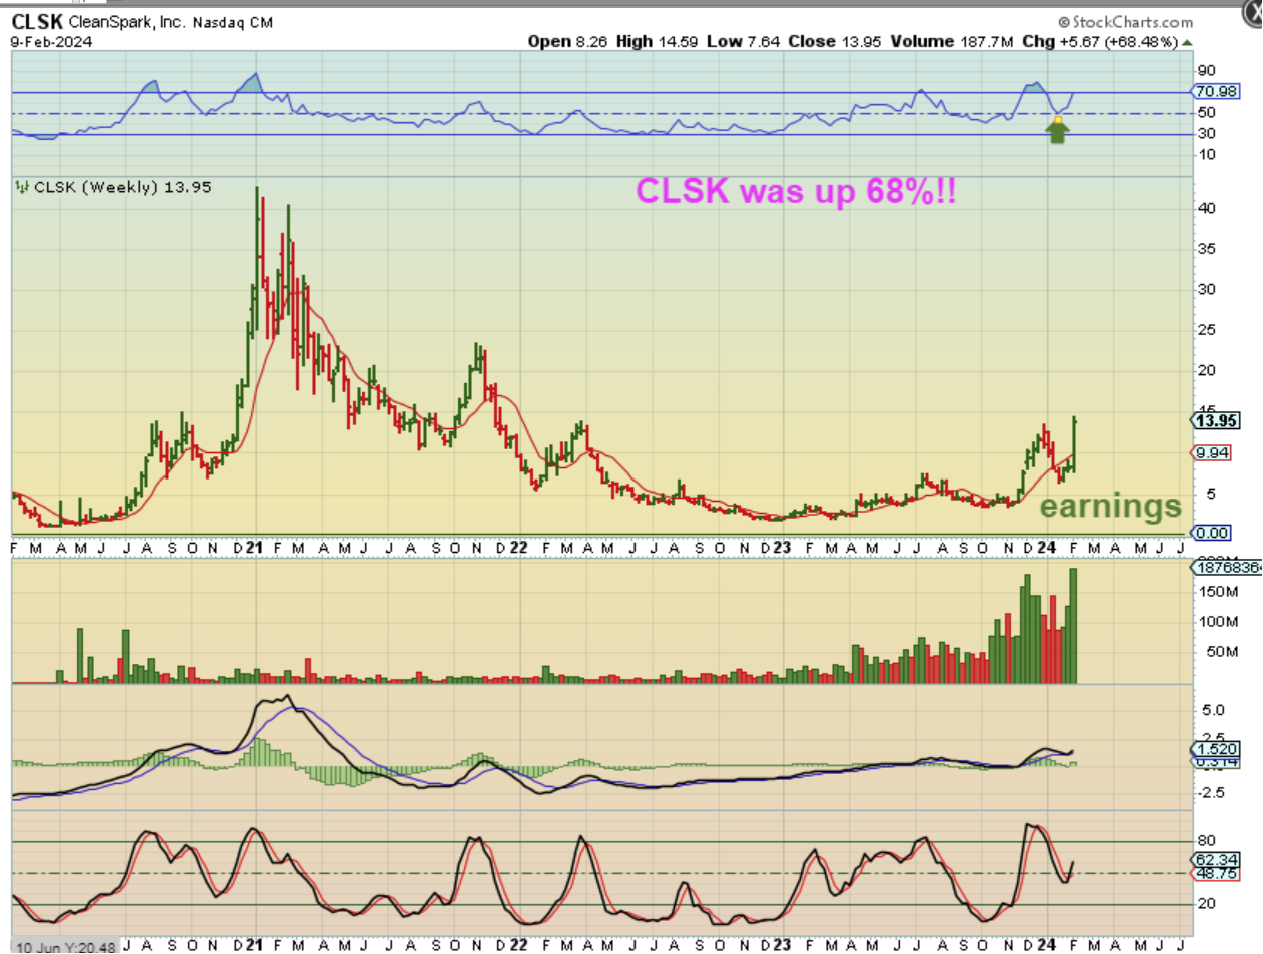
CLSK WEEKLY – CLSK released earnings and had a BIG week. That was up 68%, but 33% of that was Friday alone, after that earnings release. NOTE: BKKT released bad news and dropped to new lows last week. It fell 40% Thursday and gained 22% Friday, so on the last run I warned that a ‘basket ‘ of these may be the best way to ride them, or grab one of the new ETFS.