Tuesday Jan 23rd
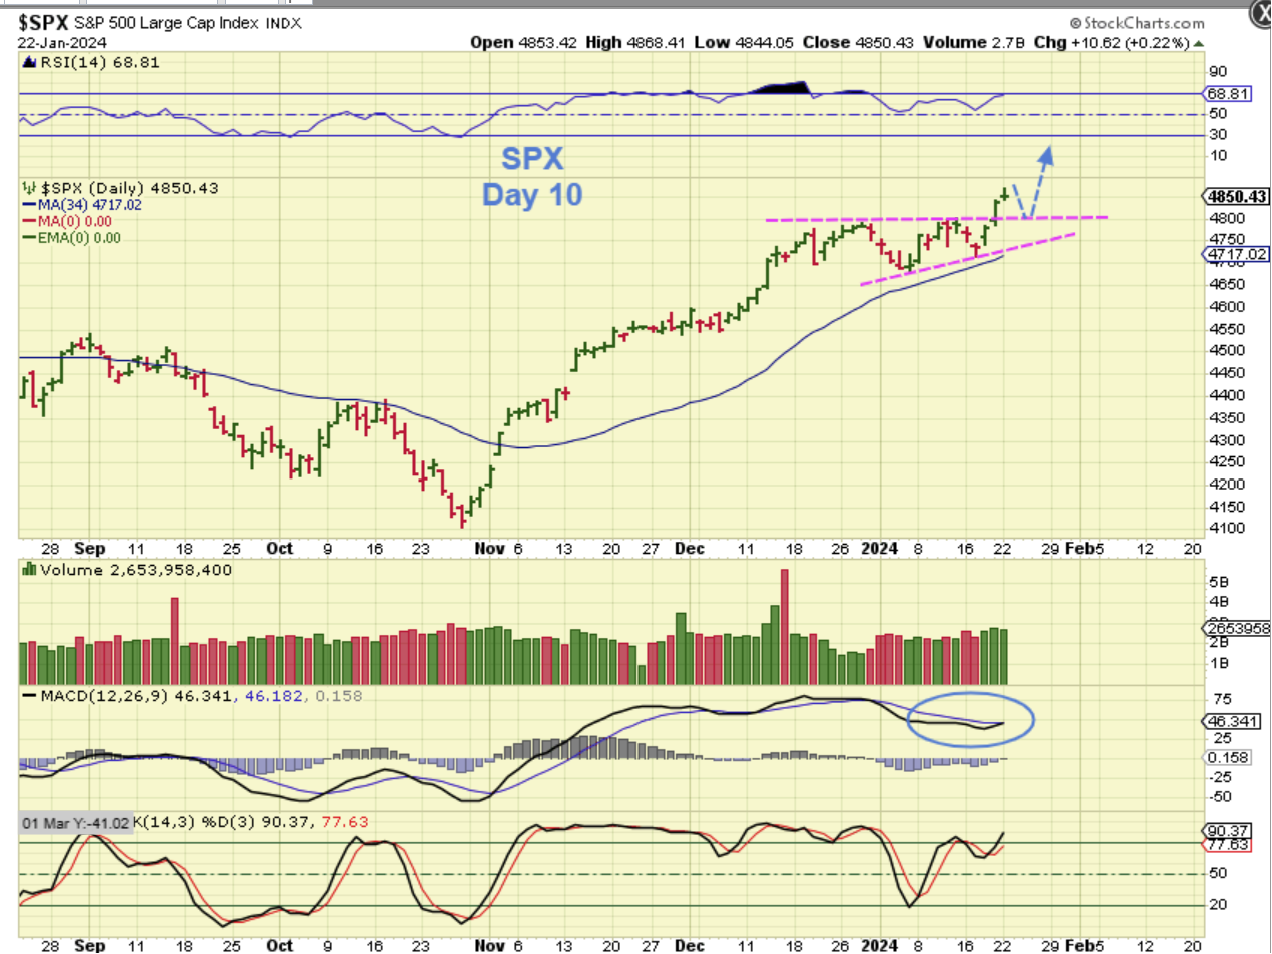
THE SPX is on day 10 after putting in a mild dip into a dcl. It broke out on Friday, did a small pop and drop on Monday, and my guess would be that it may back test the breakout and then rally on data Thursday & Friday. The MACD is trying to cross upward again.
.
I HAD THIS BIG PICTURE CHART IN THE WEKEND REPORT TO SHOW TECH AS BULLISH:
.
NASDAQ WEEKLY – The NASDAQ did NOT break out to new all-time highs yet, but This set up is bullish and it should break the highs soon enough. So…

.
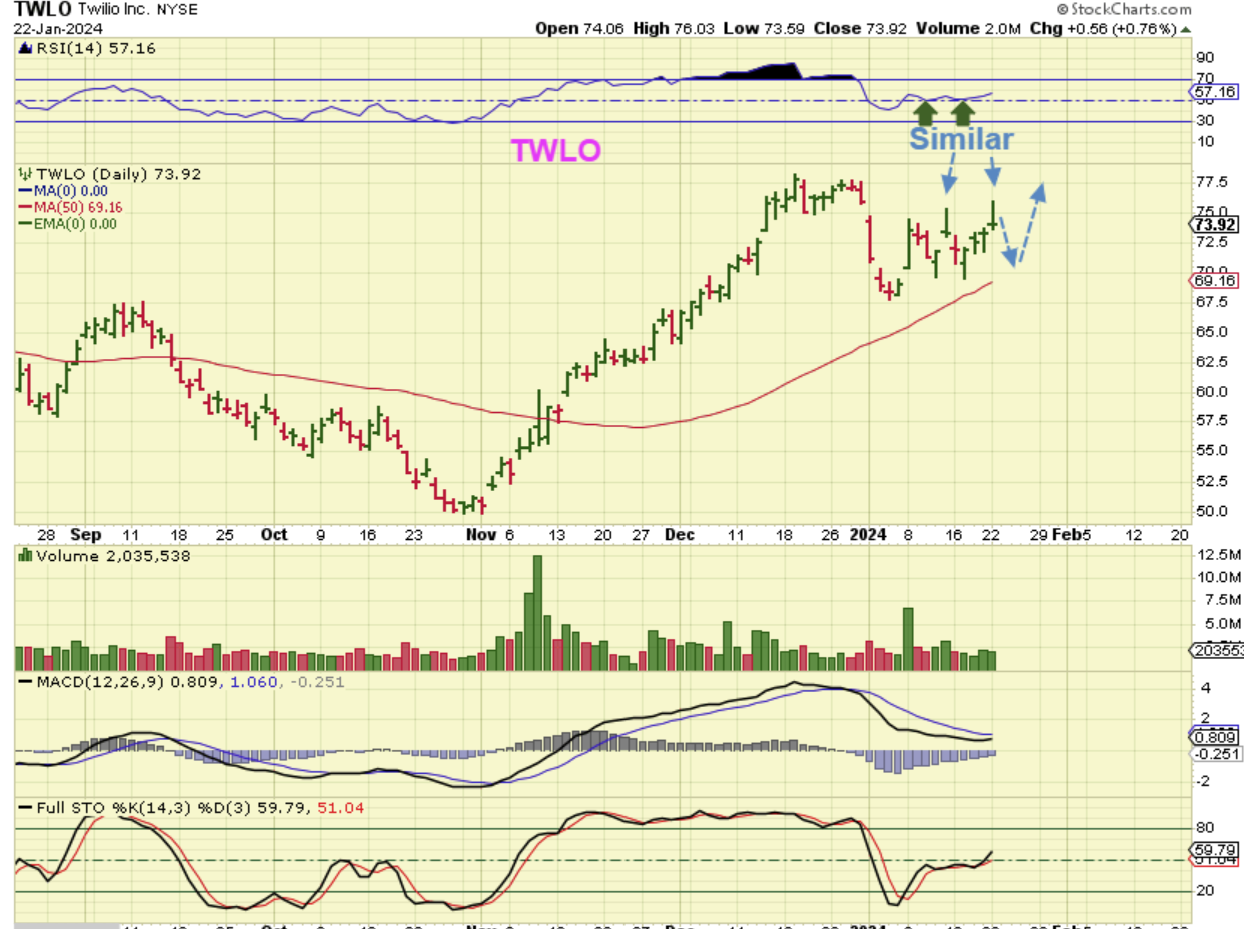
So I have had MU, TSEM, AMD, AMZN, NVDA, GOOG, MSFT and other tech stocks in my reports, but I also have a list of other tech stocks that I used to trade that are starting to perk up too. My list has PAGS, CRWD, SQ, TWLO, CVNA, and more. Let’s take a look at a couple of those…
.
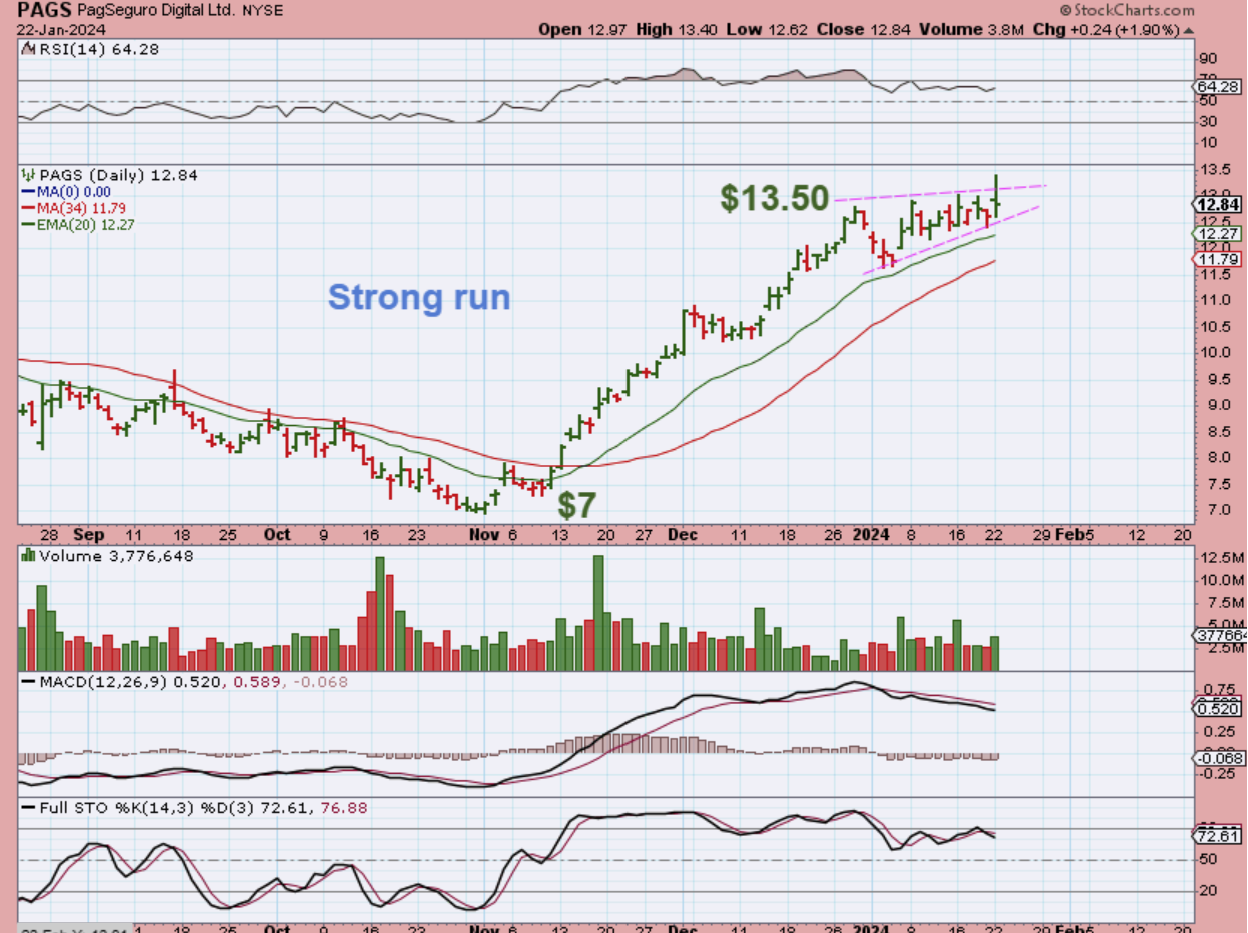
PAGS broke out and sold off, but this is a bullish consolidation. I used the 50sma when I captured this, but if I use the 34 sma & 20ema, it may give me an idea of where this would become a buy…
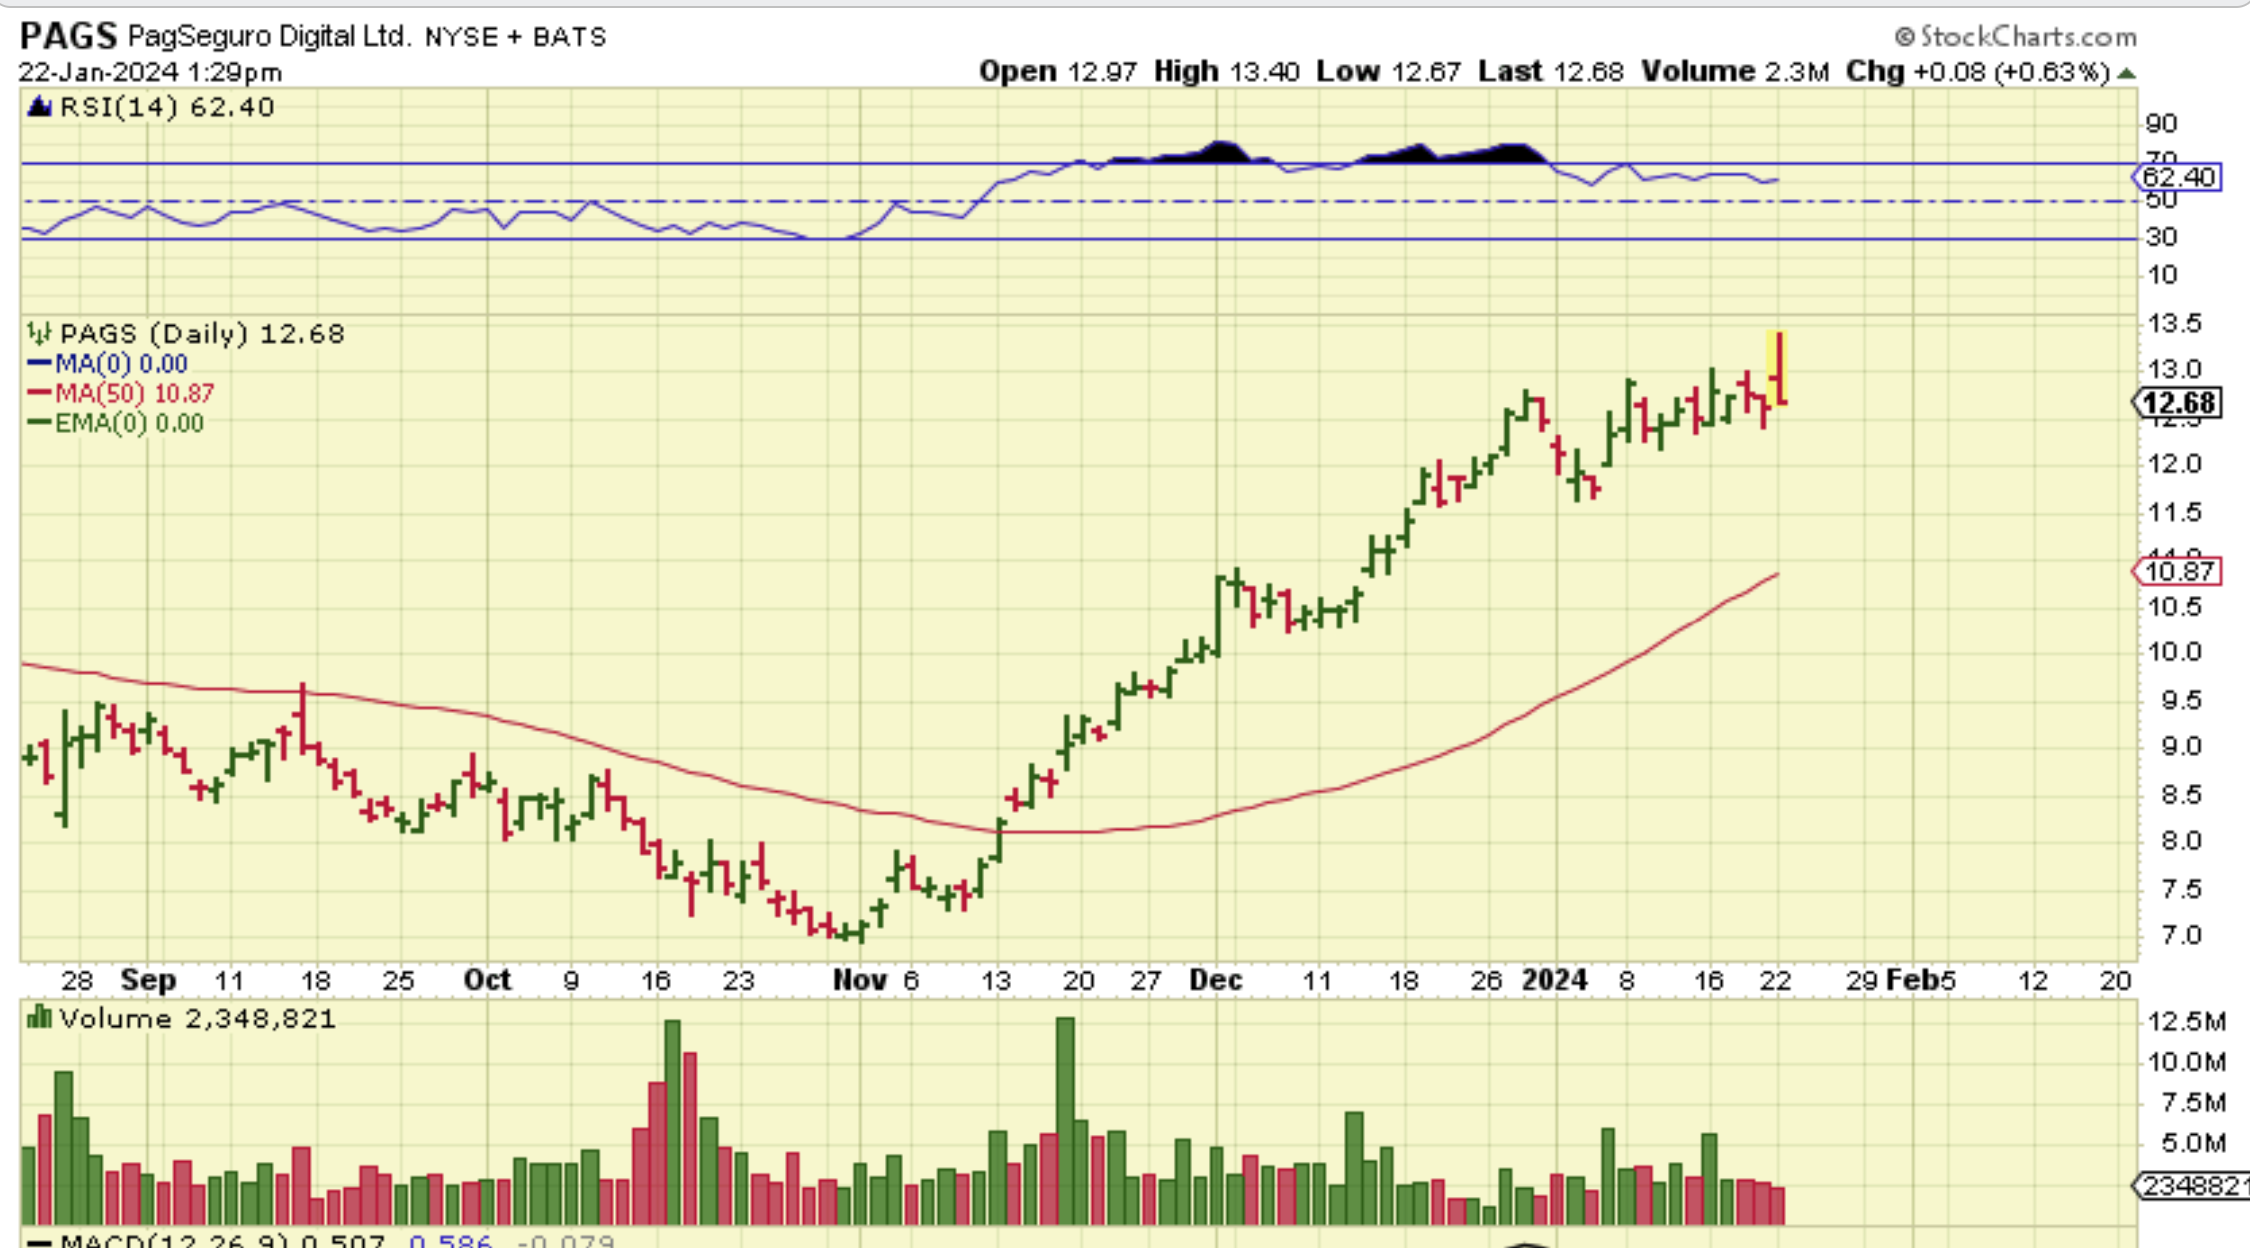
PAGS actually may not drop a lot from here. That was a very strong run out of the ICL ( $7 to $13.50). This consolidation should be preparing it to run again.
TWLO has spiked and dropped a couple of times as part of its’ journey higher or consolidation. You could buy the dip if it drops further to maybe the $70 area.
.
Oil started to break through the 50sma, so I posted this in the commenting area midday. XOP may follow and that would be the UCO, USO trade for Oil and XOP or GUSH trade for Oil company stocks.
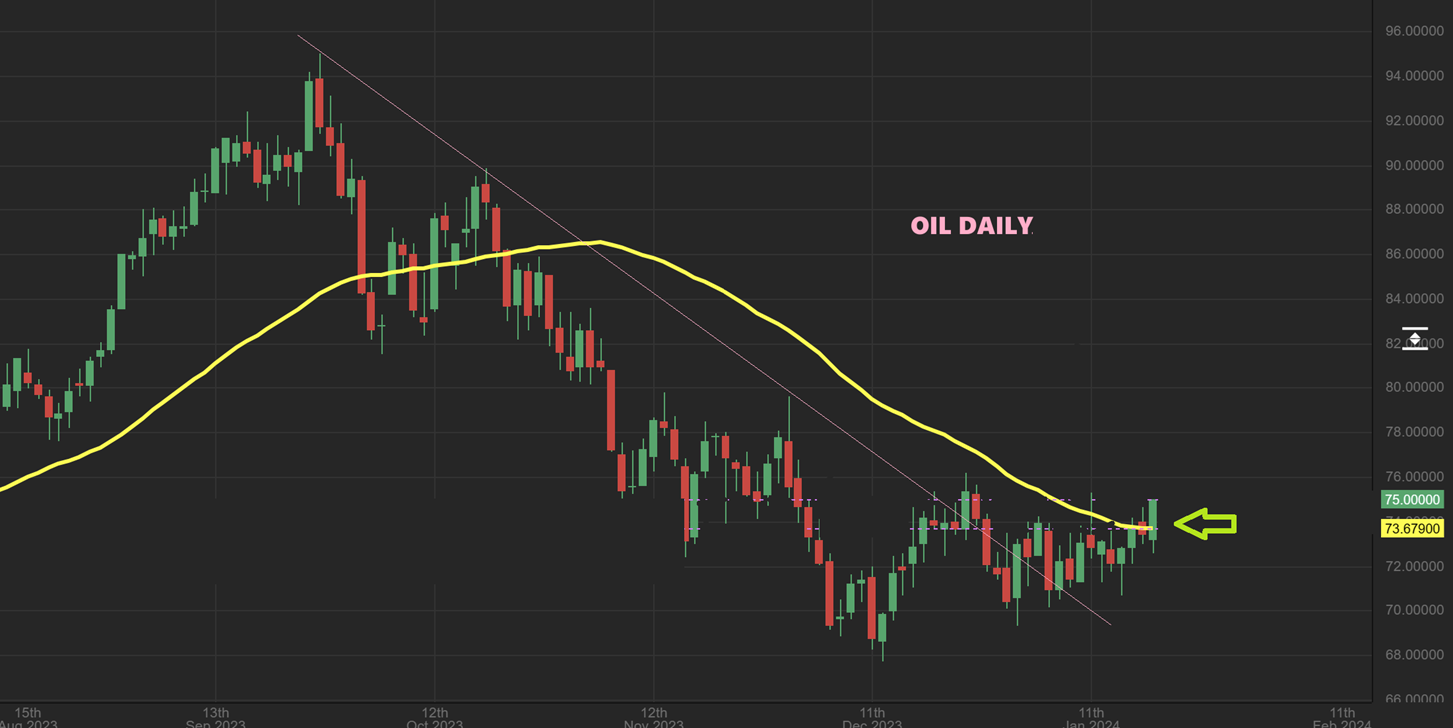
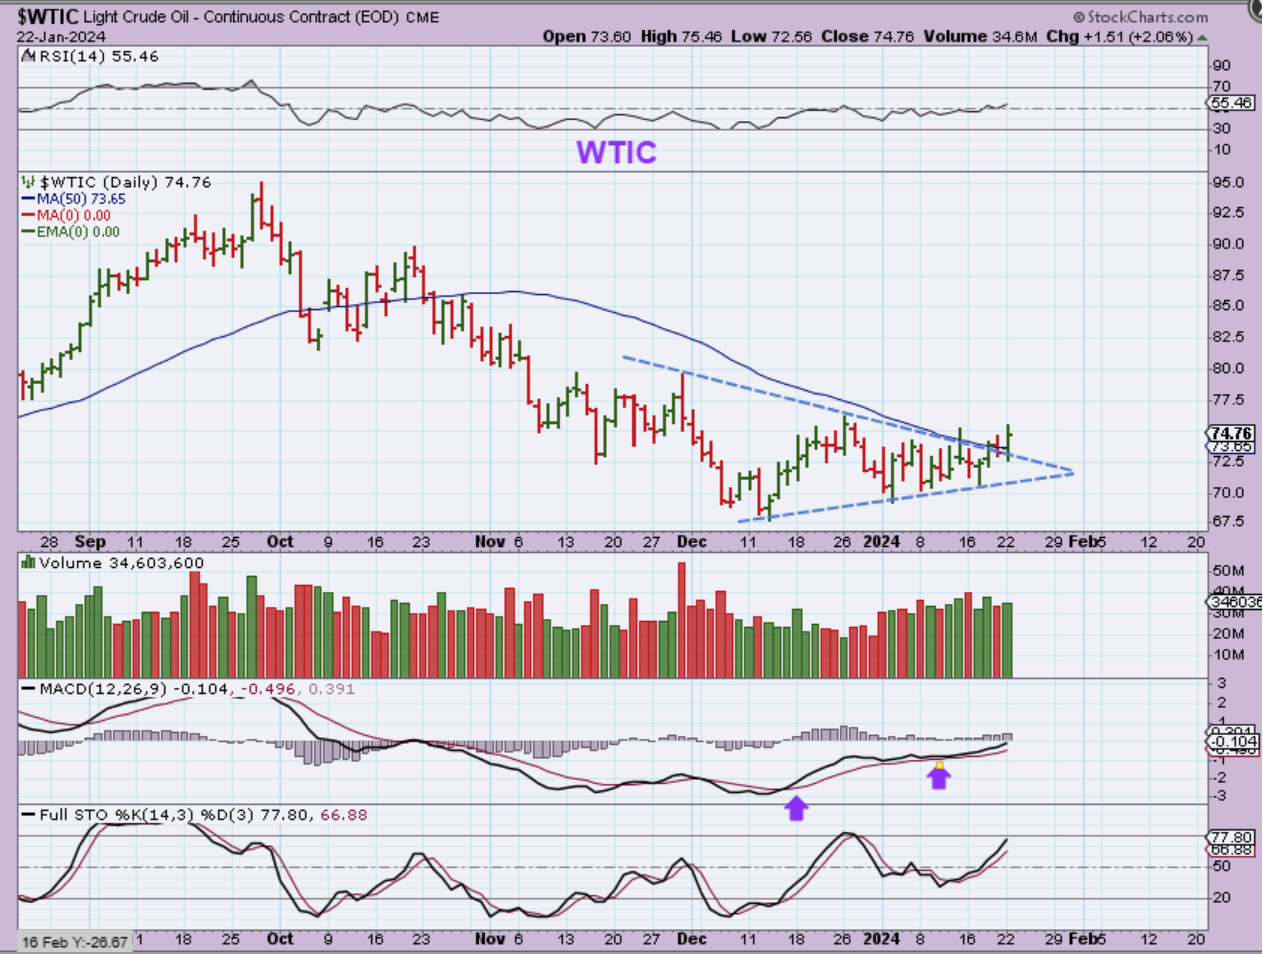
WTIC – So this was Oil at the end of the day and it did hold the breakout.
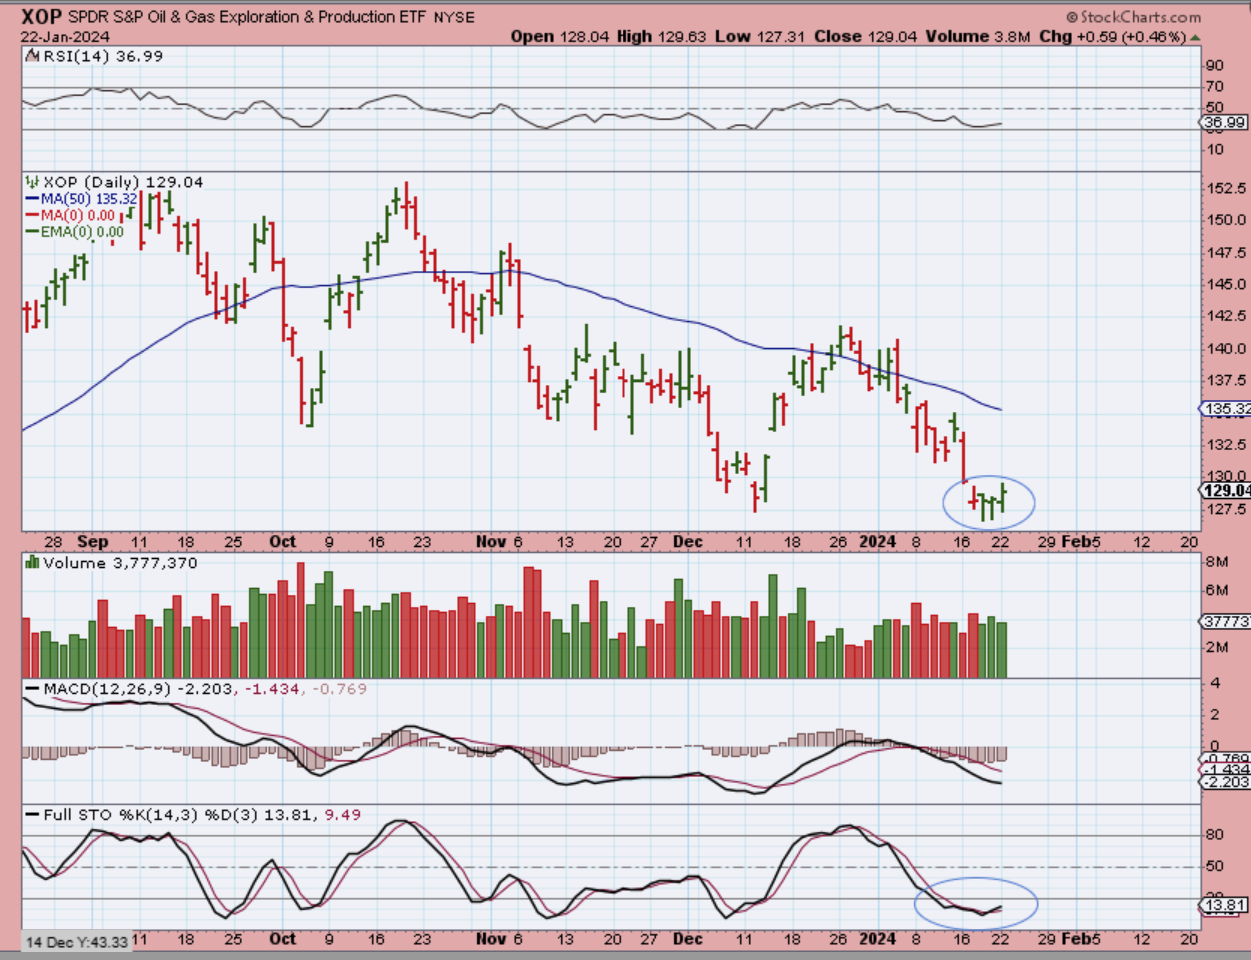
XOP – moved slightly higher, so now we’ll see if it can gain some traction and make some real gains. It is a low risk buy, since it is right at the lows and the wicks show buyers stepping in each time it dropped over the past 3 days.
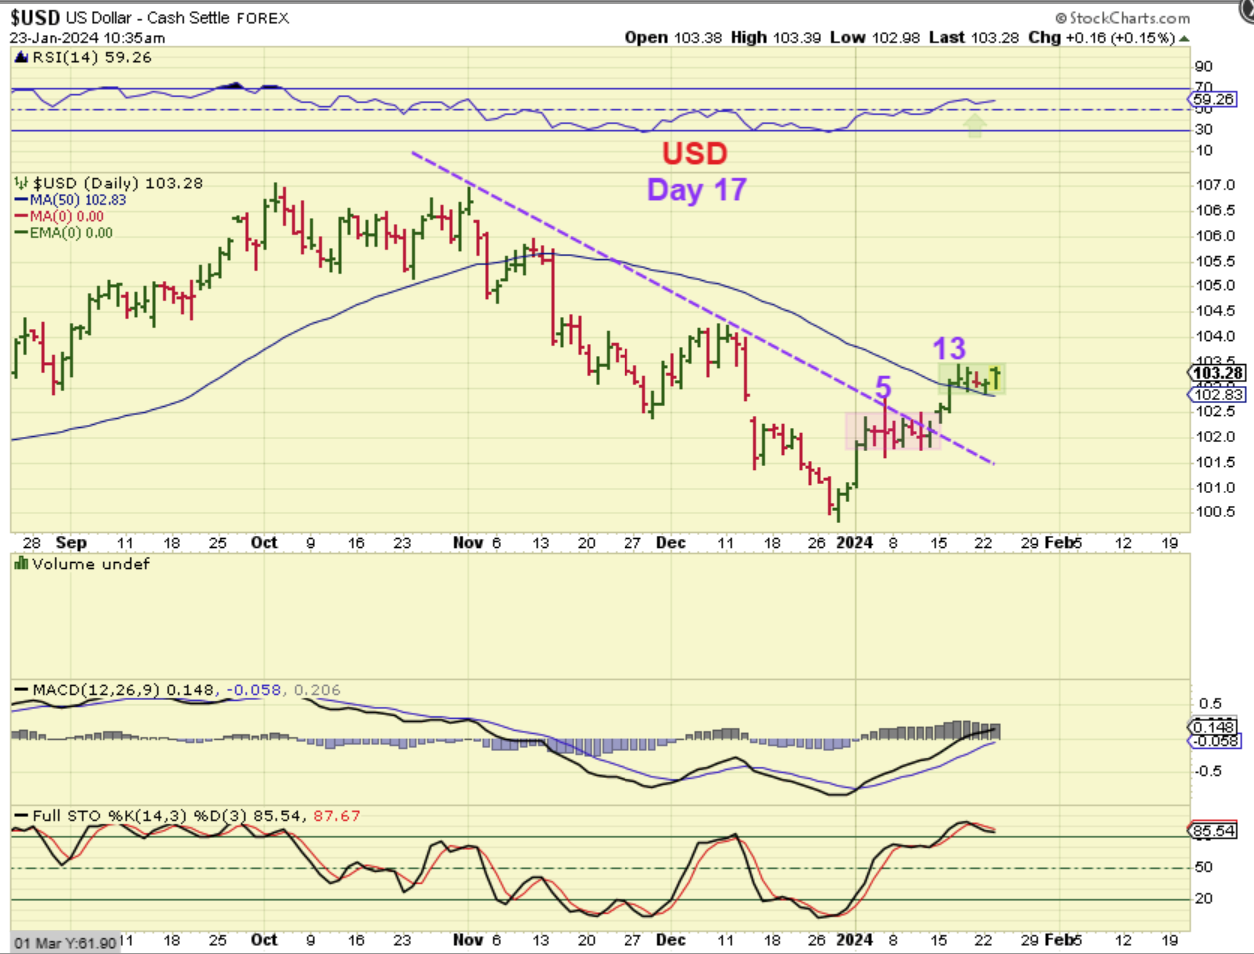
The USD is strong and I have mentioned that this looks like an ICL. This will cause Gold to dip down into its ICL.
.
THIS WAS MY BIG PICTURE VIEW OF A USD ICL THAT STILL ROLLS OVER: We still need to expect Gold to drop into an ICL, so I do not own anything precious metals.
.
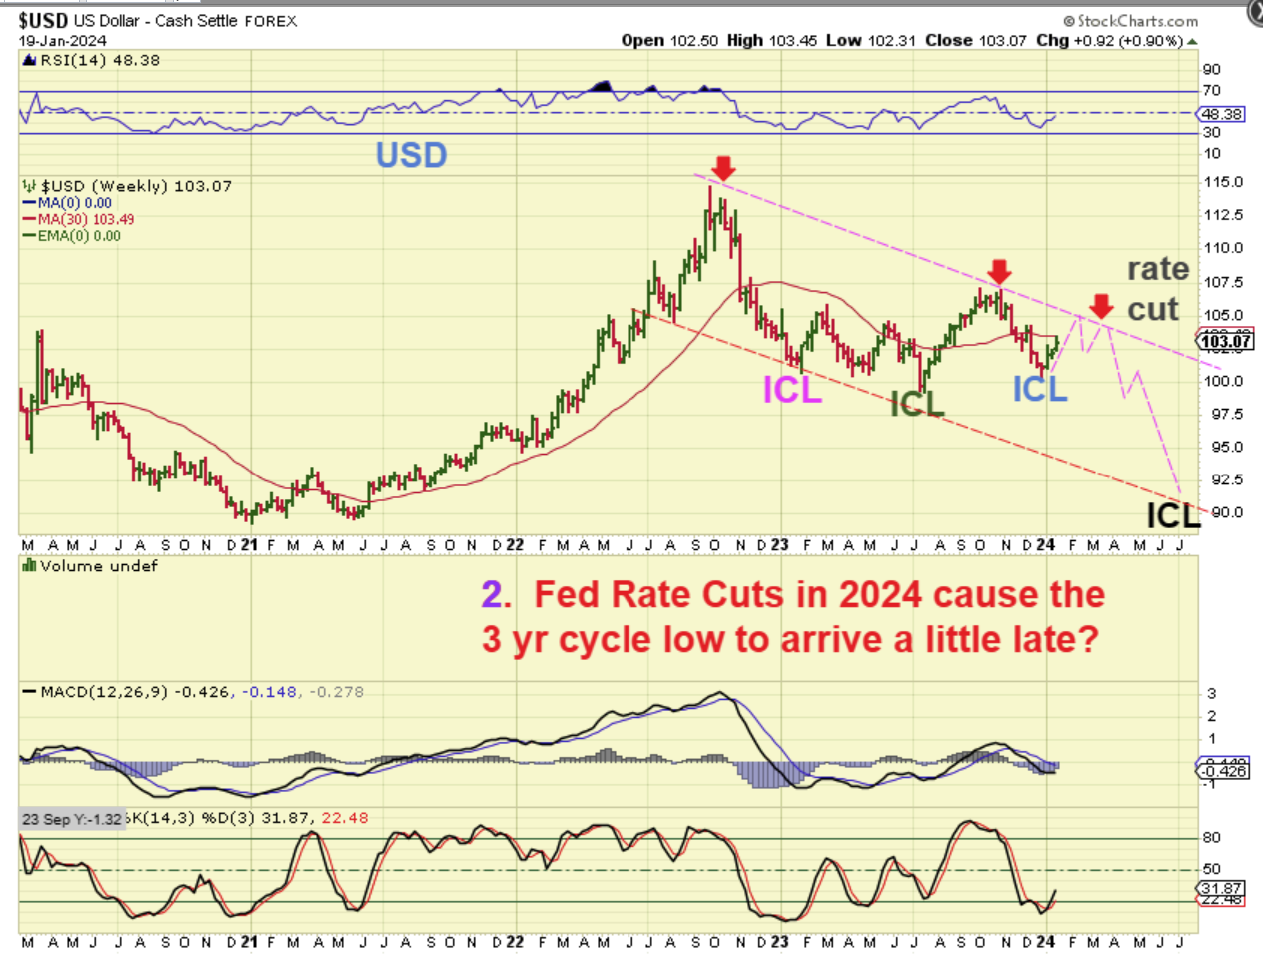
USD WEEKLY -The Fed Rate Hikes caused a ‘blip’ in the set up.
1. Notice the rally in July – November, and then a higher ICL. That could be due to rapid rate hikes.
2. I do know that there is a likelihood of rate cuts next year, and those rate cuts could cause the final leg down into that ‘3 yr cycle low’, now a little later than I expected. This is very possible and would cause Gold to breakout to new all-time highs. See the chart. I think that this is very possible with rate cuts coming.
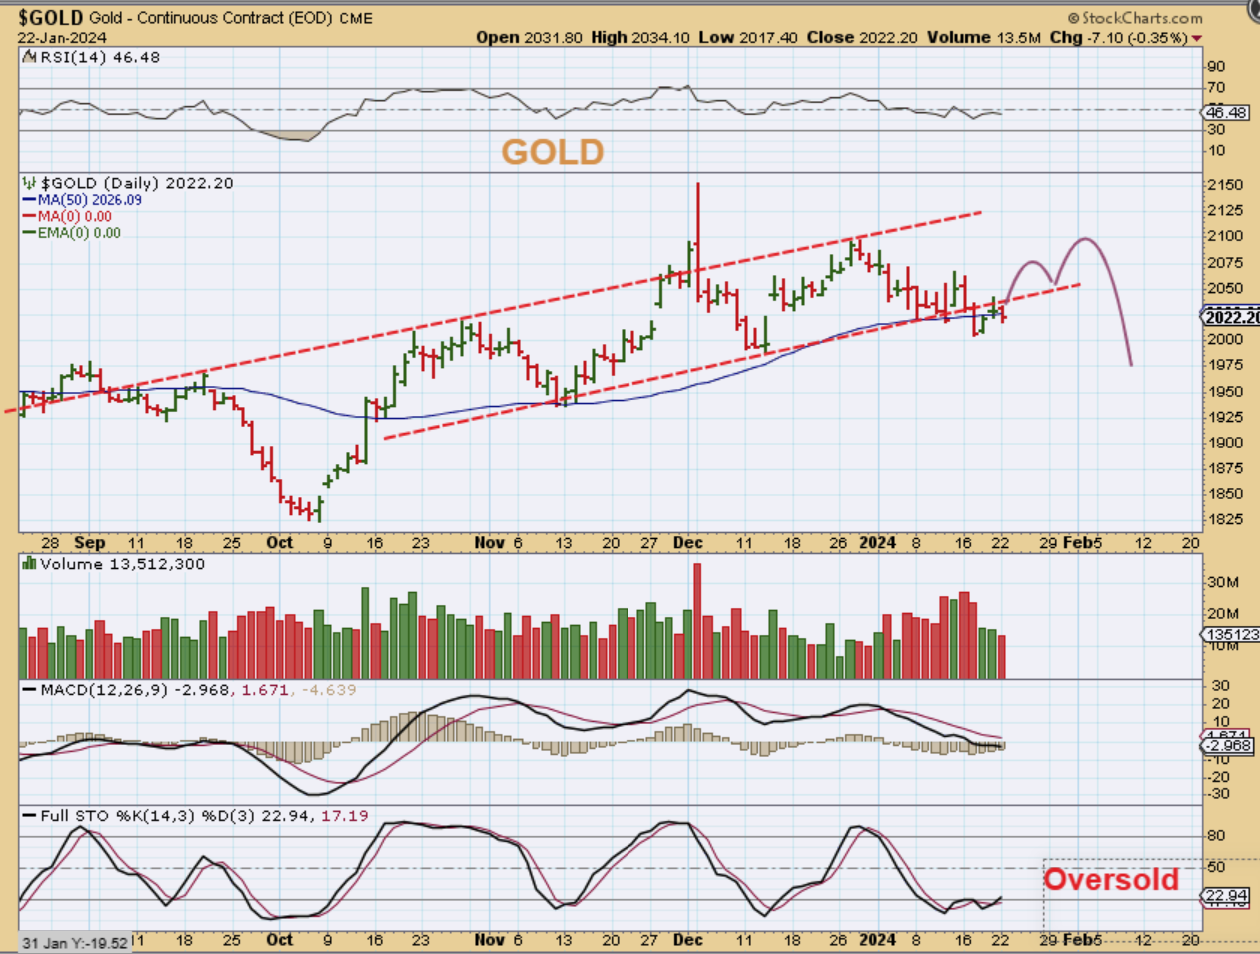
So GOLD is still trending higher with higher lows, but the peak is likely in place and we really all need to recognize that this will drop and Silver is leading the way. I have repeatedly said that Silver and Miners are weaker than Gold, but Gold will drop too.
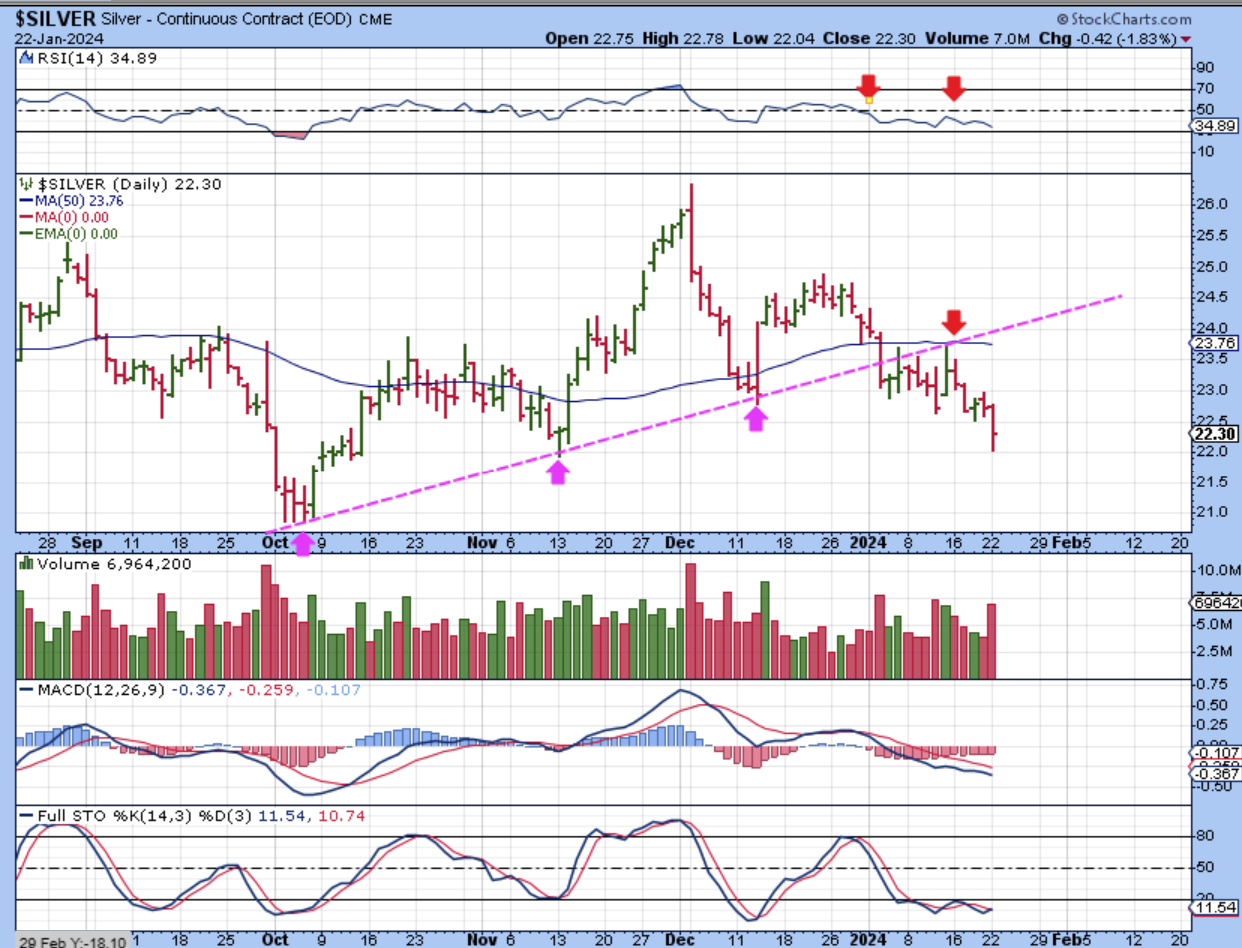
SILVER – I’ll say it again, Silver is weaker than Gold.
1. Notice that it lost the last low (Magenta arrow) over a week ago, so Silver failed already. It threatened to break the other low too.
2. Notice that it lost the uptrend line too.
3. It lost the 50sma and ran up and back tested it, but could not regain it. That is another sign of weakness.
4. Silver is now selling off quicker than Gold by putting in a lower low a week ago, and this is now a failed daily cycle.
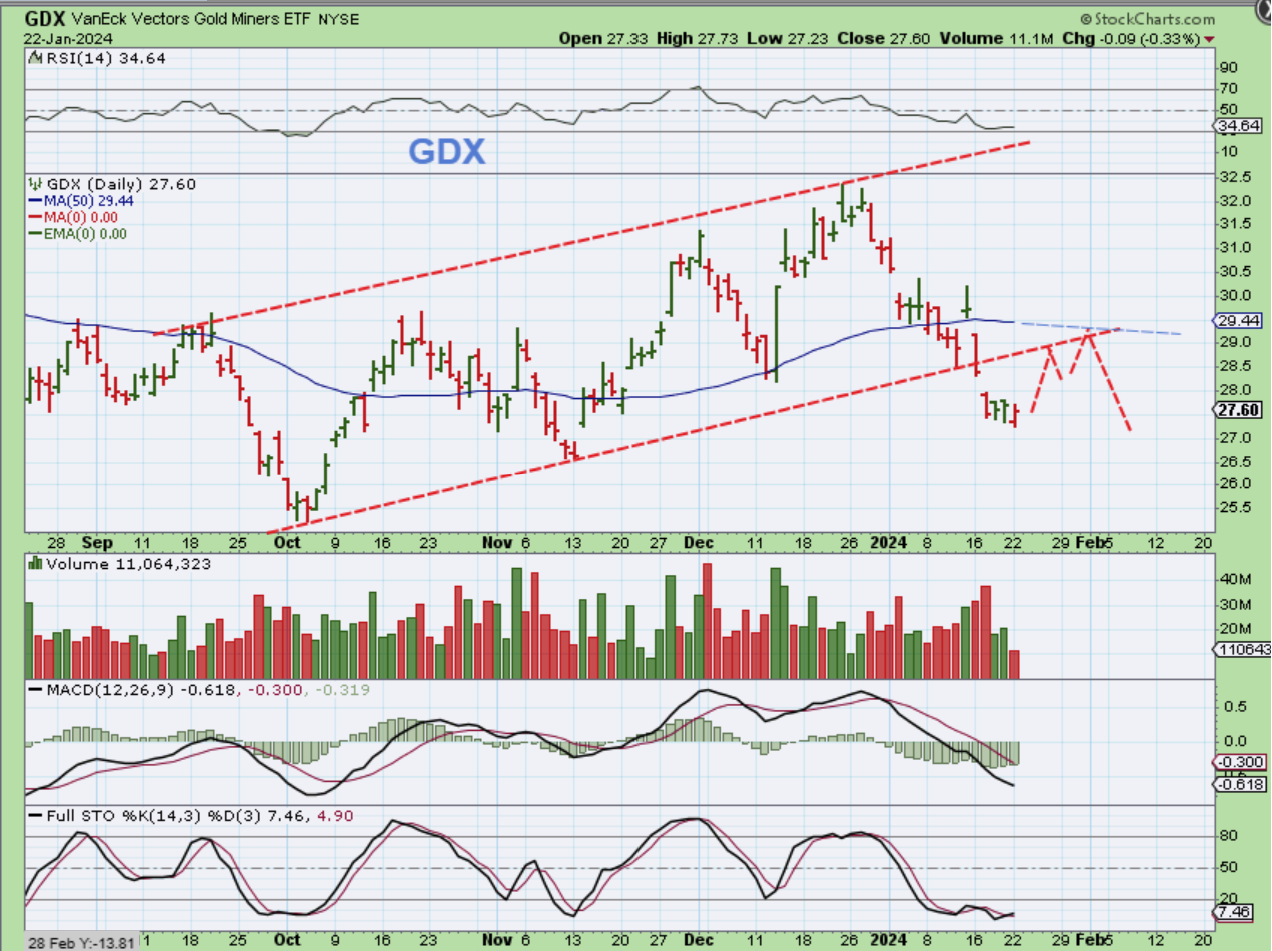
GDX also broke down to new lows by losing the Dec lows, so it is weak too. Even if it bounces with a dcl soon, it should then drop down to another deeper low, so that bounce could be an opportunity to buy JDST for the final drop.
.
I don’t see any good trades in the Precious Metals Sector (Long or short), but the General Markets remain bullish and Oil may finally be breaking up and out of that consolidation at the lows. That means that the General Markets stocks (Or TQQQ, SPXS, SOXL) as well as possibly Oil Stocks (or UCO, USO, & Gush) may make some good trades. If the General Markets do dip lower today, as I pointed out on this chart, it may be best to wait for that dip and reversal to buy.
.
I will cover Bitcoin below. Enjoy your Tuesday trading!
.
~ALEX
.
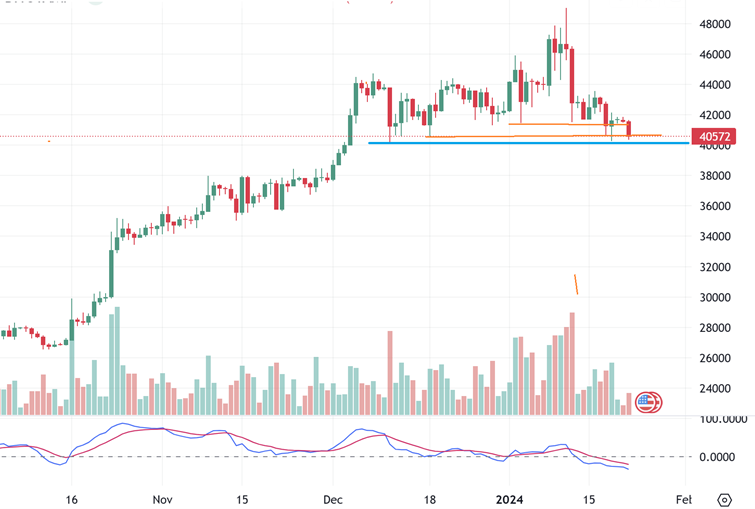
Bitcoin has slowly been taking out the prior series of lows (orange lines) and I have been watching for the day 27 low to be broken, because that would be the 1/2 cycle low. That would be the blue line, and I captured this chart midday and posted it in the comments…
.
That day 27 low was taken out overnight.
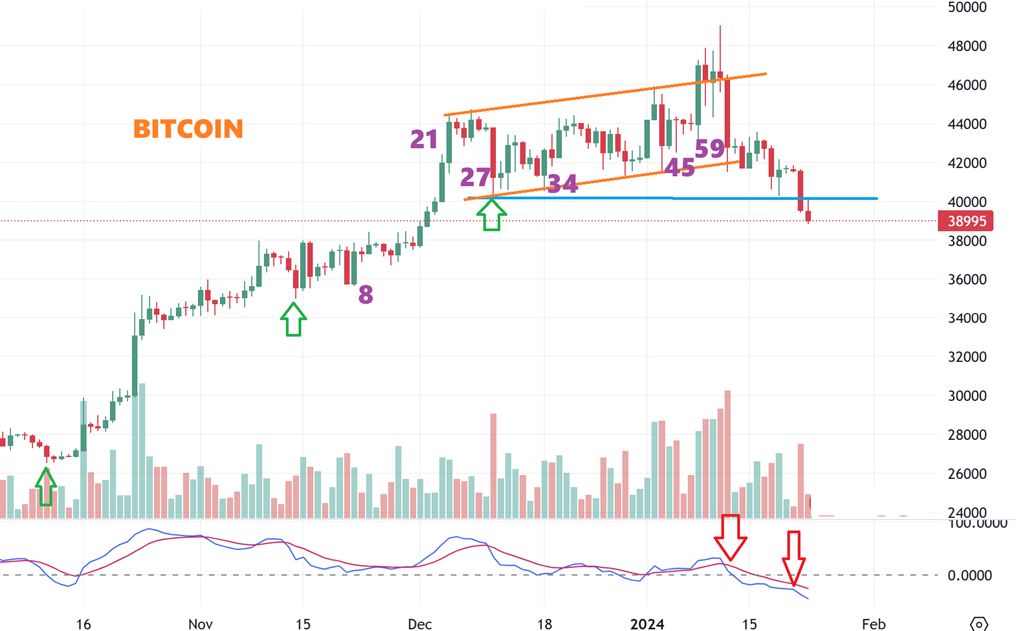
My Cycle count for BITCOIN relies on looking for a dip around day 30 and day 60 (give or take a few days). We saw a dip on day 27 & 34, and then after a run up into the ETF Approval, we saw a slam down on day 59. Now we have the prior lows being taken out as Bitcoin sells off as expected. I did mention that I DO NOT buy & hold this sector in a sell off, because the crypto related stocks get crushed, and we have seen that. Buying the next ICL, however, should be very rewarding as these double & triple again.
.
FROM THE WEEKEND REPORT:
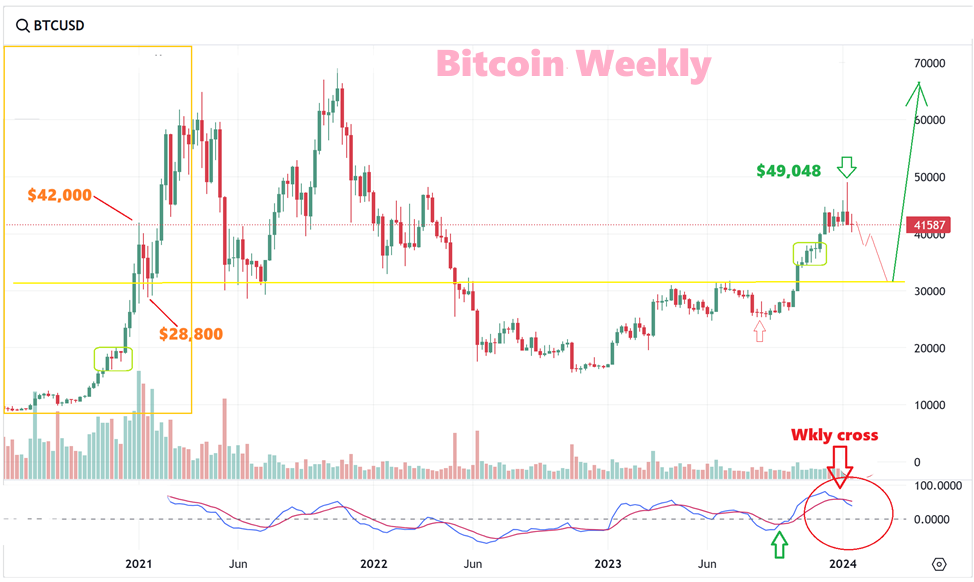
BITCOIN WEEKLY – I have been comparing the major run up in 2020 with the current one.
1. In early 2021 Bitcoin dipped from $42,000 to $28,800 in 2 or 3 weeks.
2. Could a large drop like that happen again? I think that we may soon find out. We now have a cross down in the lower weekly indicator.
.
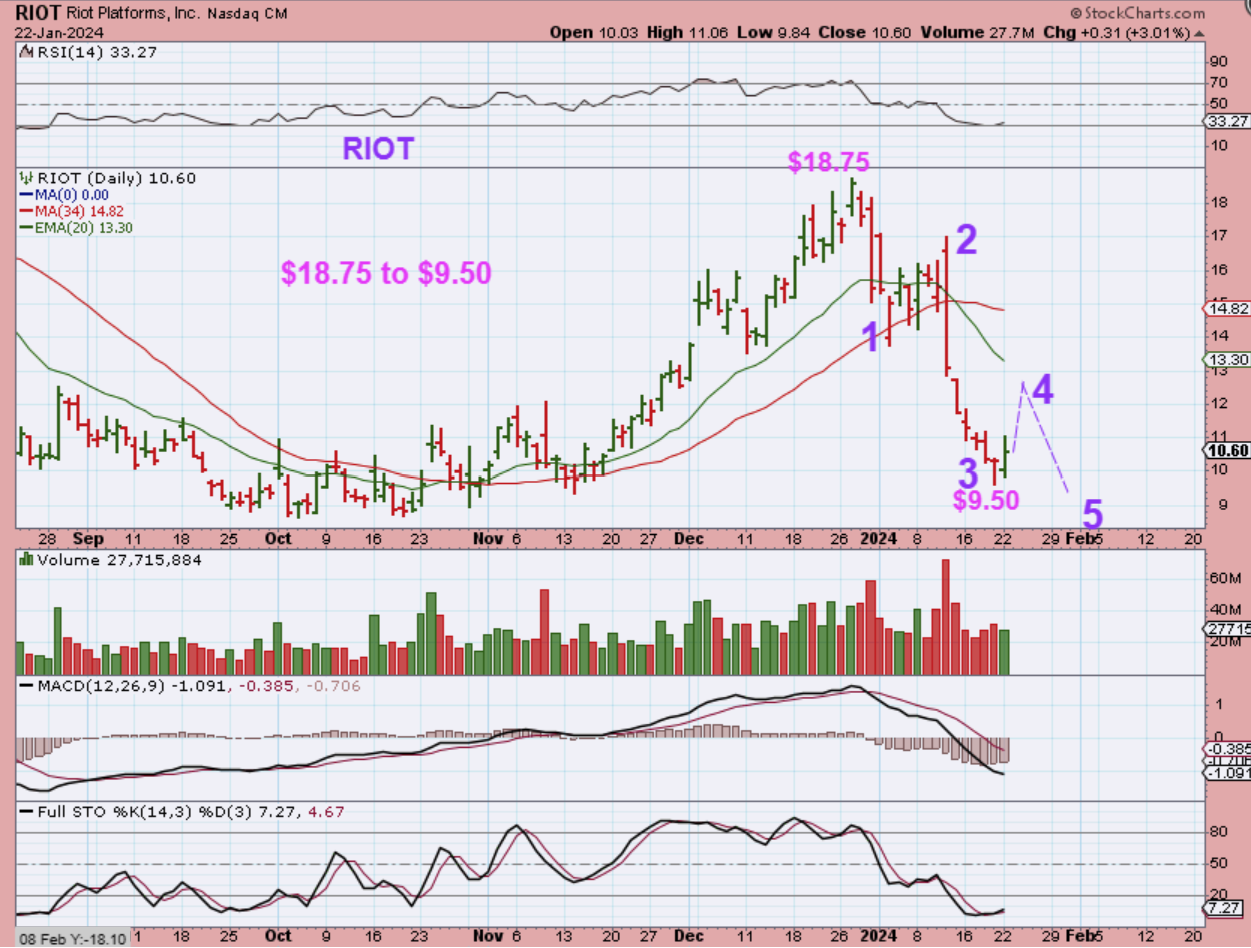
RIOT is just one example of many that have pretty much been cut in half. I am thinking that we still have more downside, so I drew a 5 wave drop (instead of leaving it as an a-b-c down).