WEEKEND REPORT
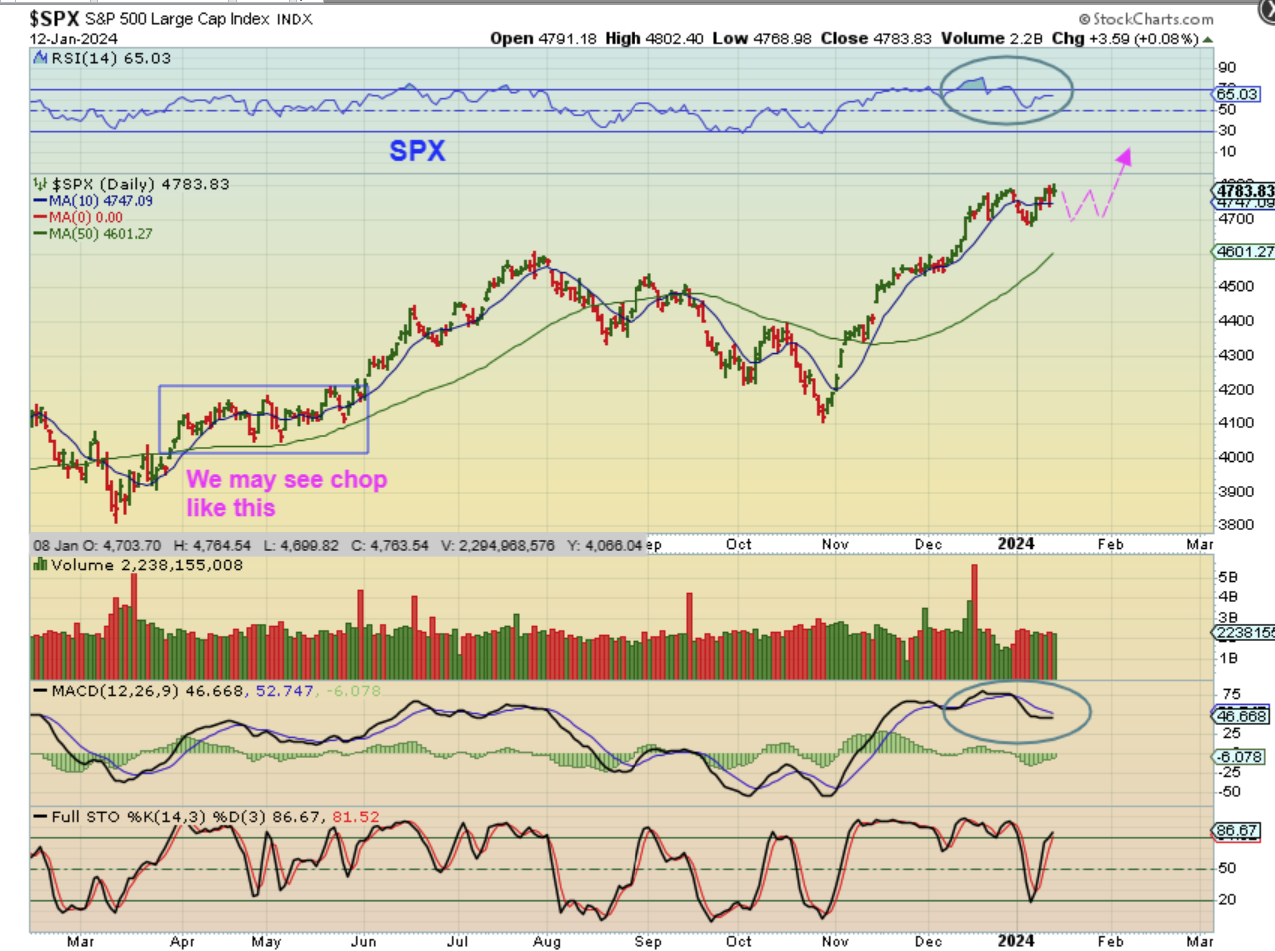
SPX DAILY –We have a dcl and Friday was day 5. When I see the divergence on the MACD and RSI, it makes me think that we MIGHT get some sideways chop up here at the prior highs, similar to what we saw when we came out of the March ICL. That is a ‘MAYBE’ it will get choppy. Another thought is a breakout to new highs and a back test, which would allow those indicators to catch up. What is my point in mentioning this? Simply that leverage under those conditions can be tricky if you buy and hold.
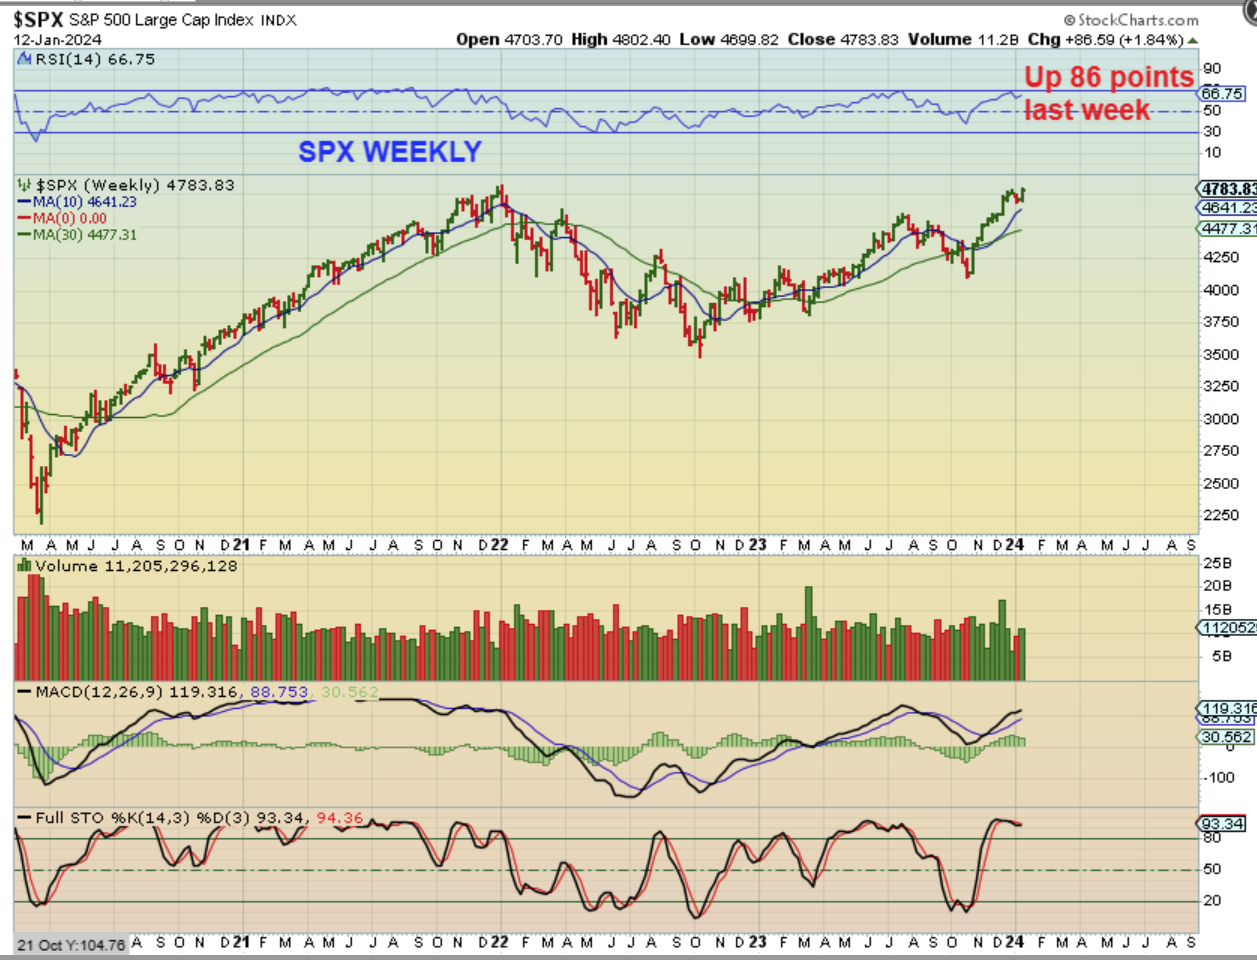
SPX WEEKLY -When I look at the weekly chart, however, it was a good week with an 86 point push up to the highs out of the lows.
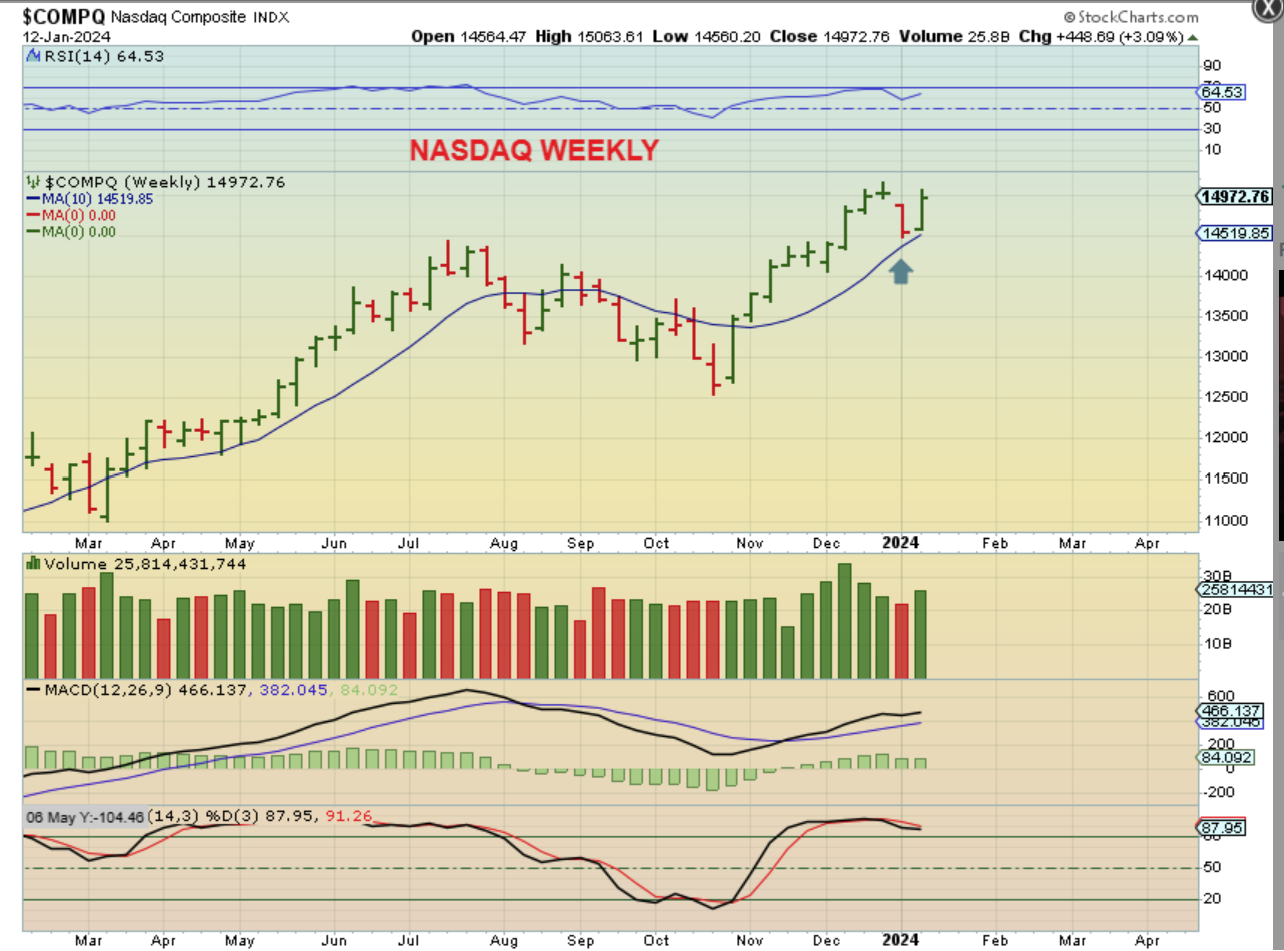
NASDAQ WEEKLY -The Nasdaq actually ran up almost 450 points after reversing above that 10 week ma. These are bullish set ups and should continue higher over time.
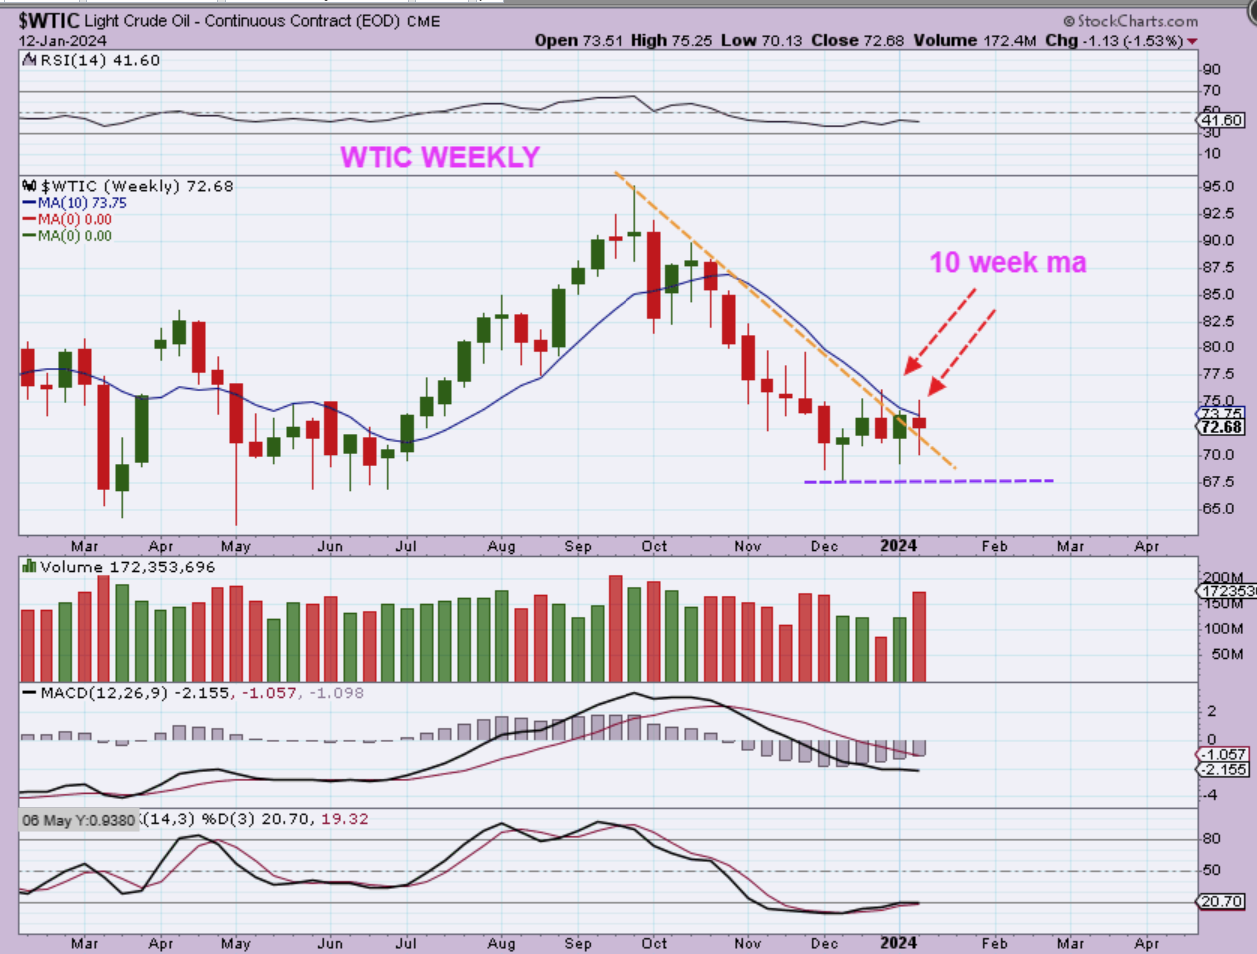
WTIC WEEKLY – As you know, Oil has been chopping sideways for weeks and that is what we see with the weekly chart. The MACD is slowly trying to curl upward and it does remain oversold, so i can push higher if it breaks resistance.
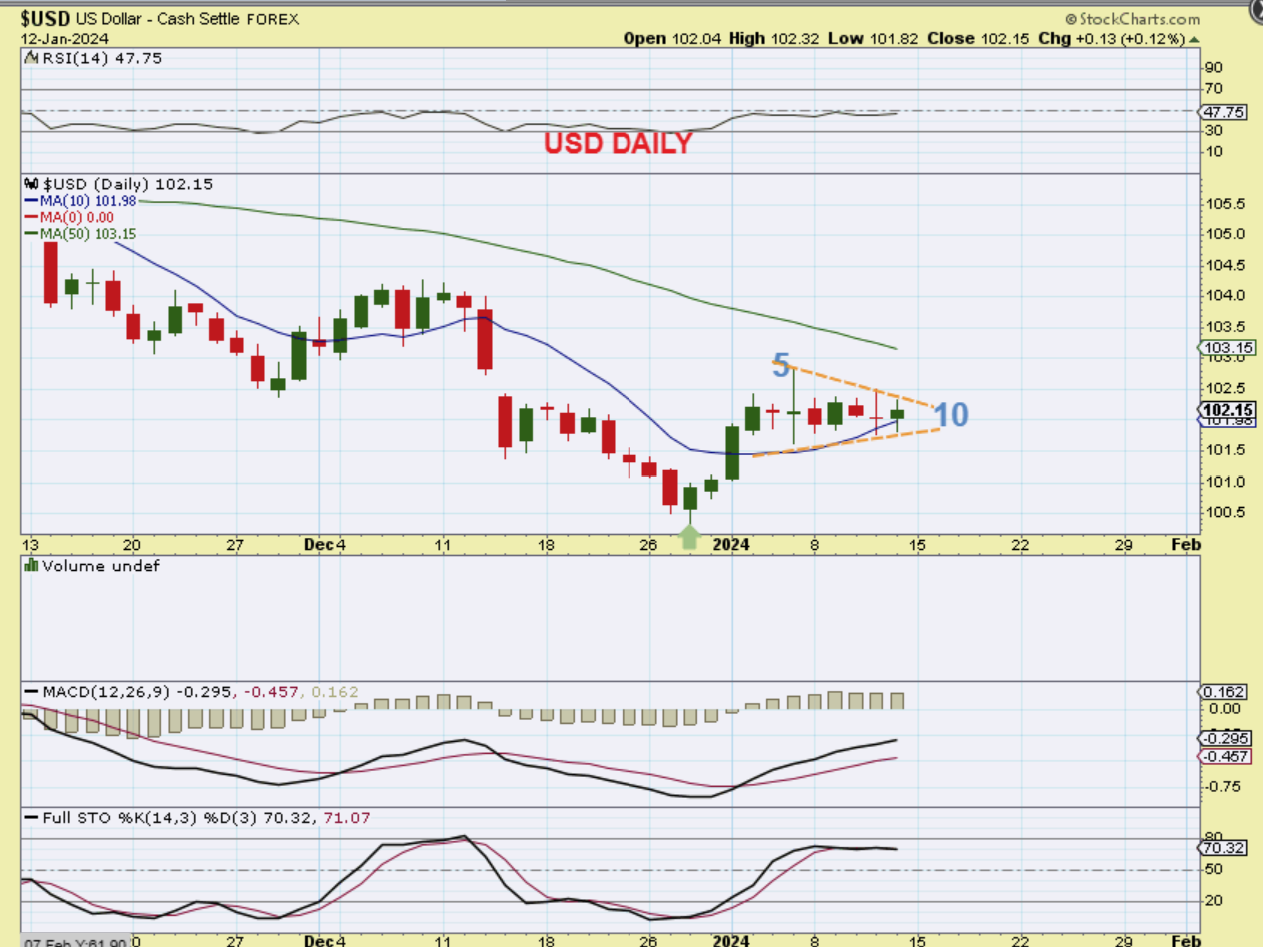
USD DAILY- At this point the USD has a peak on day 5 and we are on day 10. This might be a bullish set up and if it breaks higher it then threatens to become a R.T. Daily Cycle. So far…
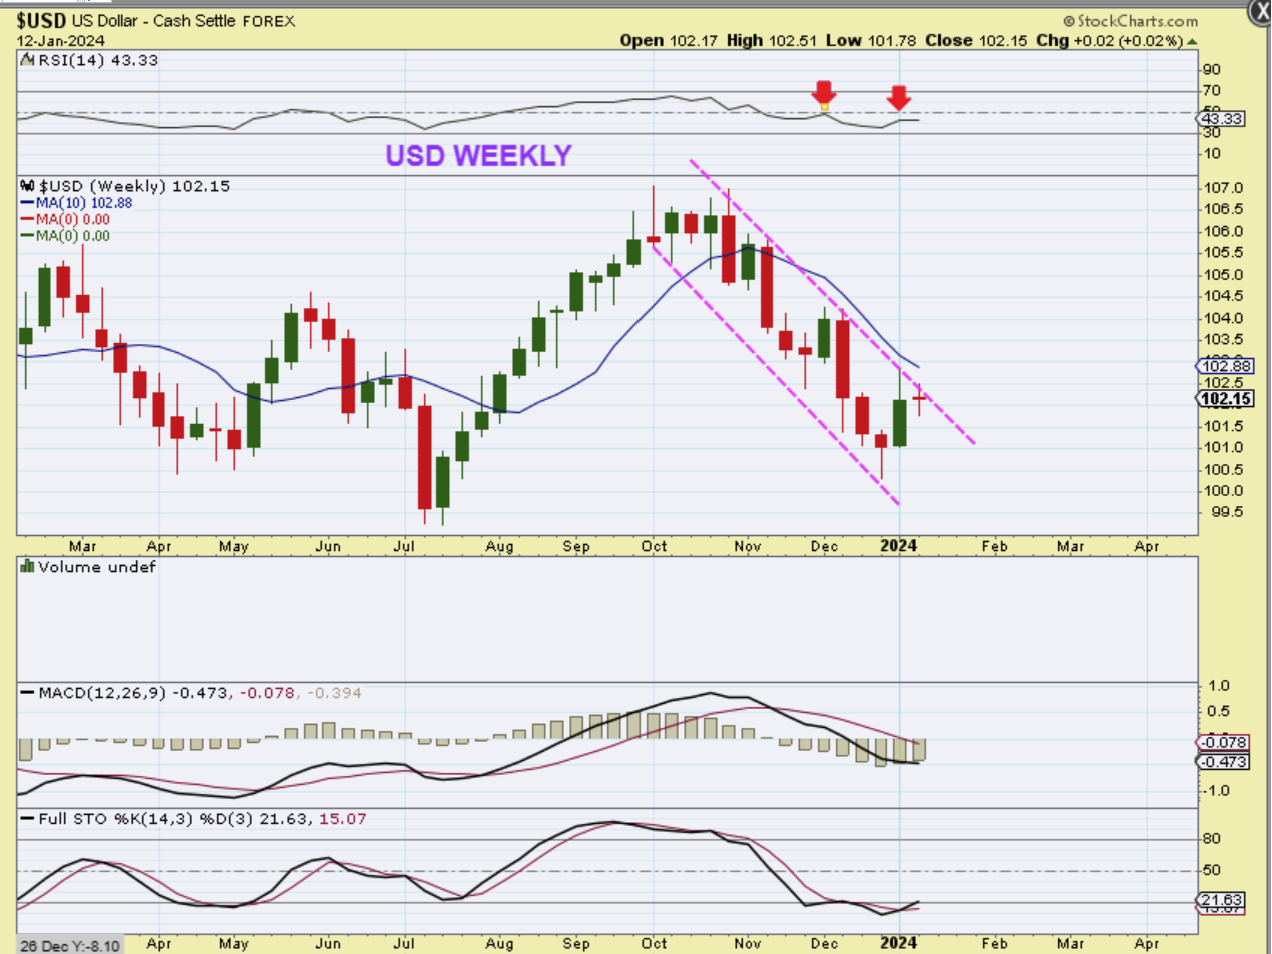
USD WEEKLY – So far though, it has been trapped under a downtrend line.
.
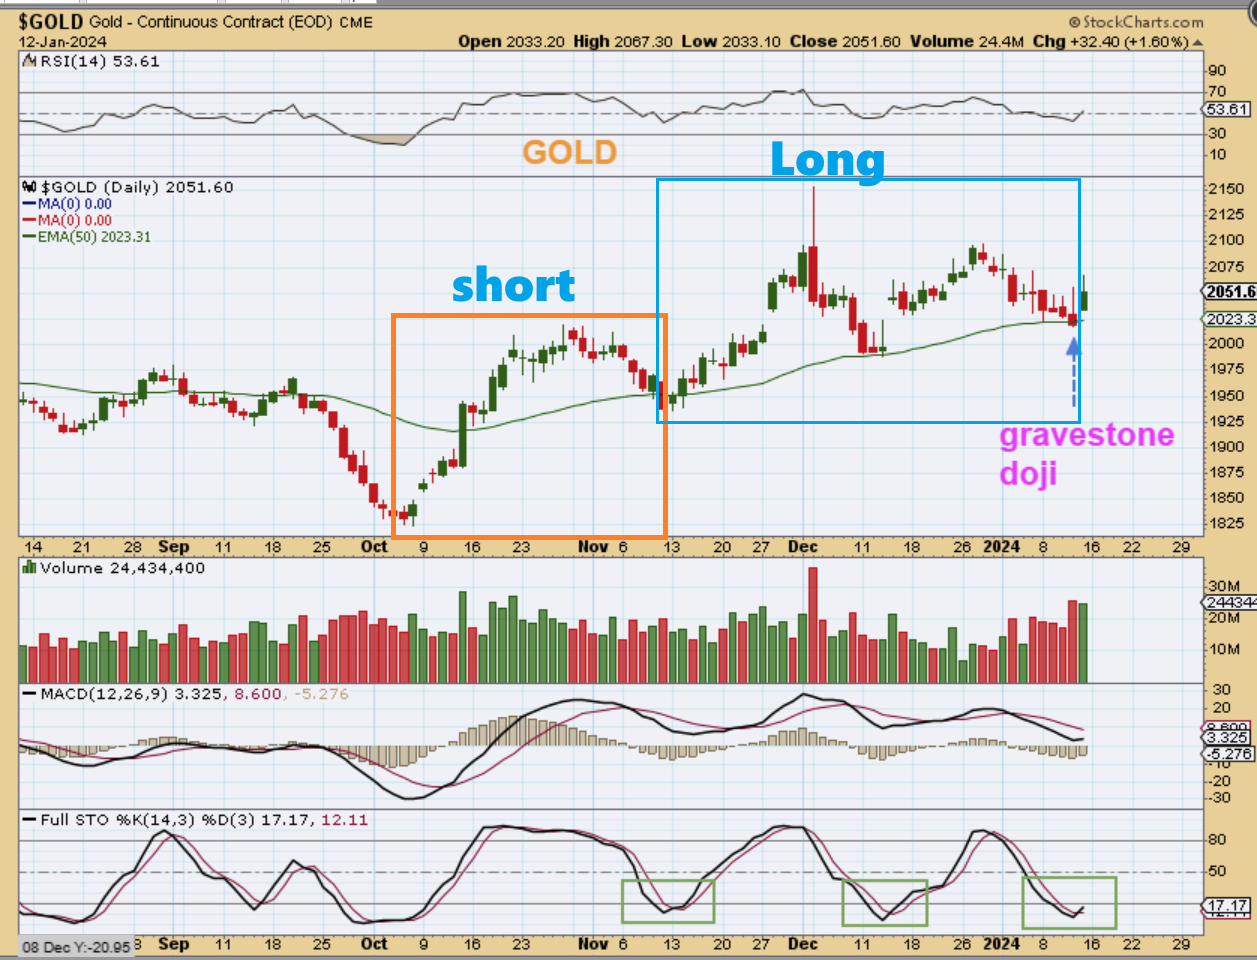
GOLD DAILY: I was surprised and not surprised at the rally that we had on Friday. We had a gravestone doji right at the 50sma that I pointed out, and those usually signal an end to a sell off, so it made sense that we should bounce. It was a strong bounce with good volume and I saw that with some of the Miners too, so that is what surprised me. This should only be day 20 and that is normally too early for a dcl. I wondered if this was a dcl, and the last reversal at the 50sma was a 1/2 cycle low? That could be, but the selloff in Silver at that dip seemed very sharp, so I marked it as a dcl.
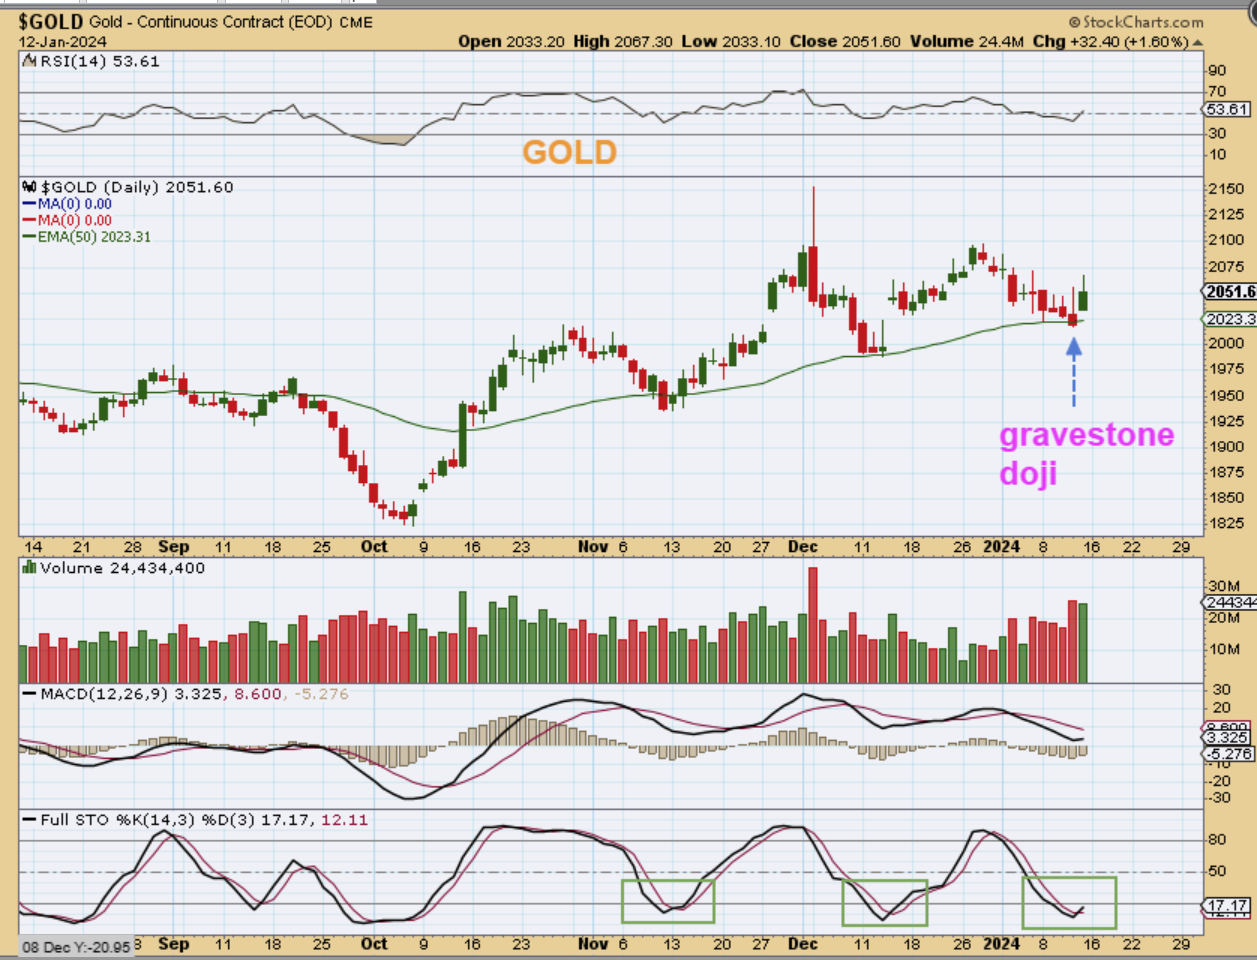
GOLD DAILY: IS THIS POSSIBLE? A drop into a 1/2 cycle low after that Exhaustion candle, and that gave us 1 short and 21 long daily cycle? It could be possible, but it is still L.T., so our expectations for this intermediate cycle do not change. Sideways chop into an eventual ICL. So, let’s go to the weekly…
.
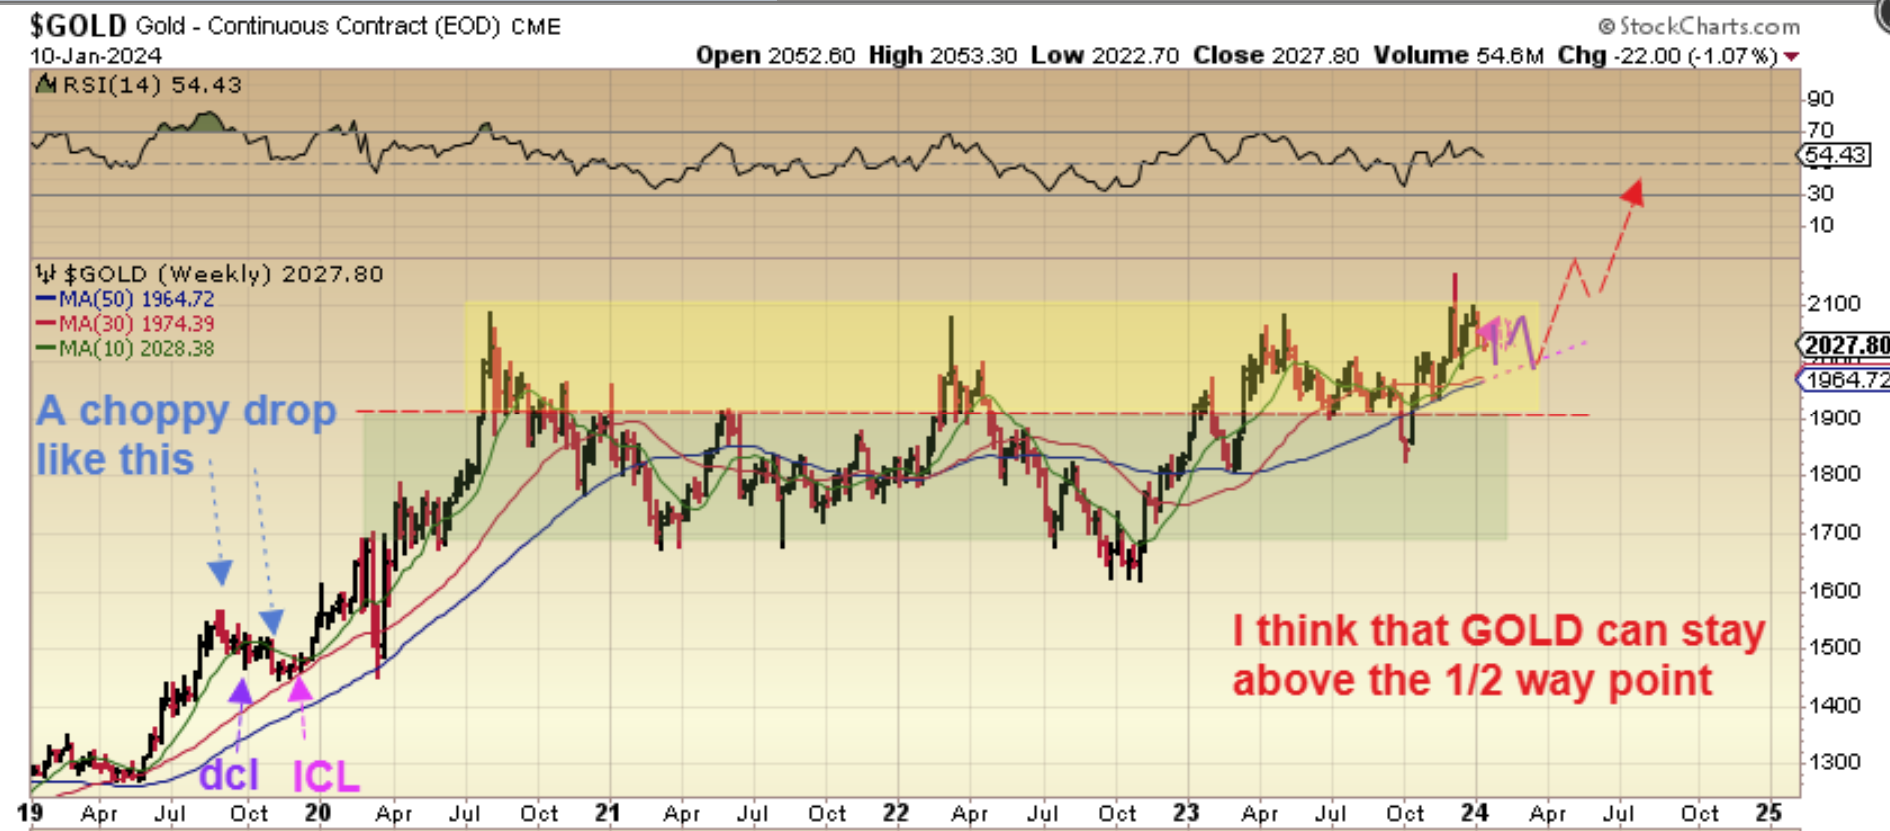
GOLD WEEKLY #1: Recently I drew this very bullish view of Golds Weekly chart. Gold has been holding up well, so I was discussing a sideways chop similar to the 2019 chop into an ICL. That would be a dip down to the 30 week ma. I want to show you a bearish view, even though I favor the view shown here.
.
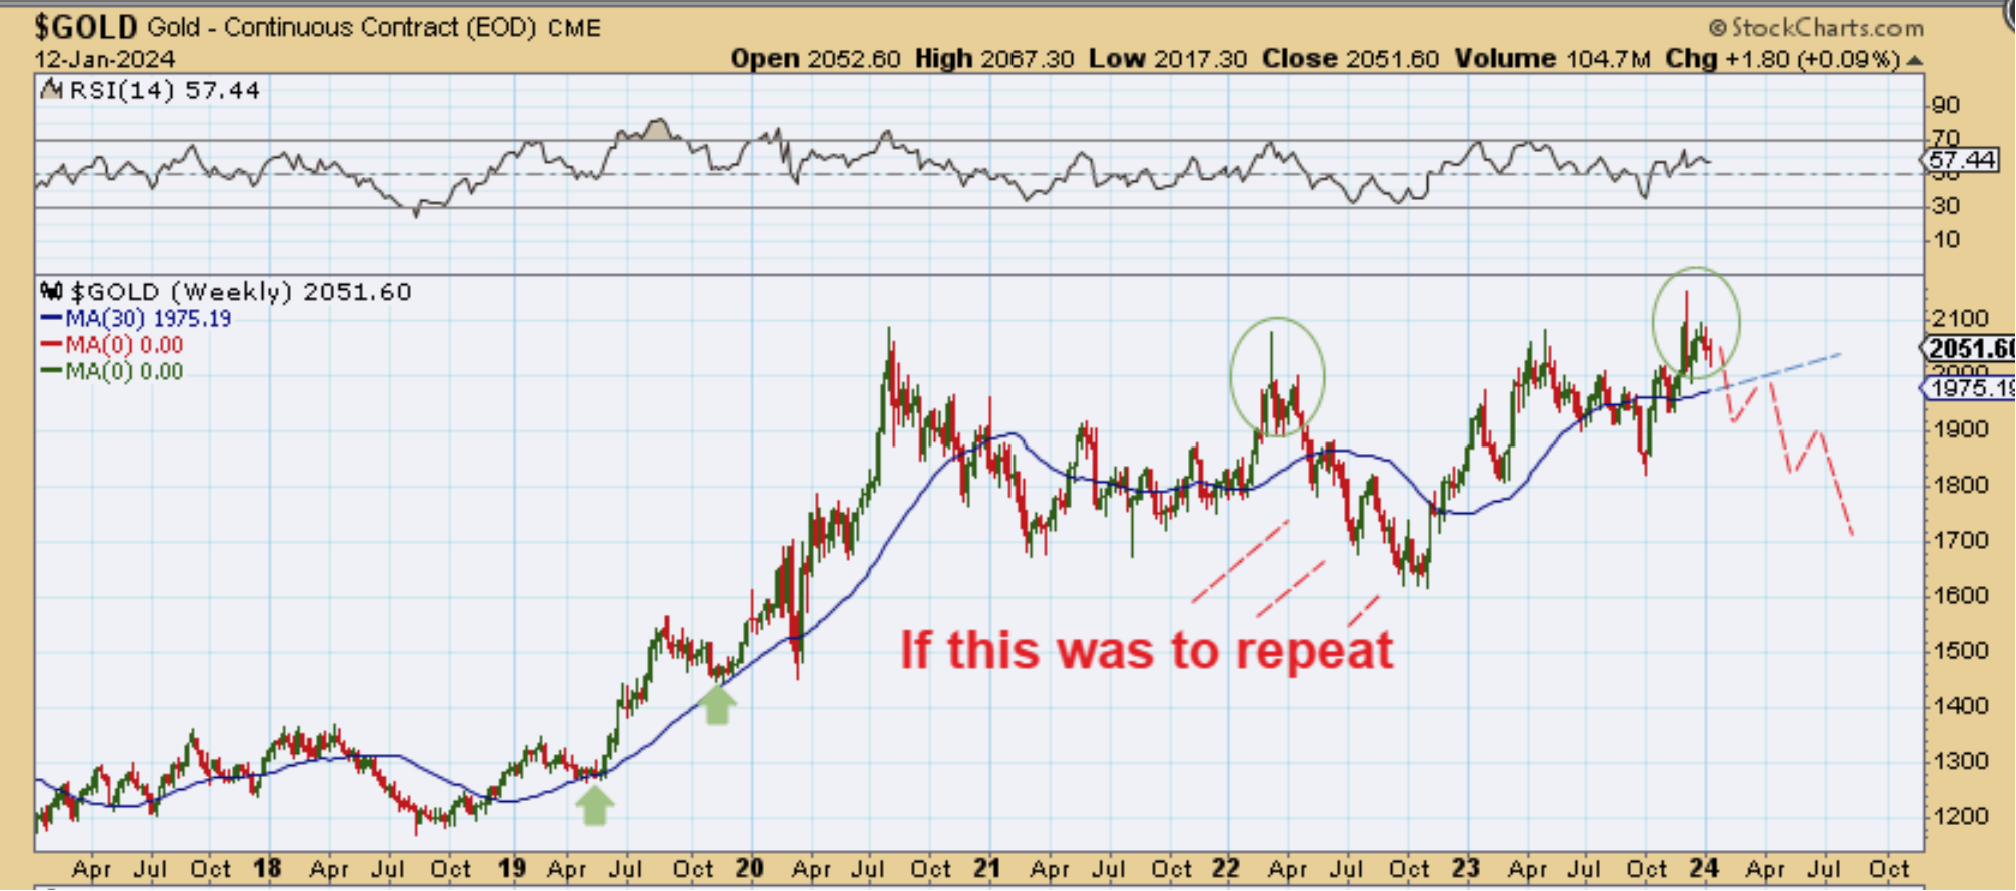
GOLD WEEKLY #2 – I get this view when I just repeat what happened in 2022. I’ll admit that right now that false break out to the highs and reversal in 2022 does look quite similar to what I am seeing now, so I’m watching for mainly 1 thing.
1. In the Bull run of 2018-2020 (except for the covid crash), ICLs held above that 30 week ma, and I have been pointing that out for months.
2. I am watching Gold when we dip down into an ICL to see if it holds up there. I’m o.k. with it breaking it slightly and recovering, but if it drops below and back tests it? I think it may be telling us to be careful.
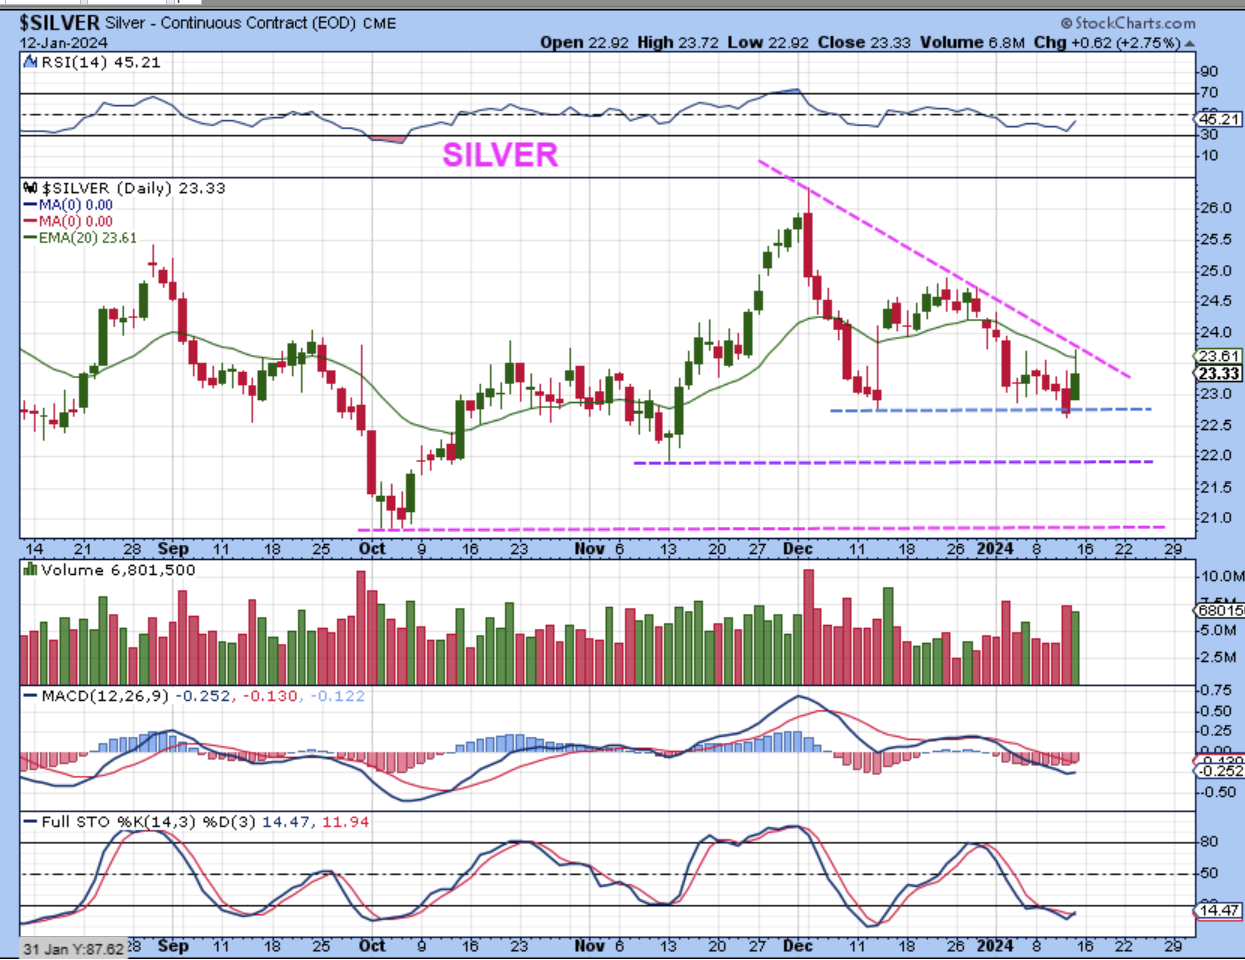
SILVER DAILY– Silver rallied up on Friday, but then sold off after hitting resistance. Friday was a bit of a surprise for me when Gold, Silver, and the Miners just started to rally higher after all of the recent chop & drop. It should have been day 20, so it just seems too early for a dcl, and that is why it was a surprise.
1. Do you see the sharp drop into a large gravestone Doji in December? That is partly why I marked that as a dcl. The drop was sharp.
2. Could that be a 1/2 cycle low and a longer 2nd daily cycle just ended? I cannot rule it out, but at this point we see a bounce coming in and the USD (so far) stalling at resistance. Let’s see how it plays out.
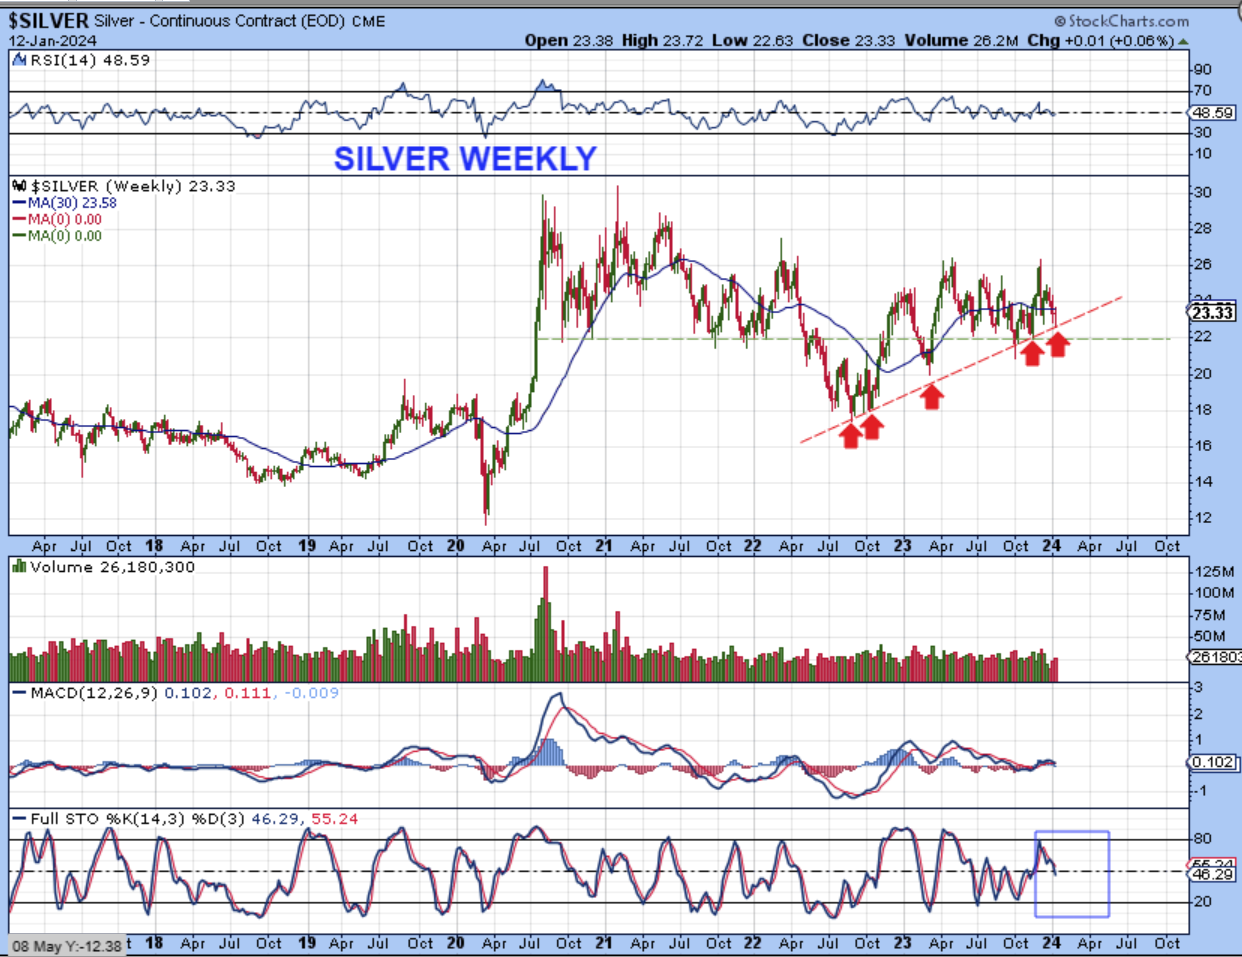
SILVER WEEKLY – I look at Silvers weekly chart and it did just hold the uptrend line. Some Silver stocks like CDE, EXK, HL, etc put in a strong bounce, but then sold off midday.
GDX popped after a Thursday reversal candle too, and many miners actually ran up with strong volume, but they sold off as the day went on. This is why I thought that it might be possible to have a dcl here – the rally Friday had good volume. That last candle should be green and the last volume candle should be green too. Let me correct that…
.
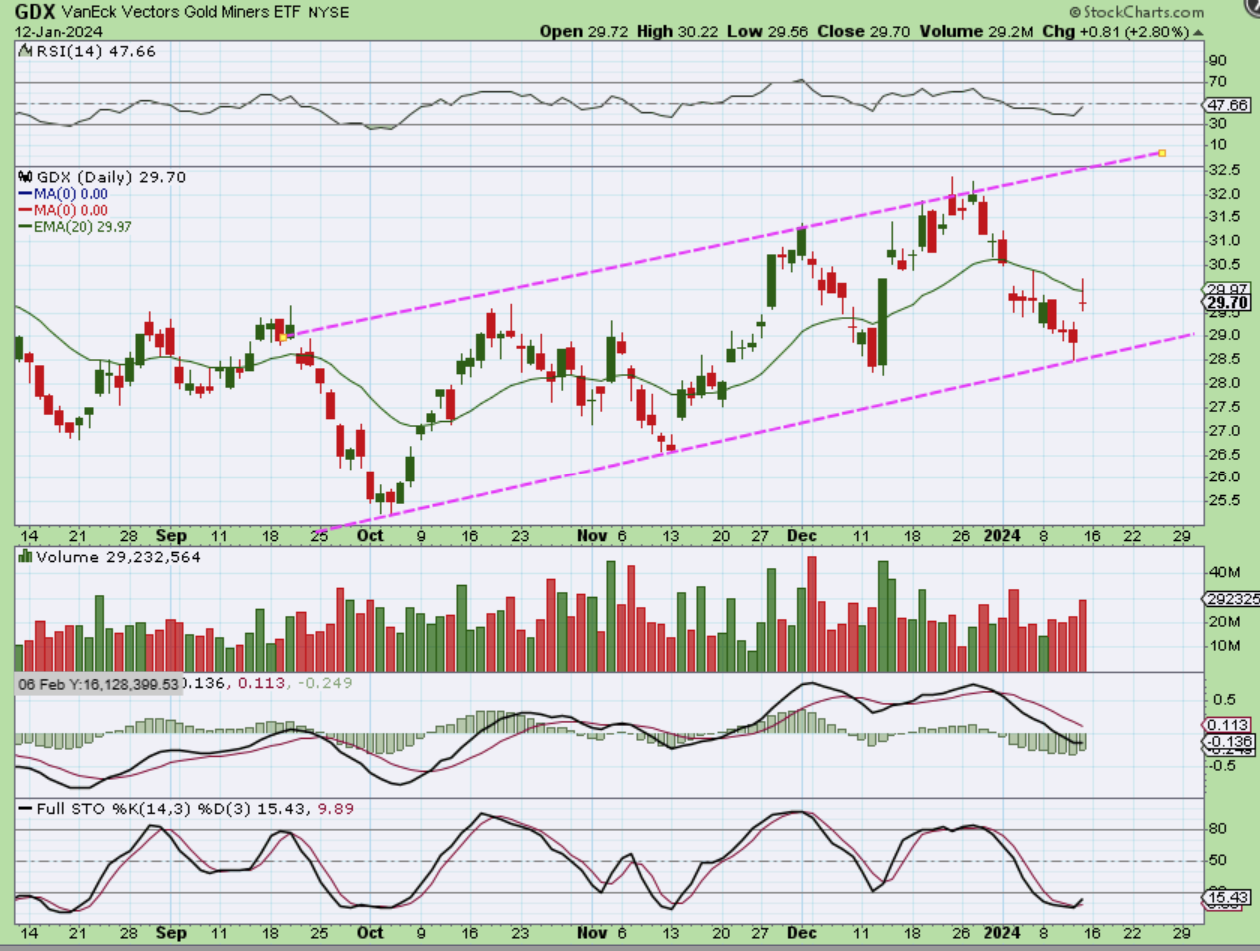
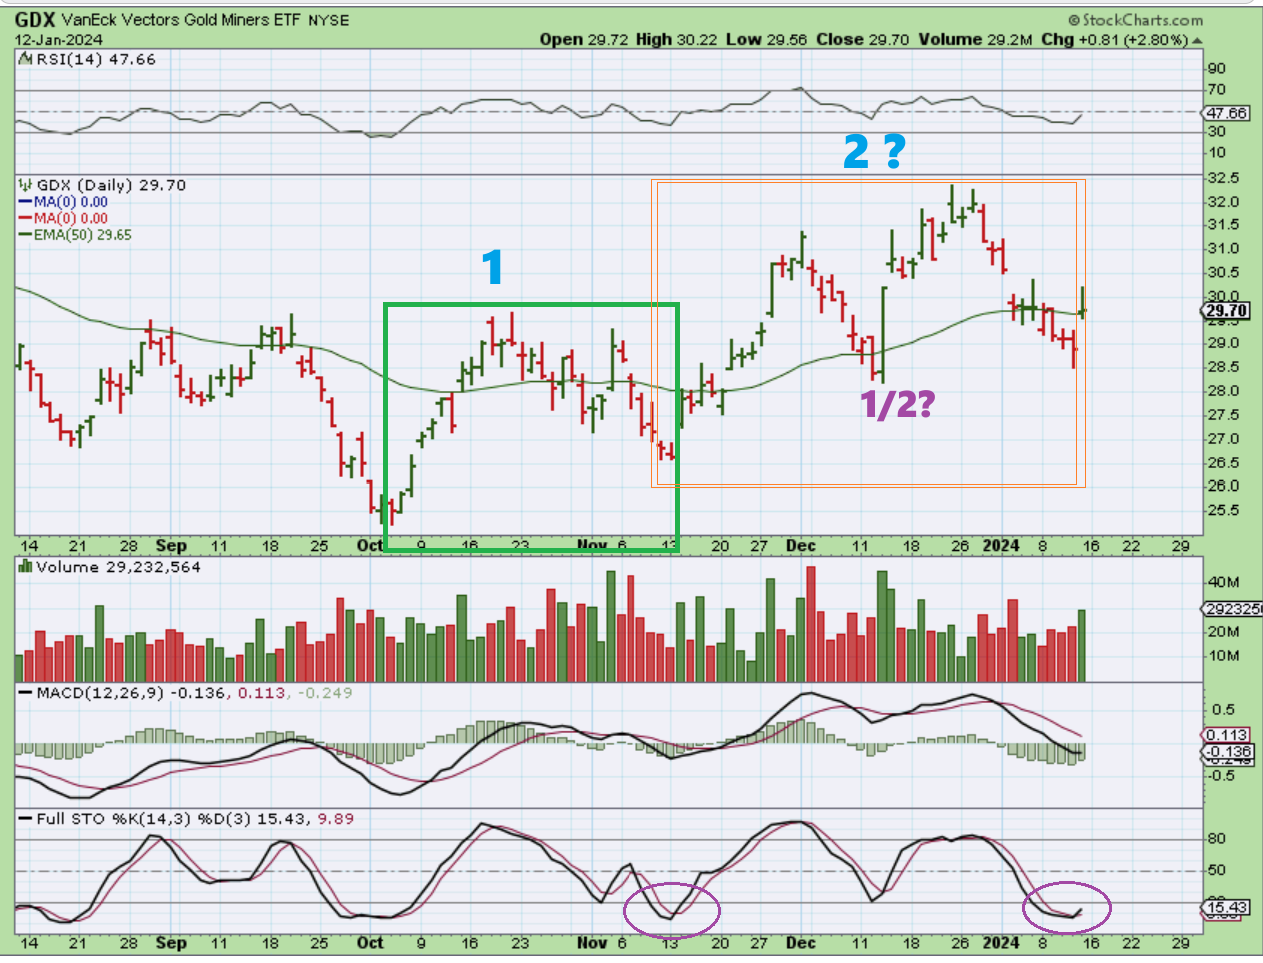
GDX – This price action is a bit odd, and it simply may have to do with all of the rate hikes and now thoughts of possible cuts, etc. That sell off in early December was strong, but the reversal there was really very strong! Was that a dcl? I thought so, but could it have been a 1/2 cycle low? It could have and if so, this (unlike Gold or Silver) would be a R.T. 2nd daily cycle. You can see that this price action is VERY ODD, when Gold and Silver are not R.T. and GDX may be.
.
It is a long weekend in the US, so markets are closed until Tuesday. The General Markets remain Bullish, Oil remains choppy. The USD is stalling at resistance, and Gold, Silver, and the Miners Popped with volume on Friday after the PPI Report (inflation). It would not be normal for Gold to run up to new highs at this point, but the Miners might give it a try if the USD cannot push higher. It is an odd set up and I’ll continue to watch it and cover it in the daily reports. Bitcoin coverage is below, have a great weekend all!
.
~ALEX
.
IN FRIDAYS REPORT:
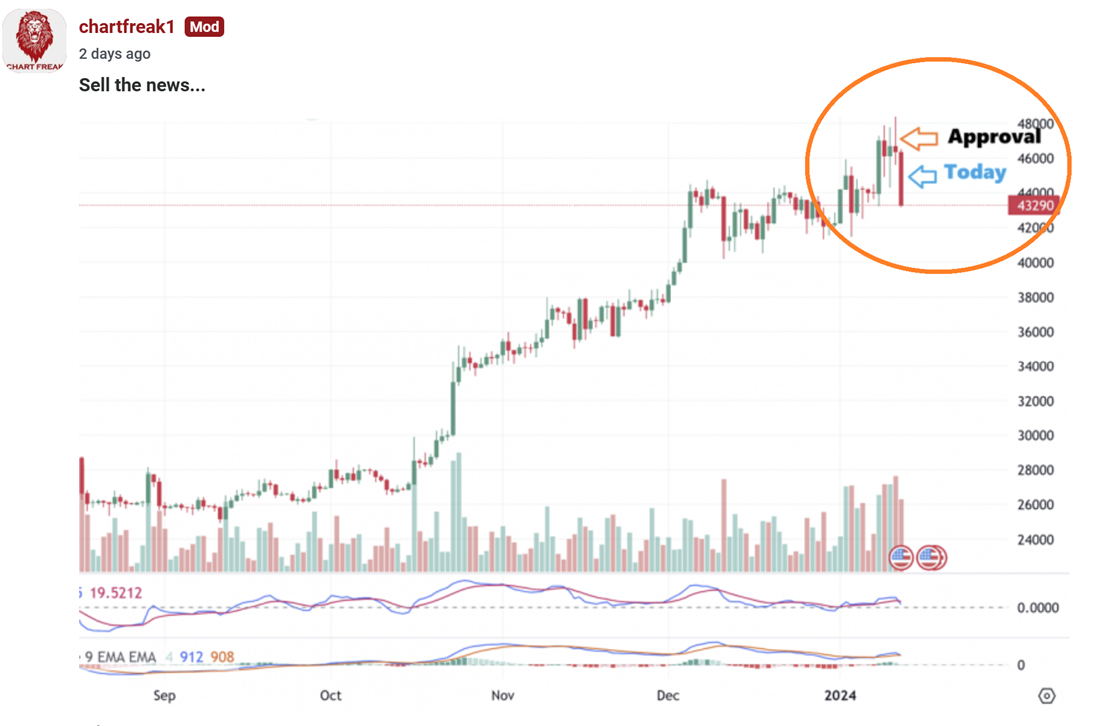
BITCOIN rallied about $3,000-$4,000 on Thursday after the approval, but then it sold off quickly. This is a reversal candle, so this MIGHT be topping and ready to drop into that day 60+ dcl. We’ll see. So far though, this was a $4,000 rally and reversal with the approval.
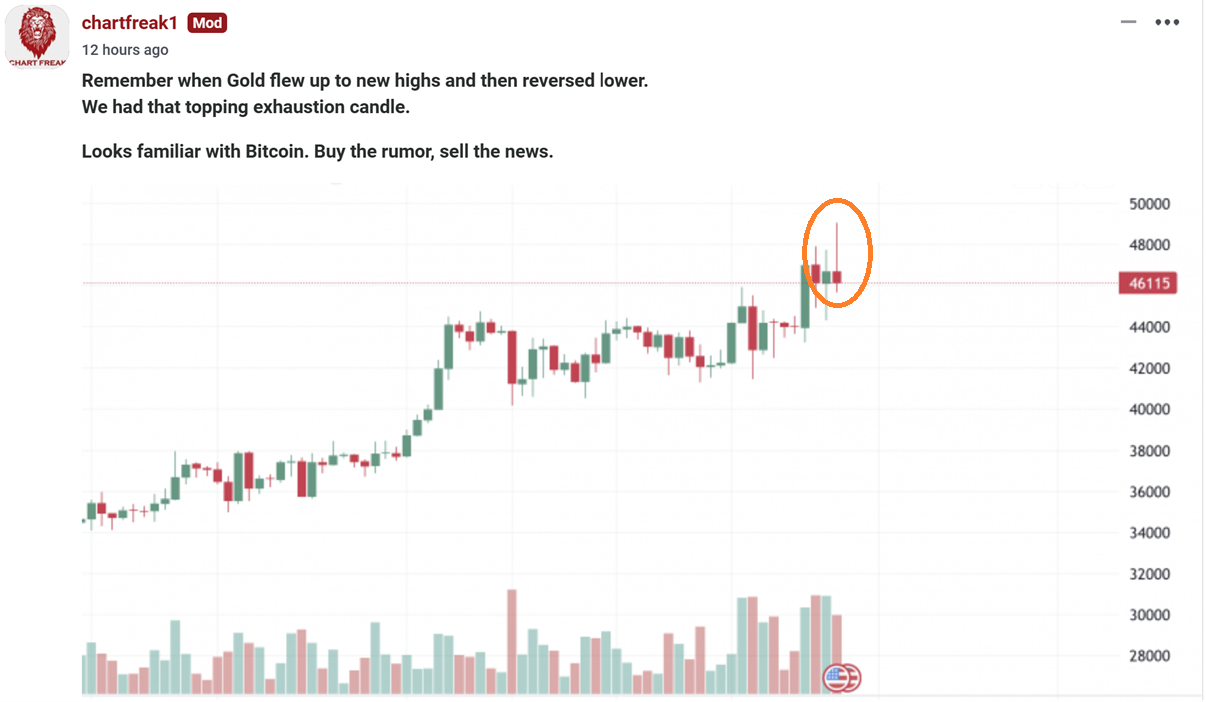
I wrote this on Friday. We did see a short-term topping candle and then follow through lower as the day pressed onward. To me, that rally to $47,000 and then a drop AFTER THE APPROVAL was that “buy the rumor of an ETF approval, Sell the news of an ETF approval”. Now we will watch the pull back and try to discern the next buying opportunity as time reveals the next path. FOR NOW I THINK IT IS GOING TO CONTINUE LOWER AND HERE IS WHY…
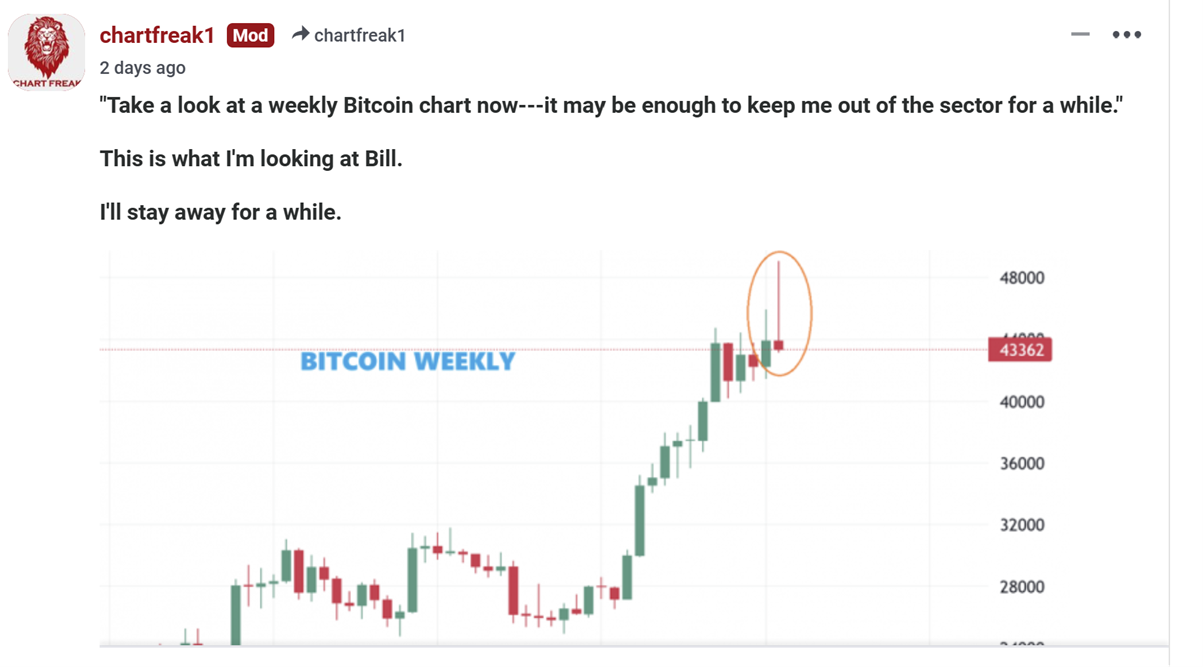
BITCOIN WEEKLY : I posted this in Fridays comments as a warning.
You just CANNOT WISH THESE AWAY. A large weekly reversal candle like this on a weekly chart is a topping signal for now. This should take some time to work off the excess bullish sentiment.
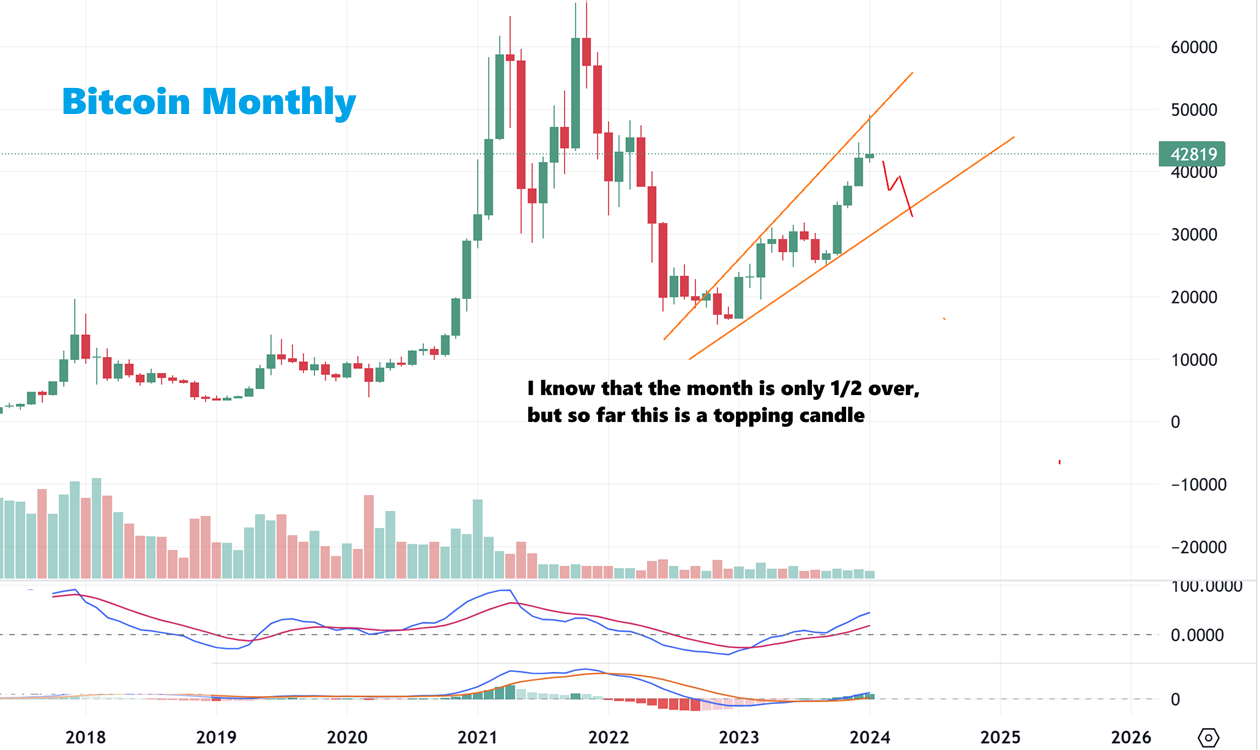
BITCOIN MONTHLY- I know that it is too early to examine a Monthly chart, but this is a topping candle. If this plays out like this, you’ll see MARA , RIOT, IREN, CLSK, CIFR, etc etc. much, much lower. I want to be patient and I do NOT want to chip away at my recent gains.