Thursday January 11th – All Eyes On Crypto
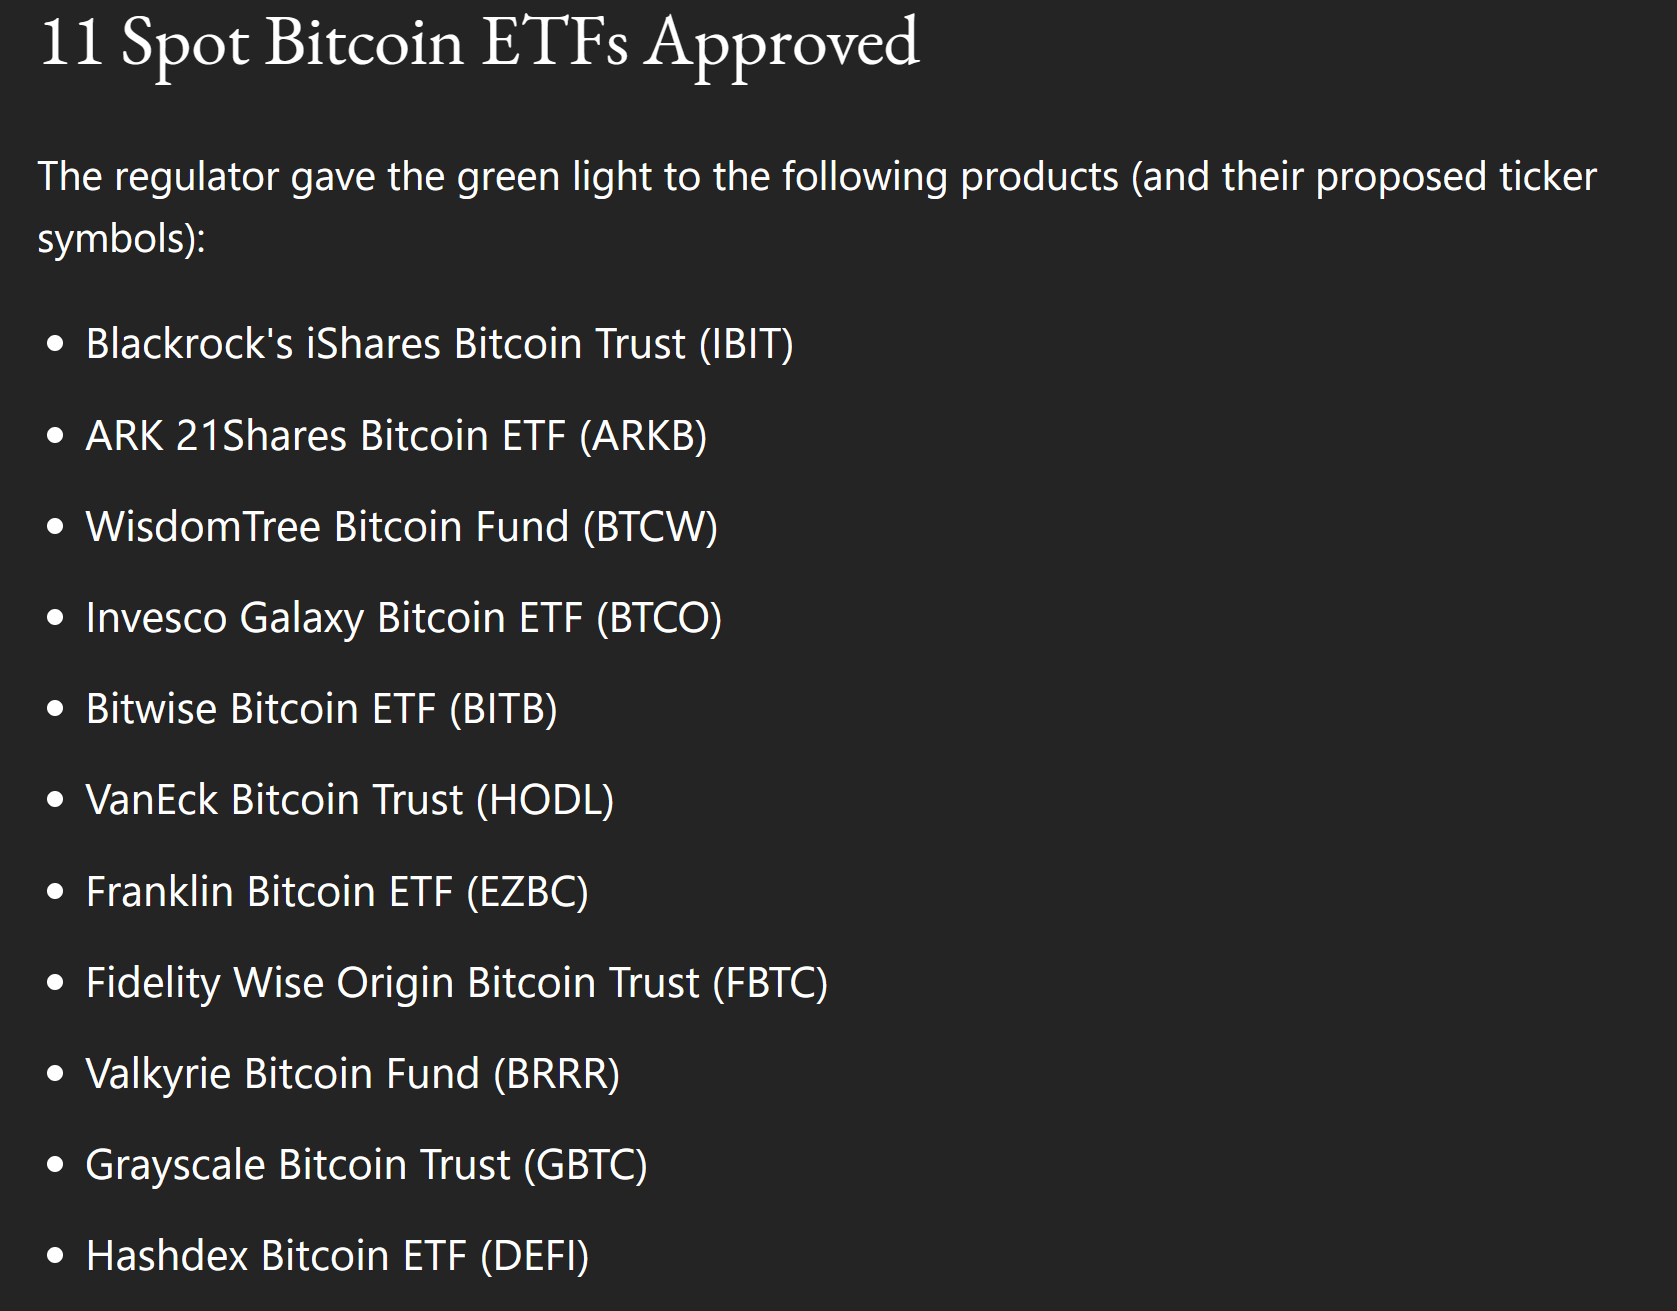
Thursdays data of the jobless claims and the CPI Numbers are a market mover, so we’ll see how the futures react at 8:30 a.m. Eastern Time. Also, all eyes are on Bitcoin now. 11 Spot Bitcoin ETFs were approved last night, and they can begin trading ….TODAY. Overall that is a BIG DEAL, but will we see buying start to flood in right now, and price will just continue to run away? Or has accumulation already been taking place in anticipation of that approval? Was it necessary for these ETFs to already be buying Bitcoin and accumulating, so that we’ll just see more gradual accumulation over time? Again, in the long term I think that this move to approve the ETFs was a very bullish development, but what about the immediate reaction this week and next? It could be a very volatile time period and it could even be quite explosive. We will just have to wait and see.
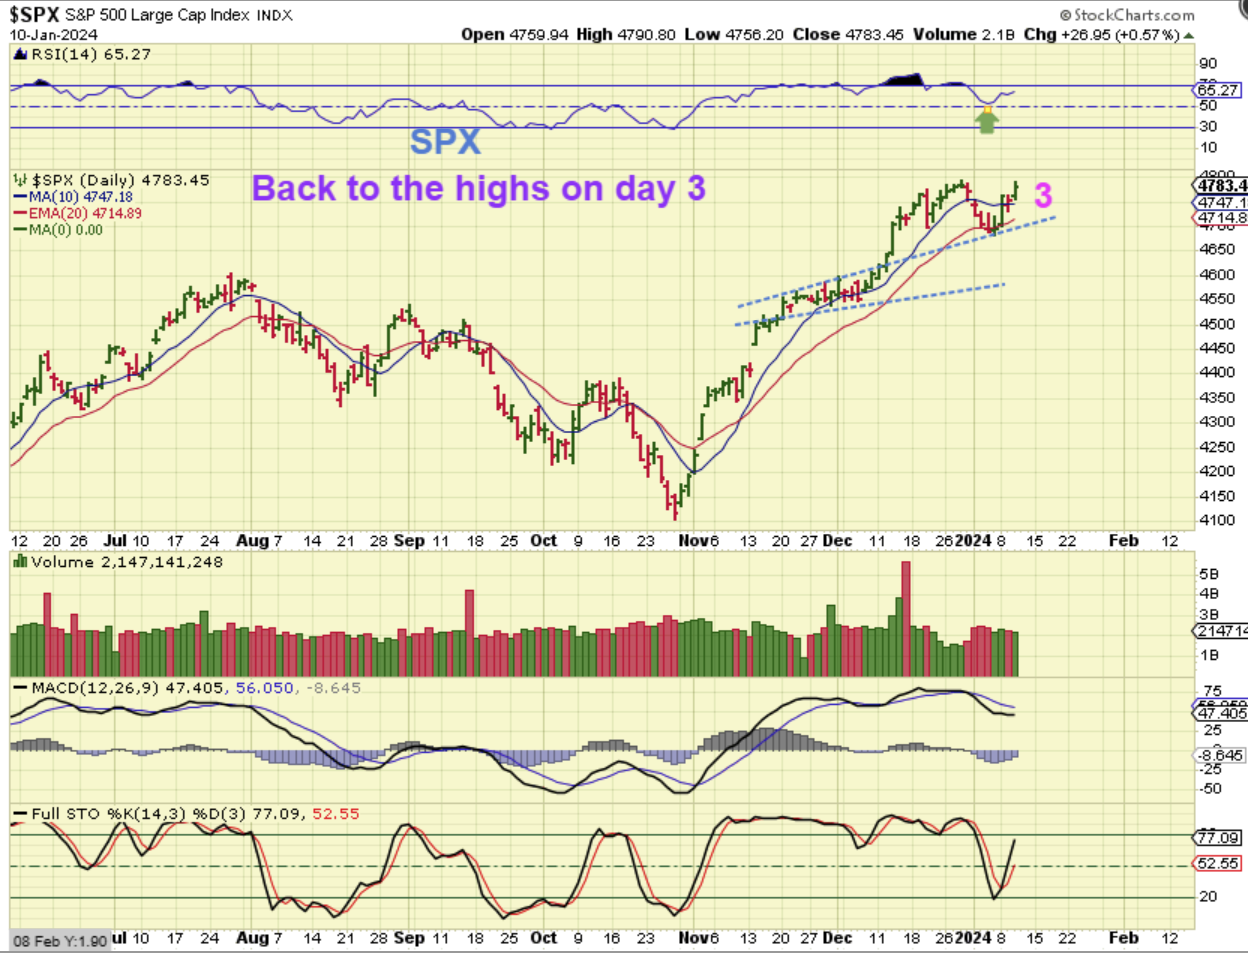
At this point, we are seeing some follow through, and The SPX is already back at the recent highs. It is only day 3 so if the markets were to dip at the release of the CPI Number, it would be a buying opportunity, just like Tuesdays ‘pause’ was.
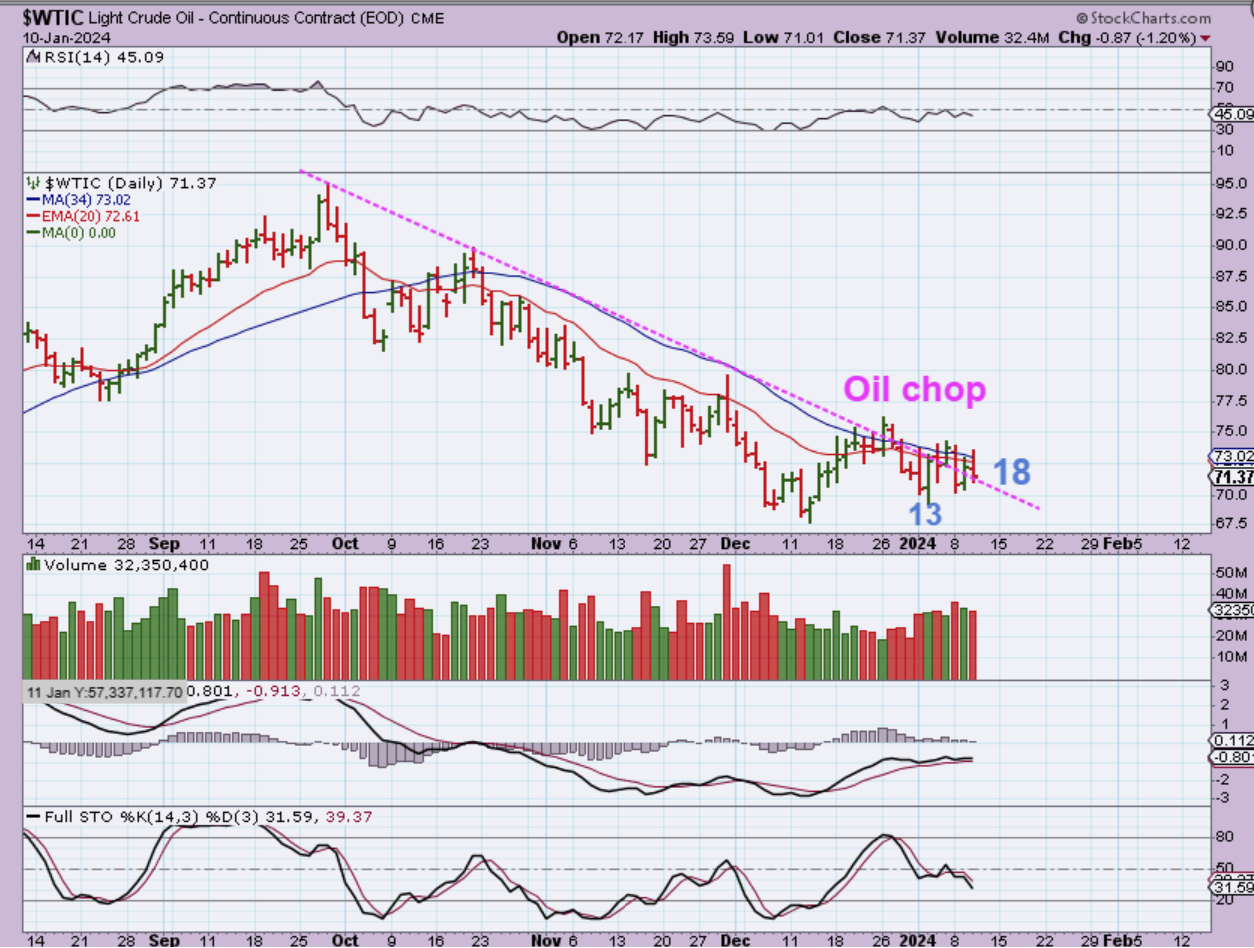
WTIC – Oil is on day 18 and it is STILL chopping around down near the lows. This would be very frustrating if you invested in Oil anywhere over the past 3+ weeks really.
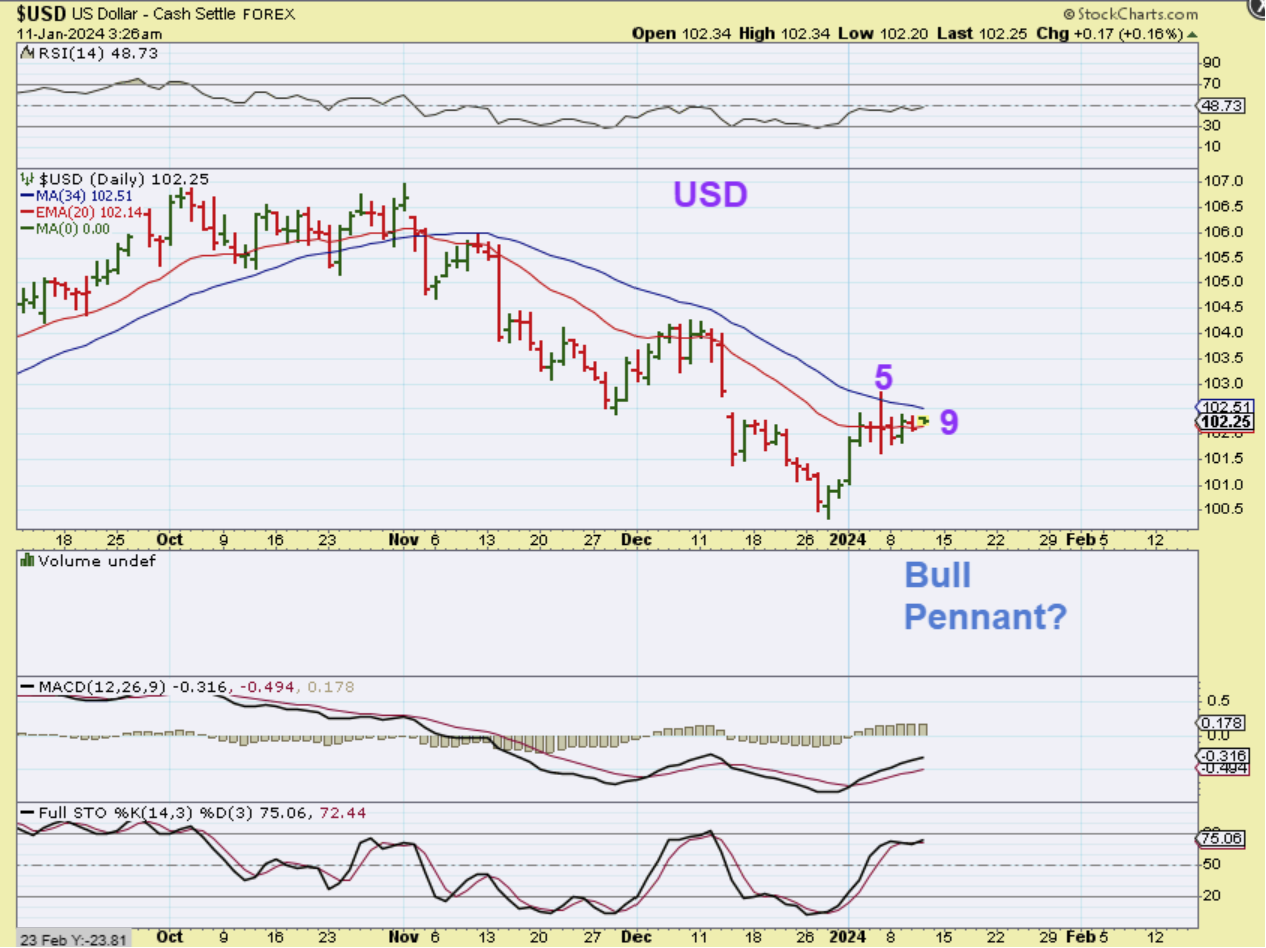
THE USD has struggled and chopped sideways at resistance, but it may be building energy to break higher out of a Pennant flag. We’ll have to wait and see, but this would be short term bad for Gold if it breaks higher.
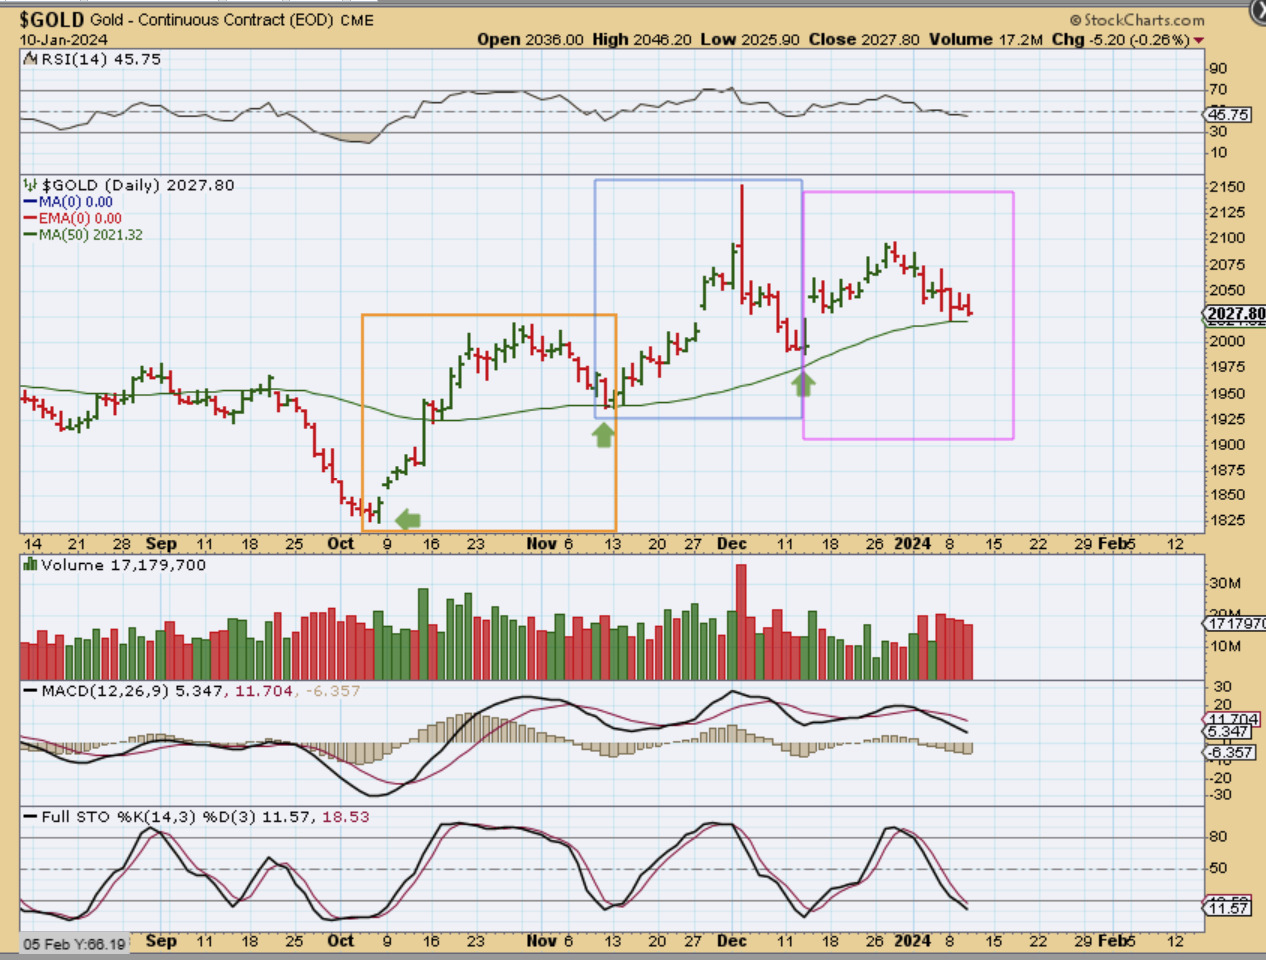
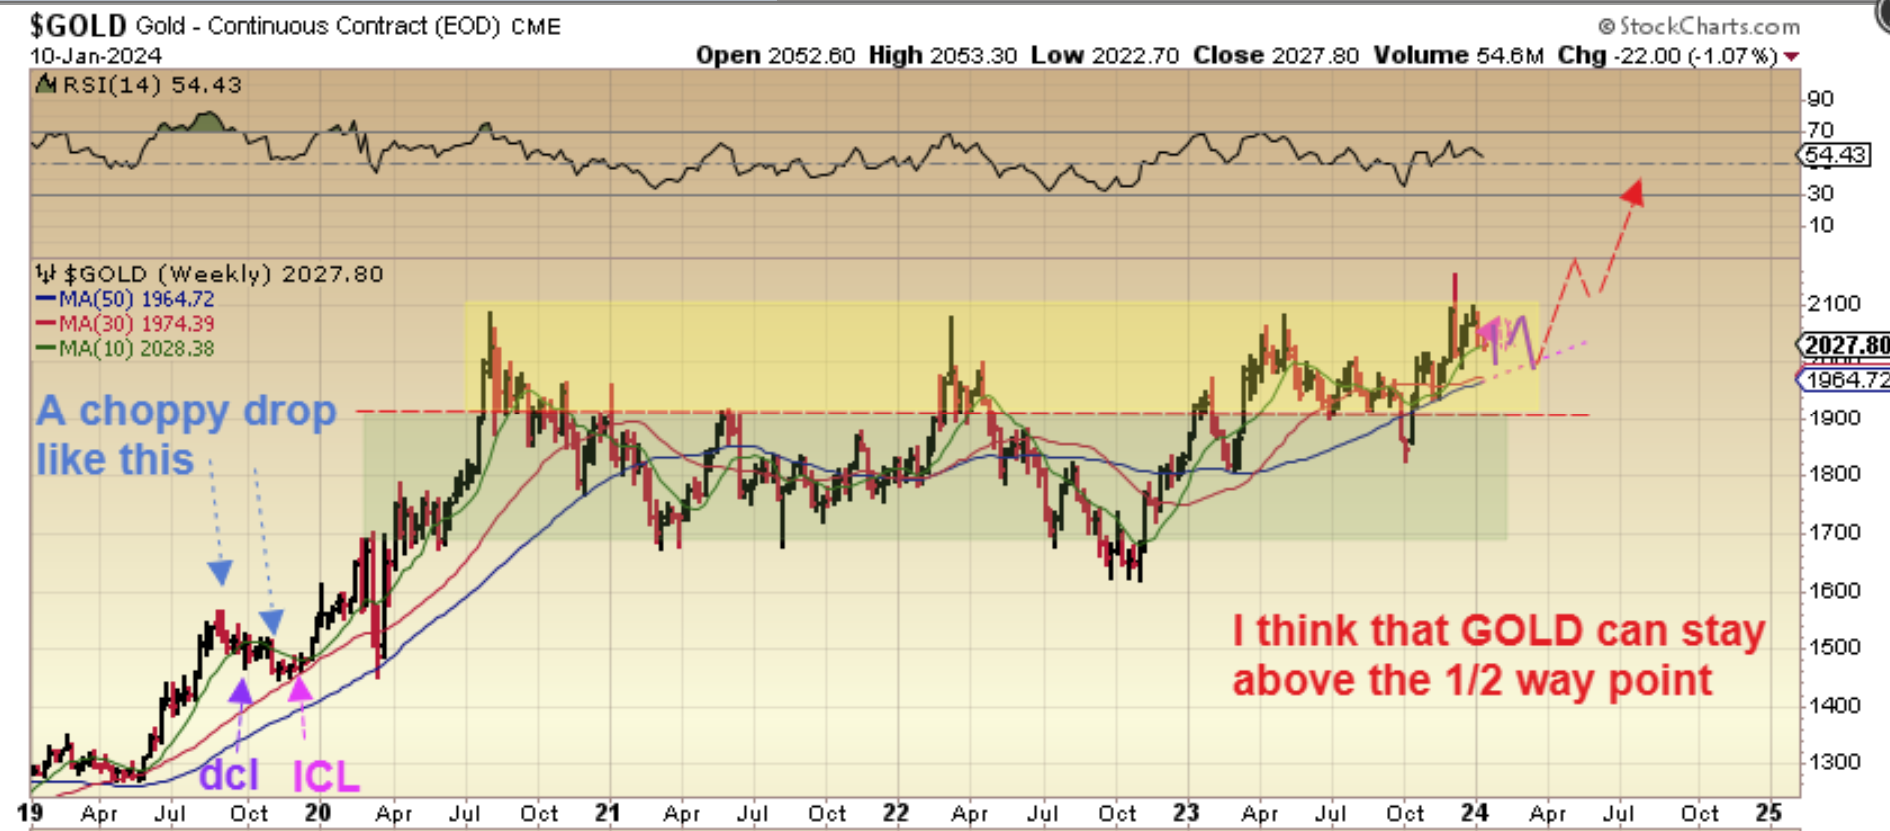
GOLD is riding along the 50 sma so far, and that is usually bullish, but due to cycle timing Gold may be getting heavy and could drop into a dcl. Volume is increasing.
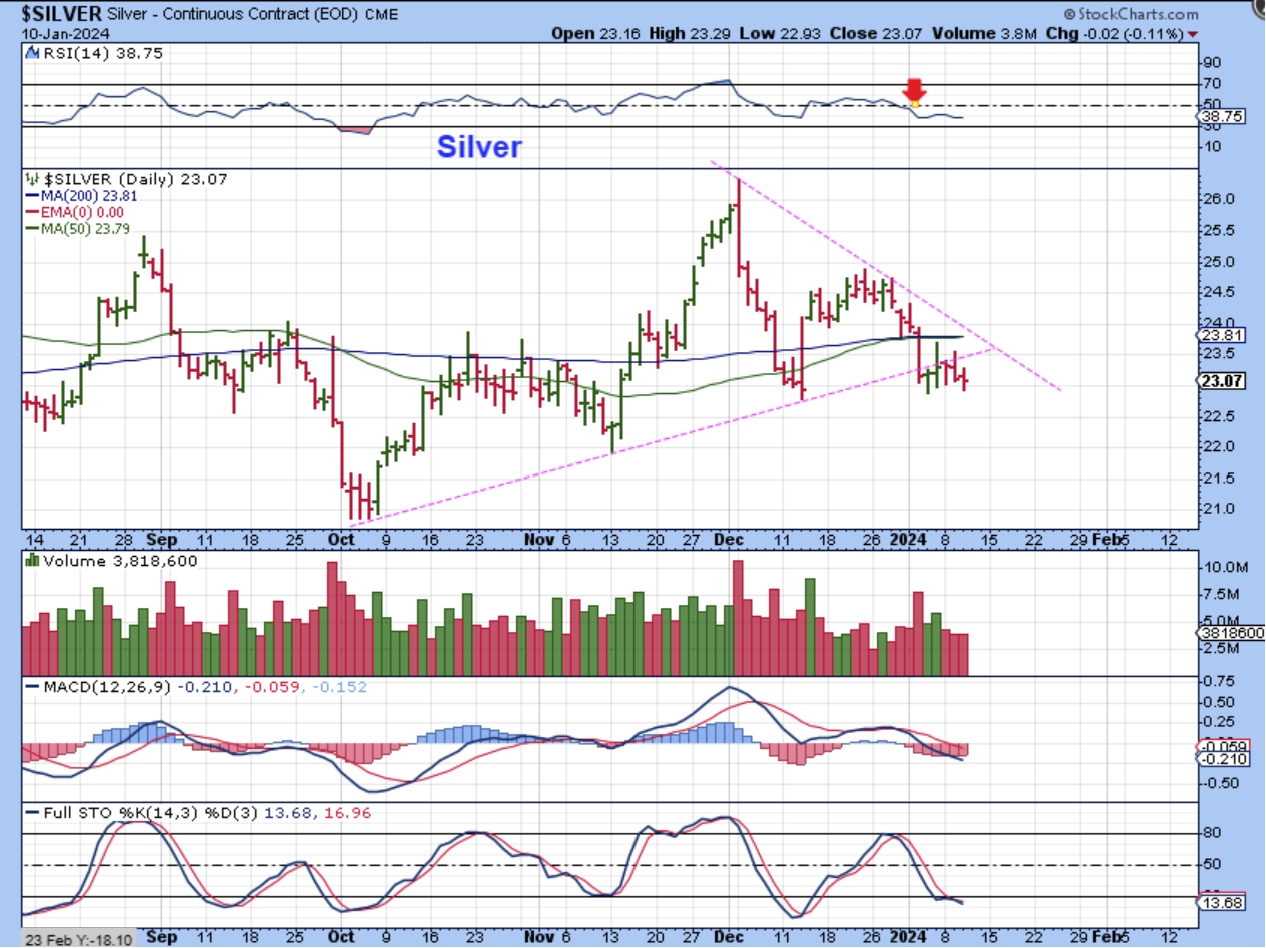
SILVER dropped quickly has been weak for almost 2 weeks now.
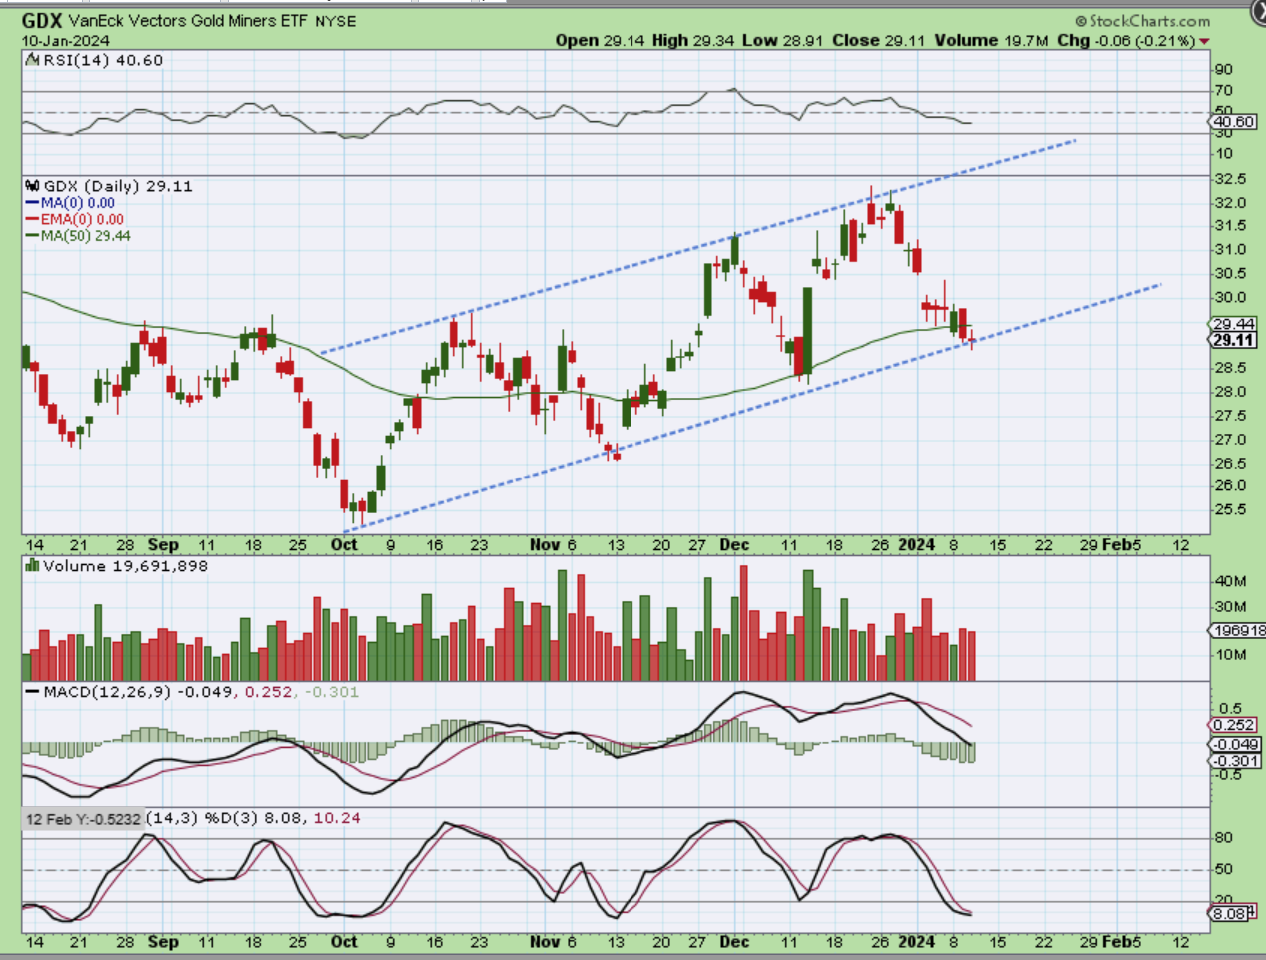
GDX lost the 50sma and volume with the selling has picked up. We could get a bounce, but when this drops into a dcl and then eventually an ICL, it will break prior lows.
.
The General Markets remain bullish, Oil remains choppy, and the Precious Metals sector has been chopping around ever since that exhaustion top in the 2nd daily cycle for Gold. Let me quickly help you to see what I am expecting, since some have asked if the next ICL will drop all the way back to Golds consolidation lows. I do NOT think that it will.
.
It is encouraging to see that Gold and The Miners didn’t just sell off since the exhaustion blow off candle in the 2nd daily cycle. With that POP though, I have said that it would seem that the ‘peak’ is in for this intermediate cycle and Gold will continue chopping around sideways and then drop into the next ICL. The good news is that this price action can build energy for the next attempt at a breakout.
.
So with this chart I drew what I am expecting, and that would be a dcl at the end of this current daily cycle, followed by a choppy 4th and likely final daily cycle into the ICL. In a Bull Market run, these ICLs do not have to be deep sell offs. Please look to the left of the chart and this is what I have been using as an example of that. That sideways chop to the 30 week ma (red line) is made up of 2 daily cycles. I have mentioned in past reports that this is what I would be looking for, and so far this is what we have been seeing.
.
I think that most people will be watching Crypto today, I’ll discuss that below. Enjoy your Thursday trading! 🙂
.
~ALEX
.
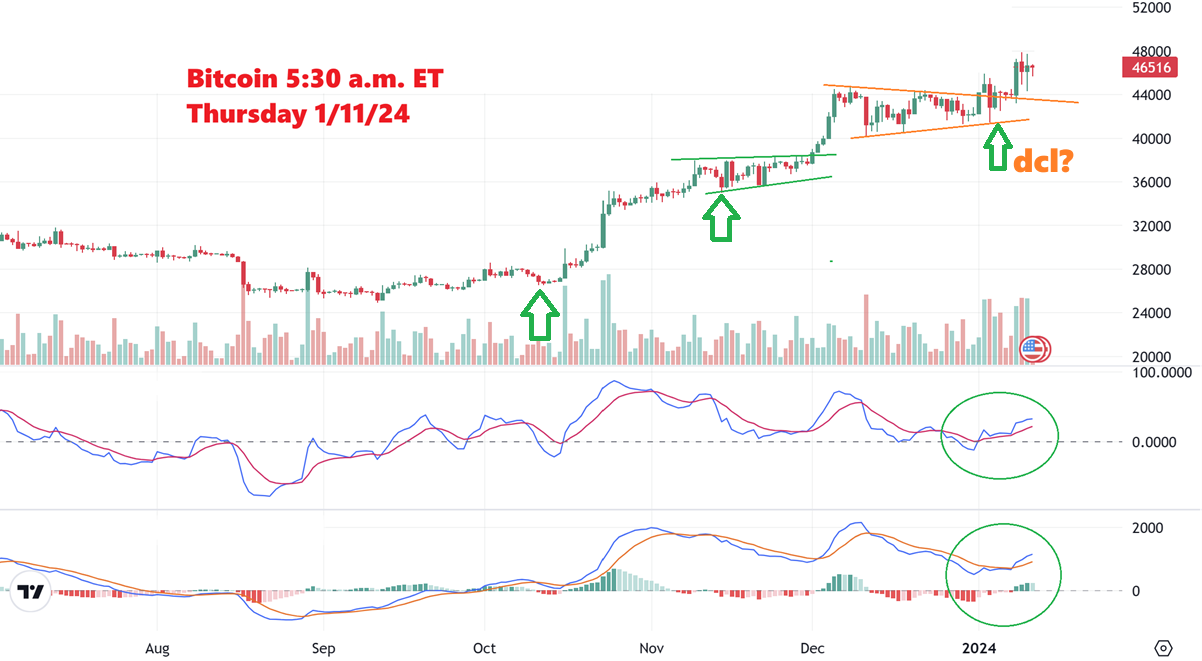
BITCOIN #1:
Bitcoin looked as though it did want to break out on day 55, but it has also been giving us a little pop and drop. Since that looks like a pop on day 55, I mentioned that we could see a dip into the day 60 area (give or take few days) as the normal timing for a dcl. That said, I have also mentioned another way to possibly view what is happening…
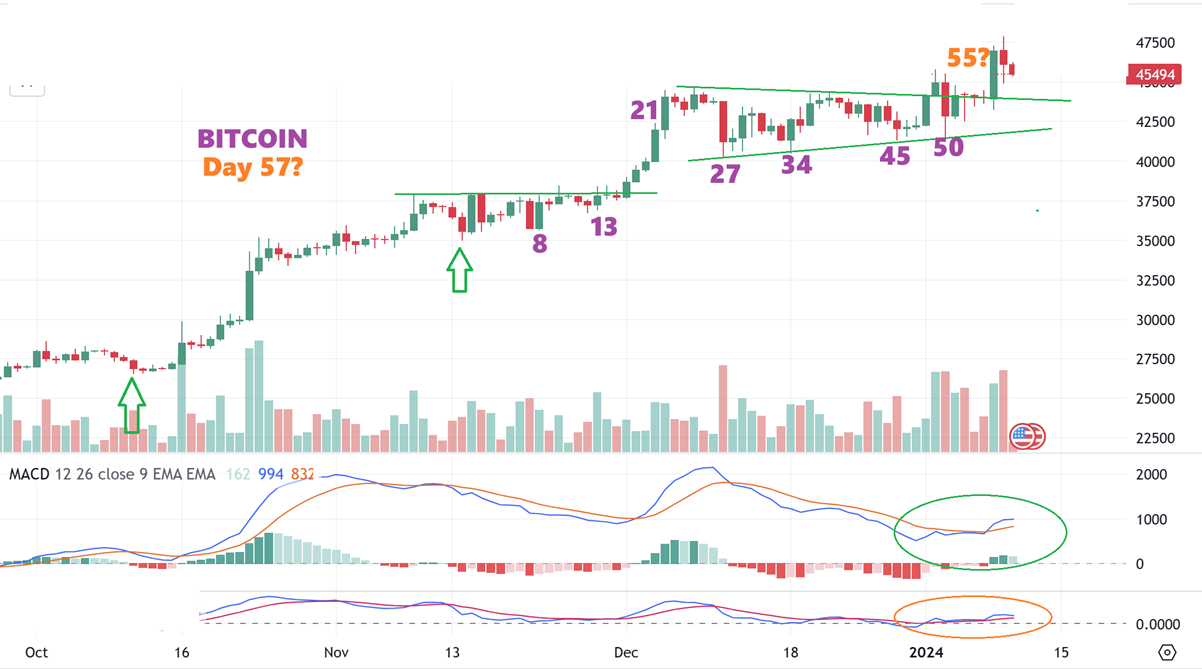
BITCOIN #2 – When Gold consolidates in a triangle or wedge pattern during a stronger rally, I have noticed that the next dcl’s form in a stealth or hidden manner. The dcl is actually in place without a big drop and the breakout starts the daily cycle count. Is that happening here? Well, yesterday after the breakout, Bitcoin dropped and bounced back (like a back test), so I drew that here and posted it in the comments. IS THAT IT for a dcl? It could be, especially if this rallies out of the ‘approval’ for ETFs.
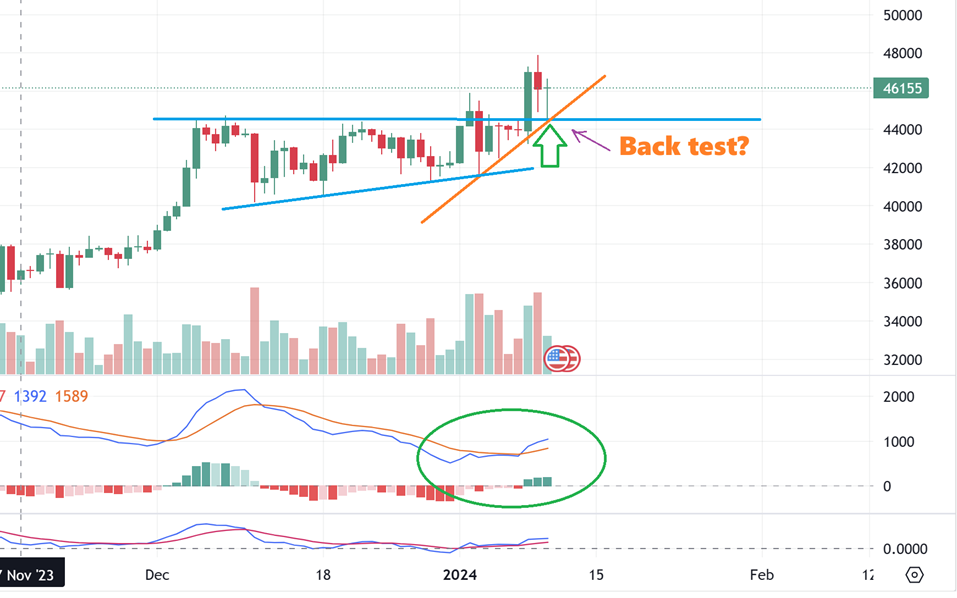
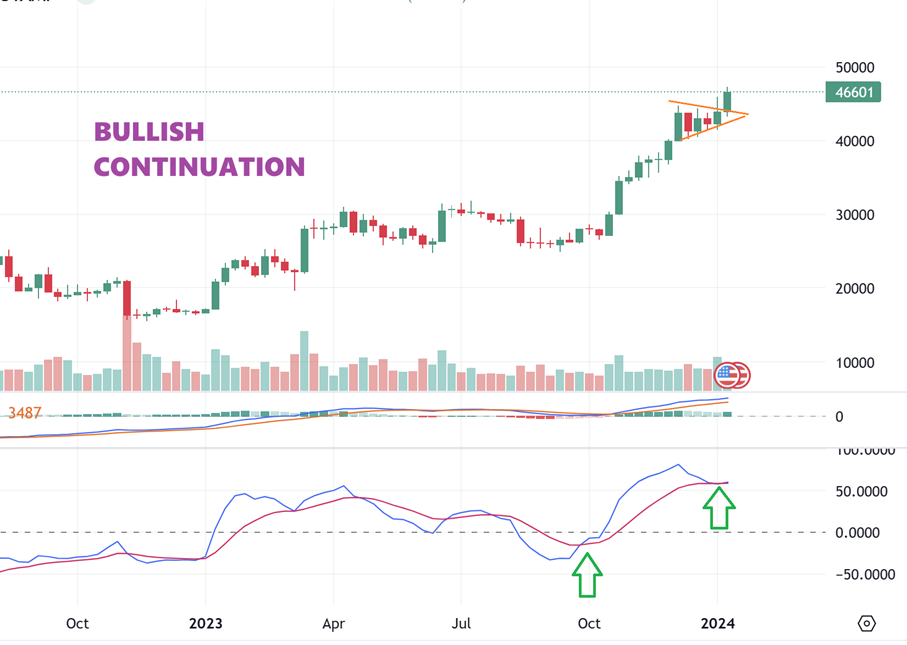
BITCOIN#3: I used this chart to mention that we now also look to have a weekly breakout and this could be a ‘continuation’ of the prior run before that consolidation took place. I was thinking that we might get the ‘SELL THE NEWS” pullback with the ETF announcement, and that could lead to a day 60+ DCL. With this weekly chart breaking out though? If this isn’t a false break out, I don’t want to sound silly but it could have a stealth dcl and I mentioned that Bitcoin could run to $60,000+, with this as a form of a midpoint consolidation.
BITCOIN live 5:30 a.m. Eastern Time: This is Bitcoin after that approval, and so far we are seeing a ‘stall’ in price action.
1. If this DOES have a stealth dcl, we should continue higher over time, but also
2. If you scroll back up to Bitcoin chart #1, you’ll see that the breakout was day was day 55 of the cycle count, so we could actually be on day 58 and a short ‘Sell the News’ dip could give us the real next dcl around day 60, or 62, or 64.
These are the 11 Spot Bitcoin ETFs. You may wish to write them down as an easier way to invest in Crypto.
.
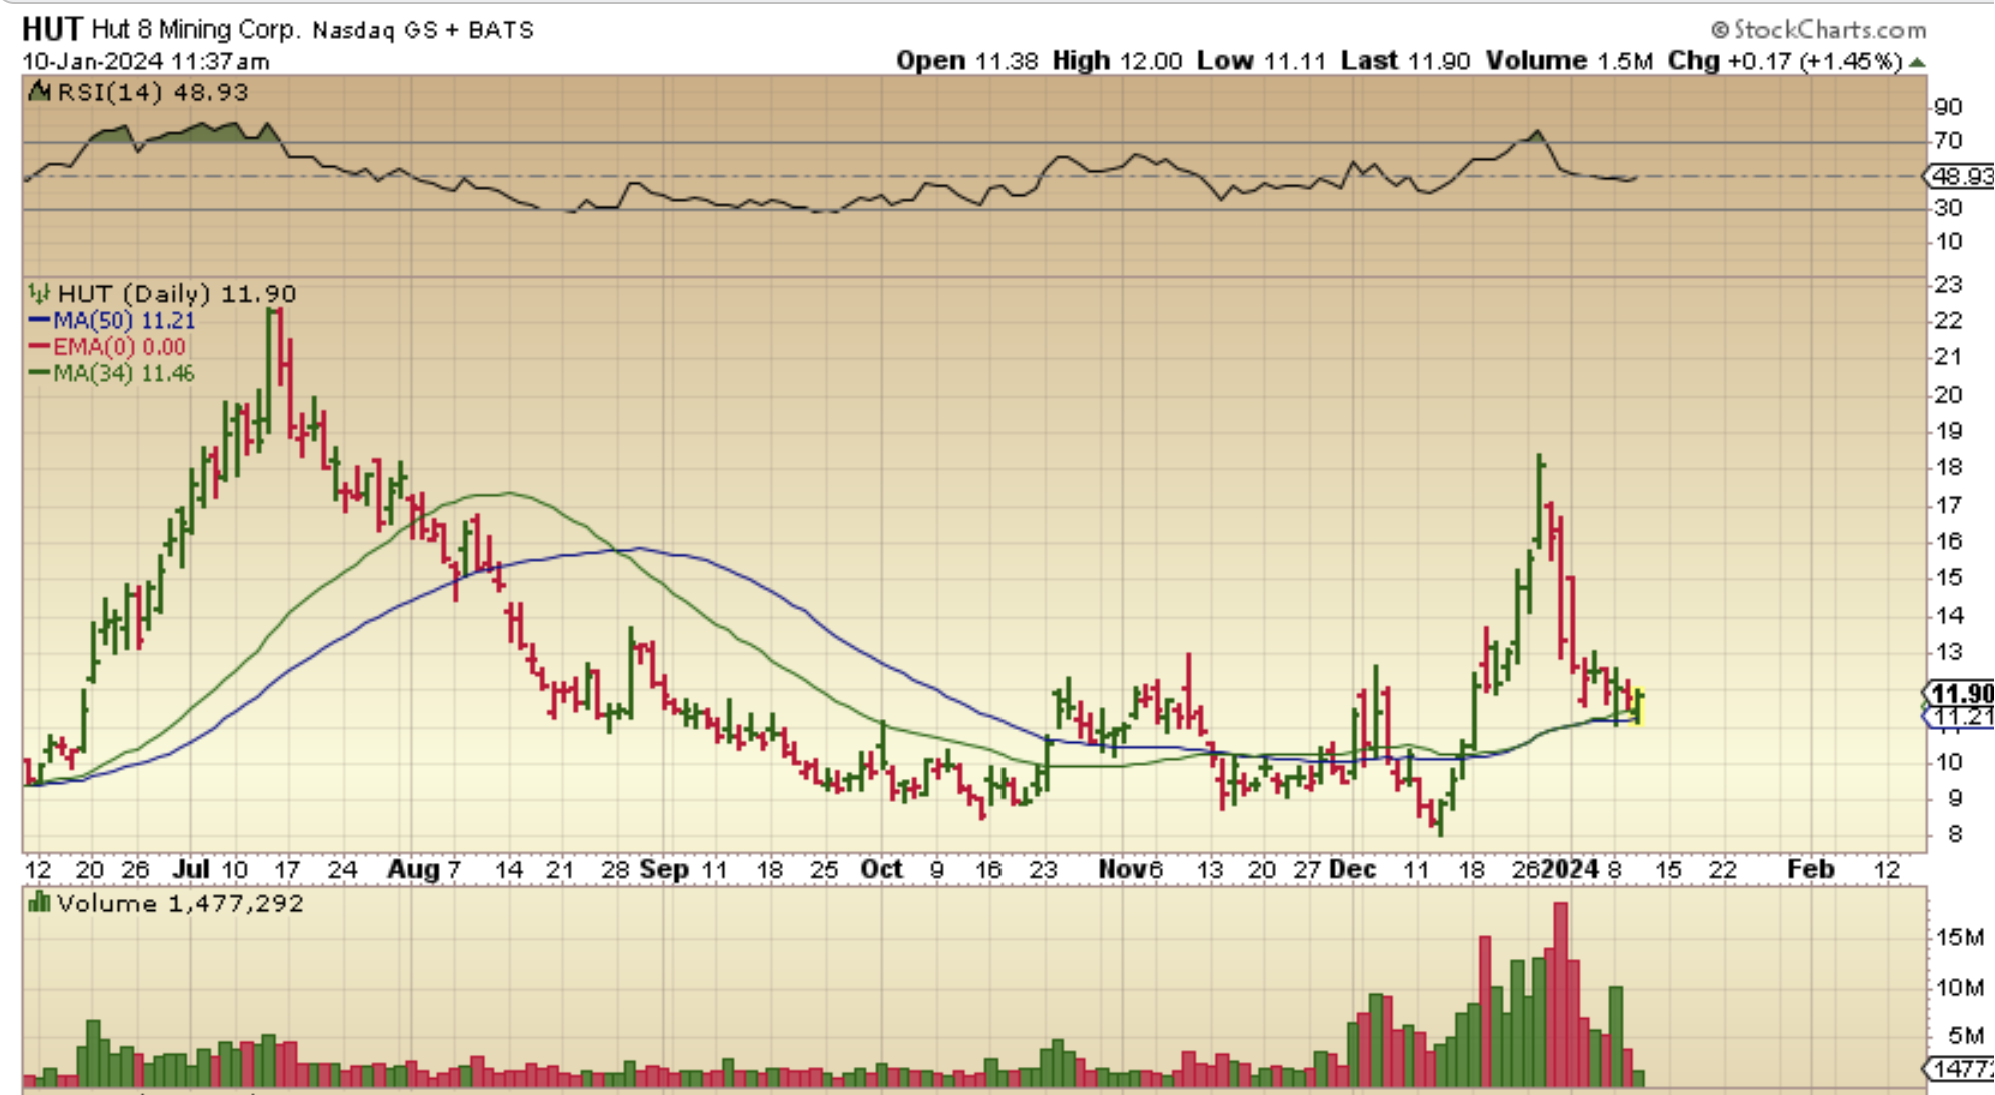
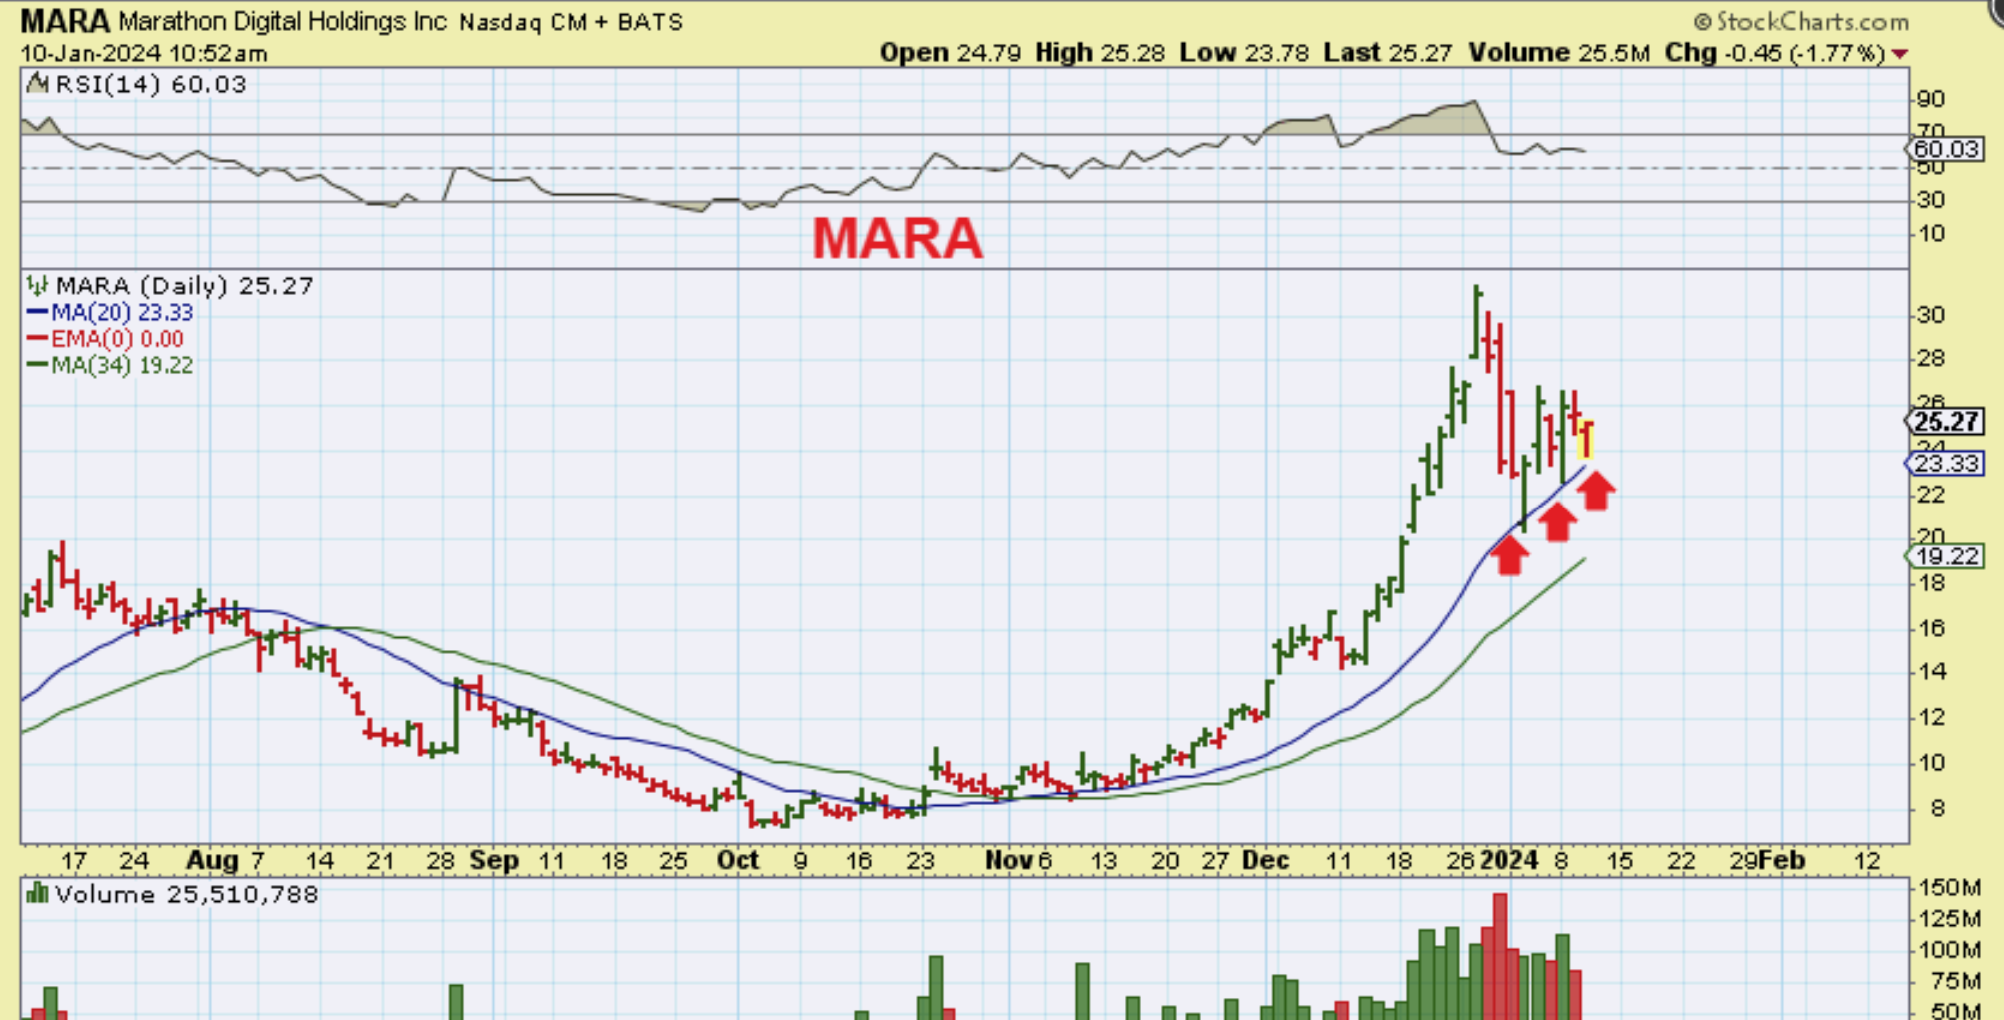
Yesterday I was showing how many of the Crypto related stocks were setting up as possible ‘buys’ at support. You could buy them and use a stop, but of course there was risk if these stocks gapped down after the approval. SO far they look ready to gap open higher as of 6 am.
.
HUT was reversing at the 34 and 50sma, so a position could be taken with a stop if it fails. As you can see though, these move so much, that would still be a drop from $12 to $11.46 or $11.21 , so it’s difficult if you don’t buy it right at support.
MARA has been climbing up along the 20 sma, so I pointed out this reversal while it was still red.
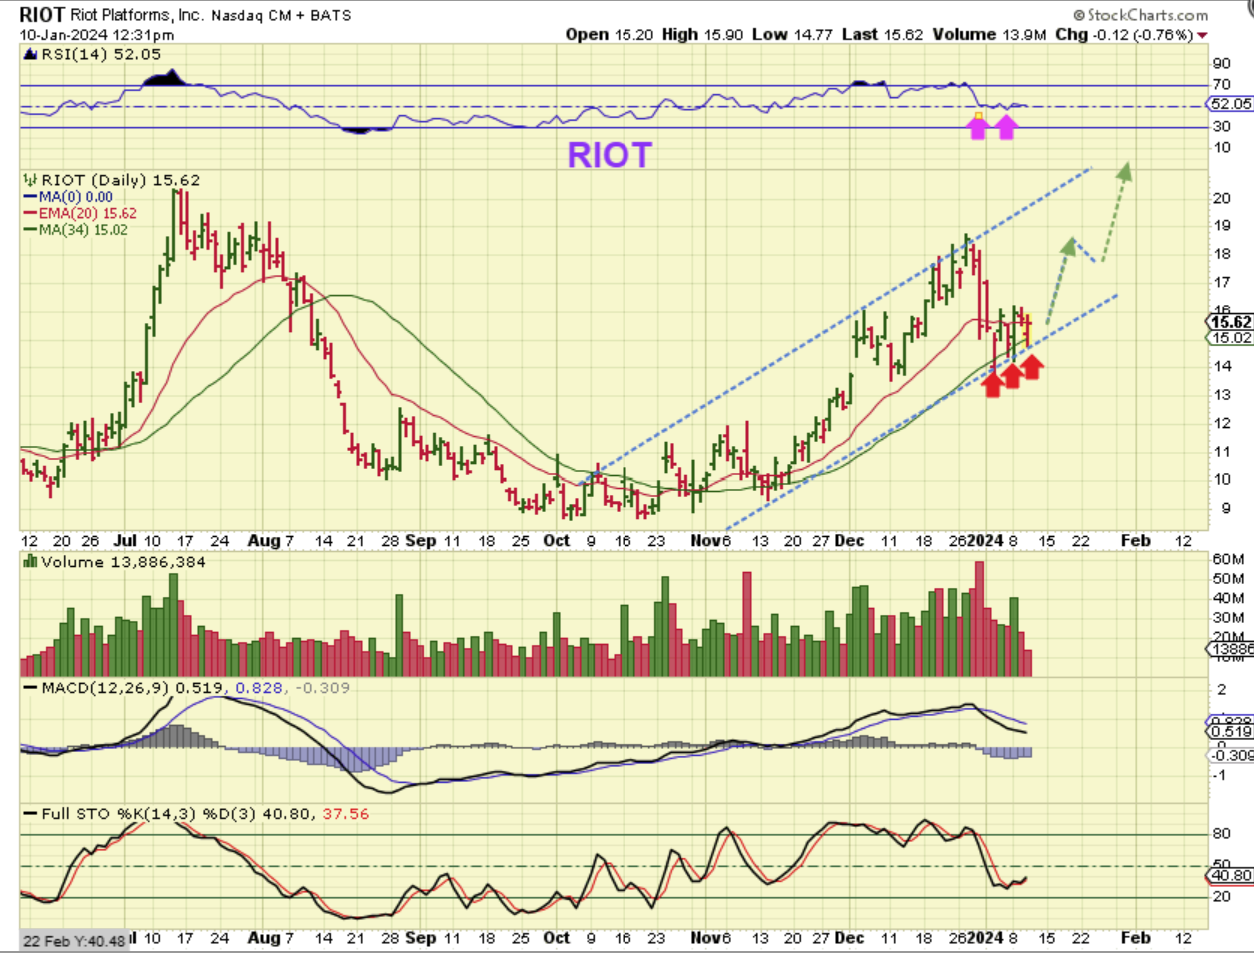
RIOT chopped along the34 sma as the recent lows, and I drew an upward sloping channel that shows how RIOT could put in a strong run if it follows this channel.
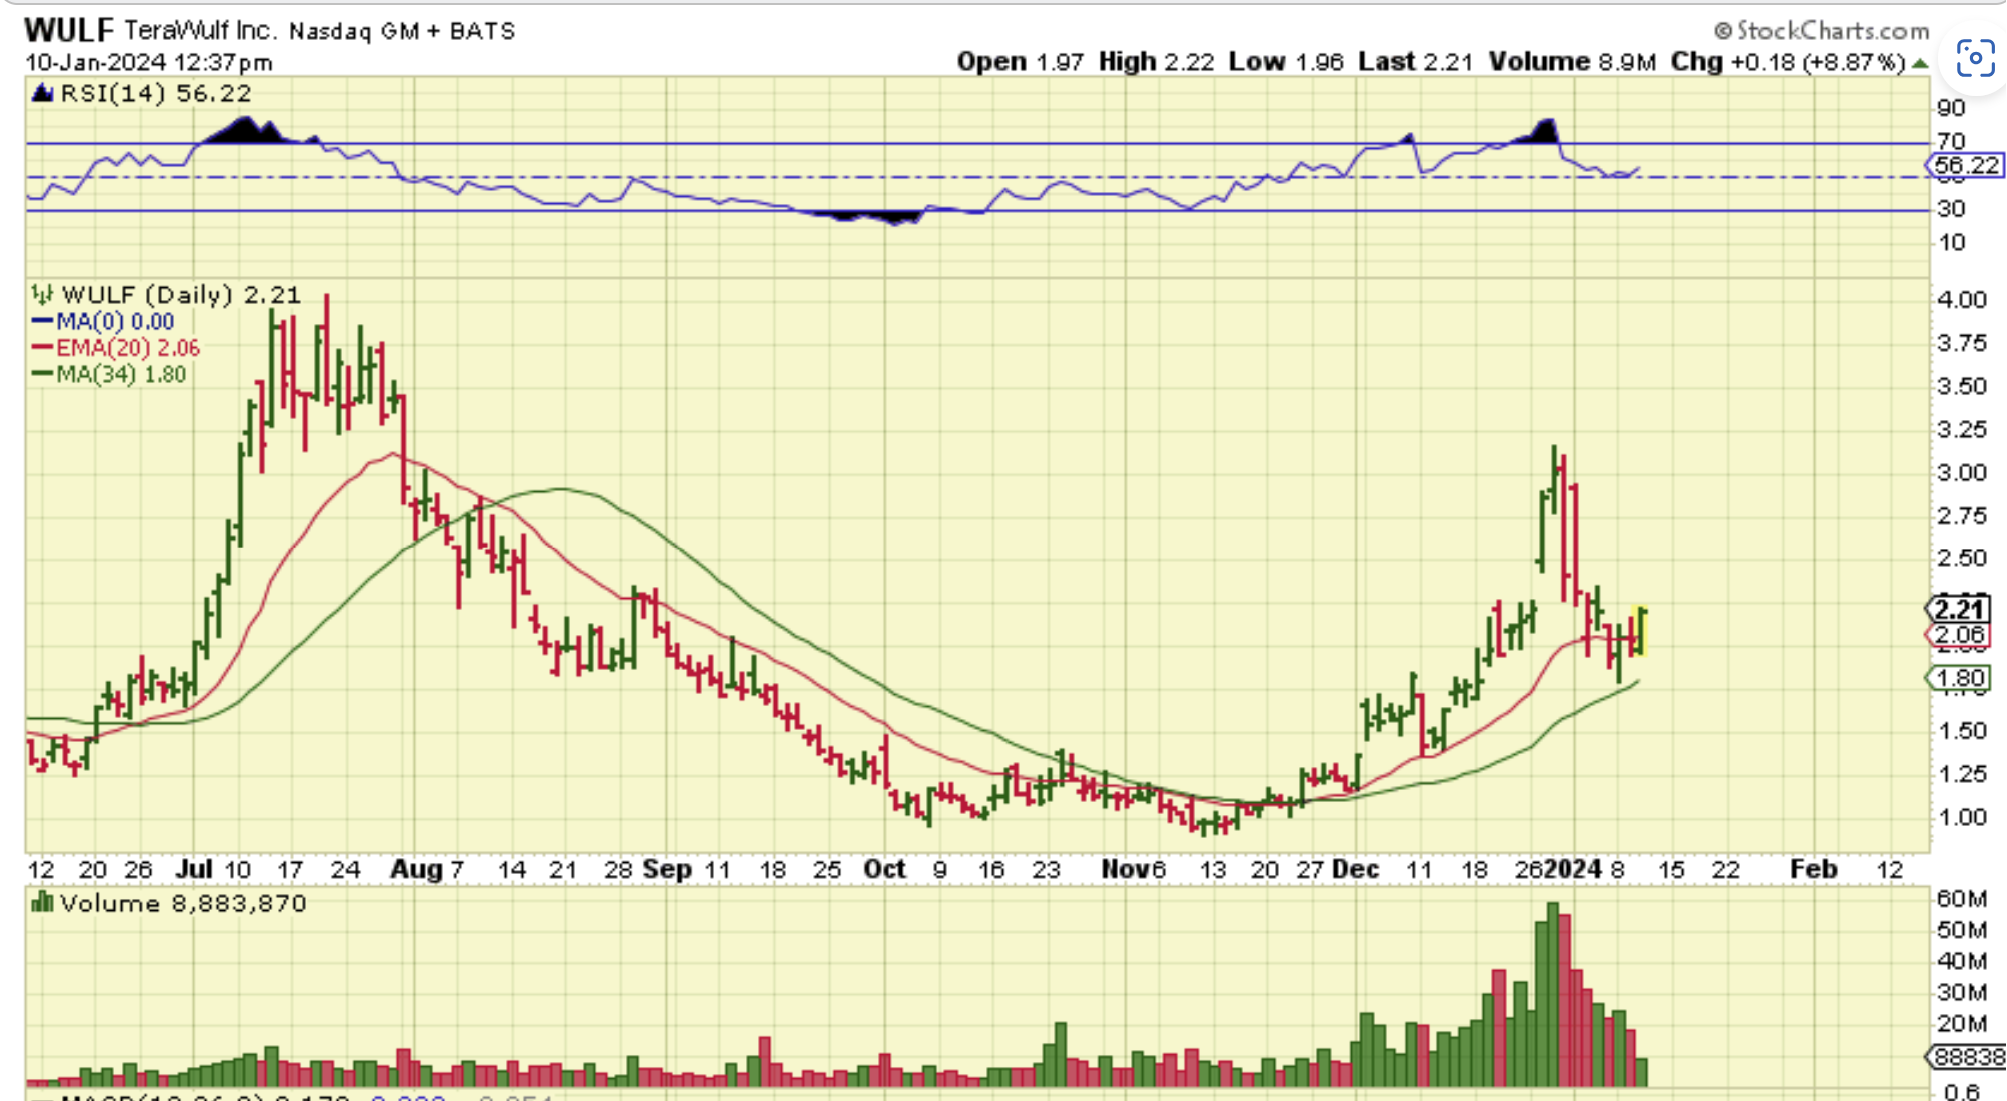
WULF also reversed at the 34 sma area and has been trading around $2 again. This could easily double under the right conditions.
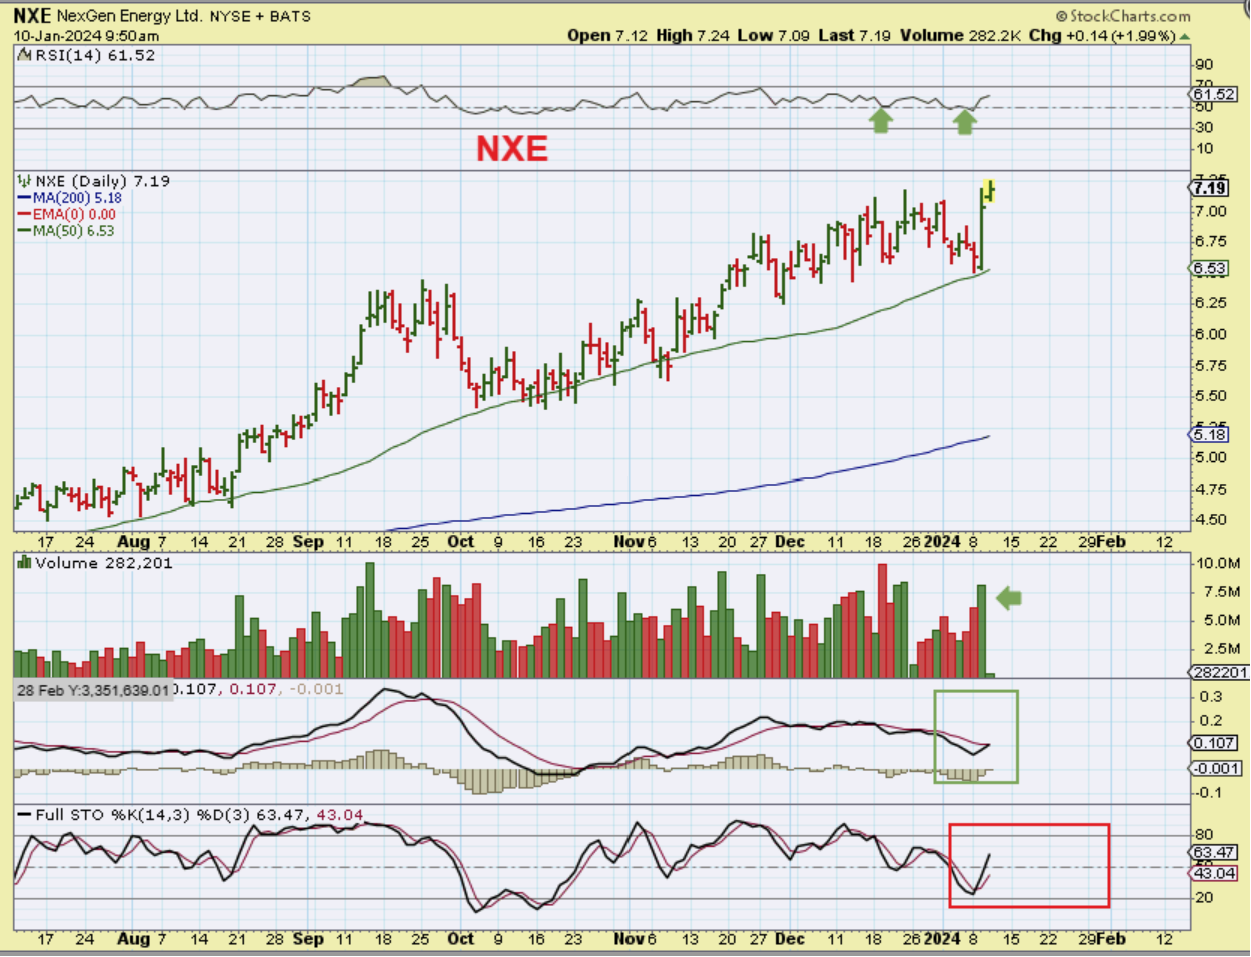
I saw Uranium Stocks Pop 2 days ago, so I posted a couple of charts. Yesterday they gapped open, closed the gap, and stayed in this price area, so they can still be bought. Let’s look at a couple (See also UUUU, URG, UEC, CCJ, NXE, DNN, etc).
.
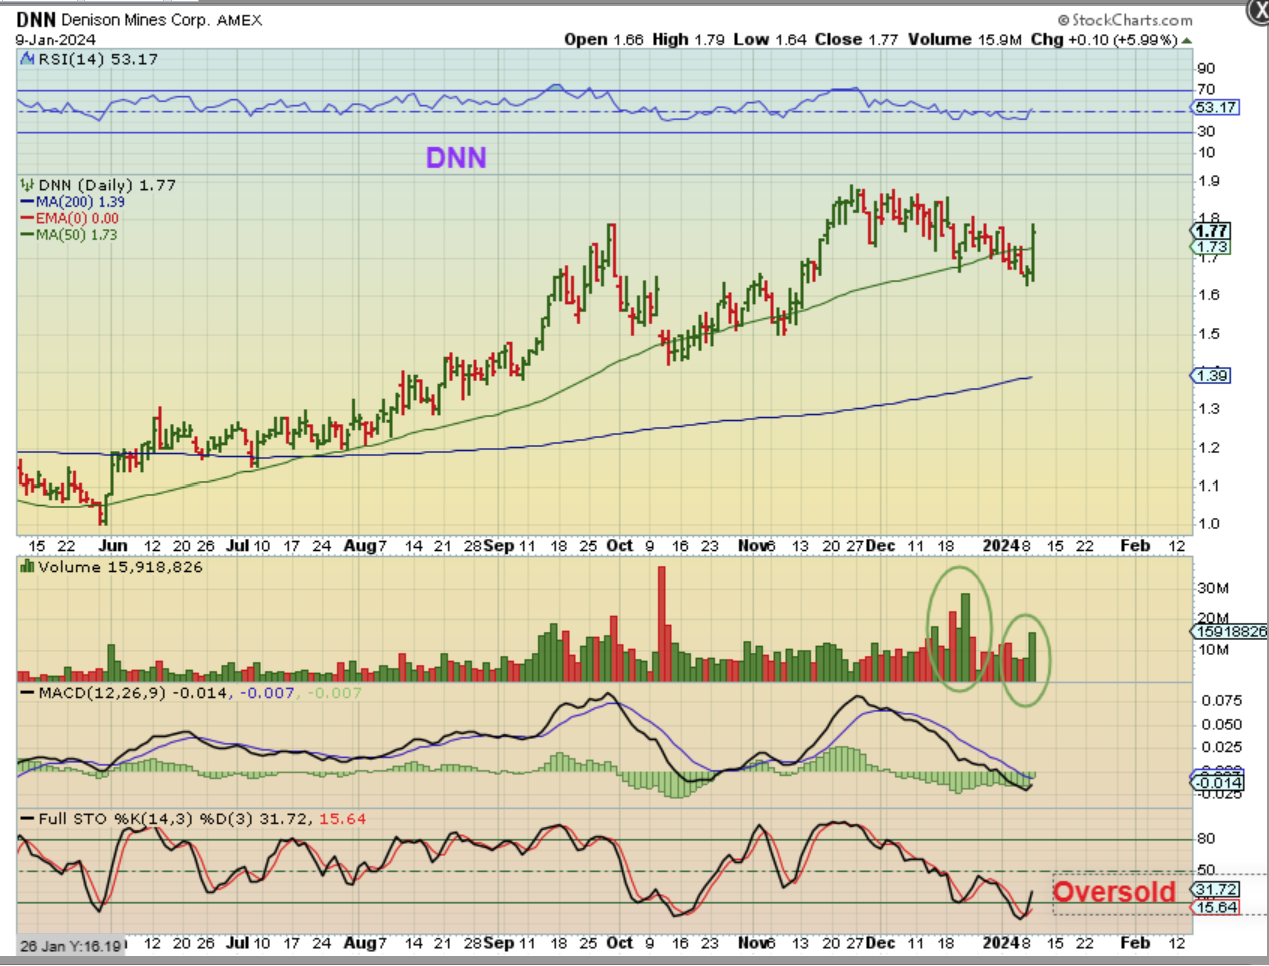
DNN pushed higher on Tuesday, so I posted this. On Wednesday it popped and dropped…
.
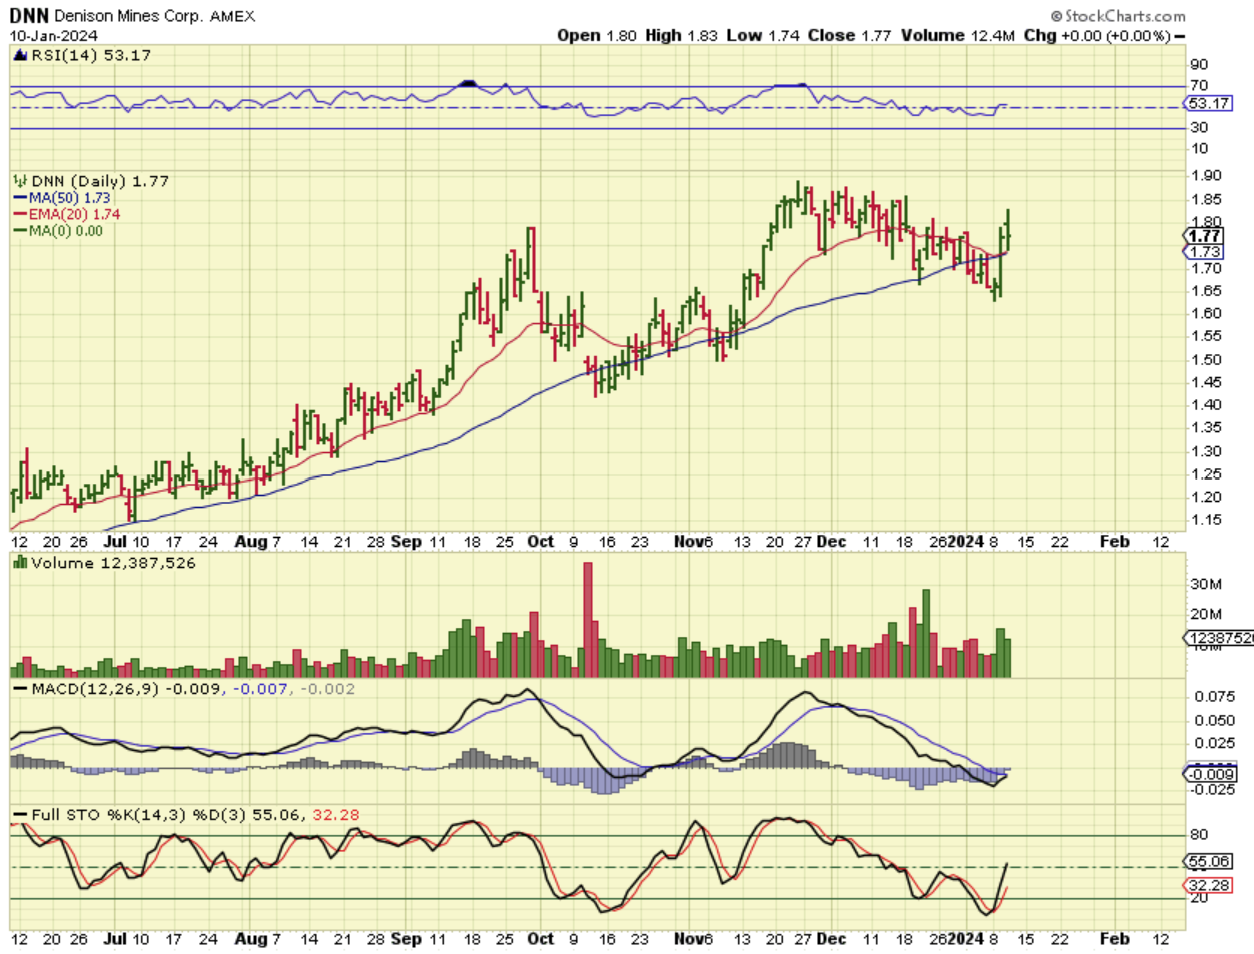
On Wednesday DNN (& a few others) popped and dropped, and this landed back on the 50sma and bounced, so this can still be bought.
.
NXE shot up off of the 50sma on Tuesday & started to move higher Wednesday. It actually closed in this area, so it is also buyable, since these look ready to break and run higher.