January 7th Weekend Review – A Little Pullback
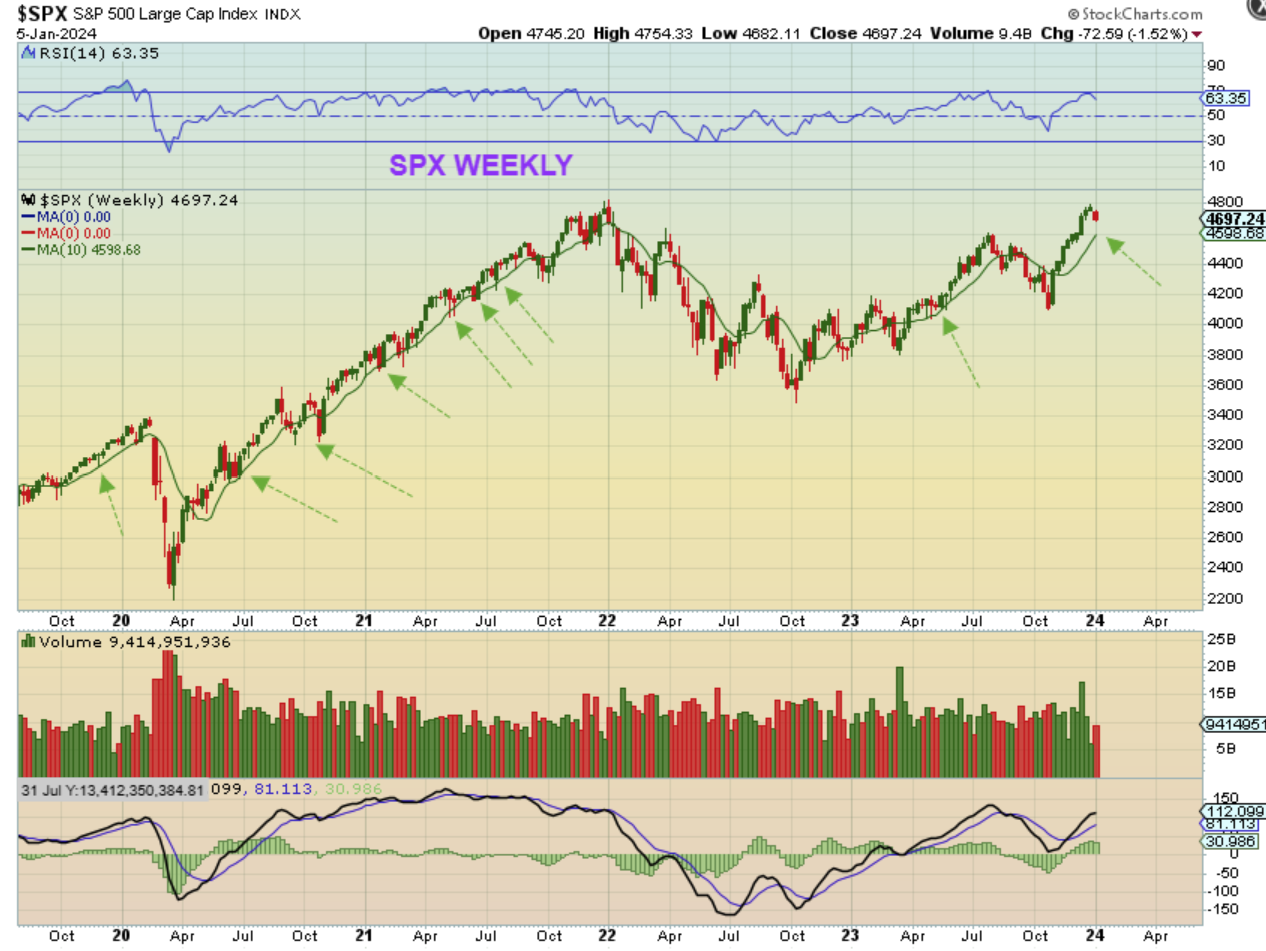
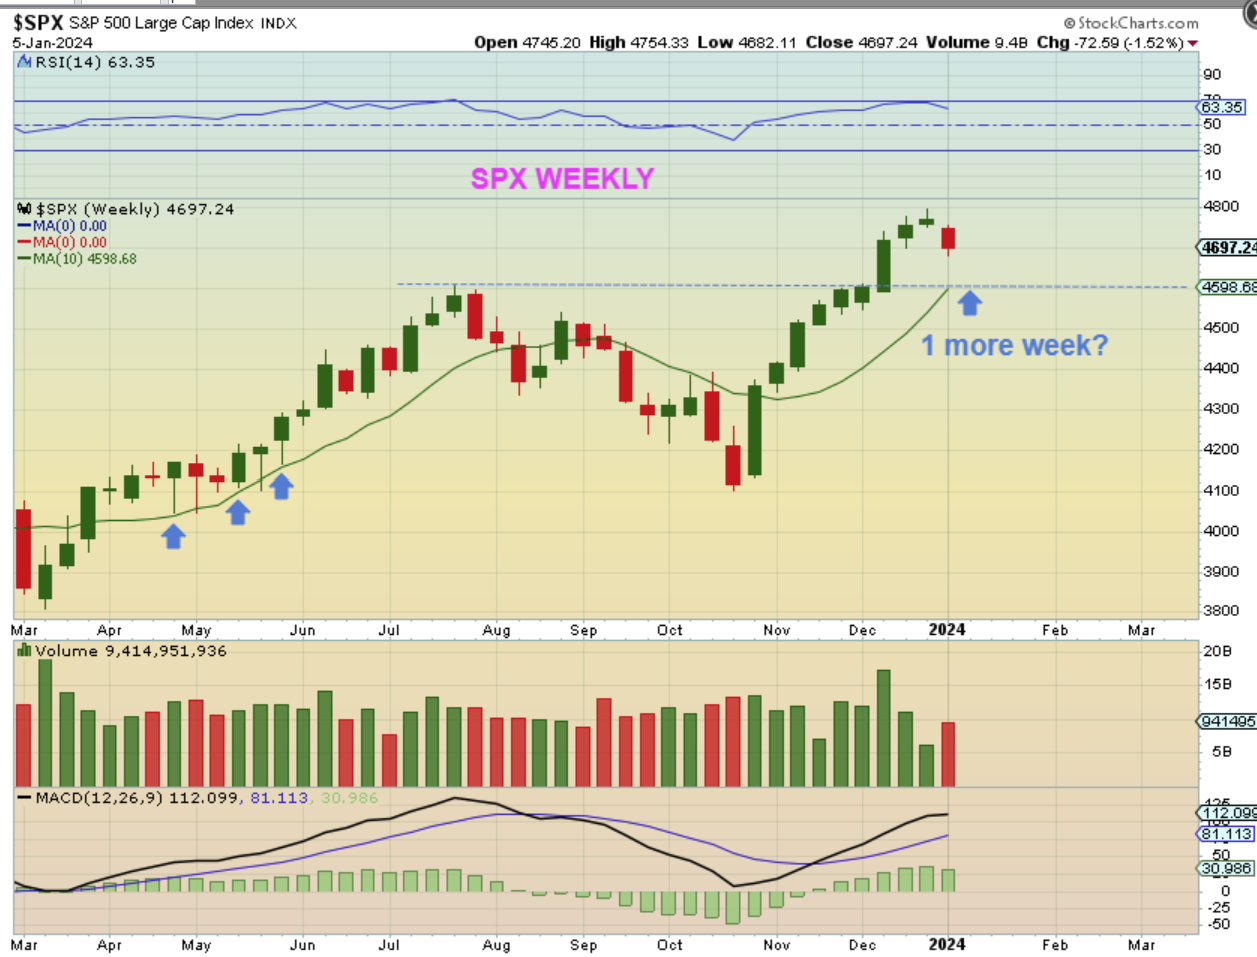
SPX WEEKLY – After 8 straight weeks higher out of an ICL, I’ve been expecting a pullback and it started right on time with the first week of 2024. Looking at past dips, we see that a dip to the 10 week ma was quite common, so I would say that we should expect a little more downside.
.
SPX WEEKLY – A tag of the 10 week ma is also a back test of the breakout. Let’s take a look at the daily too.
.
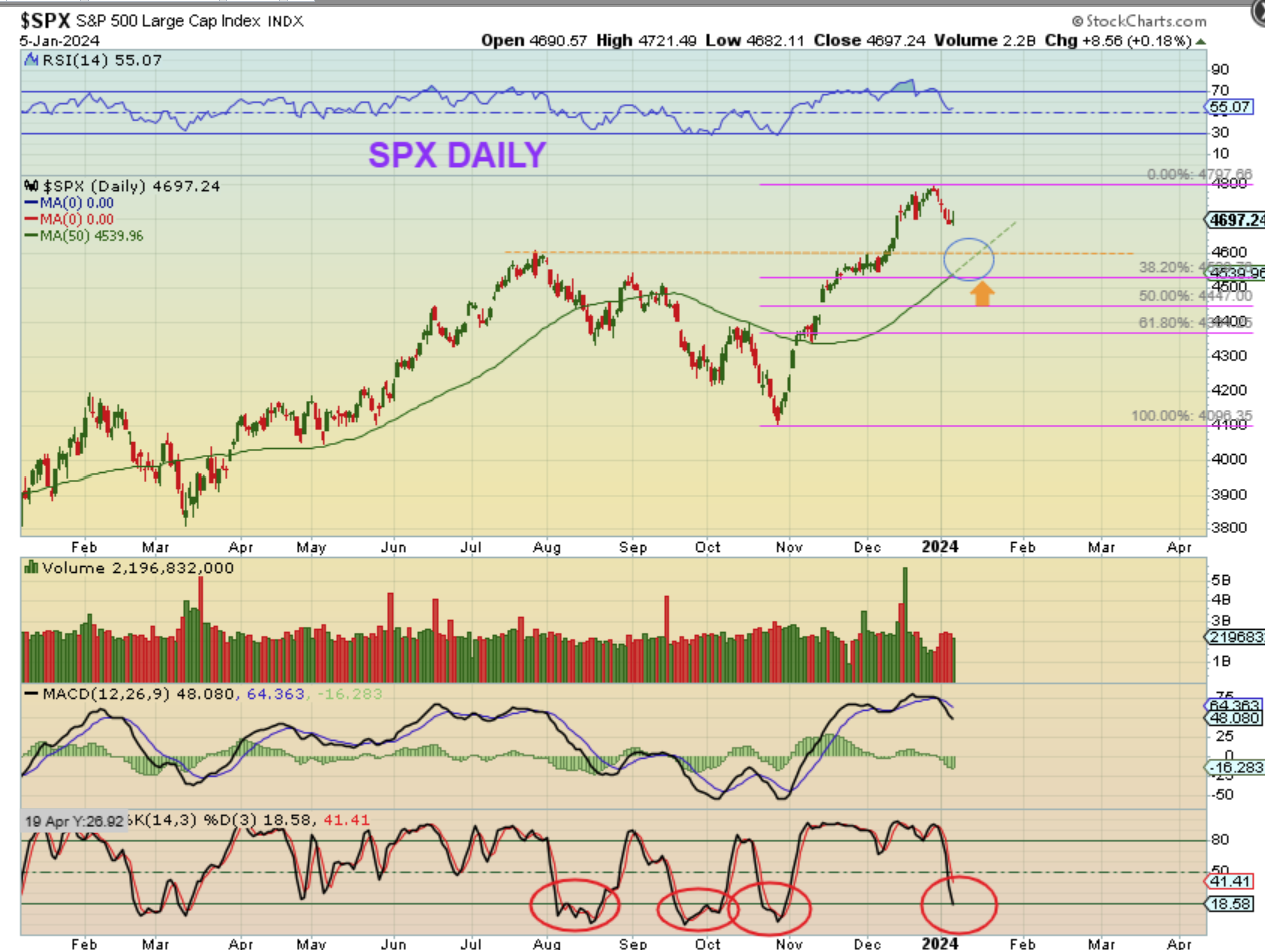
SPX DAILY – Even though a swing low can form at any time, I still think that a drop to the circled area would be more of a normal dip into a dcl. We have the 38% fib level, the 50sma, and the breakout above the July highs. We are almost oversold.
.
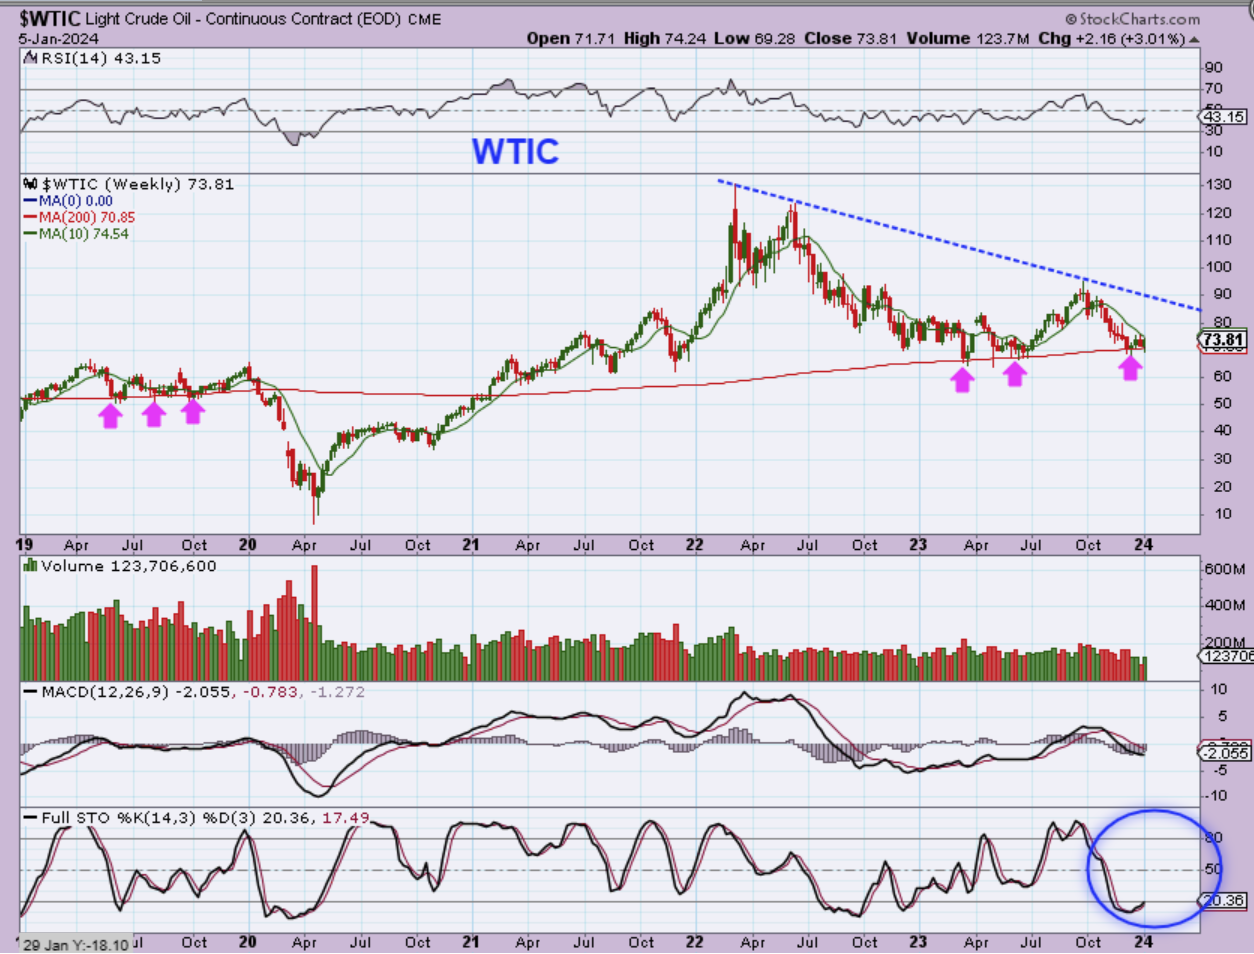
WTIC WEEKLY – Oil is trying to bottom here, but it does remain choppy. Oil is oversold on a weekly basis too, so it really should be able to bounce.
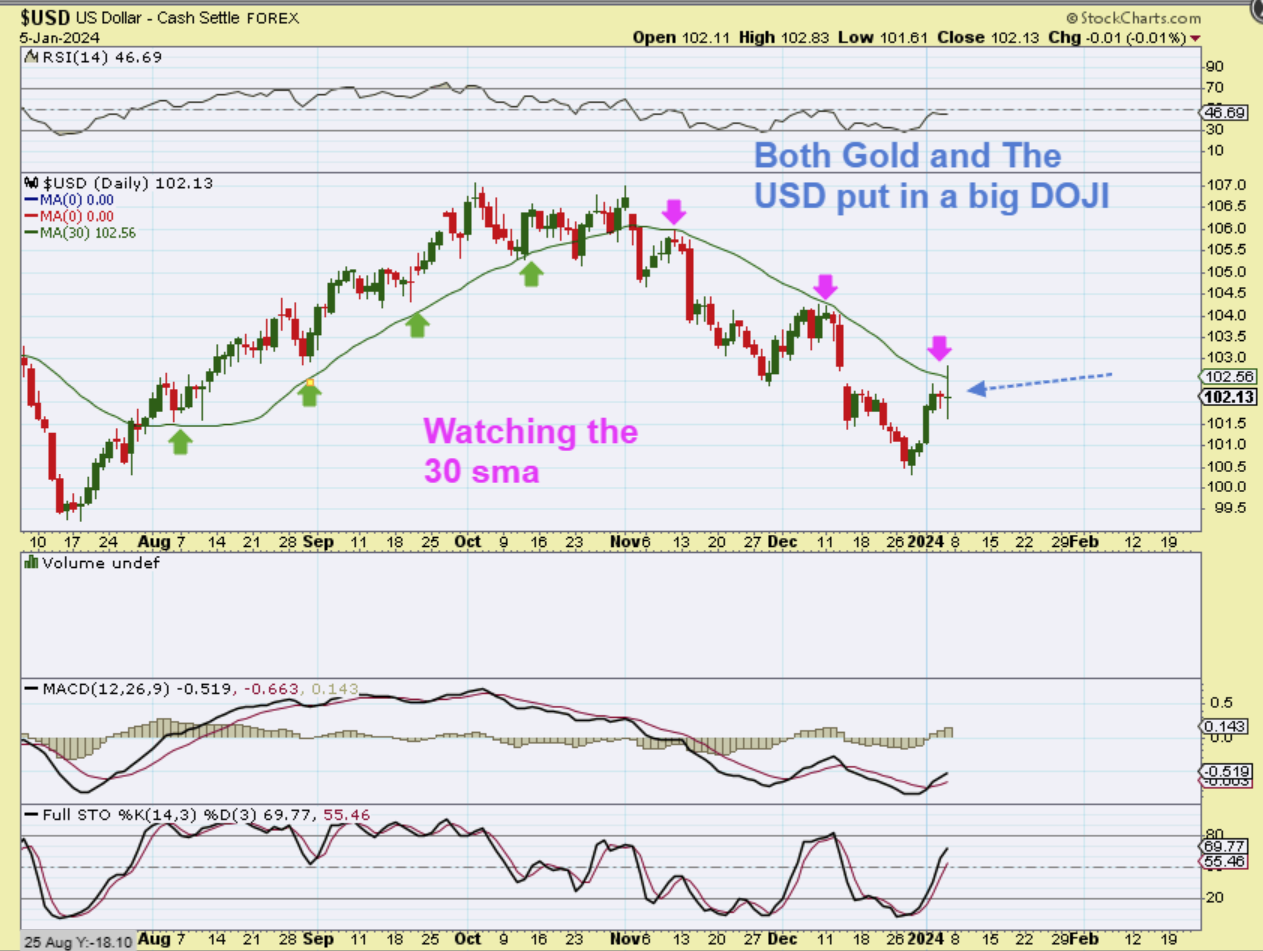
USD DAILY and the Gold daily chart both put in large ‘Doji’ or ‘indecision candles’ on Friday. I was away from the markets on Friday, so I didn’t see what, if anything, caused this price action, but the USD was rejected at the 30 sma again so far, and that is where the USD peaked on its last bounce.
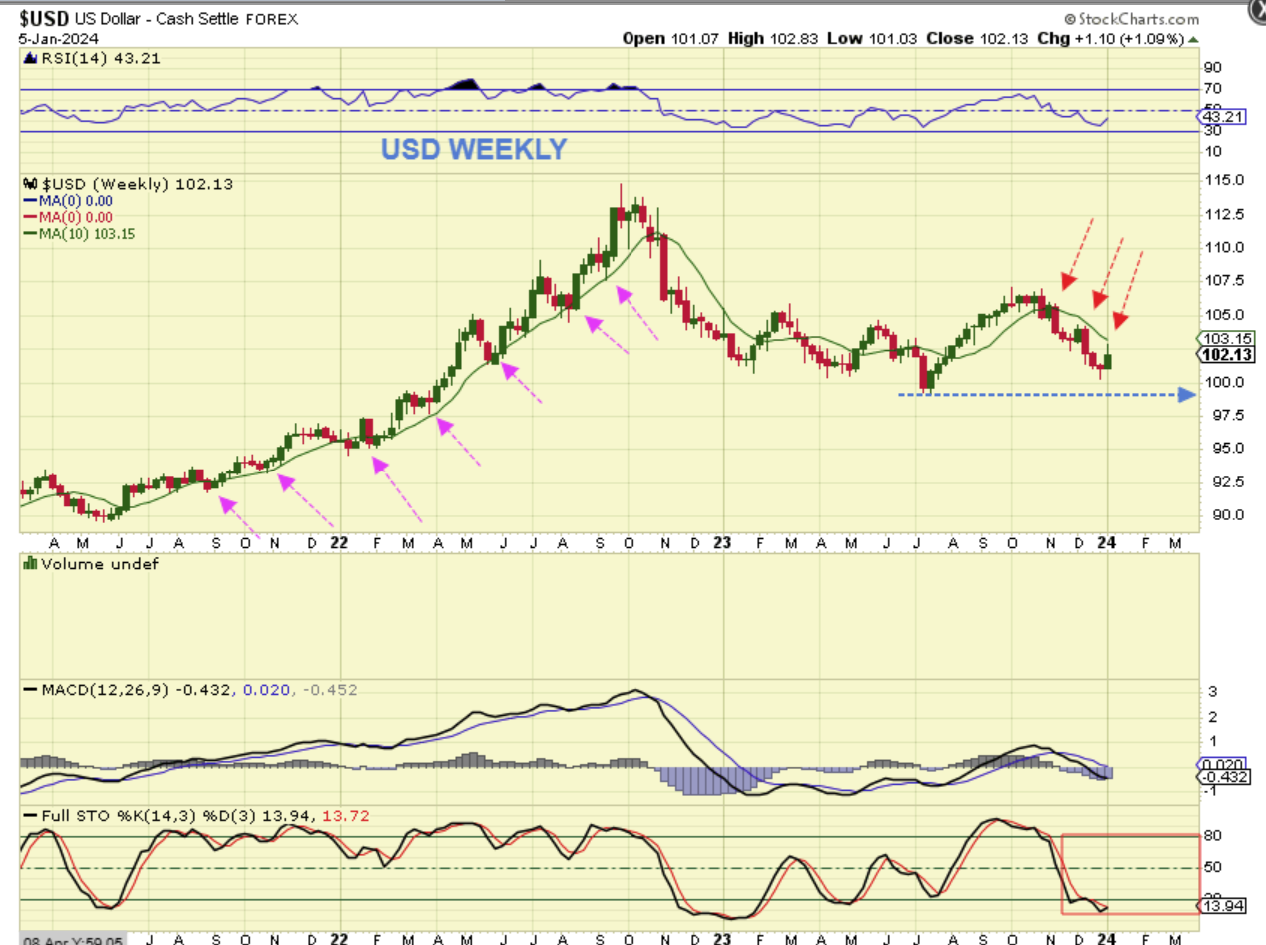
THE USD WEEKLY
1. Was also rejected at the 10 week ma, so it is possible that the USD rolls over and breaks below the July lows. This would push Gold higher.
2. It is also noteworthy that The USD weekly is oversold and if it successfully gets above the 10 week ma, we may have an ICL as higher low. That would mark the 3 yr cycle low as the July ICL, likely 6 months early due to the large rapid rate hikes by the Fed. That was a strong rally in July to October.
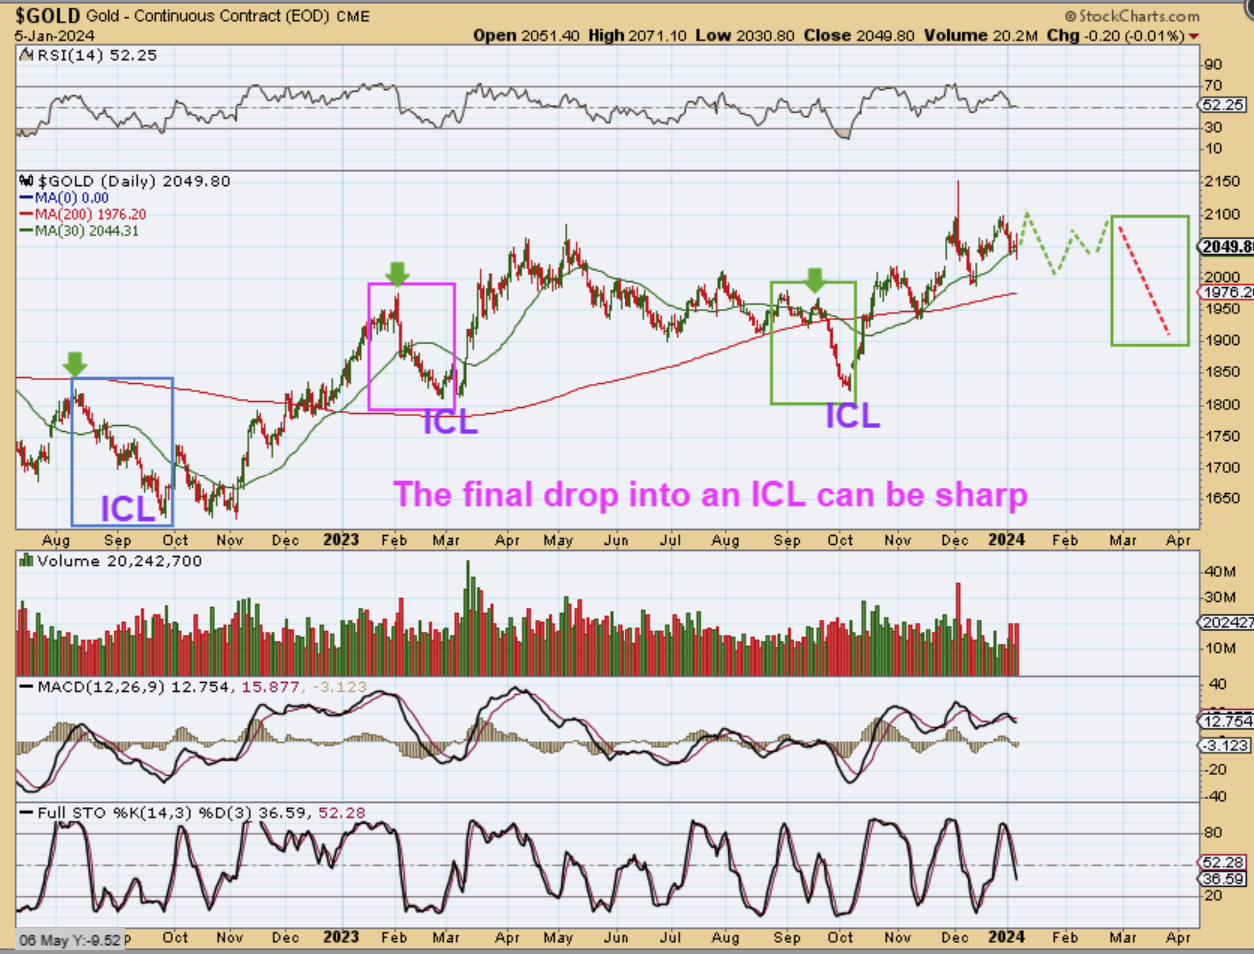
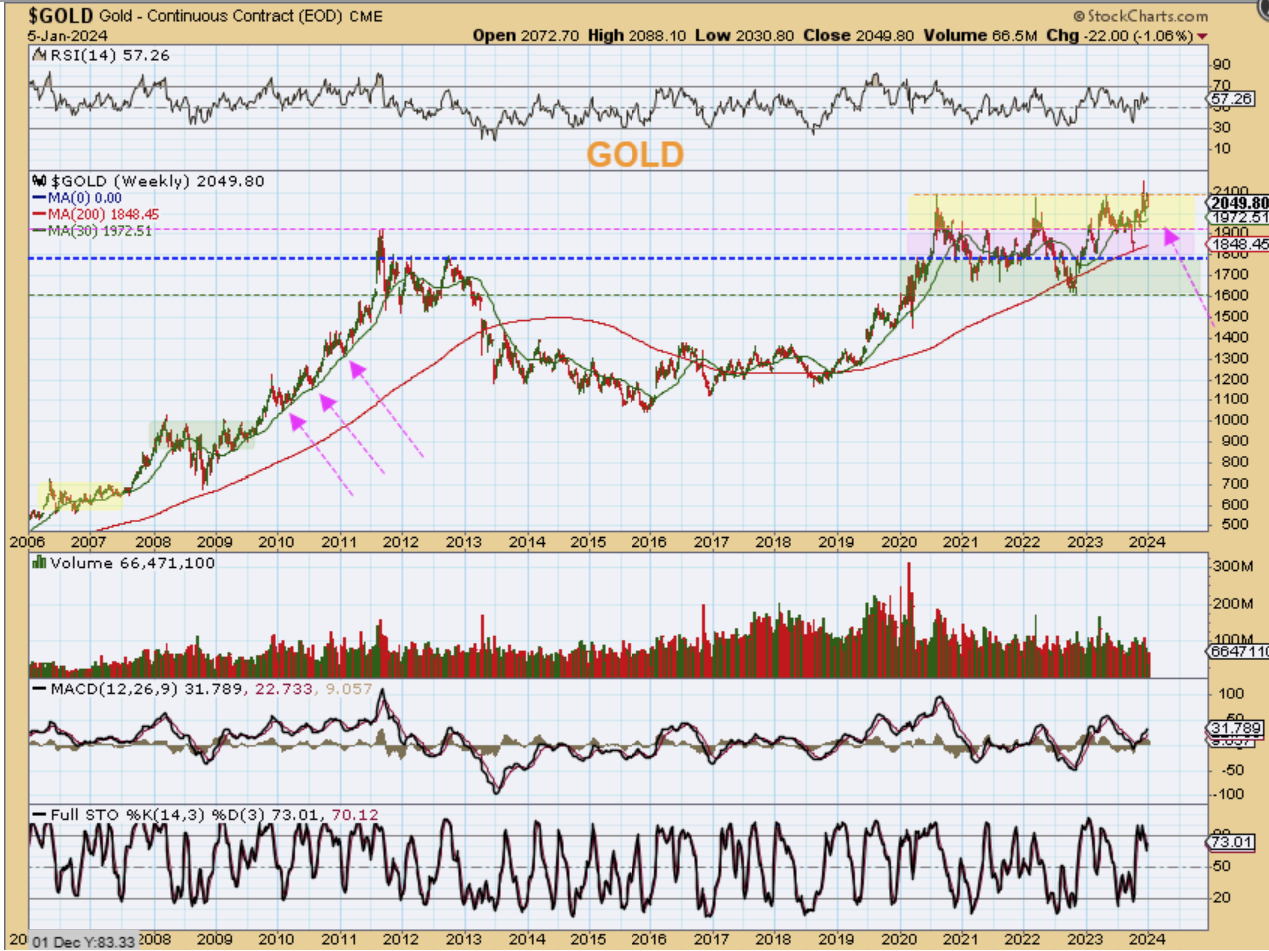
GOLD DAILY – I think that the blow off exhaustion candle for Gold likely was the peak for the intermediate cycle. That means price could run up to test that high, but would not be likely to break out higher. I have drawn a choppy toppy pattern and then a drop into a higher ICL. Please read the chart and decide whether you want to hold Miners through that or not. It can be painful on a daily basis.
THE GOLD WEEKLY CHART is a long choppy consolidation pattern at the highs. ICLs have dropped to the green line (30 week ma) during the 2009-2012 and the 2019-2020 bull run, so we may drop there over time. Notice that Gold remains slightly overbought on a weekly basis.
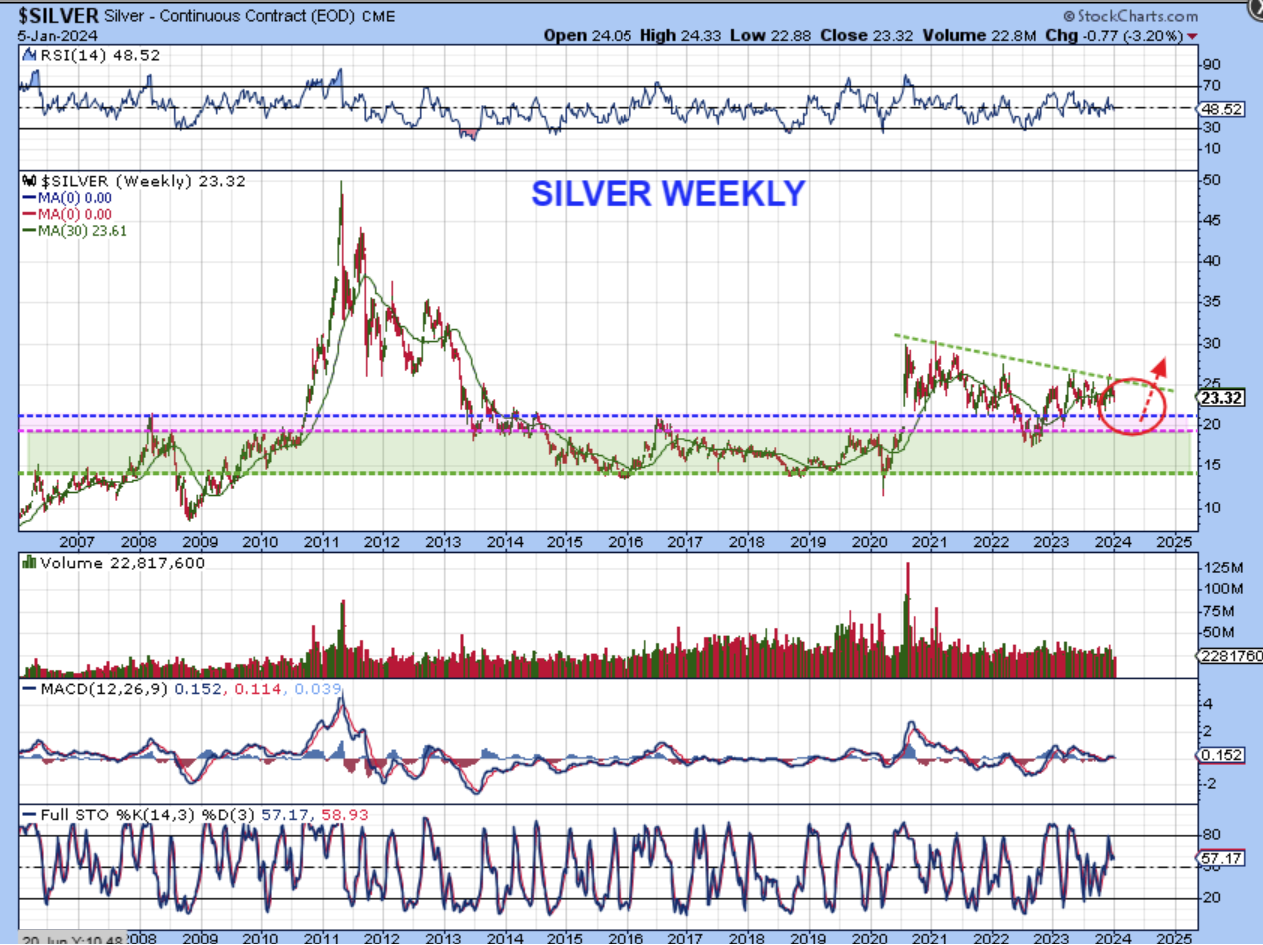
SILVER WEEKLY – I have been pointing out this multiyear choppy sideways consolidation and a drop to the purple area should be expected when an ICL comes due. Then we could get a breakout that could lead to large gains.
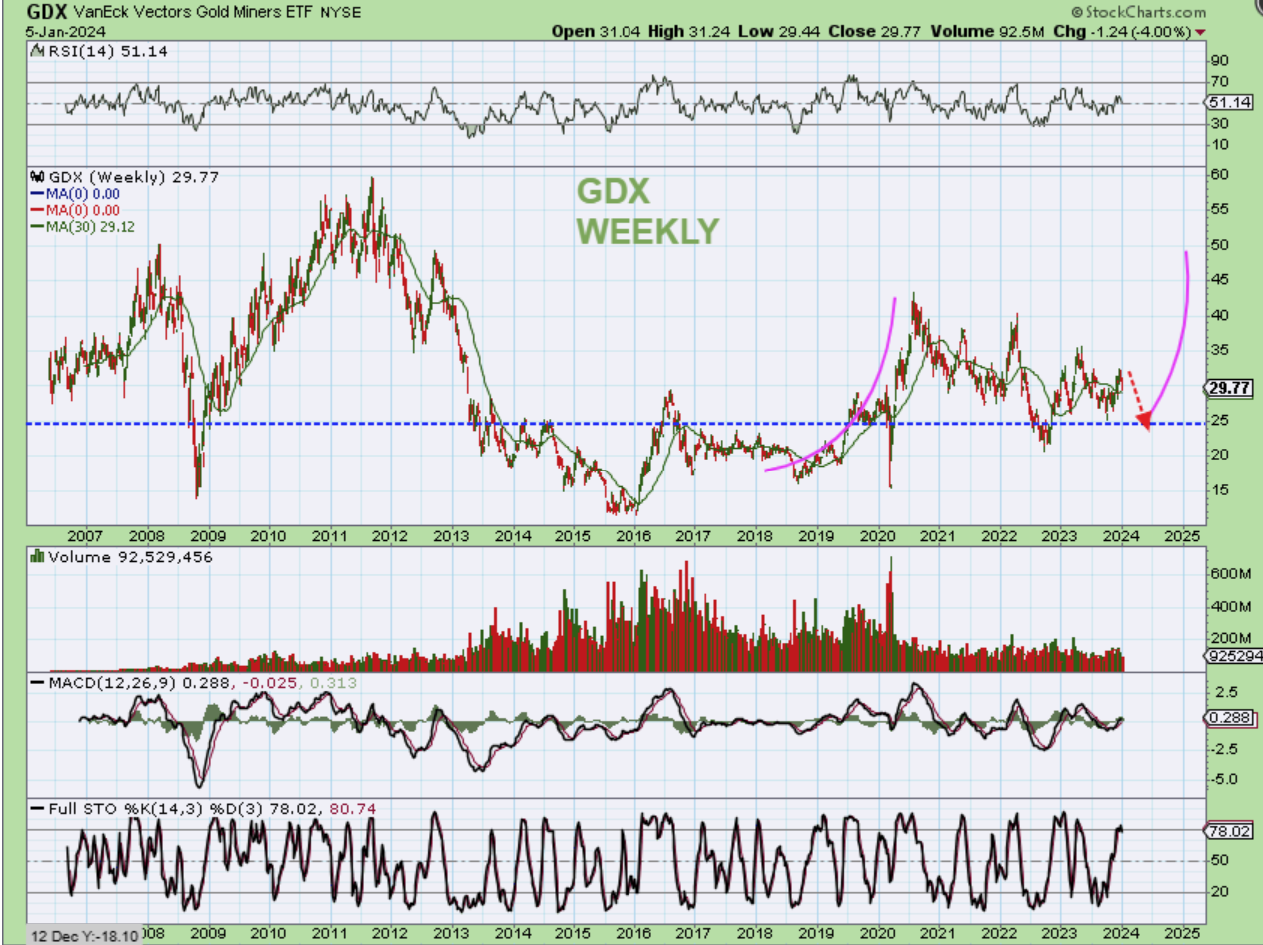
THE GDX WEEKLY CHART is actually somewhat similar to Silvers recent sideways price action. Over time we would expect a dip into the next ICL and then hopefully we see a real breakout with follow-through.
.
Last week was a little boring, since we had a pullback in the General Markets and other areas were choppy. Unfortunately, we may see the same kind of price action for one more week, or at least the first part of next week. We could see a reversal by the end of the week. These dips make for boring days, but they offer nice buying opportunities when they reverse and start to move higher, lifting the stocks in bullish sectors with them. A little more time and we should be ready to go. Hope all are having a great weekend!
.
~ALEX
.
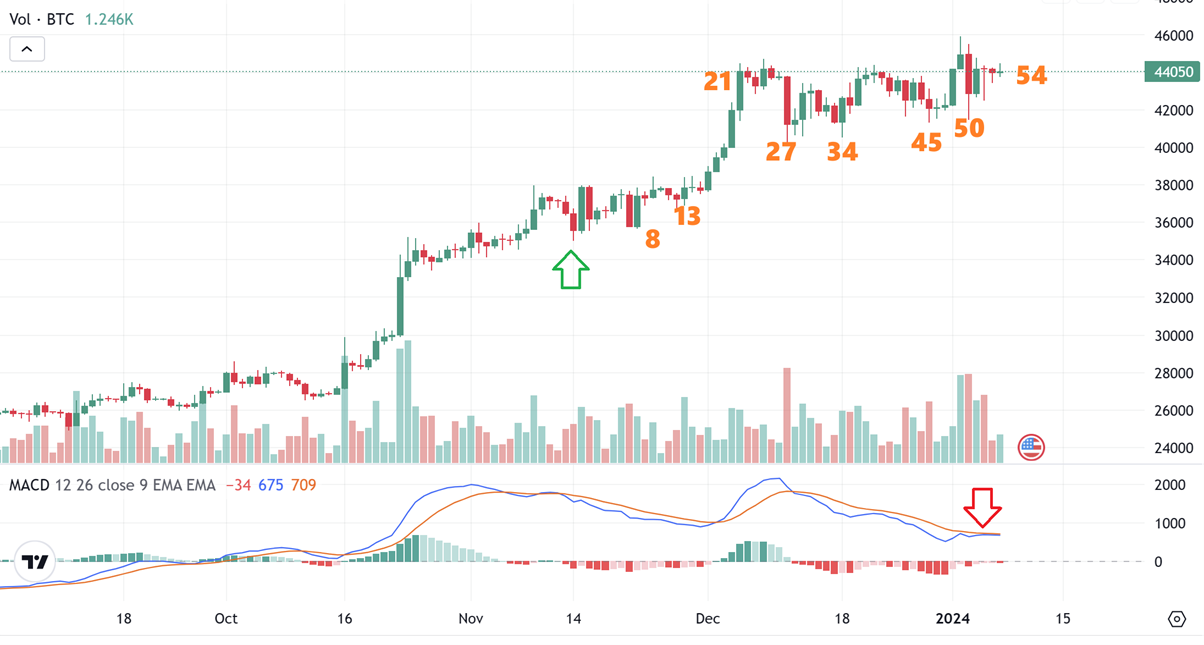
BITCOIN – We usually see a dip into the 60-day time period, and with Sunday being day 54, that dip really might start on any day. If Bitcoin does drop lower, the Crypto stocks often fall sharply, so a buying opportunity may present itself. I will be covering this sector in the daily reports.