January 1, 2024 Weekend Report
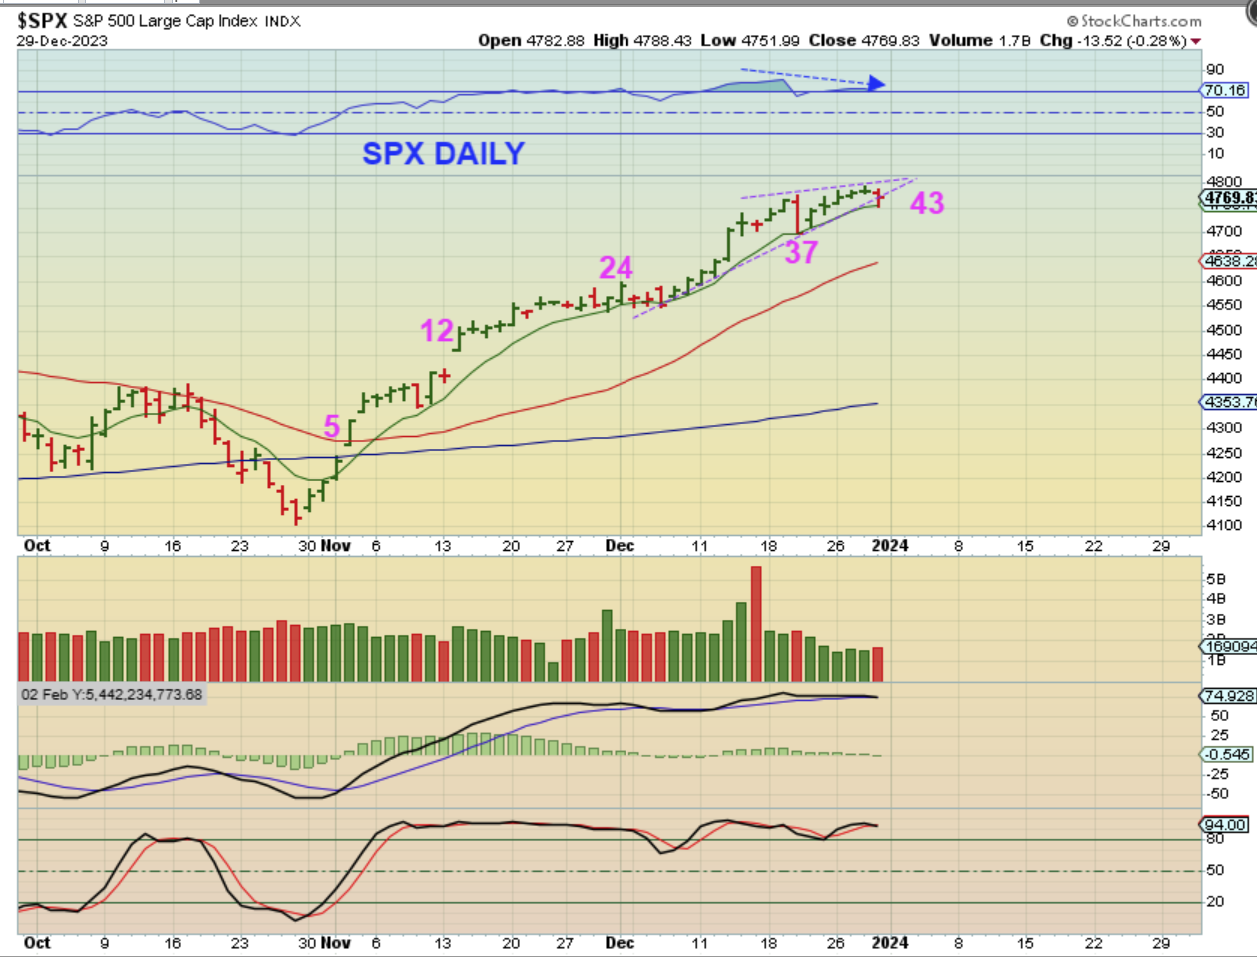
SPX DAILY – Price is still holding above that 8 ema, but we are on day 43 and now we are really due for a dip into a dcl.
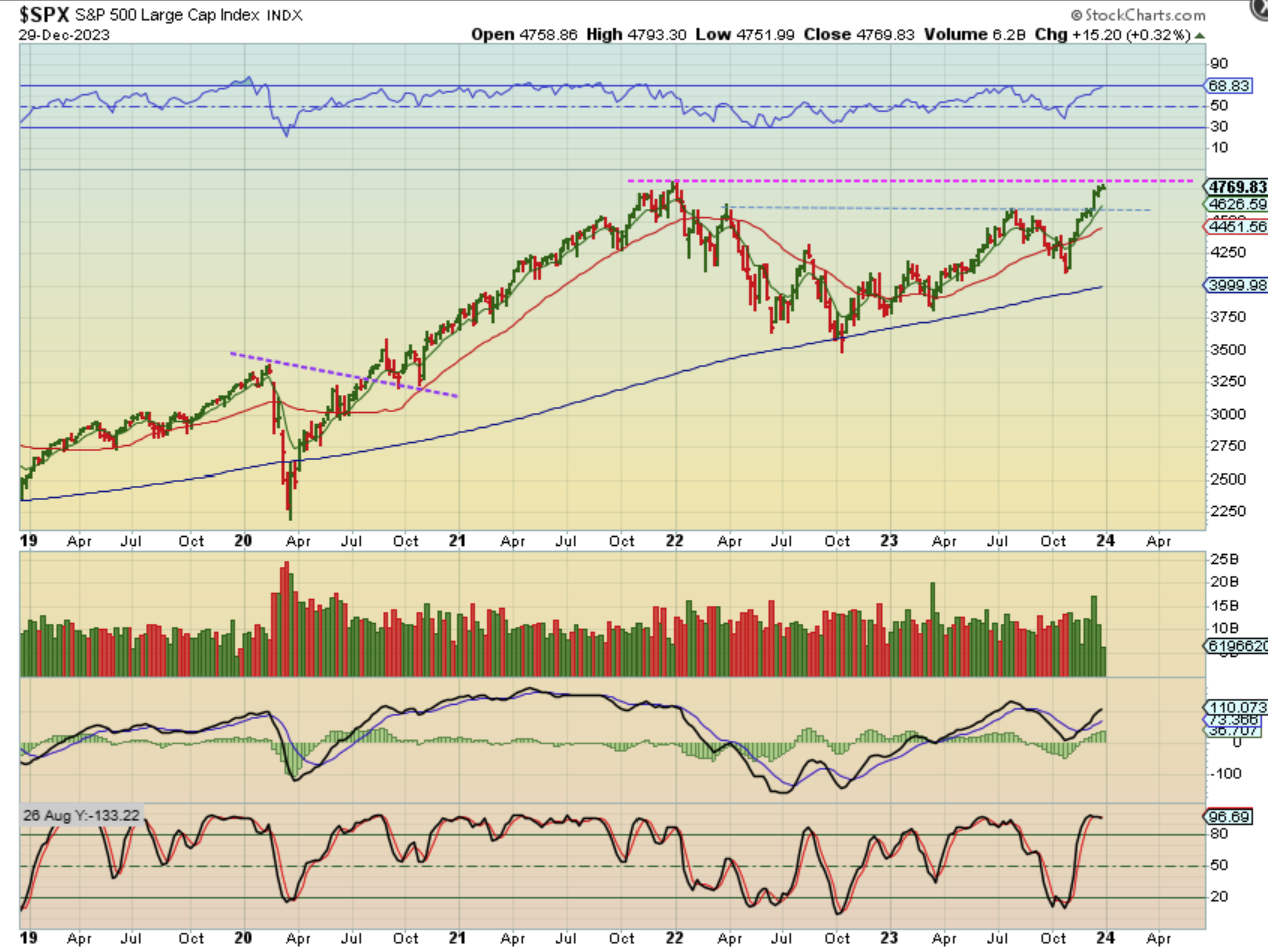
SPX WEEKLY – 9 green weeks in a row out of the lows, this was a very strong rally out of the ICL and price made it all the way back up to the prior highs. A dip into a dcl could back test the blue line or the red moving average near $4450.
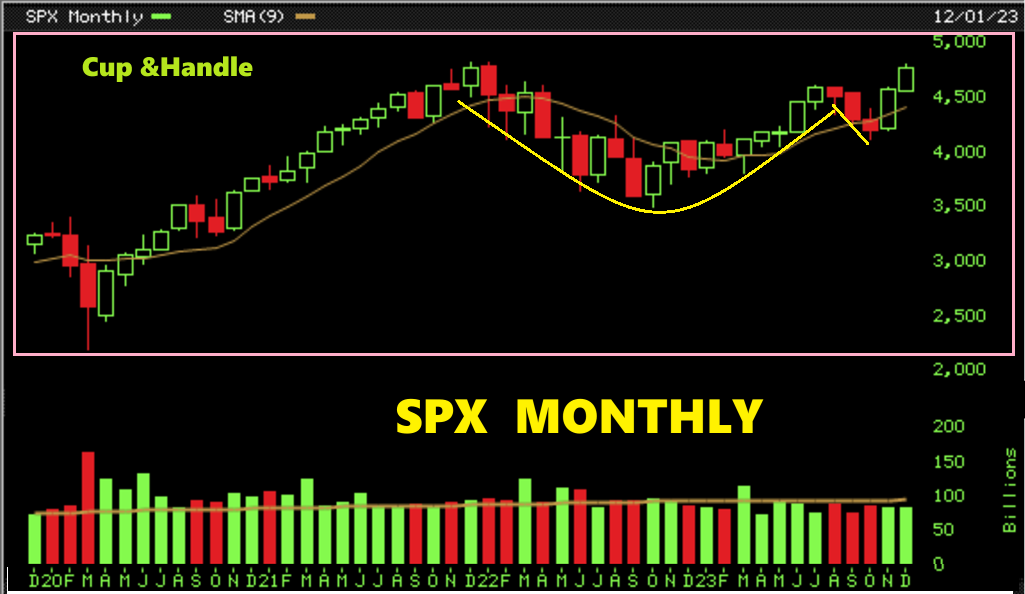
THE SPX MONTHLY formed a perfect cup & handle with that bear market and recovery, and it is now looking ready to break out.
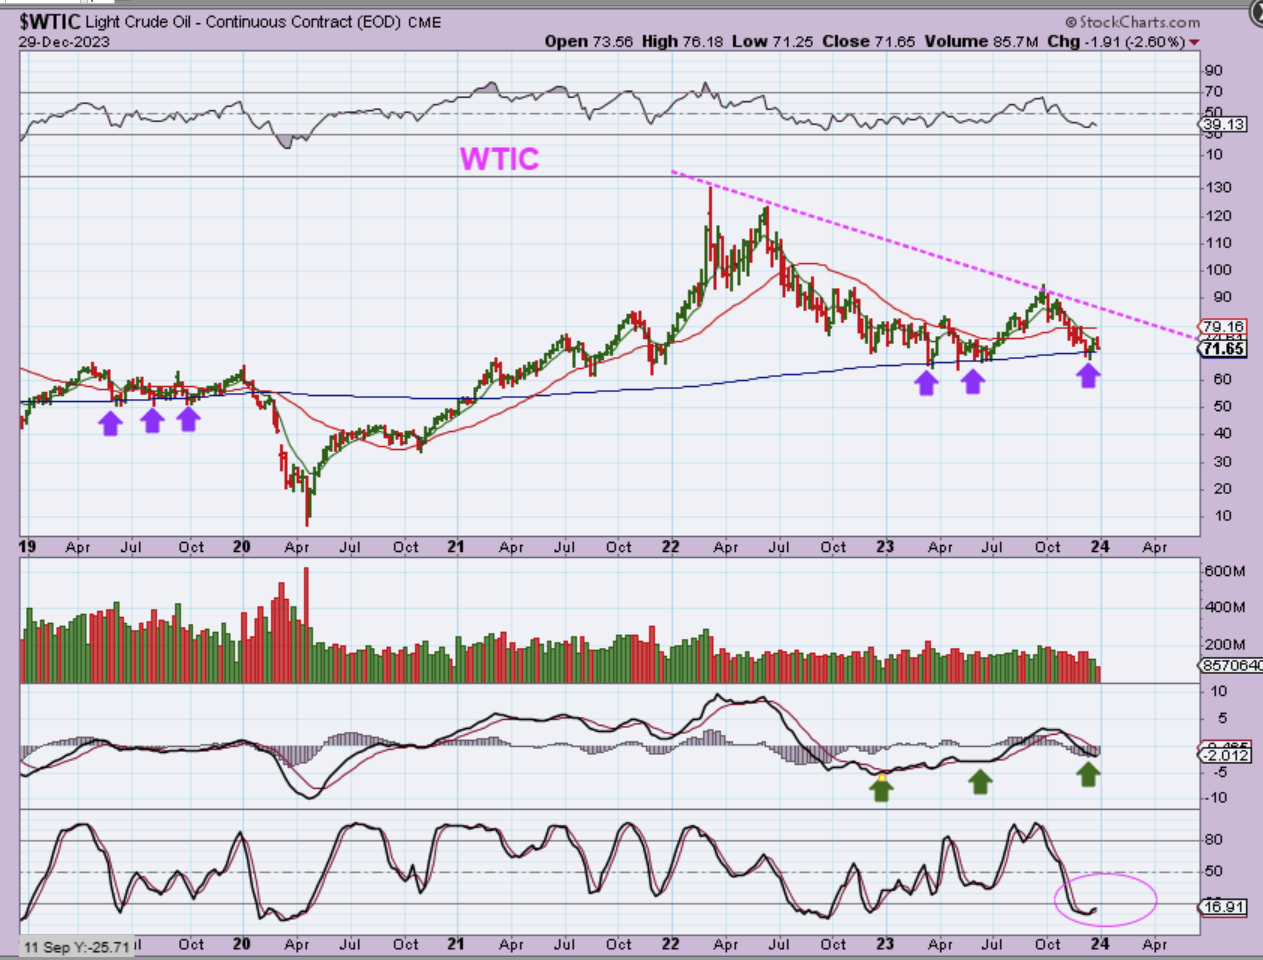
WTIC DAILY – oil dropped 2.5% last week, but it still looks like we have an ICL in place. If you look at 2019, you can see that Oil bounced along this area repeatedly and it has been doing that with the last ICL & This one too. So, with that comes the reminder: OIL CAN BE CHOPPY.
USD WEEKLY – That blue line is the 200 week ma and price bounces along that area as support in 2019 & 2022. Could we tag it or break through and recover as a shake out for a new ICL and 3 yr cycle low? Yes, but I also have questioned whether or not that July low is the 3 yr low, coming in 1/2 yr early due to the Fed Rate Hikes. We will only know for sure over time, but…
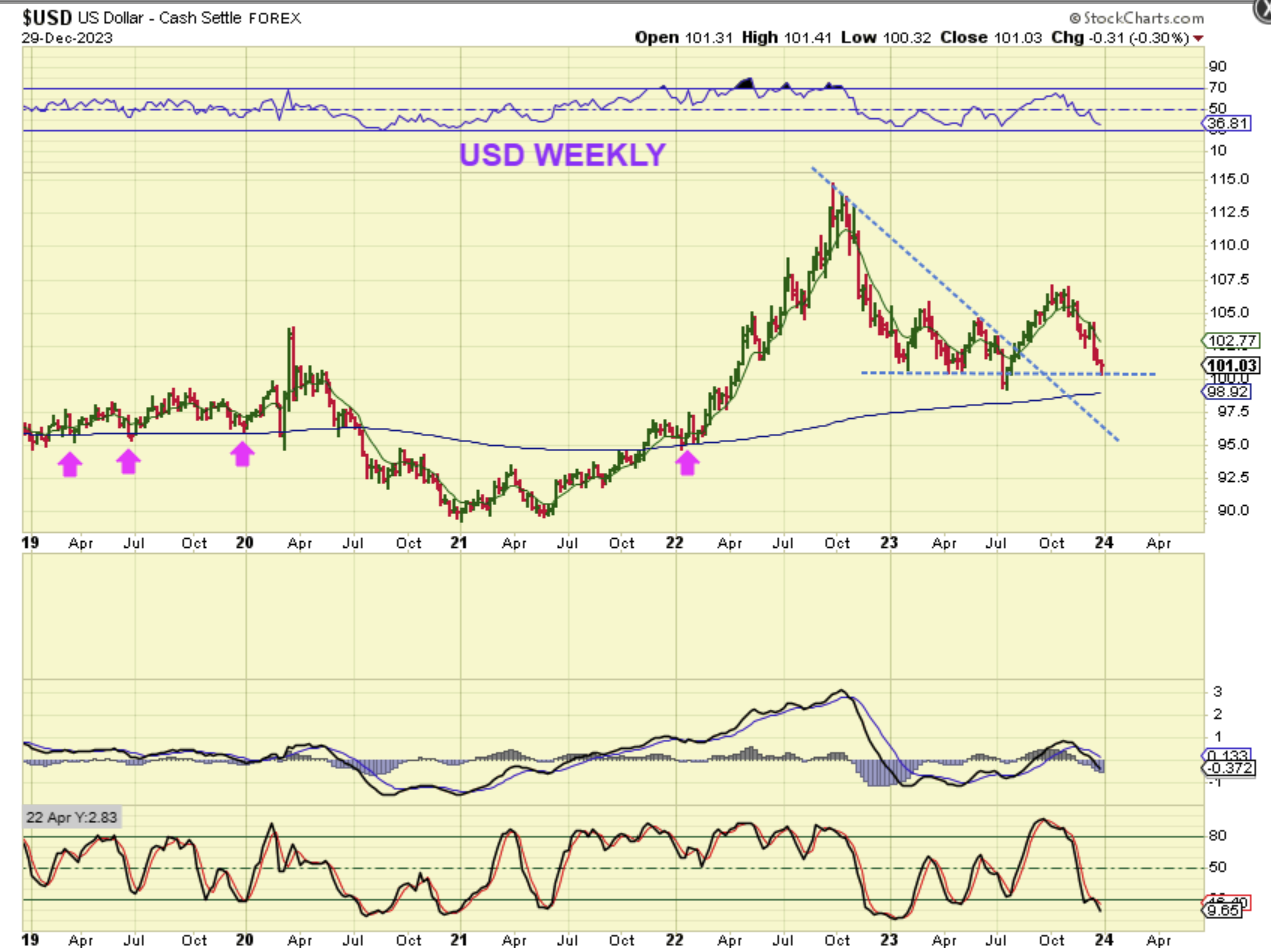
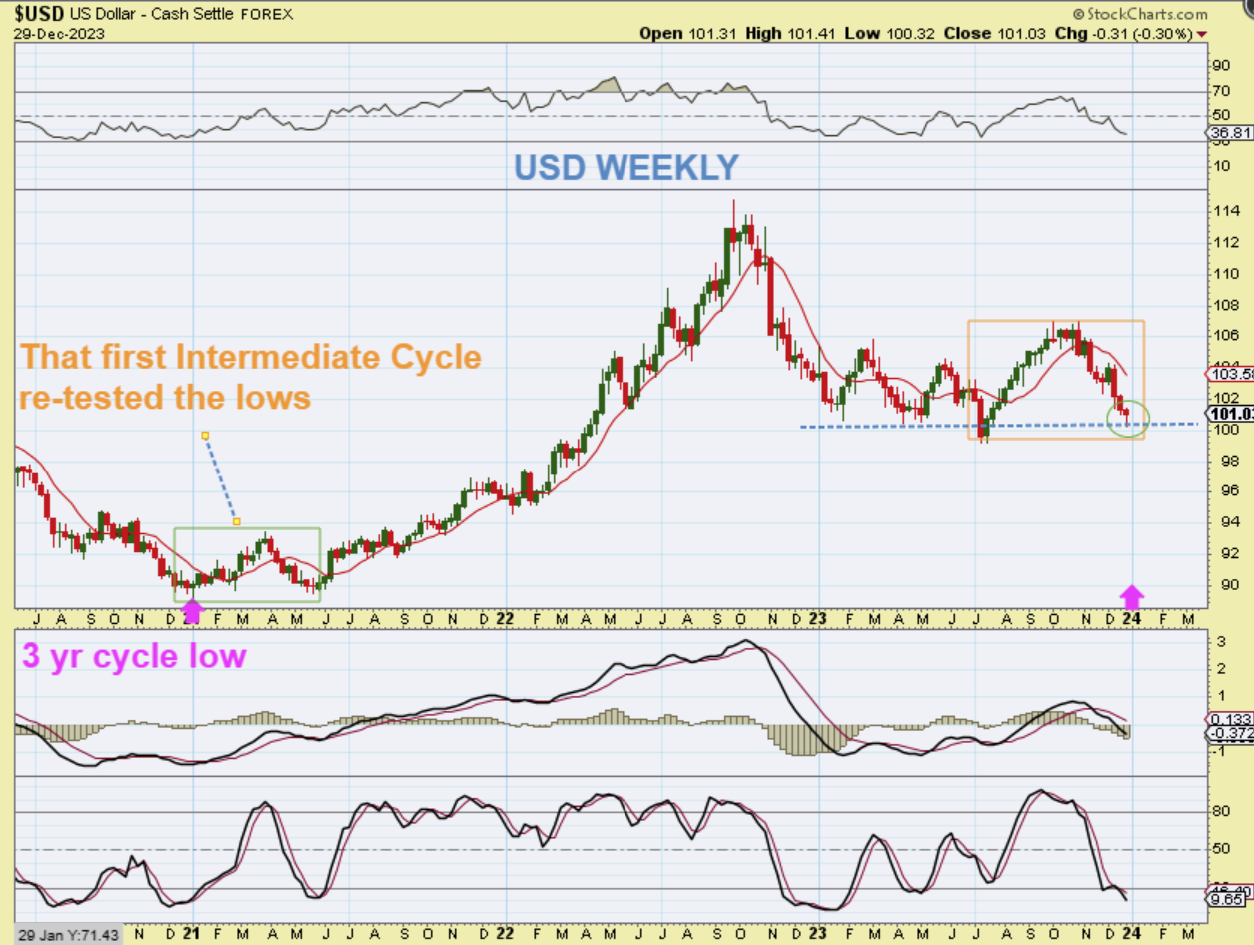
USD WEEKLY – I want you to take a look at the last 3 year cycle low (green box) and notice that it rallied and returned right back to the lows to ‘test’ the bottom. We just did that, and now we have a weekly reversal candle in place. The USD looks ready to bounce and I see MACD divergence. Gold is in the 3rd daily cycle so it could begin to pull back. The next move on the USD should tell us if we have 1 more daily cycle that drops to new lows…or not.
.
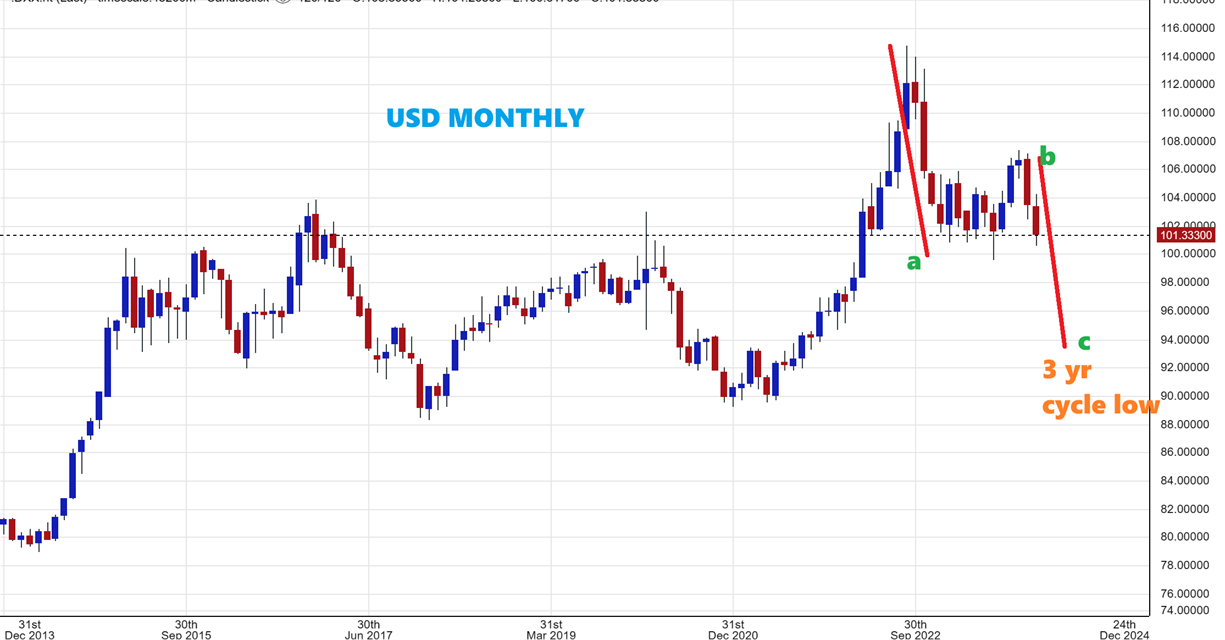
USD MONTHLY – When I look at the Monthly Chart, the USD is at support, but it does look like it has started a 2nd leg down into that 3 yr cycle low.
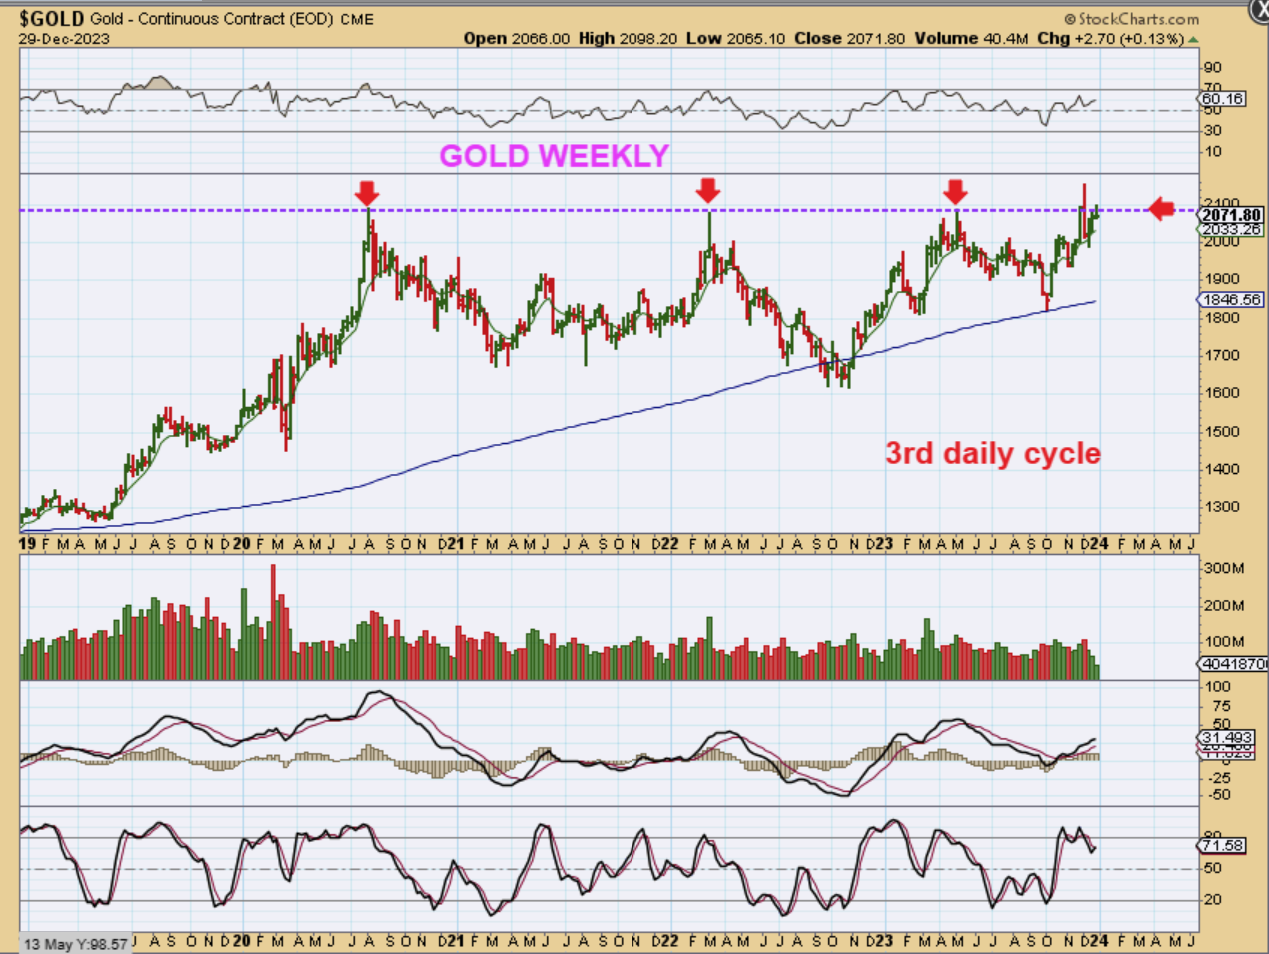
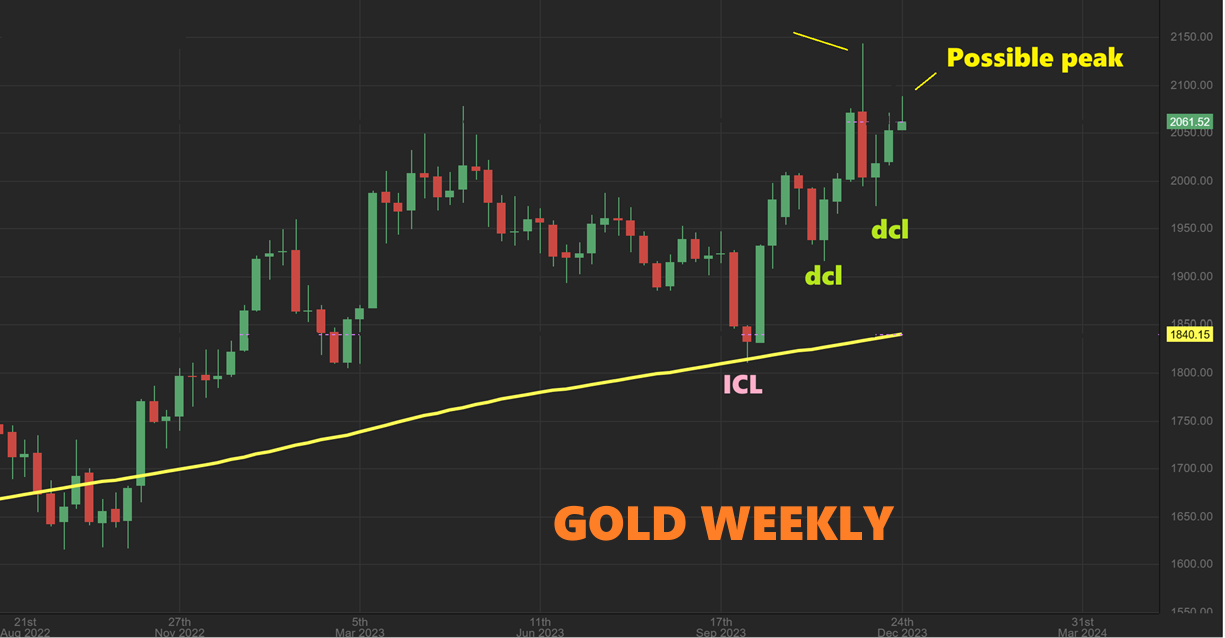
GOLD WEEKLY – The good news is that Gold is in the 3rd daily cycle and it is back up to the all-time highs again. The bad news is that from what I see with the USD possibly bouncing and that Gold exhaustion candle in the 2nd daily cycle, it doesn’t look ready to break out and run yet. I think that Gold is going to begin to pullback if the USD bounces here. That could give us a Left translated 3rd daily cycle and that would be followed by a 4th one lower, so…
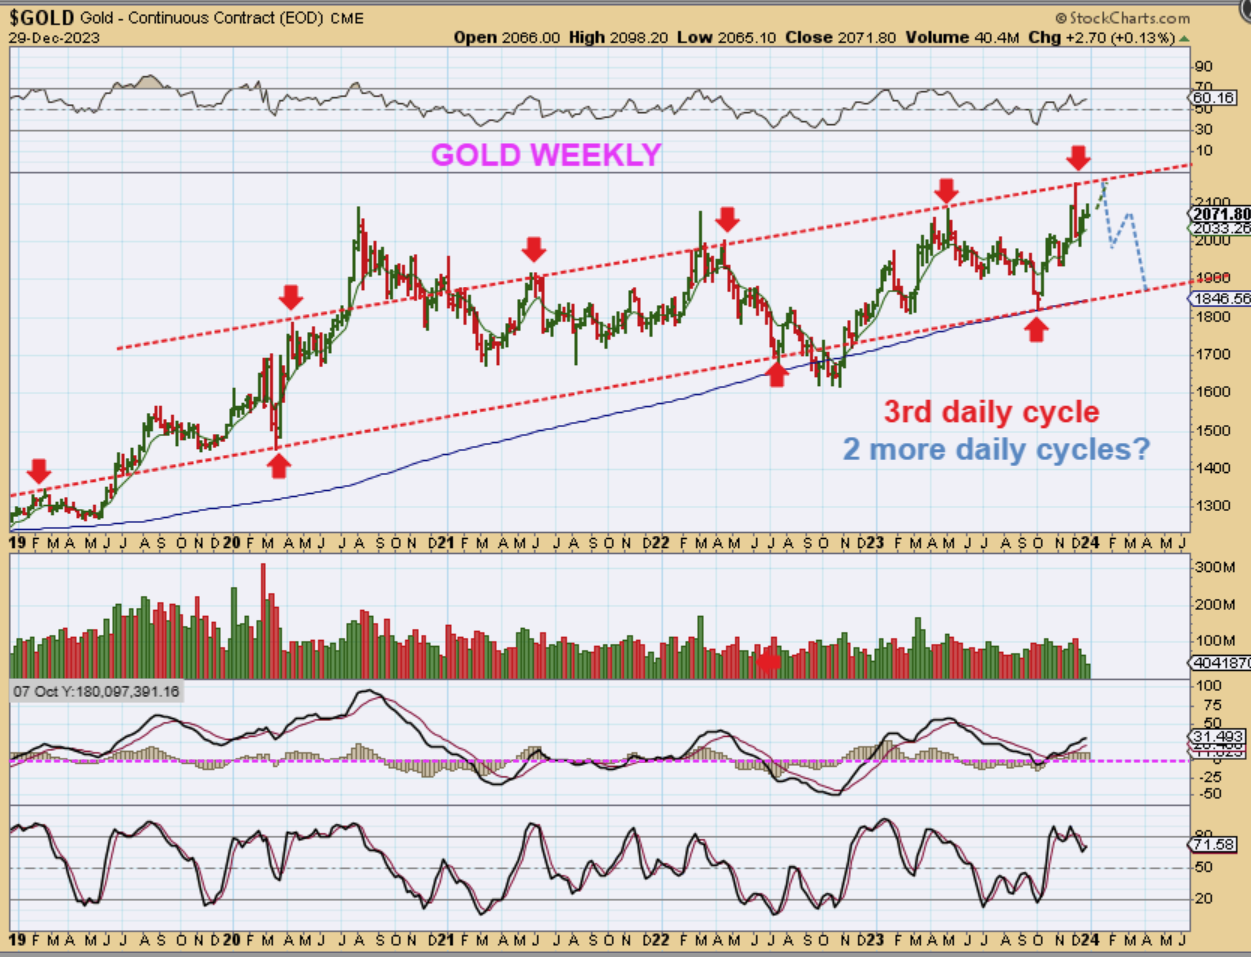
GOLD WEEKLY – Gold has chopped sideways for 3 years, however I do also see higher lows (ICLs) and a series of higher highs with that recent break out to new all-time highs. I now have to expect a pullback possibly into March and it may look something like this. Another higher ICL.
.
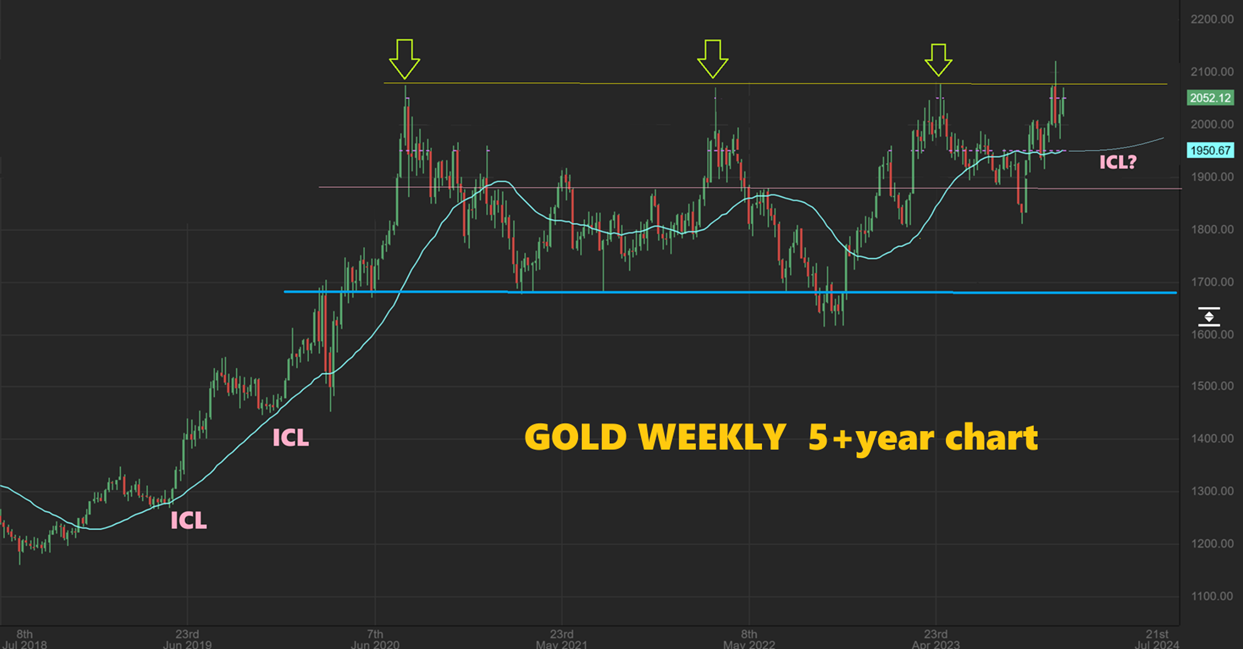
GOLD WEEKLY – I had this is a report this week showing a dip to the blue line as a common area that ICLs formed in the 2018 Bull run. That gives us roughly the $1950 area as a possibility for a downside target, or that pink 1/2-way line just below $1900.
GOLD WEEKLY – I also drew this with the Dec 22 chart to show in advance that we could top with this 3rd daily cycle and then drop down into an ICL with that 3rd & then a 4th daily cycle (a 5th is possible too). Right now…
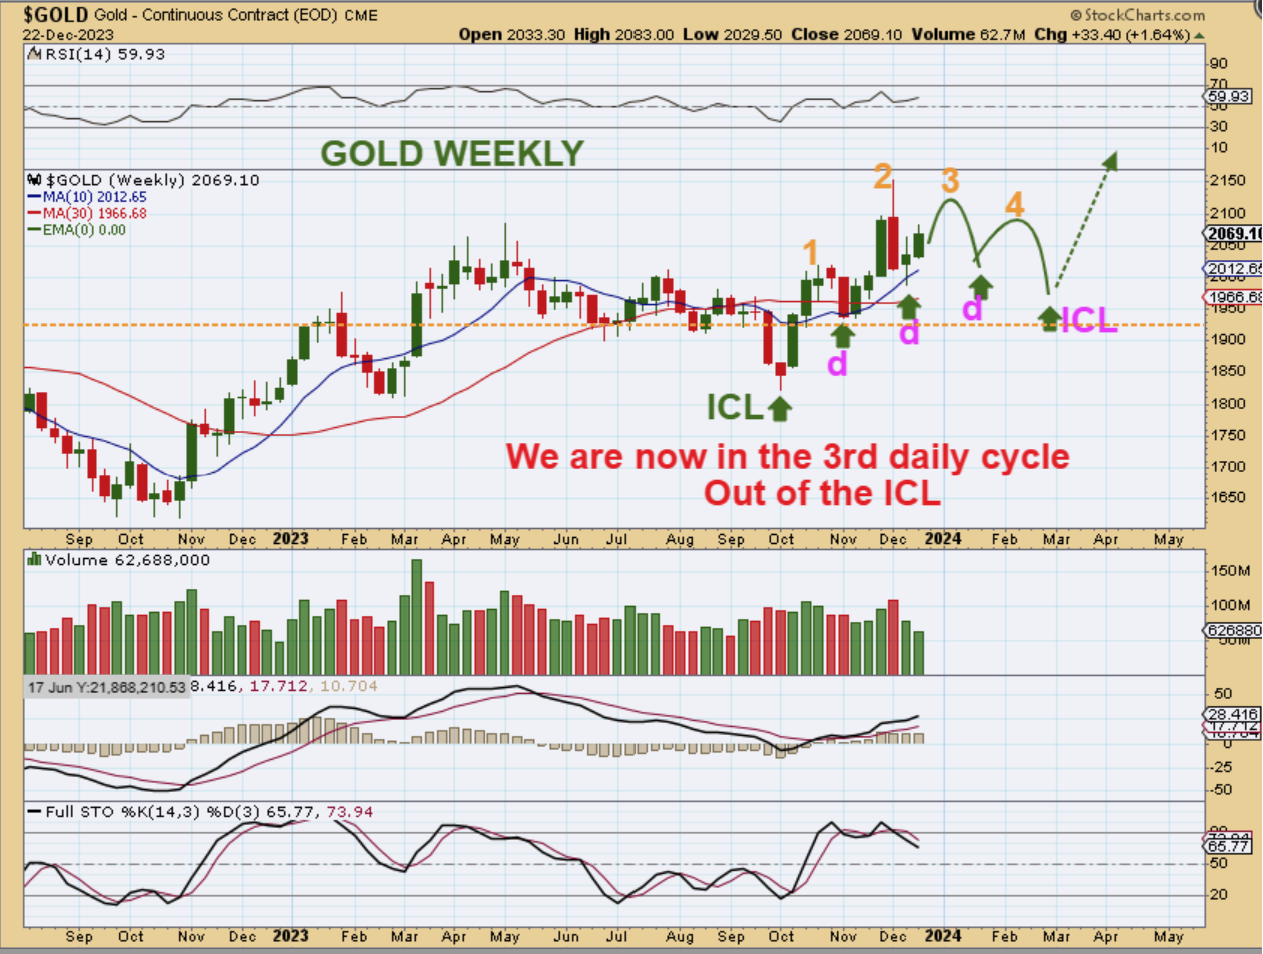
GOLD WEEKLY – Right now we do have a possible weekly topping candle on our weekly candle early in the 3rd daily cycle.
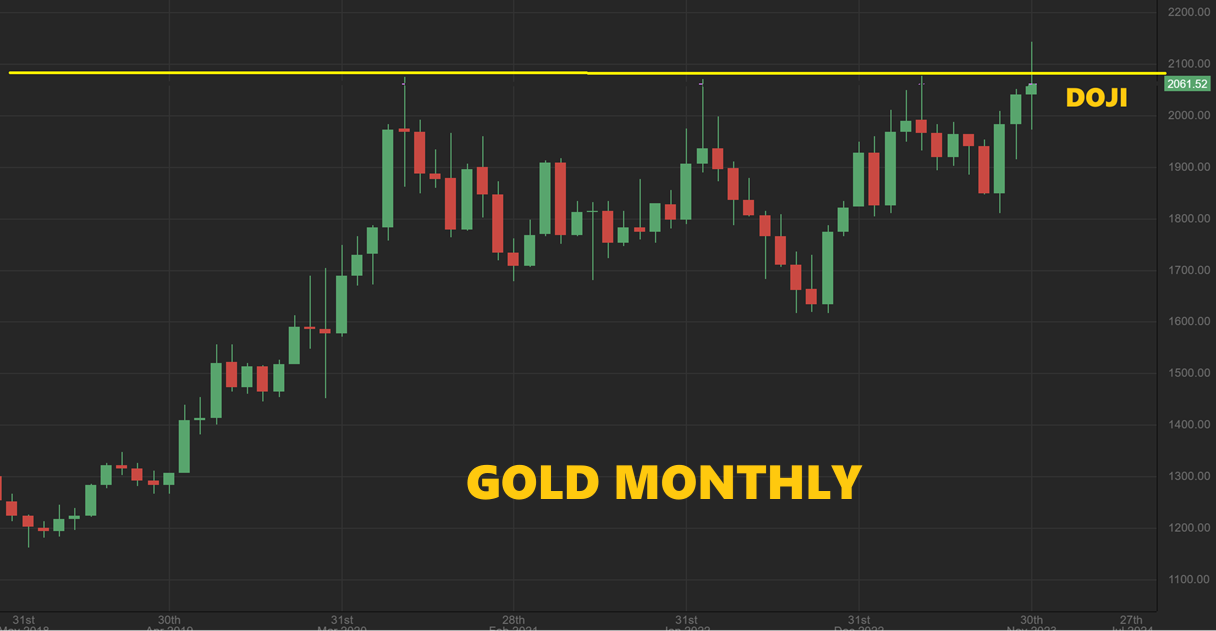
THE GOLD MONTHLY CHART is a Doji candle, a candle of ‘indecision’. We saw no follow through conviction in December for that breakout to new all-time highs. I expect a pullback for the next monthly candle.
.
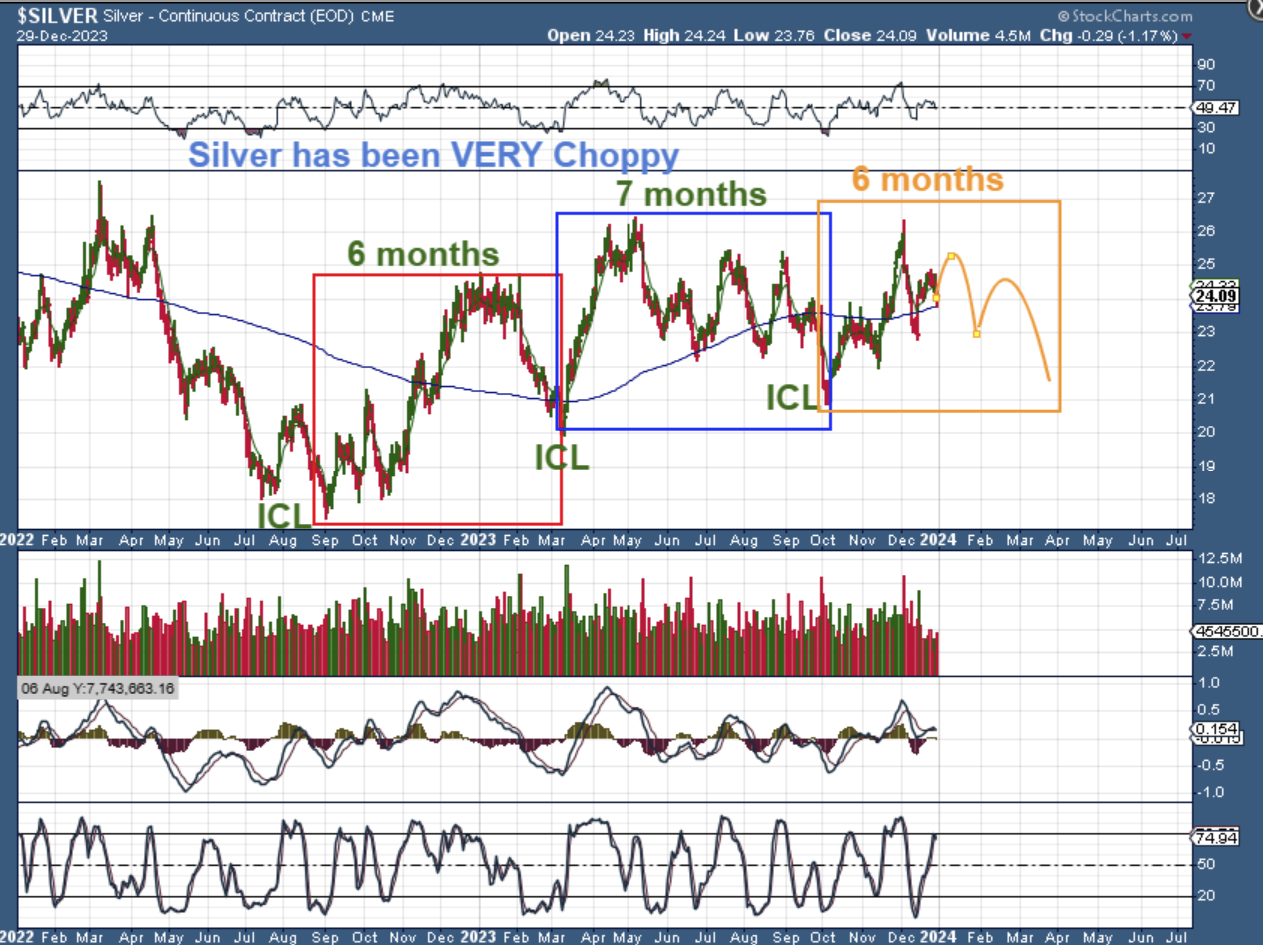
SILVER DAILY – 1. Look how choppy Silver has been (eyes rolling backward in my head), and that apparently will continue for a little longer. That being said…
.
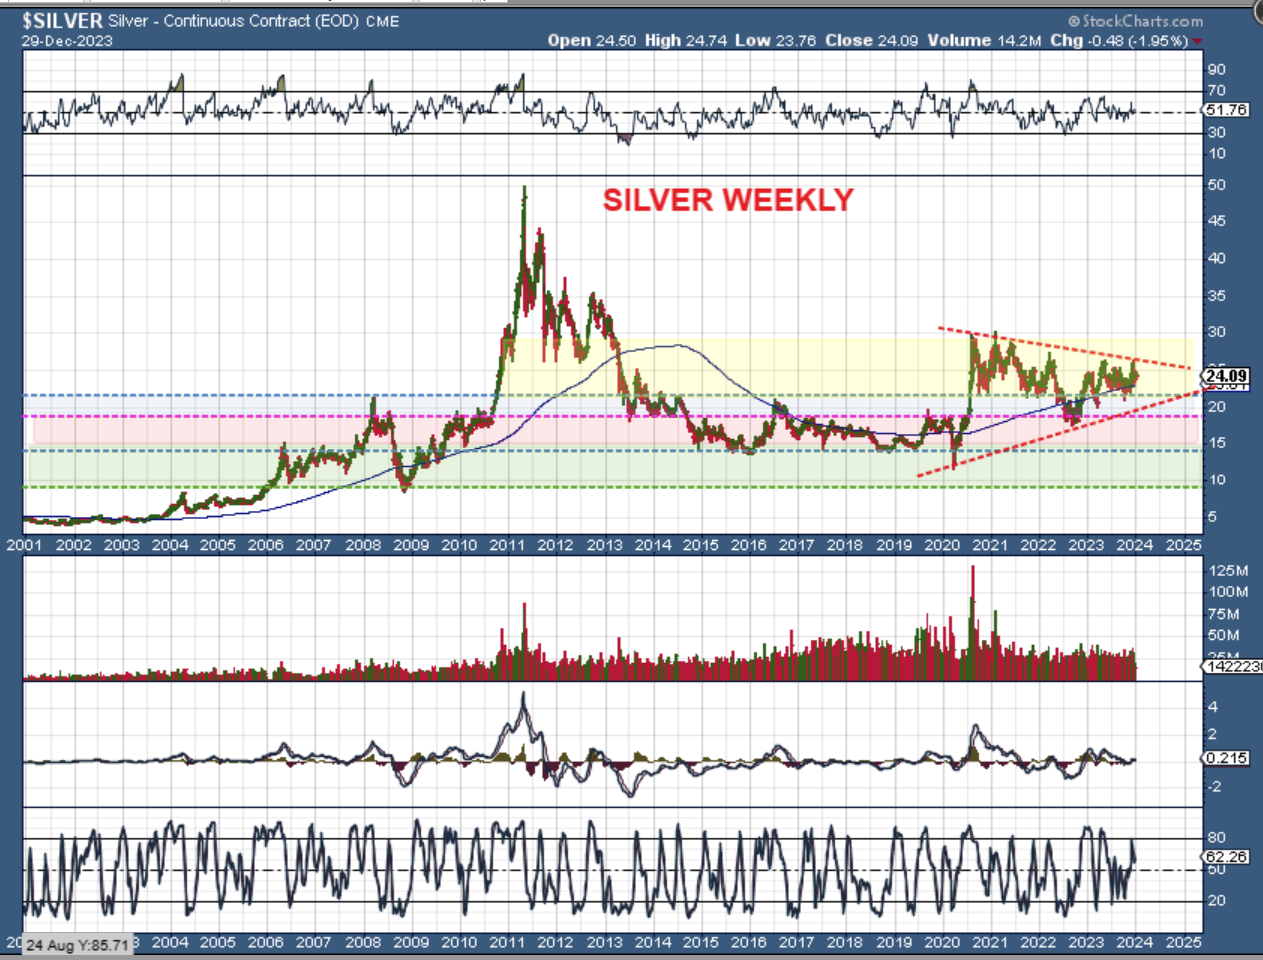
SILVER WEEKLY – Though I expect a little more choppiness, this is a bullish set up in the big picture silver weekly chart. Price is pinched in a wedge pattern and a breakout would lead to a very strong rally.
.
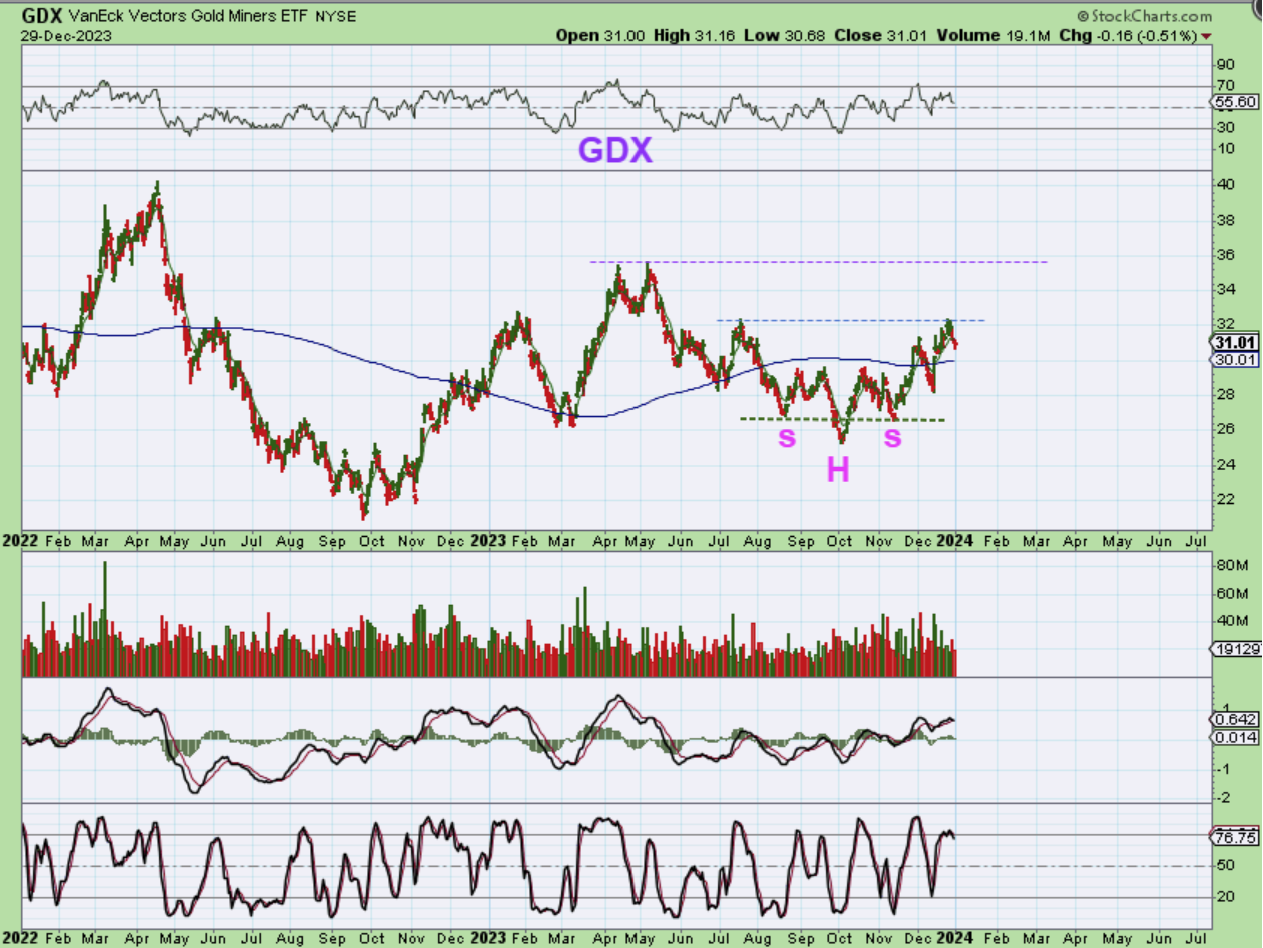
I looked at the Daily, Weekly, and Monthly GDX charts and they all look similar (nothing stands out as overly bullish or bearish at this point), so let’s just take a look at the daily charts.
.
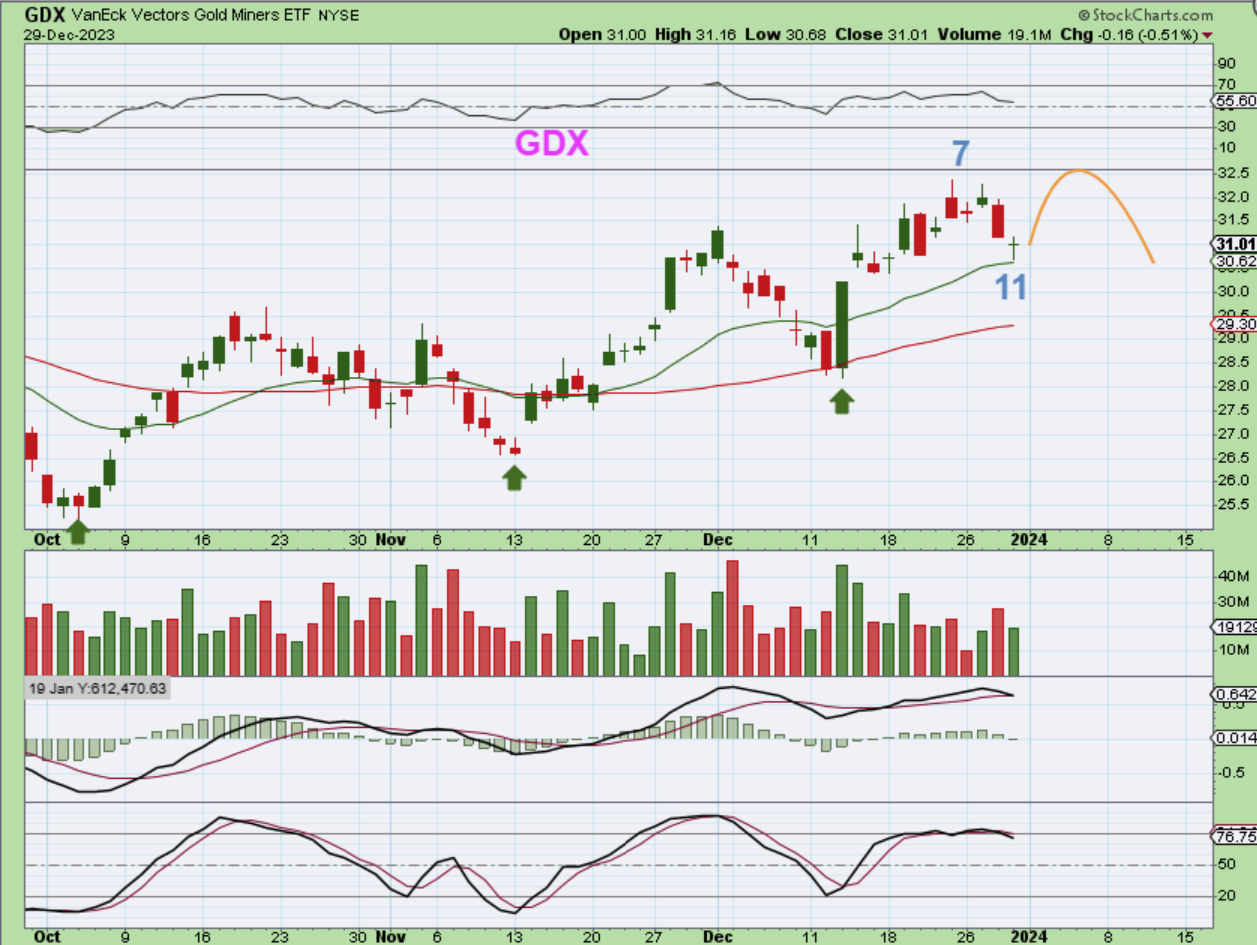
GDX DAILY – We started the 3rd daily cycle and it’s on day 11. It found support at the 20 ema on Friday and started to bounce back, ending the day down only 15 cents. GDX has peaked on day 7 so far, so it could bounce and try to form as R.T., but if it rolls over & drops before day 15 or less from here it threatens to remain L.T.
.
GDX DAILY – The bigger picture does still appear to be bullish as it seeks our prior high targets on its way out of the inverse H&S Base. This honestly looks like it would drop to the 50sma as a 1/2 cycle low and then push higher, but that likely depends on what the USD & Gold itself does.
.
The 2024 does still look to be bullish in many ways, but we always need to expect normal pull backs and dips, especially when we factor in Cycles and cycle counts. The way things are set up, it looks like The General Markets, Gold, Silver, and The Miners, The Crypto area and maybe Oil (if it can break free from this constant choppy sideways action) could remain bullish going forward. I want to say thanks to everyone for being with me in 2023, I very much appreciate you all, and I am wishing you all a happy, healthy, profitable 2024! Enjoy the rest of your time off and we’ll see you on Tuesday morning for some 2024 trading – Thank You Chartfreaks!
.
~ALEX
.
BITCOIN & THE CRYPTO RELATED STOCKS GOT A BIT TRICKIER ON FRIDAY, SIMPLY BECAUSE OF WHAT WE SAW WITH CRYPTO RELATED STOCKS. A big wave of profit taking showed up and the selling in the stocks was far bigger than the crypto moves.
1. Was it just a last day of the year sell off / profit taking to off set losses?
2. Was it the start of a larger daily cycle pullback, well before the ETF is approved?
It is hard to know for sure, but now we have to factor that in. Bitcoin itself looks absolutely fine. As for the Crypto related stocks, The daily charts look ugly, weekly charts look short-term toppy, monthly charts look fine, so I’ll discuss that after we discuss Bitcoin.
.
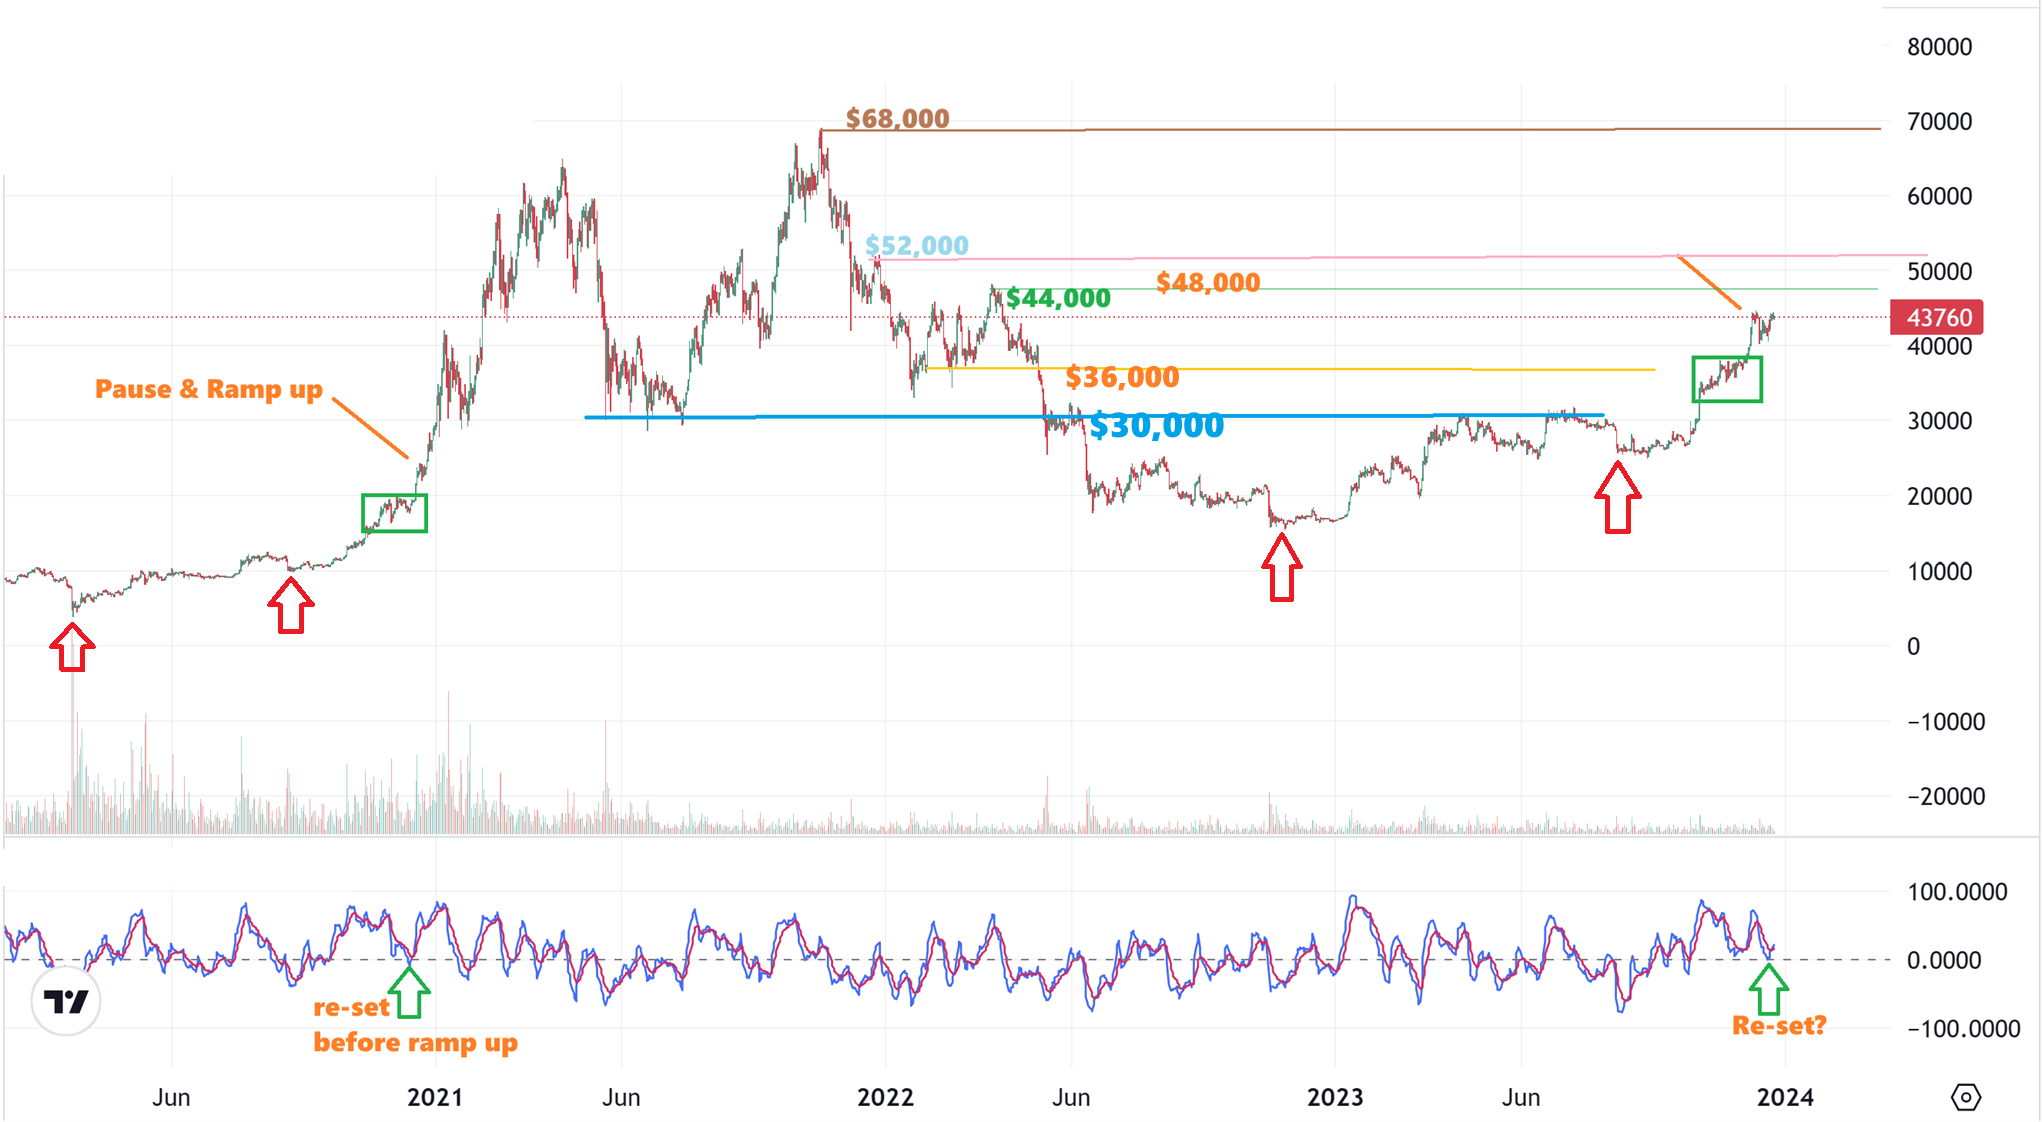
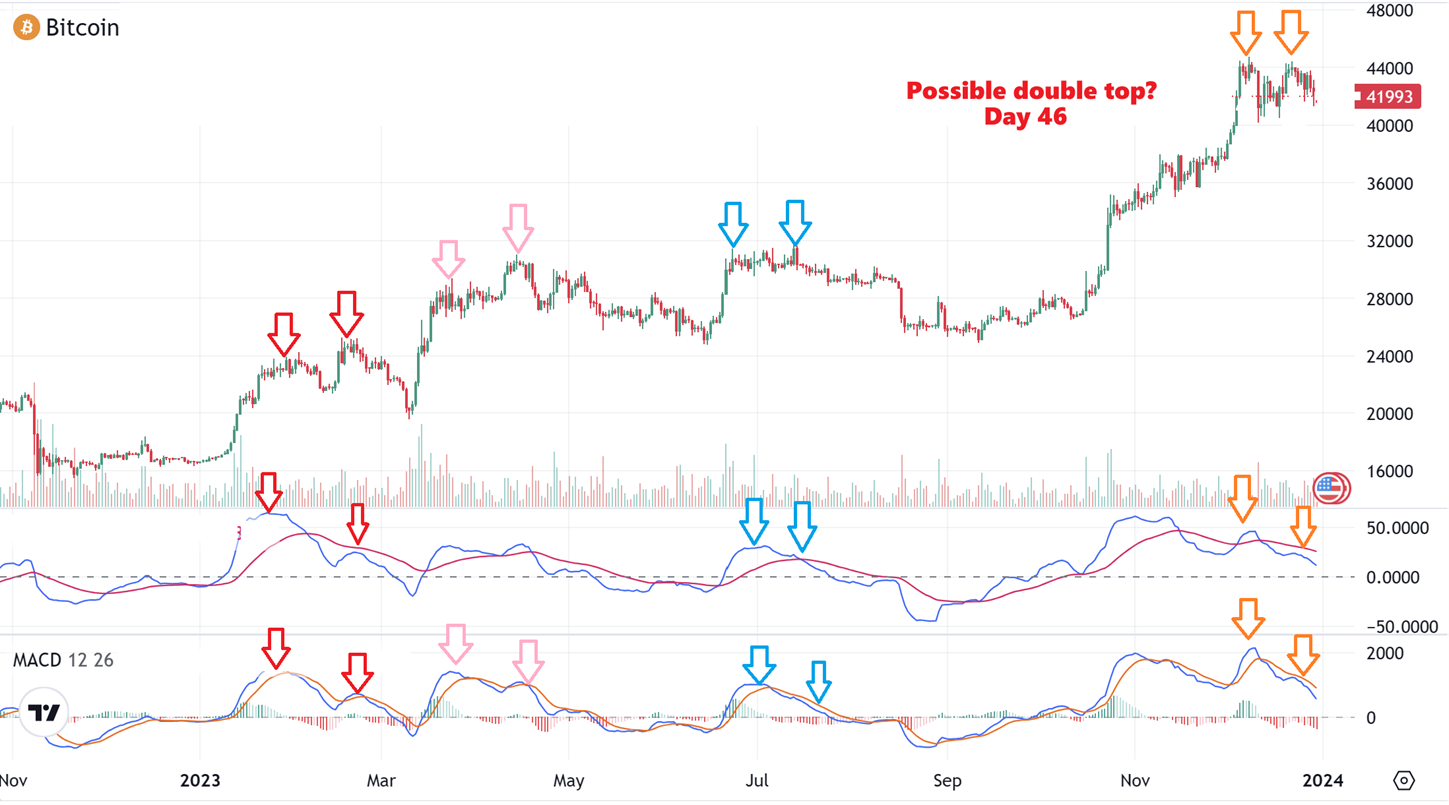
BITCOIN BIG PICTURE – I had this chart in a report earlier this week and not much has changed from this $44.000 level. We pulled back at the end of last week. The next targets were $48,000-$52,000, but the later that this daily cycle goes on, the more it will be inclined to pull back before making a run for those targets. It is possible that this daily cycle has peaked, based on what the Crypto Stocks have done. I will discuss that shortly…
.
.
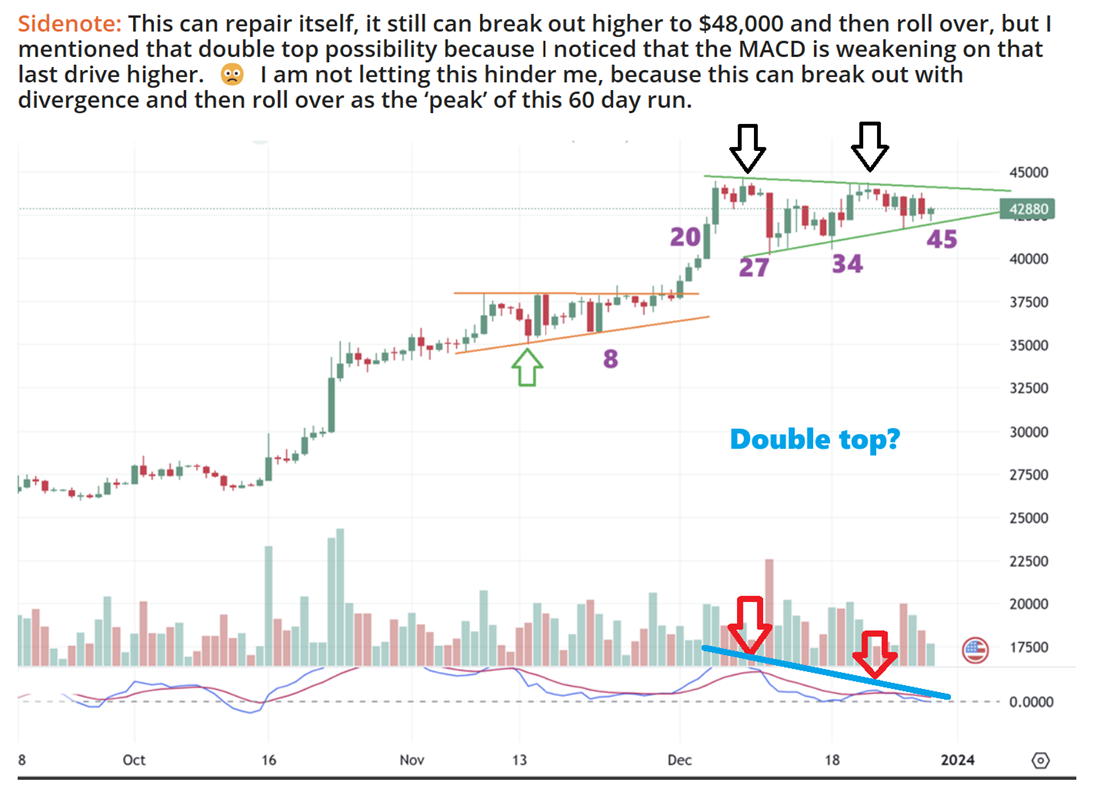
First a reminder that I mentioned a possible double top in this consolidation. If the sideways chopping continues for a few more days, then it also could just do a triple top. This is what I said, and at this point I was holding a basket of Crypto stocks and trading others too:
.
.
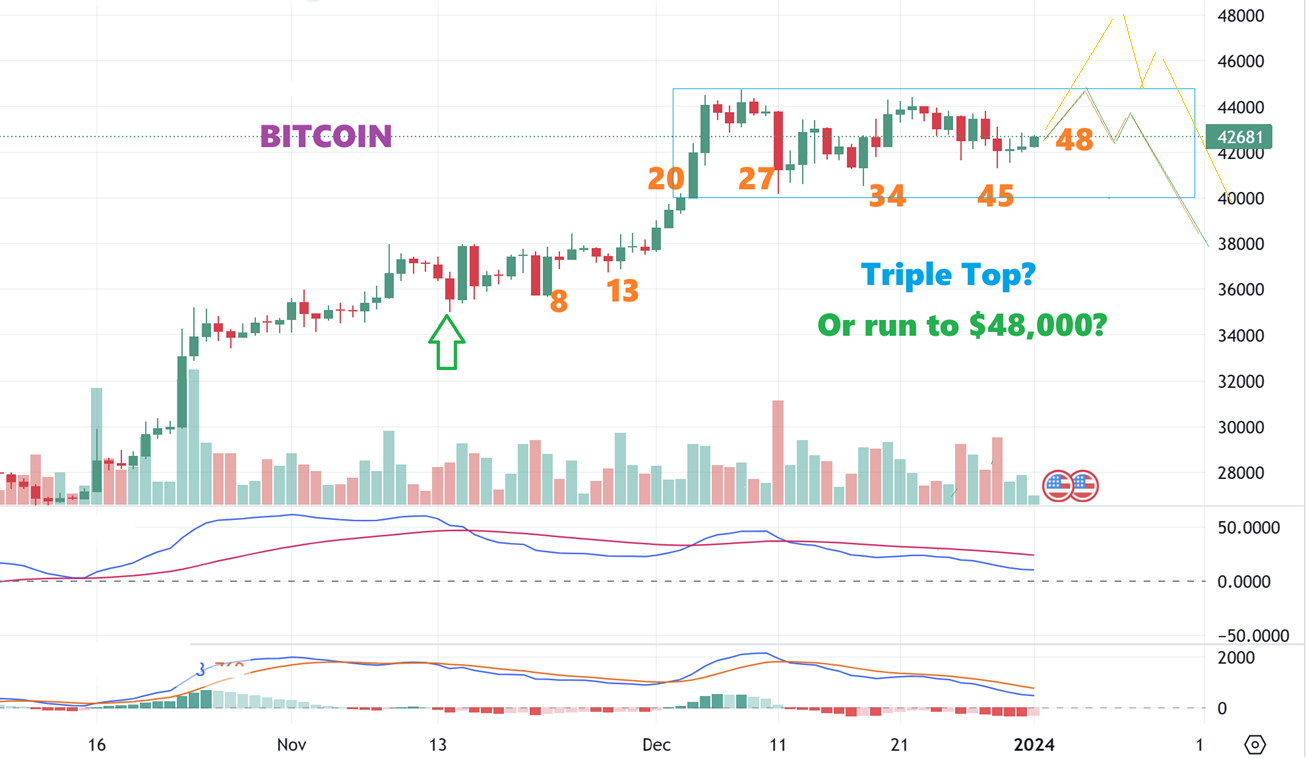
BITCOIN DAILY – On Friday Bitcoin sold off, but it remained in this sideways choppy consolidation.
.
BITCOIN JAN One, 7 A.M. ET: We are now on day 48 and we usually see the dcl dip around day 60, so even though this does still look like it could run to $48,000, it also may triple top this week and roll over. Why did I think that?
The crypto related stocks sold off very SHARPLY. They plunged! I’ll discuss that after the weekly and monthly Bitcoin Charts…
.
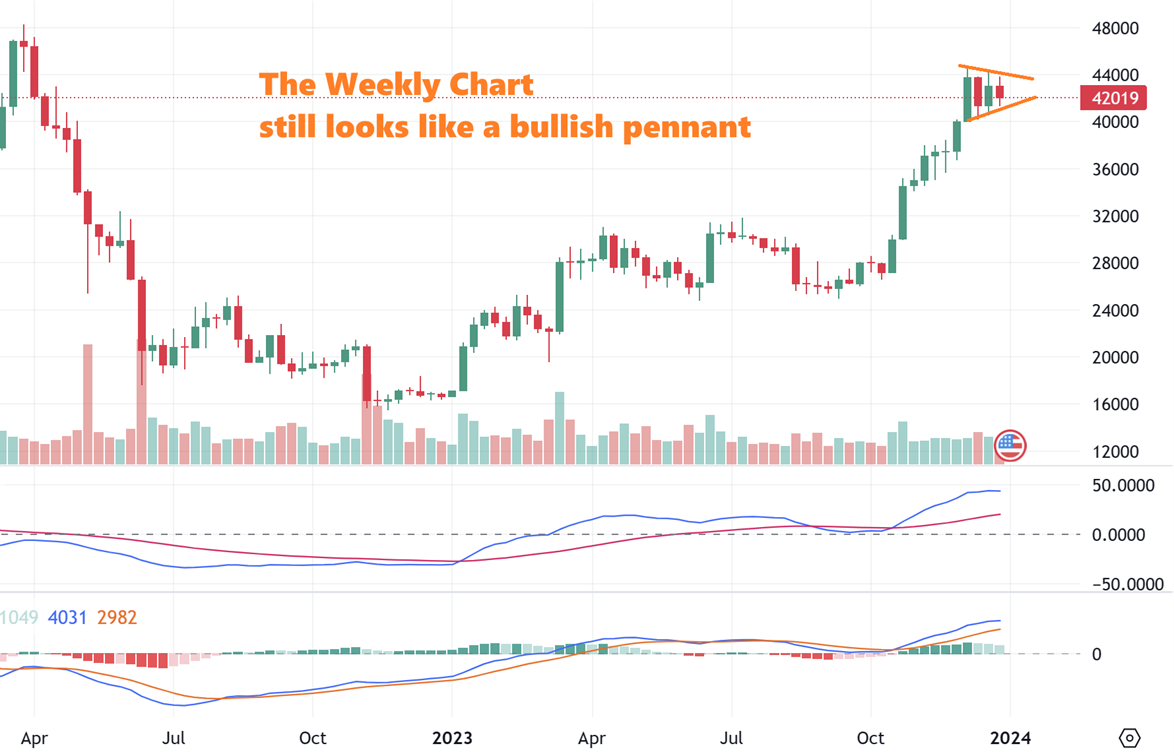
WHEN I LOOK AT THE BITCOIN WEEKLY CHART– This actually looks like a bullish pennant. Maybe we’ll see a false break out higher (to $48,000) and then a pull back into the dcl? We’ll see, but I would have expected a breakout by day 55 and a back test around day 60+.
.
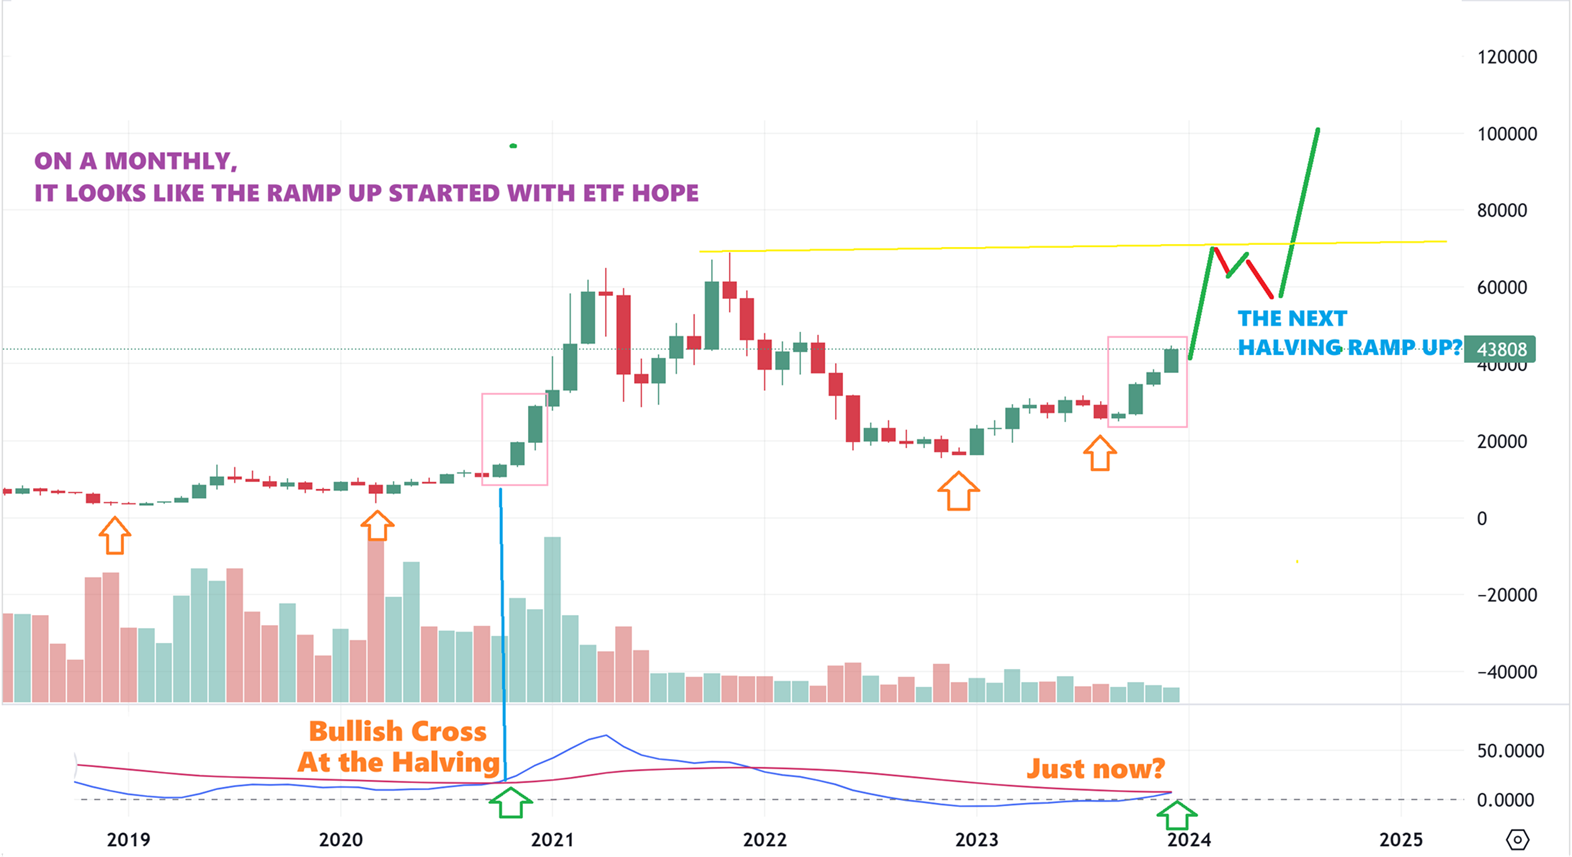
BITCOIN MONTHLY – I showed this Monthly chart in a prior report and it hasn’t changed, it does still look very bullish in the long-term timeframe.
.
Another reason why we could be at a temporary top in Crypto-related stocks is that
many of the weekly crypto-stock charts now reflect a topping candle.
.
This looks somewhat Similar to when Gold exhausted its run and put in a sharp reversal candle. Since that time, Golds peak has been in place, even though price has meandered back toward those highs, so it is possible now that if Bitcoin breaks out and runs to $48,000, the Crypto stocks may just meander back toward these highs, but I wouldn’t bet big on that. Let’s look at just a few of these charts to show you what I am seeing…
.
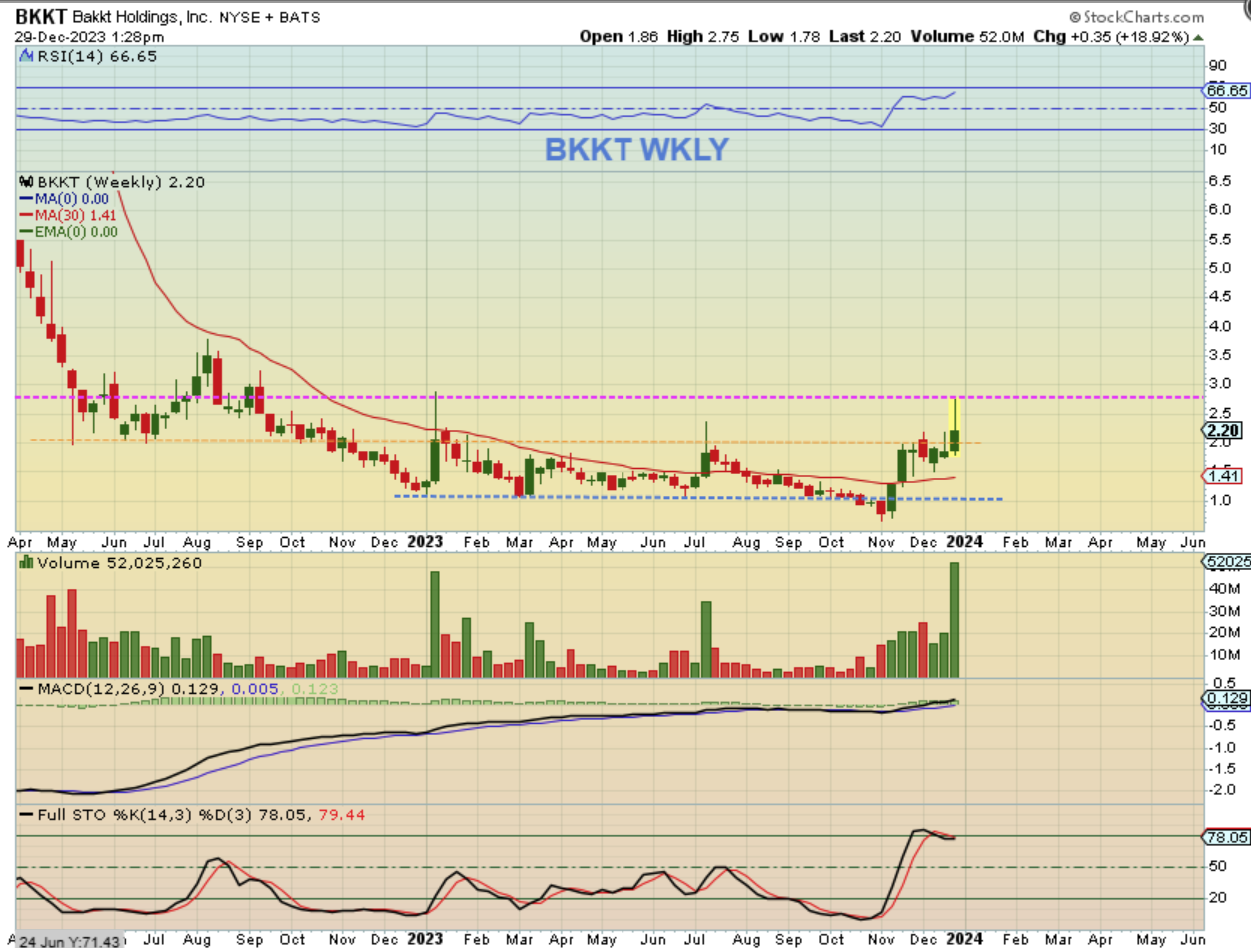
BKKT WEEKLY- You can see that price ran up to the Jan 2023 highs and ten sold off. This looks like a weekly reversal candle.
.
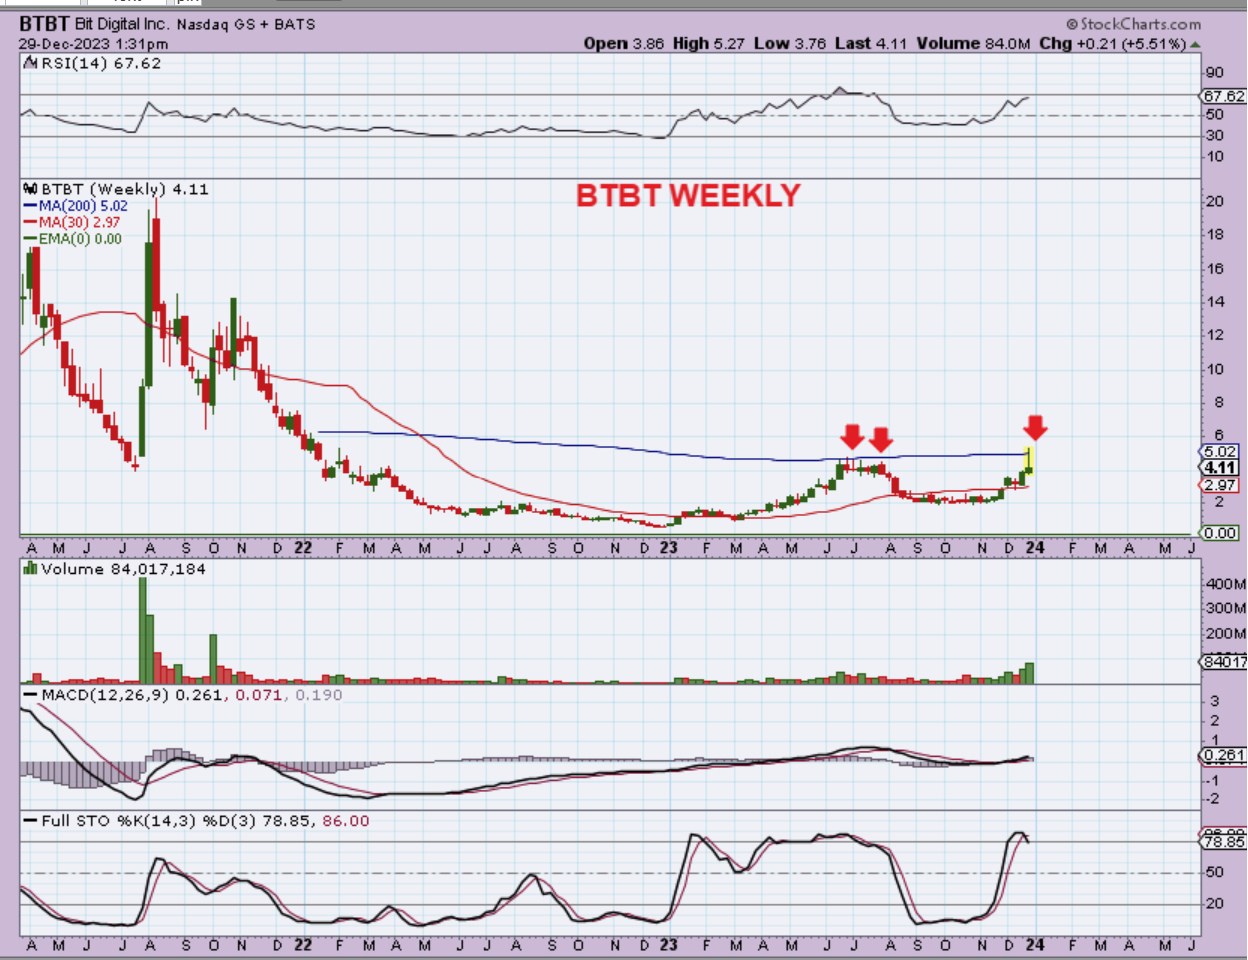
BTBT WEEKLY also shows that price ran up to prior highs from June/July and sold off. This also gives us what looks to be a reversal candle.
.
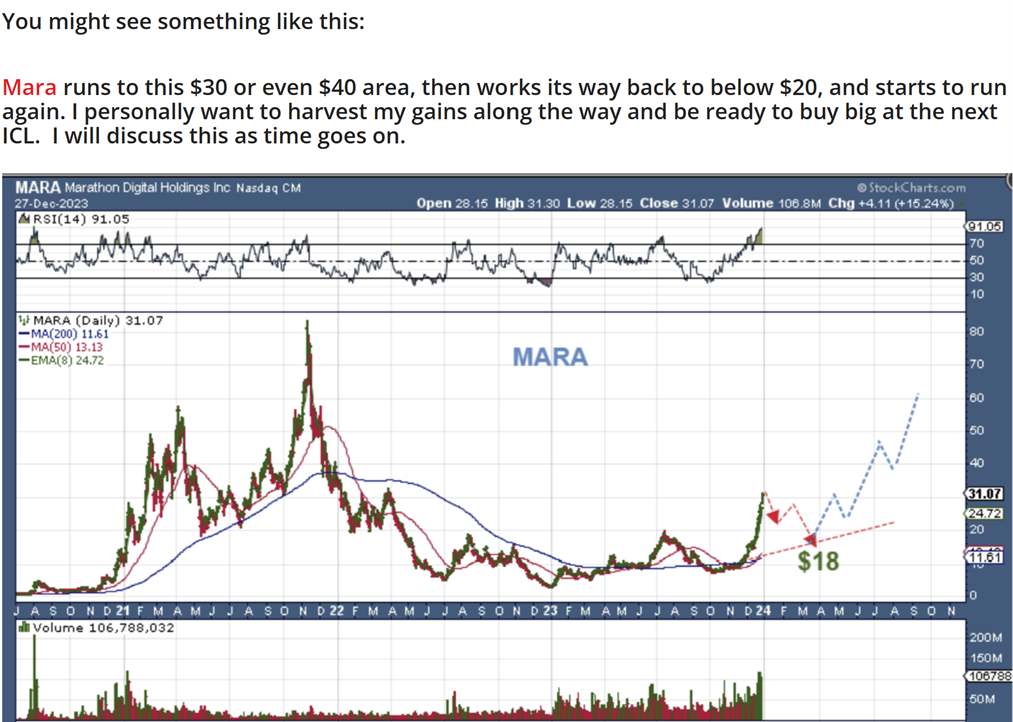
MARA DEC 27th – I wrote this example of how a pullback could develop using The Mara Chart (This was as of Wednesday trading; it has since dropped)…
.
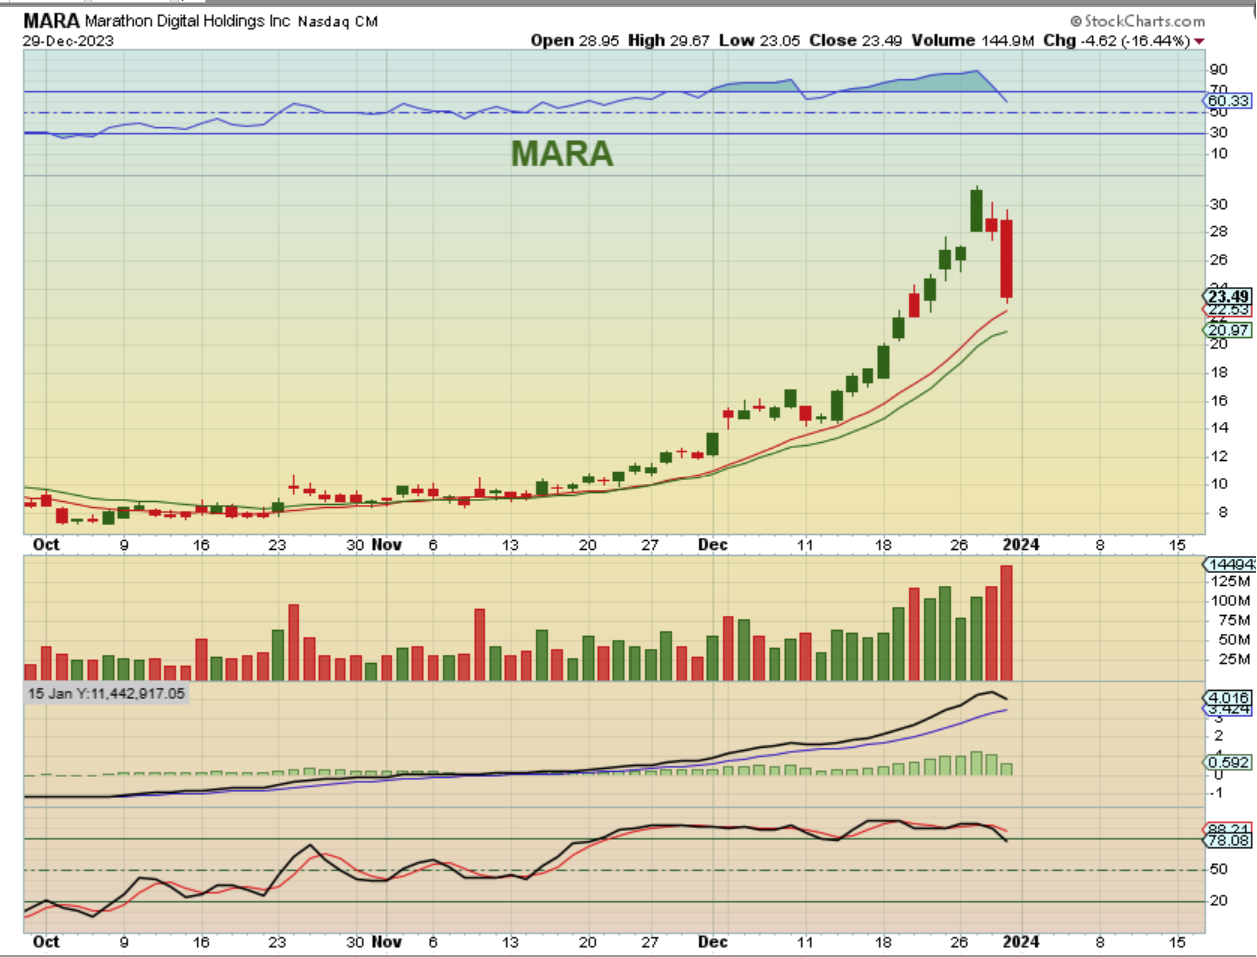
MARA DEC 29th – Notice the weekly candle for MARA as of Fridays dip. That is a high-volume reversal candle, and those are often short term tops. I mentioned selling my MARA on the way up between $23 & $24, because it looked to be getting extended. It closed at $23.49 on Friday, after tagging $31.30 this week! Is this a temporary top? It does look to be one.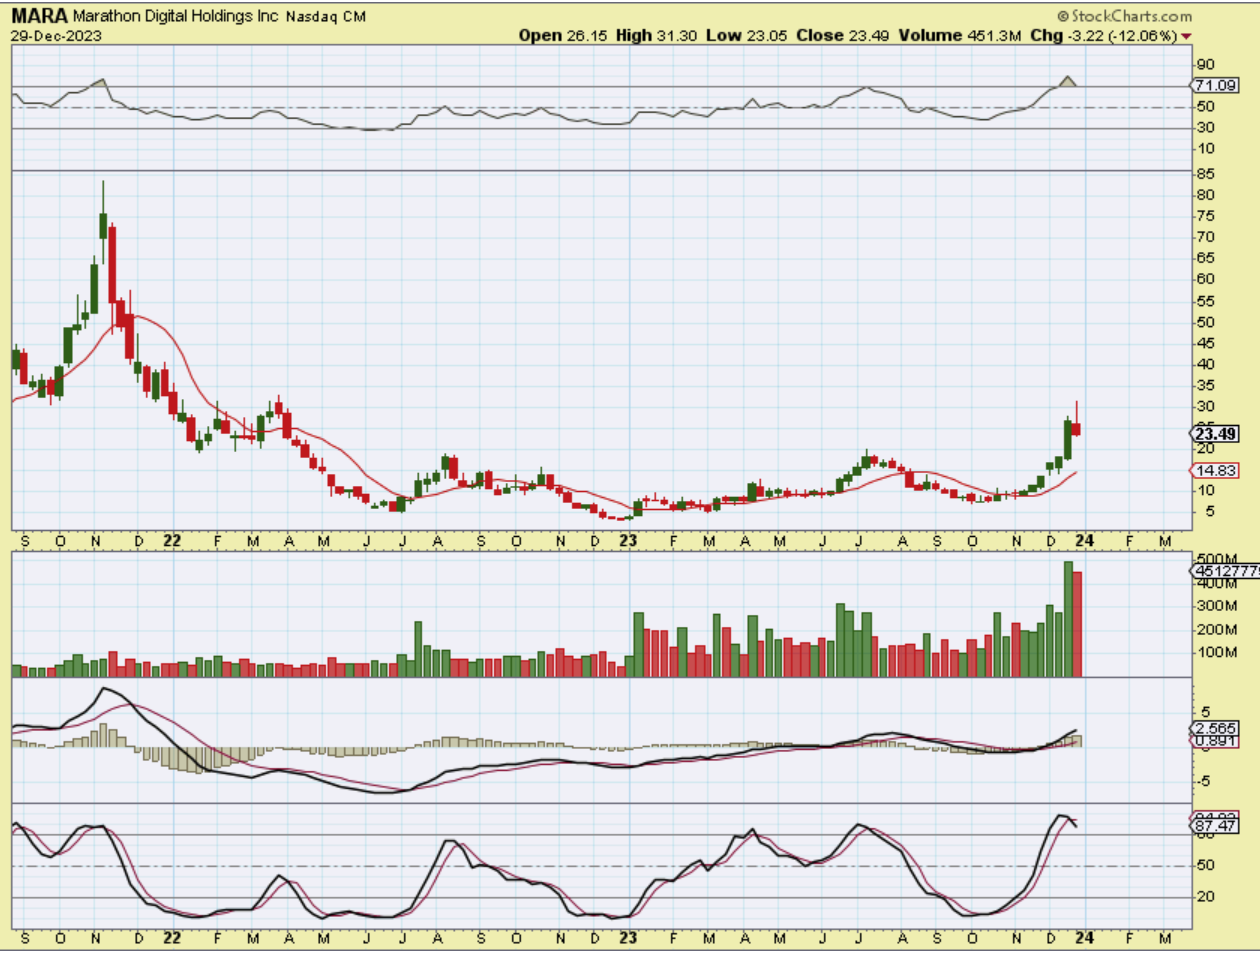
MARA DAILY – MARA plunged with a big drop on Friday of almost 20%, so it wouldn’t be unreasonable to think that sellers may just be ready at the open on Tuesday to just bail out and continue to selling, but…
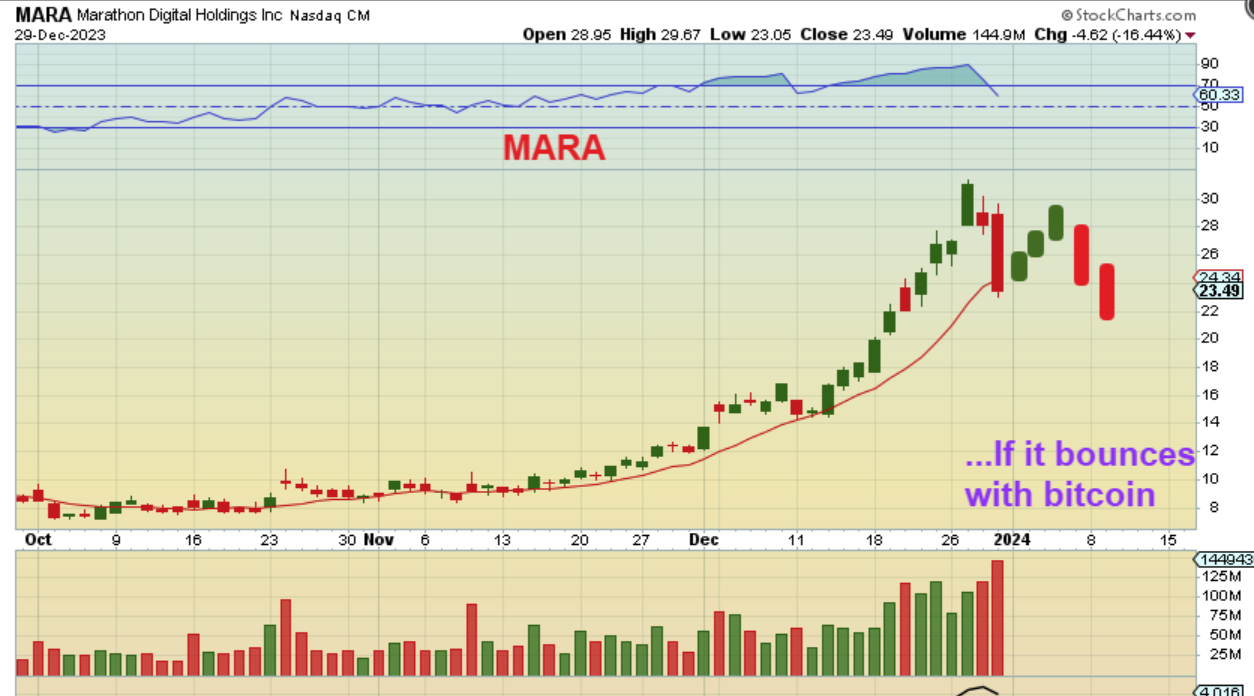
…but I have seen this happen in the past. If Bitcoin were to rally up to the $48,000 area, We may see these meander higher and they could also double top. THIS CAN BE A FALSE MOVE THAT DRAWS PEOPLE IN. Let me show you that…
.
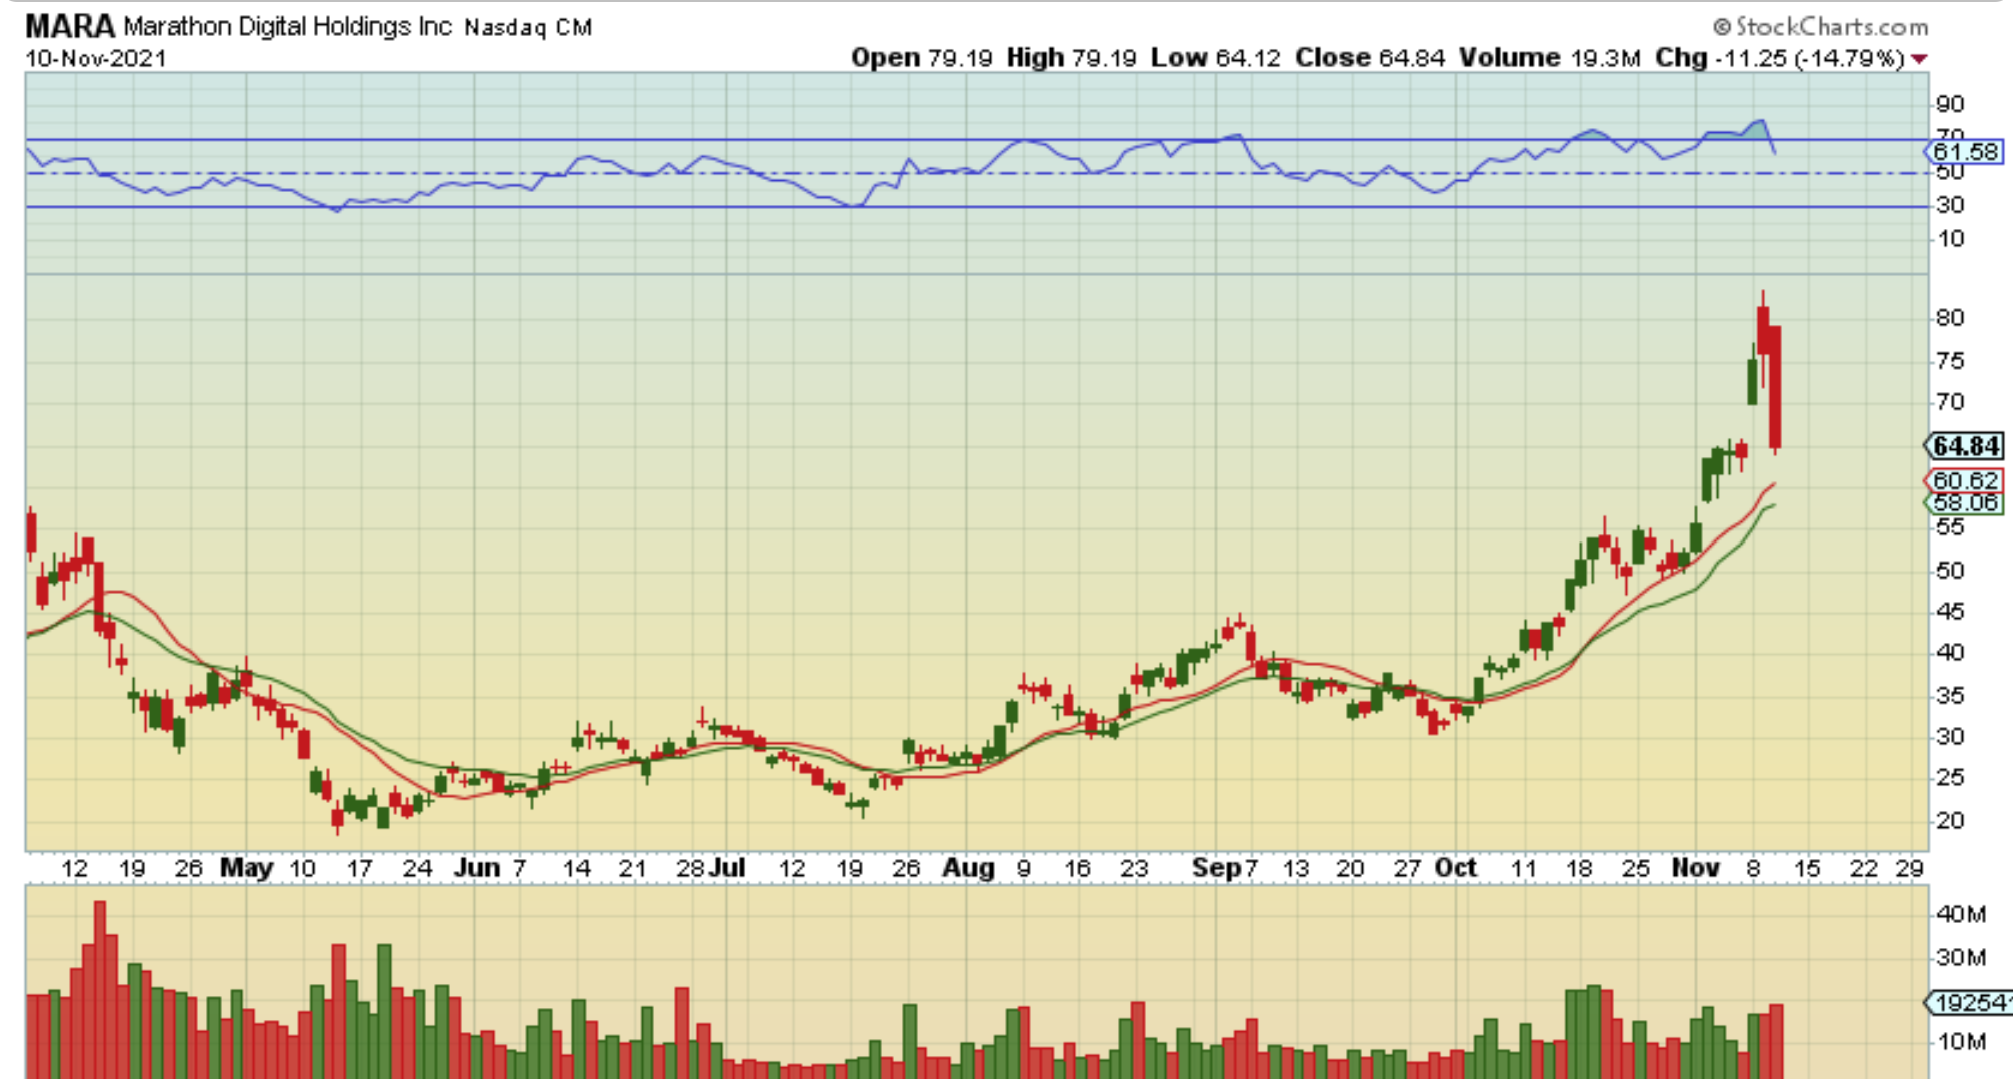
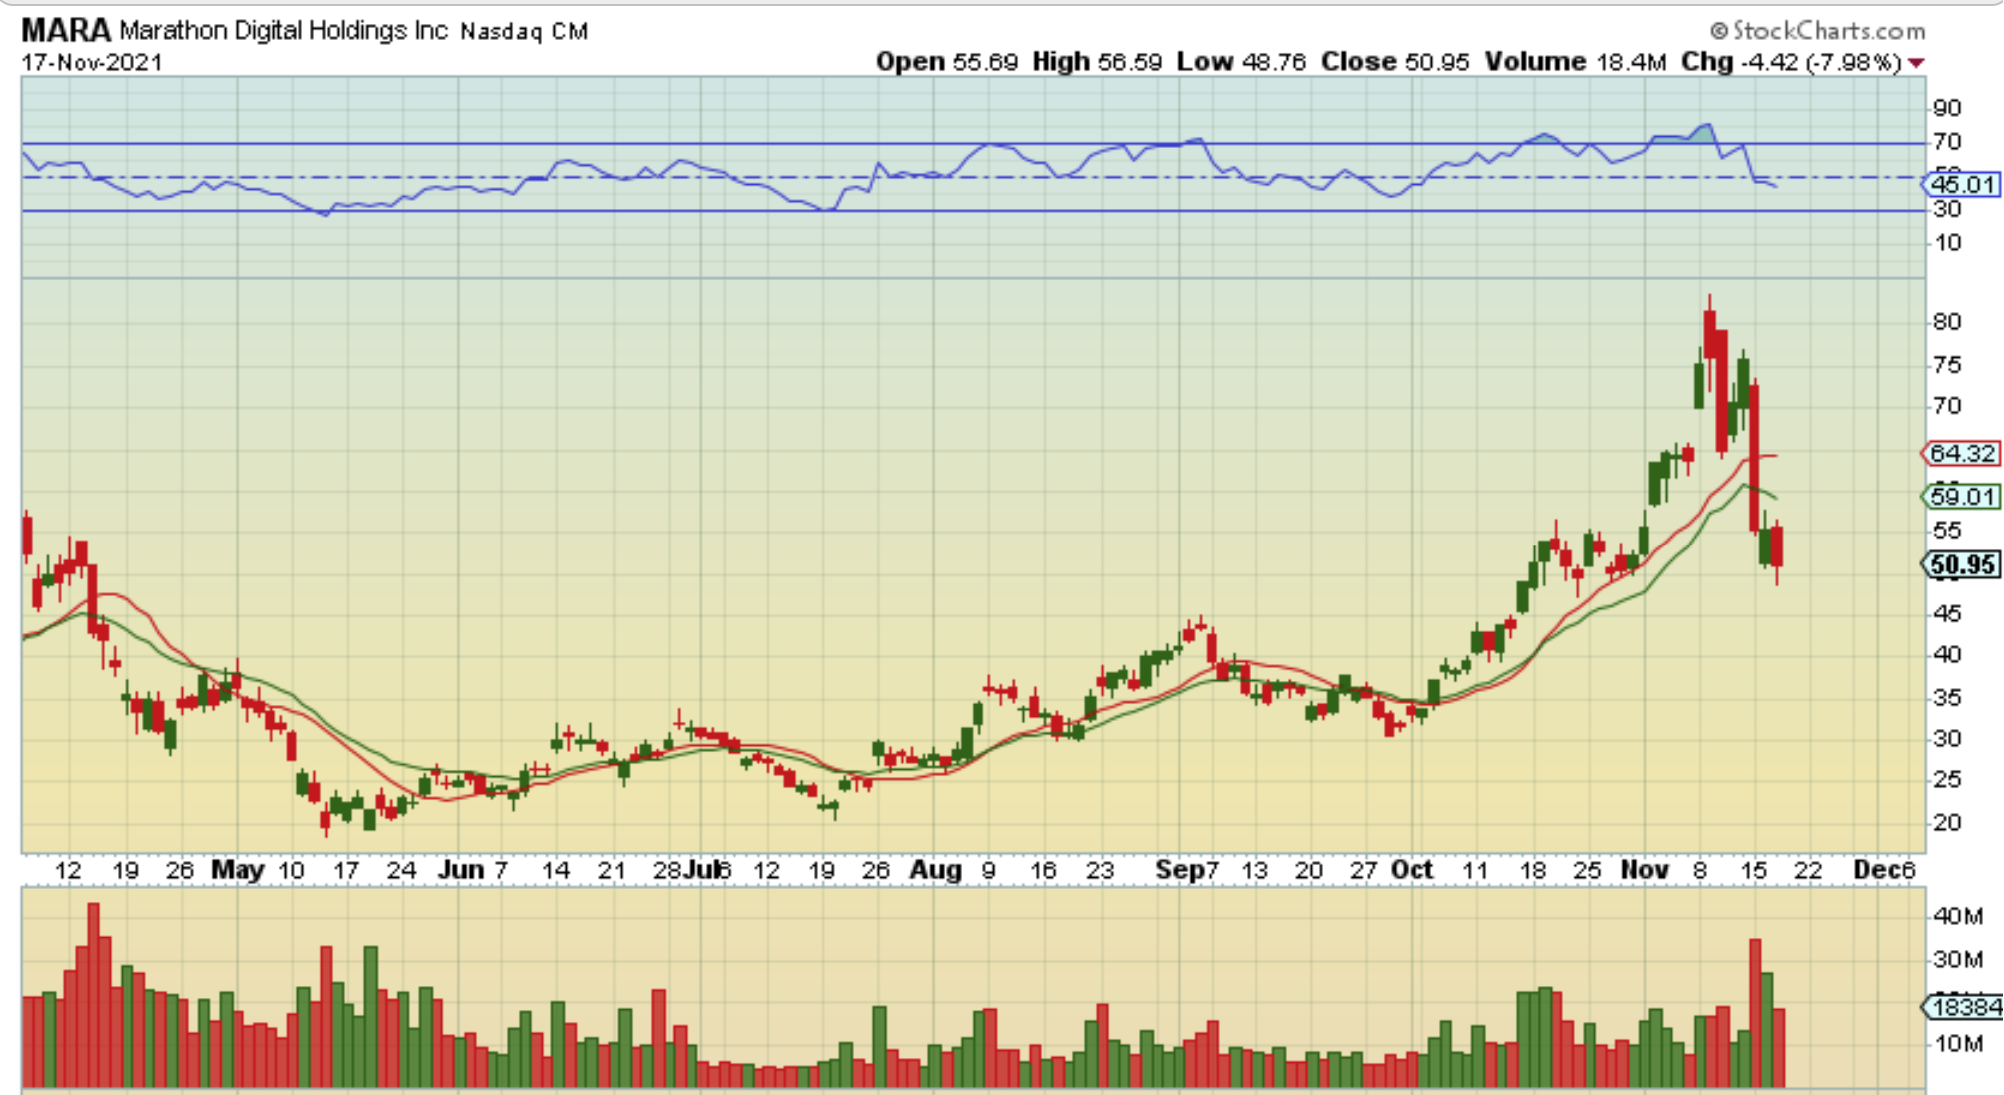
# 1 Take a look at MARA from 2 years ago on Nov 10, 2021. We saw a very similar rally that had a sharp 1 day plunge. Now if you then saw this rally continue, it might draw you in, right? Well…
#2 MARA on Nov 12, 2021: – After that 1 day plunge the rally did start up again. Let’s say that you now felt that you were missing out, so you jumped in here? Does this rally to $100?
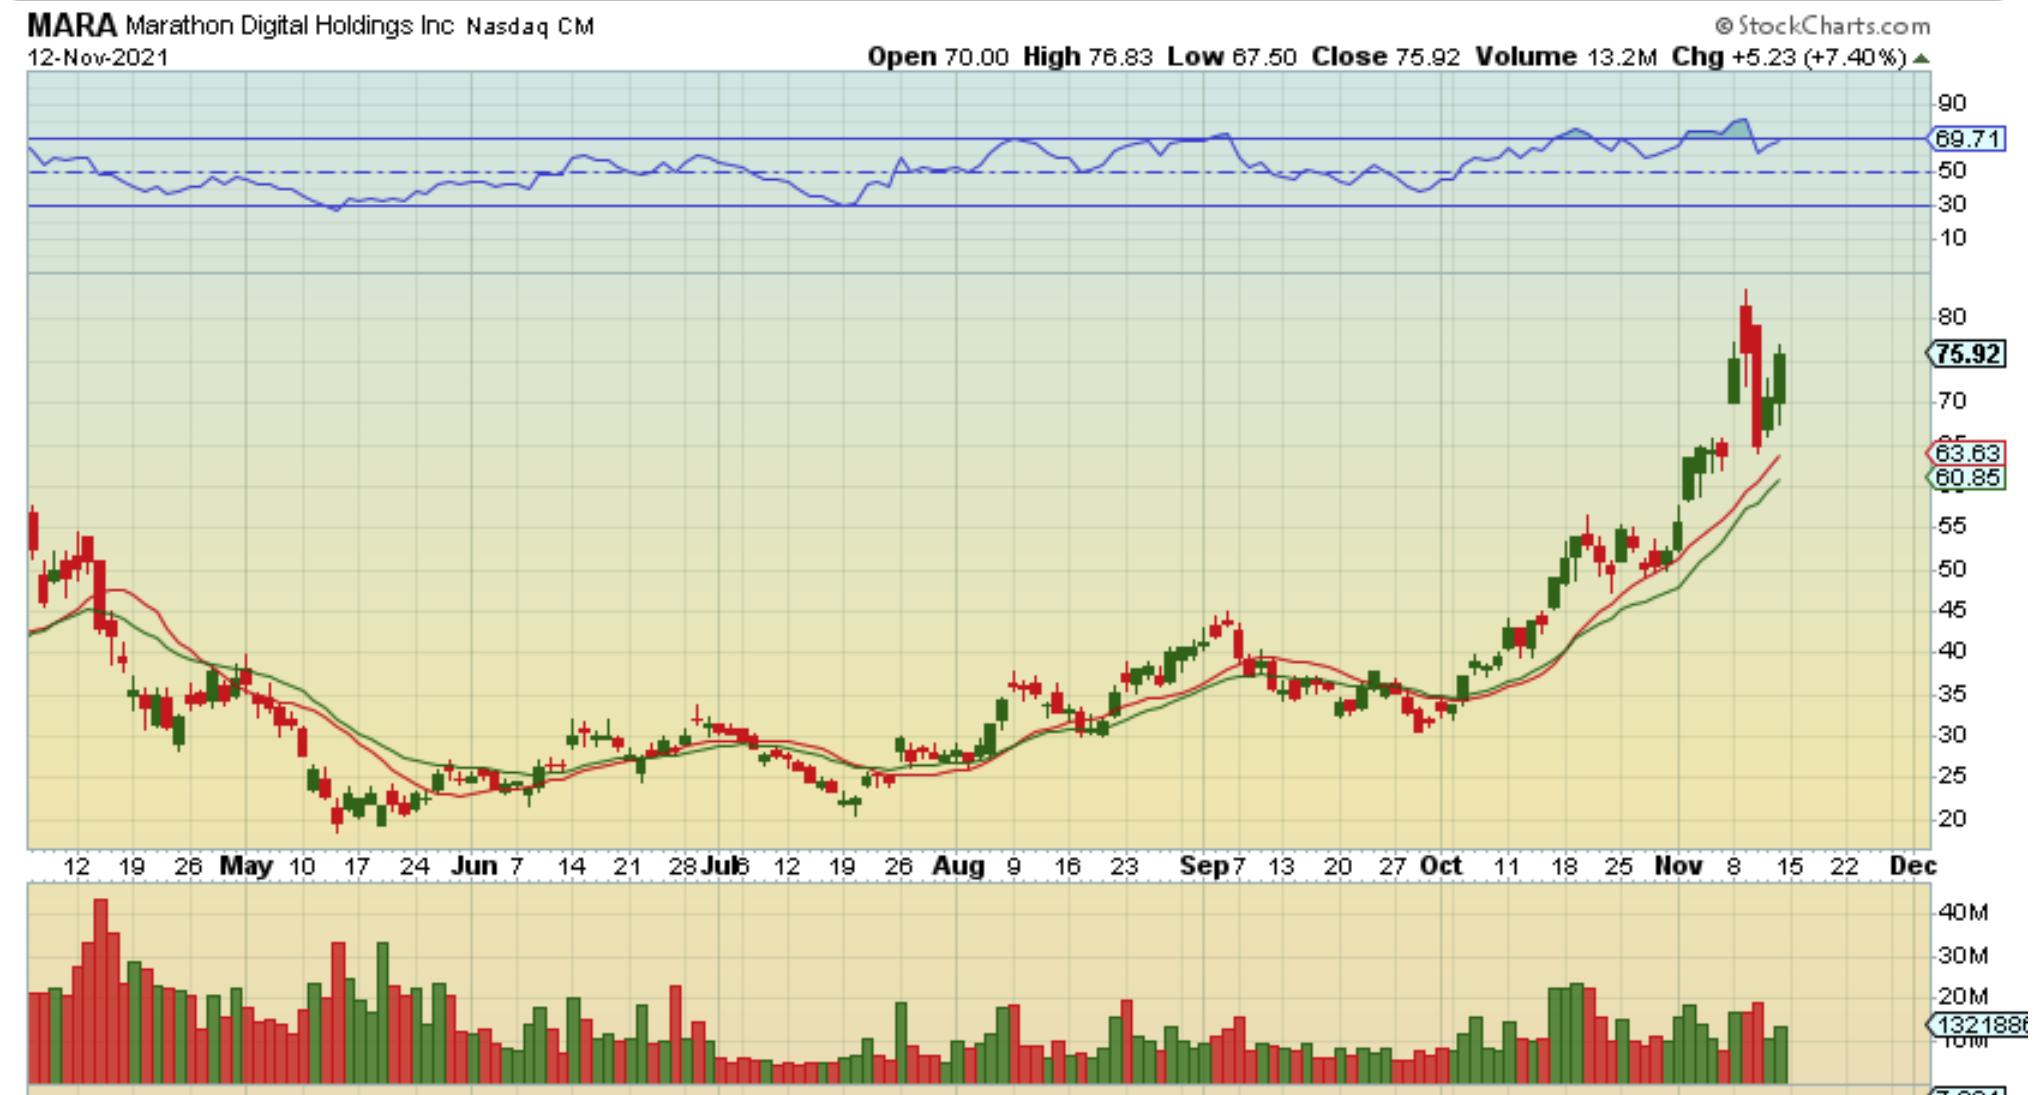
MARA Nov 17, 2021: We had an even larger crash day after that 2 day bounce. So I just wanted to point this out as a cautionary note.
.
Based on what we saw above with Mara, it may be best to just wait for a dcl or if you buy into a bounce, it might be best to keep it rather small with that dip around day 60 for Bitcoin in mind.
.
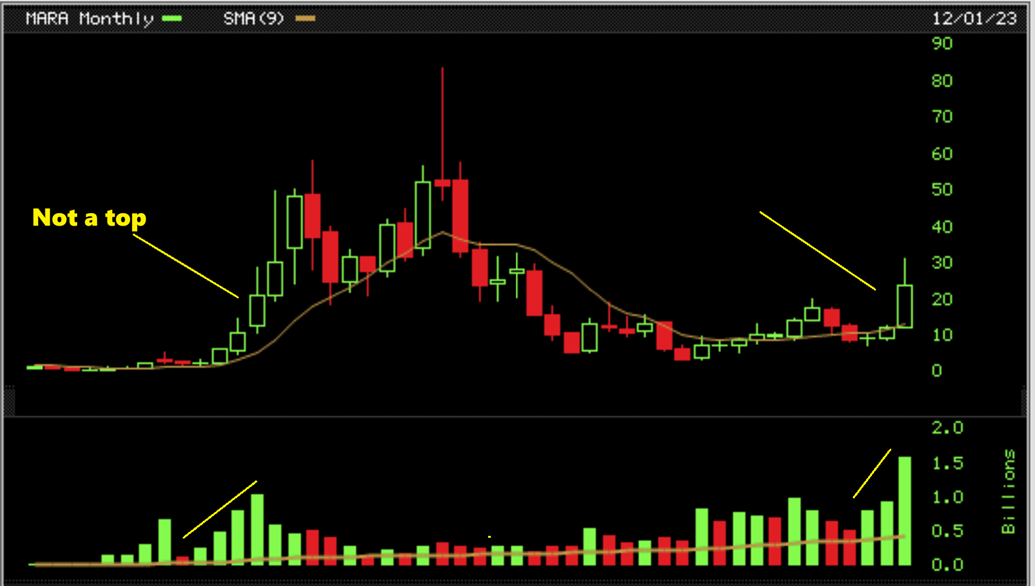
MARA WEEKLY – That is a high volume reversal candle, and those are often short term tops. It may be best to just wait for a pullback.
.
MARA MONTHLY – This candle (or actually 3 in a row) did show up on the last Bull run, and we didn’t even pause for a full month, so the candle with the wick on top on a monthly basis does not really reflect a top. Another leg up can begin after we get a dcl in place.