Friday December 29th
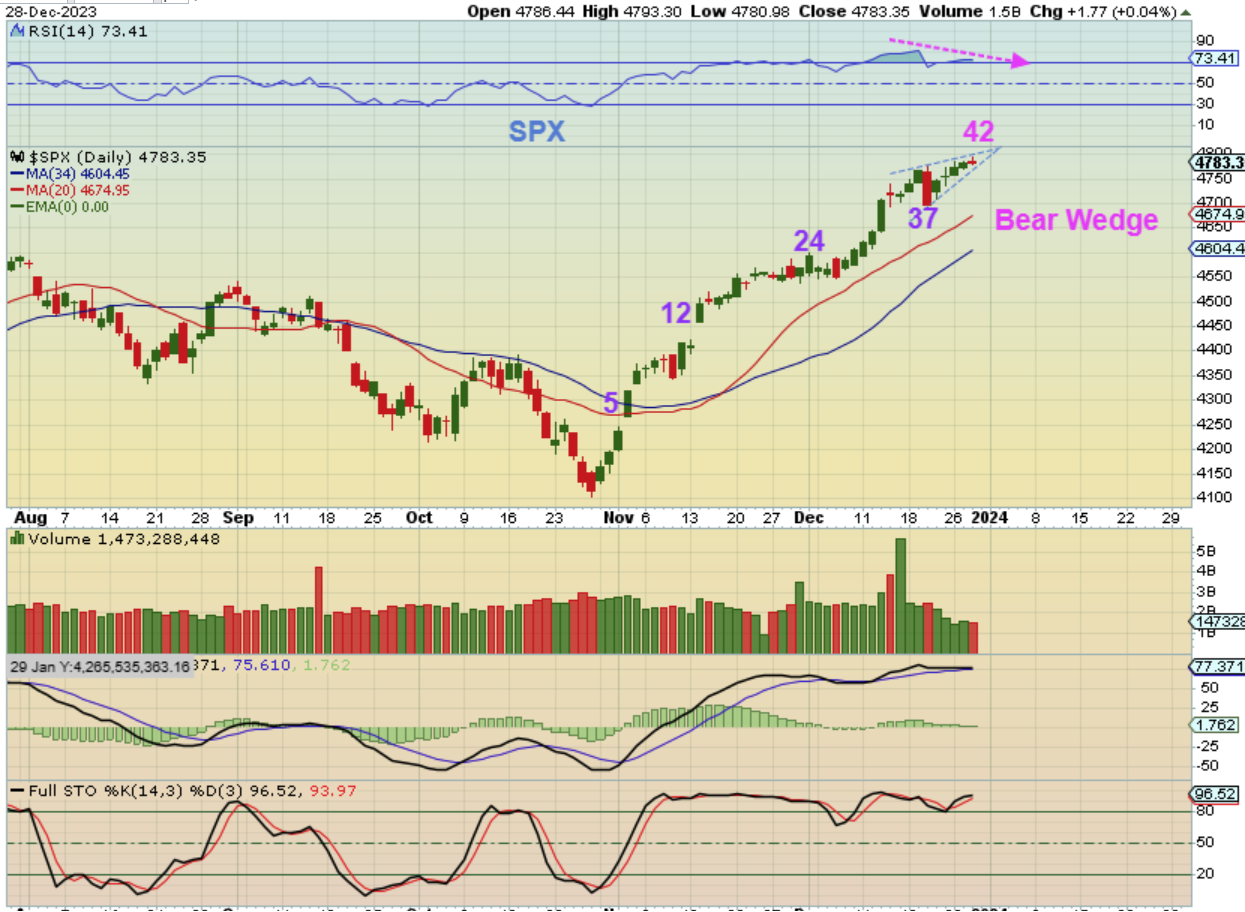
SPX – We are on day 42 and I am now seeing a rising bear wedge.
1. I have mentioned over the past couple of weeks that after the Santa Clause Rally, we could see a drop in January. Those that do not follow cycles are thinking that the markets will just take off higher and continue to run bullishly, due to ‘Fed Rate Cut Likelihood”.
2. We are very much due for a pullback into dcl, so this may pop higher and then roll over next week.
3. I may just sell everything today and, from the sidelines, see what happens as we enter 2024.
4. I DO WANT TO BUY THE DIP when the time is right. This dip should not take very long.
.
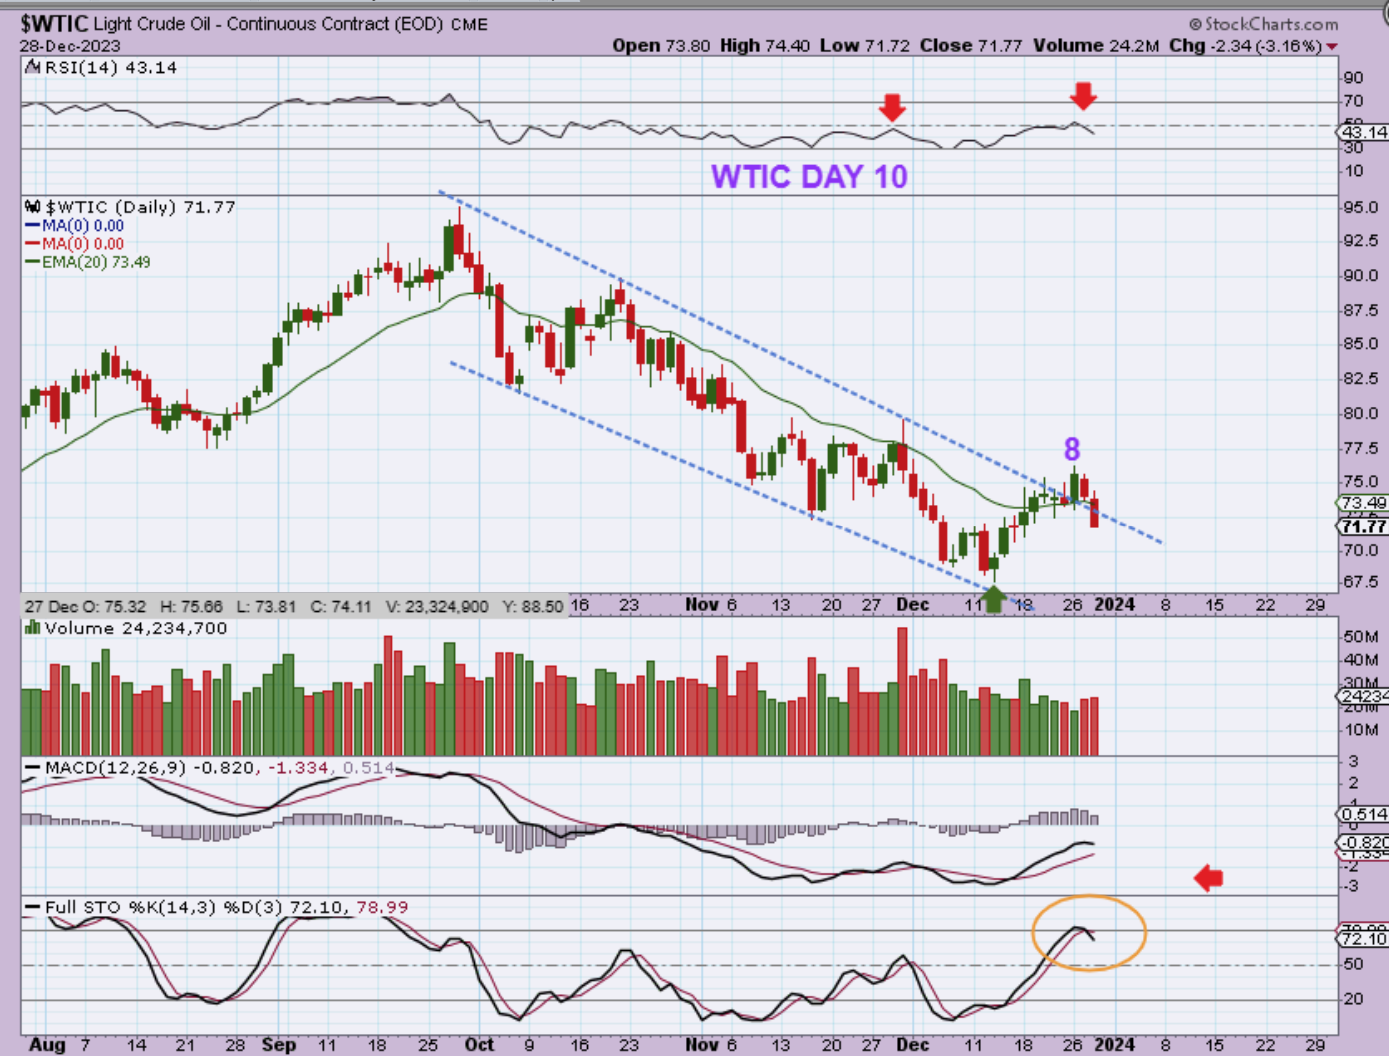
WTIC – Oil broke out from the downtrend and the 20ema this week, but it fell back below both areas on Thursday. We do see this Happen with Oil at the lows. Oil often drops back down to test the lows and then runs higher, but to be honest, I was surprised to see this since I also see the oil stocks looking good.
1. It is only day 10 of maybe 45-50.
2. The bad news would be that an ICL did not form, but a final dcl formed and this makes new lows.
3. We may still just test the lows or do a 50% dip of the run out of the recent lows.
,
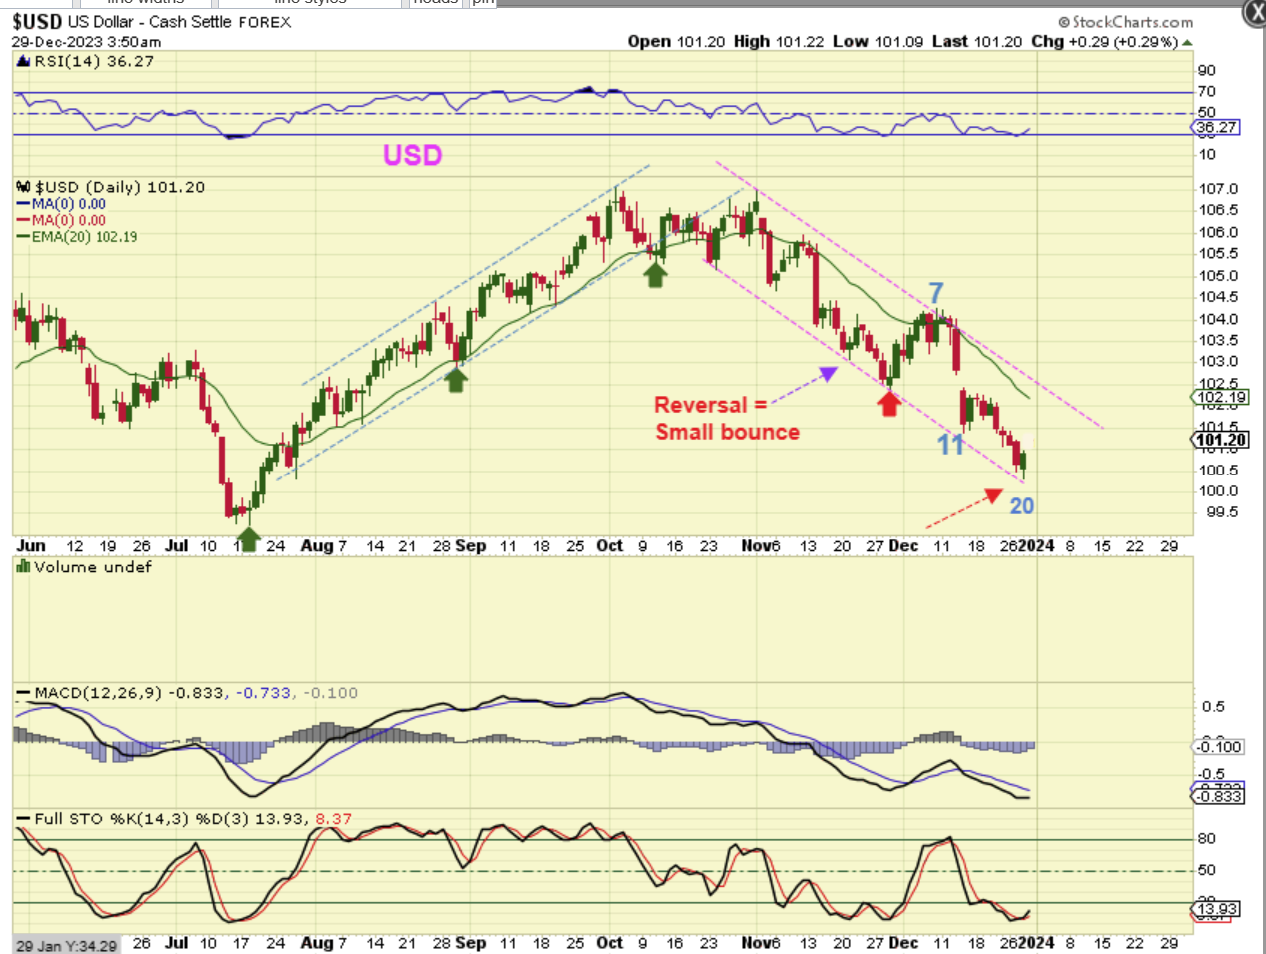
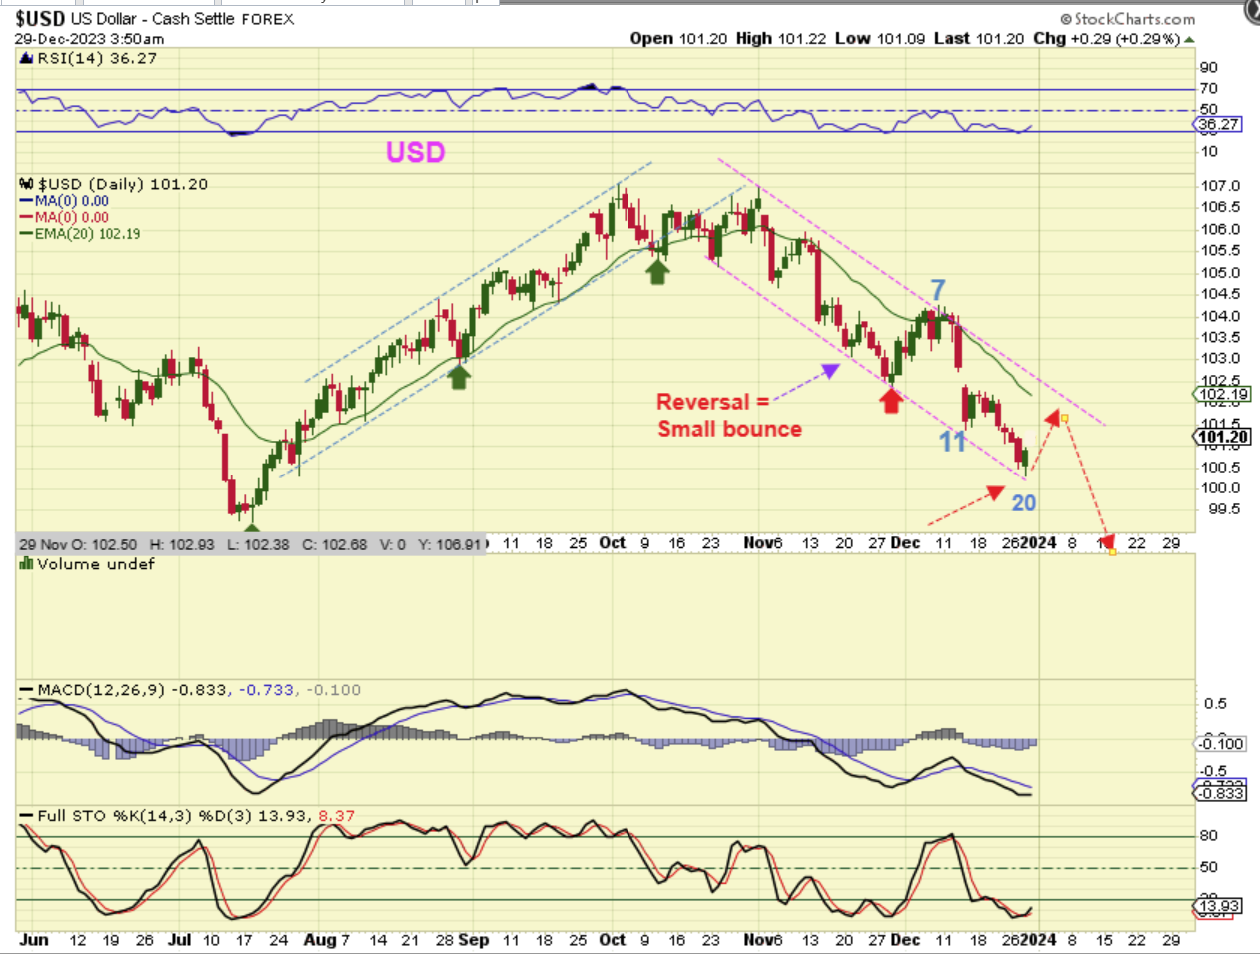
The USD put in a reversal. If this bounces here, it could weigh on the General Markets and The Precious Metals Friday. Let me discuss the USD further…

,
I am seeing 2 thoughts of explanations here to the USD reversal:
.
1. The USD could rally out of a day 20 as a day 20 dcl and run, but also noteworthy is the fact that…
2. The last 3 daily cycles have been extremely long for the dollar (green arrows). Is this one going to be a long one too? If so, we could simply have a small bounce & drop, similar to that reversal that I have the purple arrow pointing to. So…
,
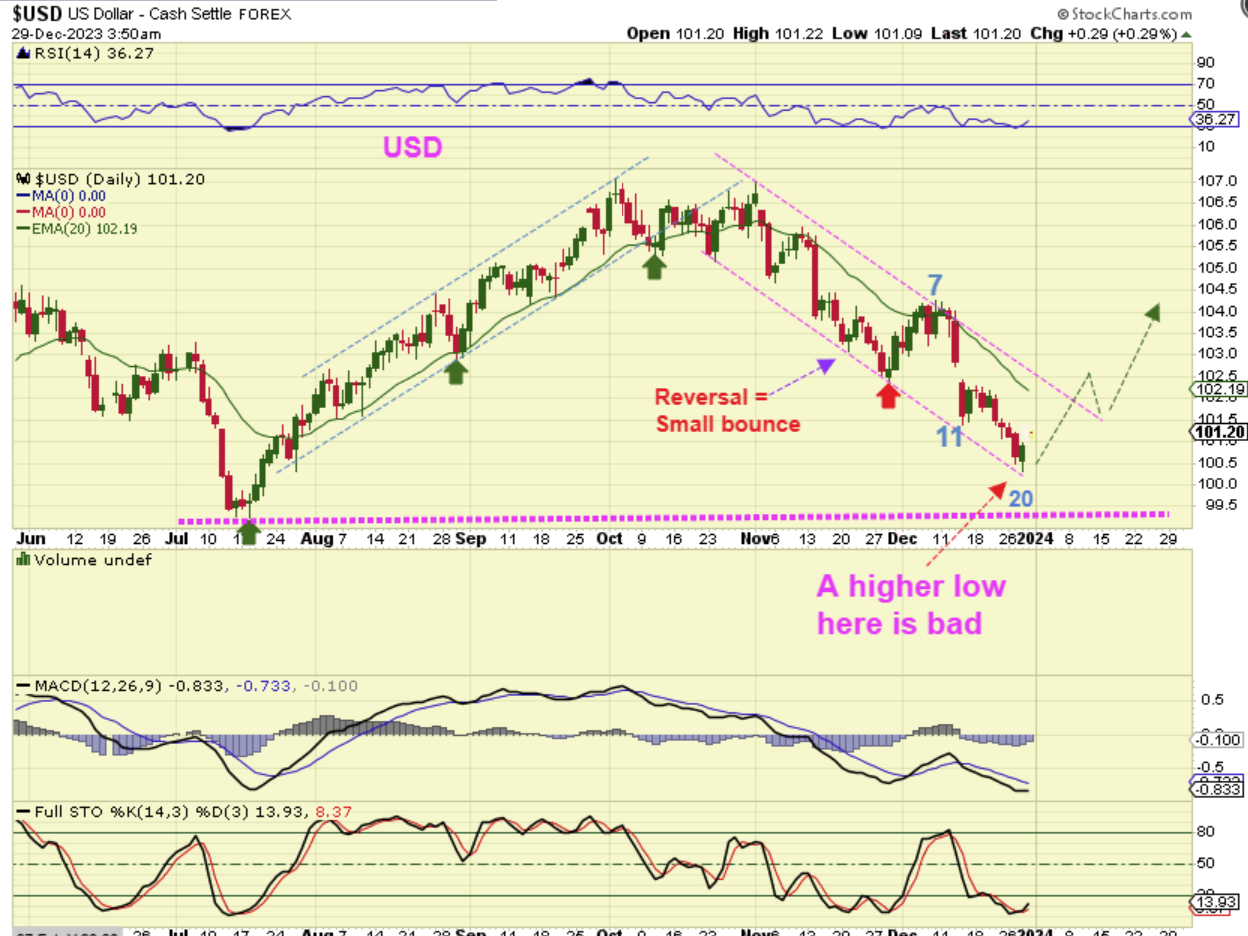
USD – If we just do a small bounce like we did at that purple arrow and then drop, we would see a pop and drop for the USD into 2024. I drew that here.
.
USD – If, however, this is a dcl, then it could bounce and show signs of strength. We (or I) will need to watch for that going into January.
.
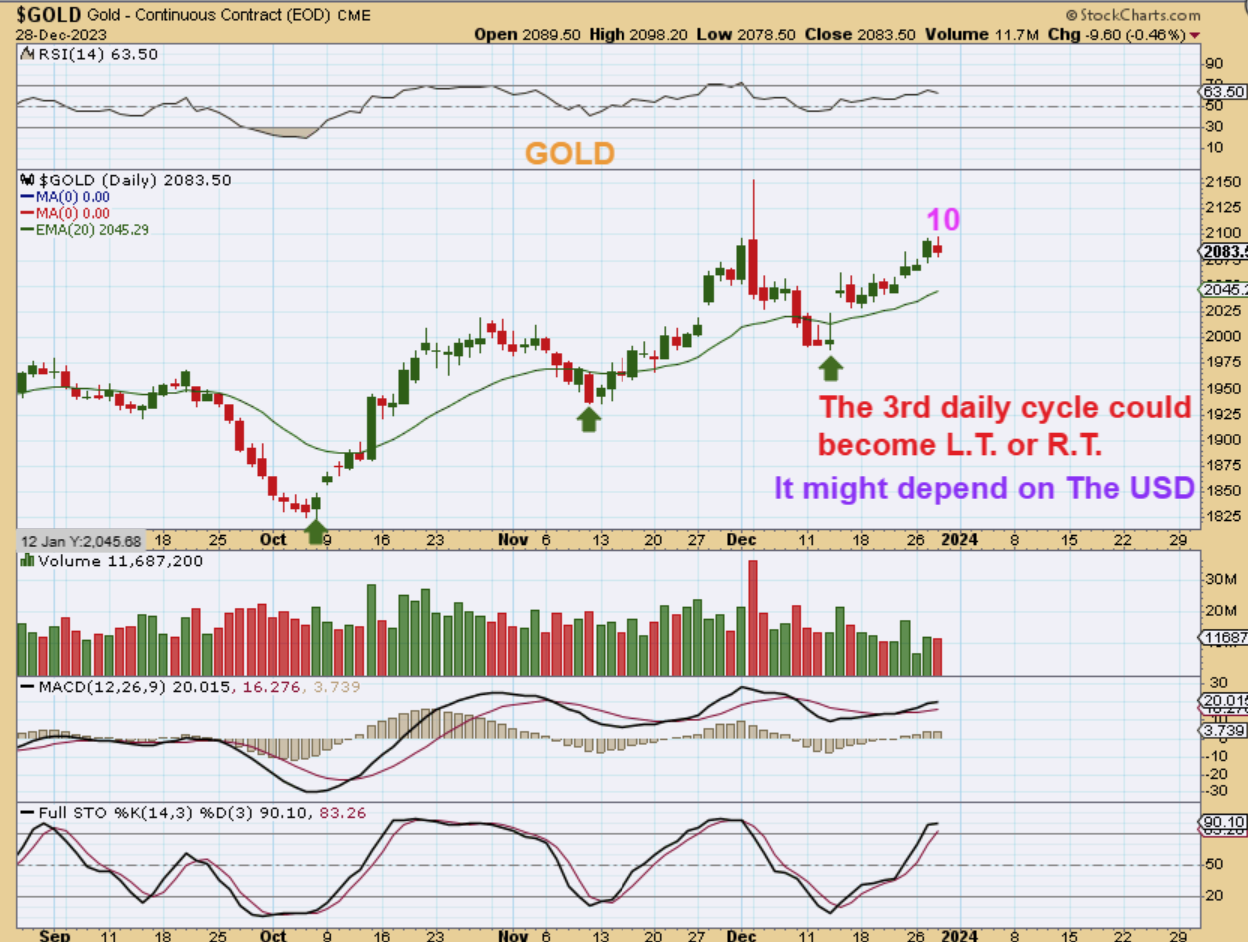
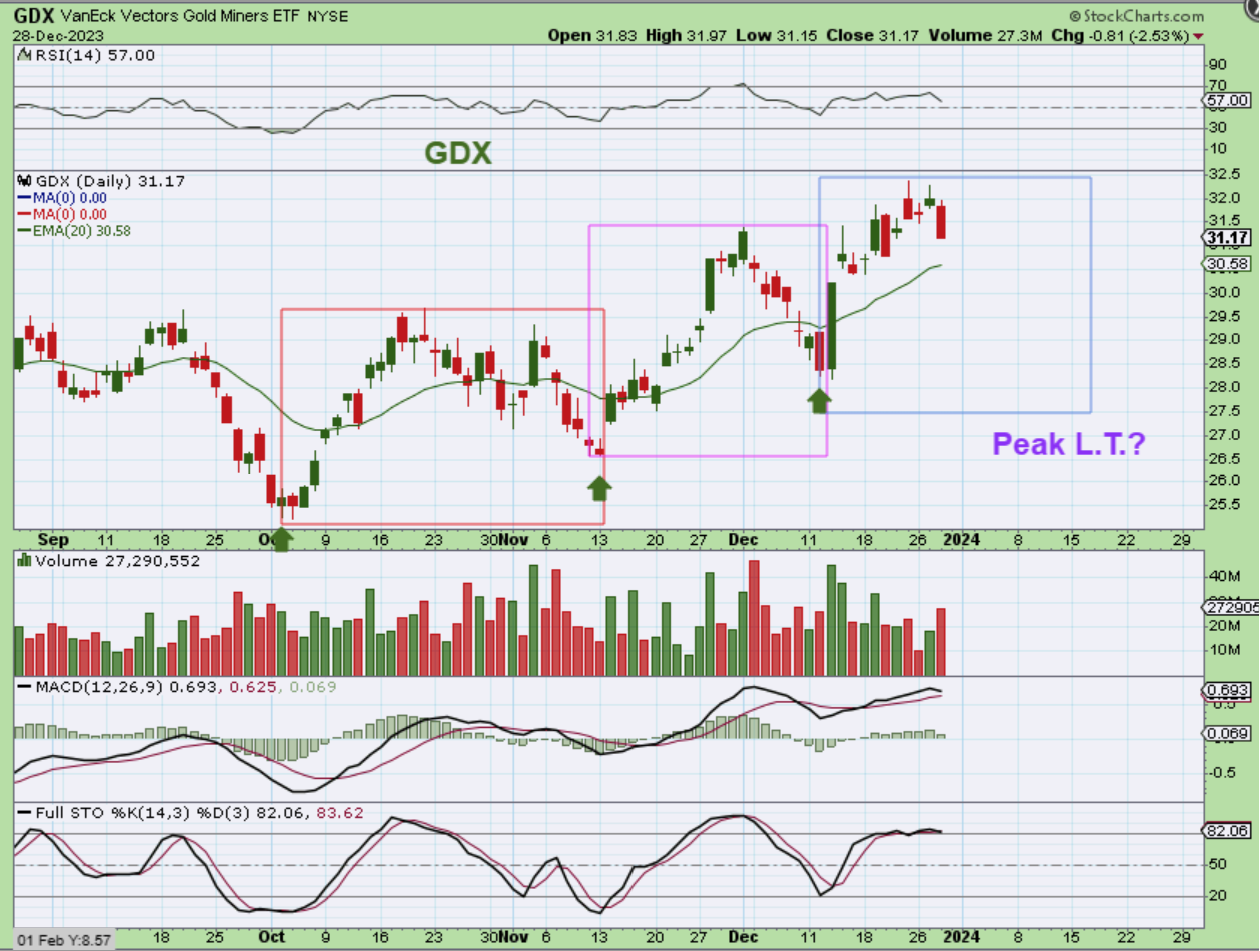
GOLD has peaked on day 10 so far and it is often right around this time that a L.T. daily cycle peaks, so we need to be aware of that. The good news is that we had that exhaustion candle at all time highs and price did not quickly flush lower, we are still meandering up toward those highs. That is bullish when it comes to the overall big picture. Please read the chart, Gold may peak here or still move higher next week, but…
.
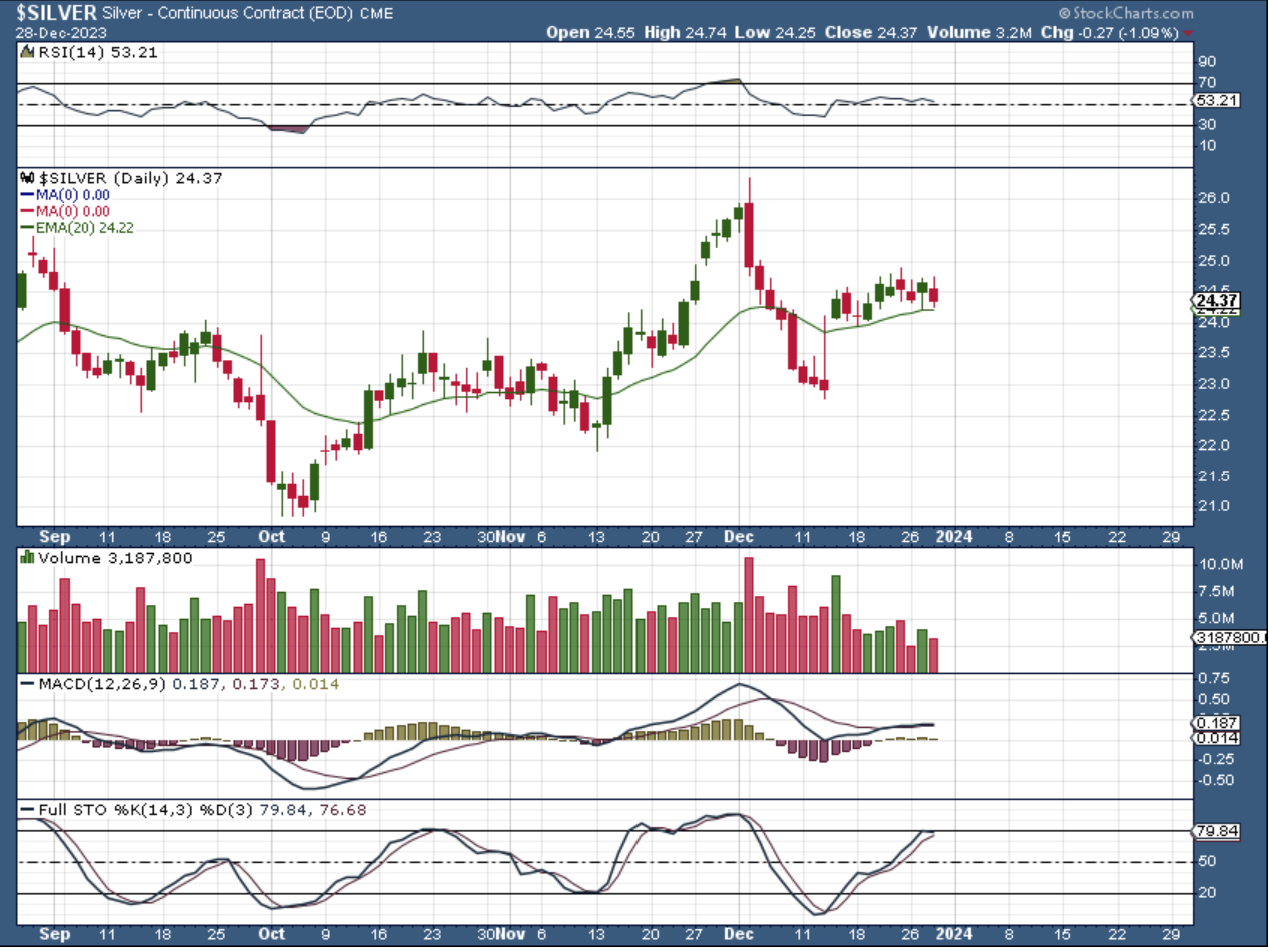
SILVER and the Miners seemed to act weaker than Gold yesterday, as Gold continued to push higher toward those all time highs. Silver was down…
.
And The GDX ETF was down even more, down 2.5%. Volume increased on the selling too. This is adding to the possibility that the 2nd daily cycle was Golds exhaustion candle ‘peak’, and this may be a L.T. 3rd daily cycle as the ‘peak’ for Miners. I discussed this in the last weekend report. I feel that this intermediate cycle may have peaked already and now it’ll be choppy near the highs before the next ICL forms as a higher low ICL again. The break out to even higher all time highs would follow, but that wouldn’t be until maybe Feb or March 2024.
.
Today is Friday and it is the last trading day of the week before a 3 day weekend. The way things are set up, we could start 2024 in a way that many may not expect and that is with the General Markets peaking and then ‘selling off’. We also want to be aware of the fact that we are in the 3rd daily cycle for Precious Metals too. If it is going to form as Left Translated, it too could have already ‘peaked’ and may get choppy as it becomes caught up in the general market selling. Finally we have Bitcoin and that can be tricky. Why? Today would be day 45 so on average we could have 15 trading days left. That can be 3 weeks, so that seems ok, but 3 of those days will be used up over the 3 day weekend, so Tuesday is day 49. How do I want to be positioned on day 49 when I am expecting a possible sell off in the General Markets sooner than later? That is up to you, but I think that for me I want to lighten up going into this long weekend rather than loaded up on Crypto Stocks.
.
Have a great weekend and I will have the weekend report, but it will be out later on Sunday or even Monday morning. Enjoy your Friday trading!
.
~ALEX
.
BITCOIN:
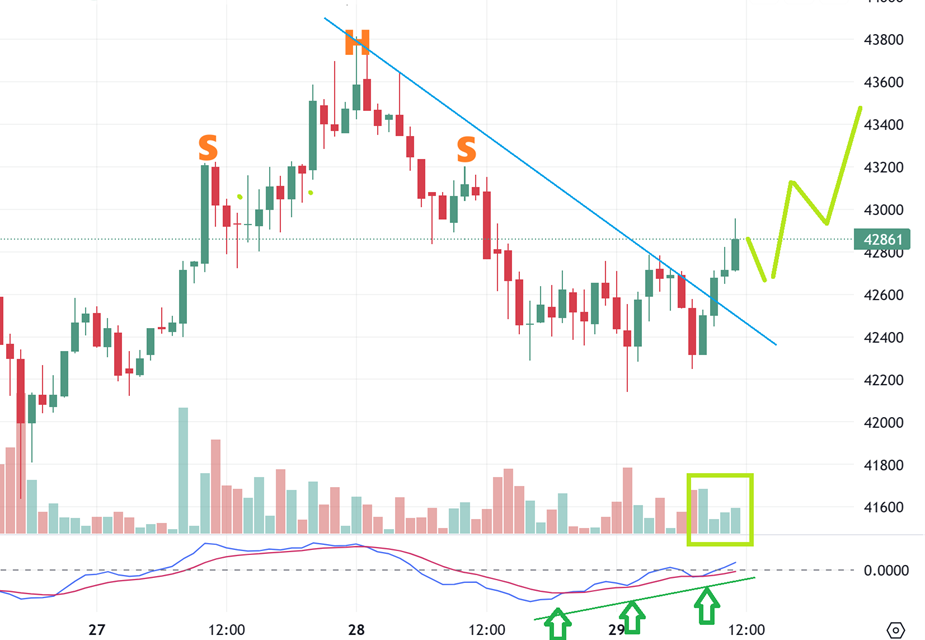
I was calling for a possible A-B-C drop yesterday due to this H&S pattern that I found on an hourly chart. I said that it might take hours to play out, because this was a 1 hr chart. Thursday could be a ‘down day’ for Crypto stocks. Next…
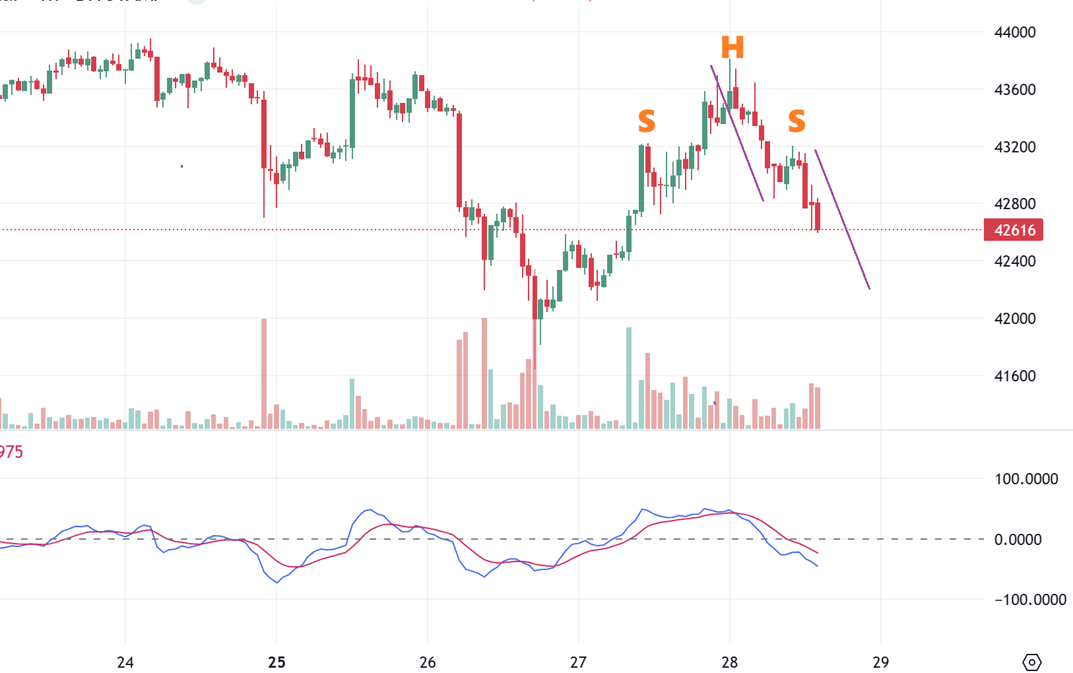
I watched for a couple hours and then asked, “Is The BITCOIN A-B-C Drop Complete?” I mentioned that for me this could be a ‘buy’ with a stop reversal candle. One final thought was…
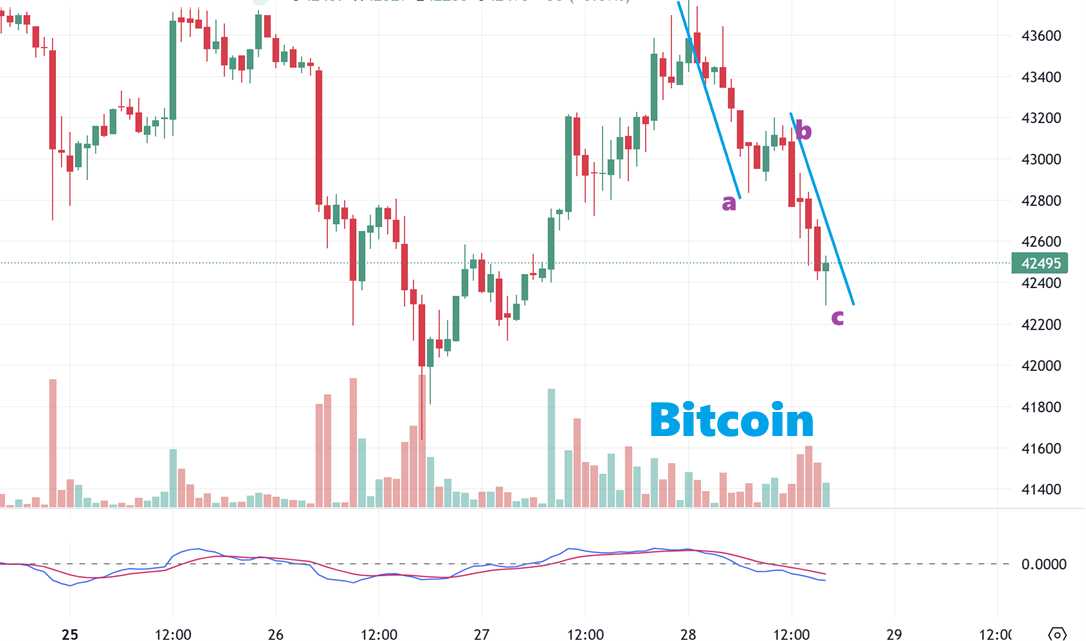
One final thought or concern was what if we saw a BITCOIN dip with 5 waves down, that low could be broken.
So what I would be hoping for at this point is a BREAK OF THAT DOWNTREND LINE. It looks as though a push above $42,700 would be a good start. This all took place on Thursday, so where are we now?
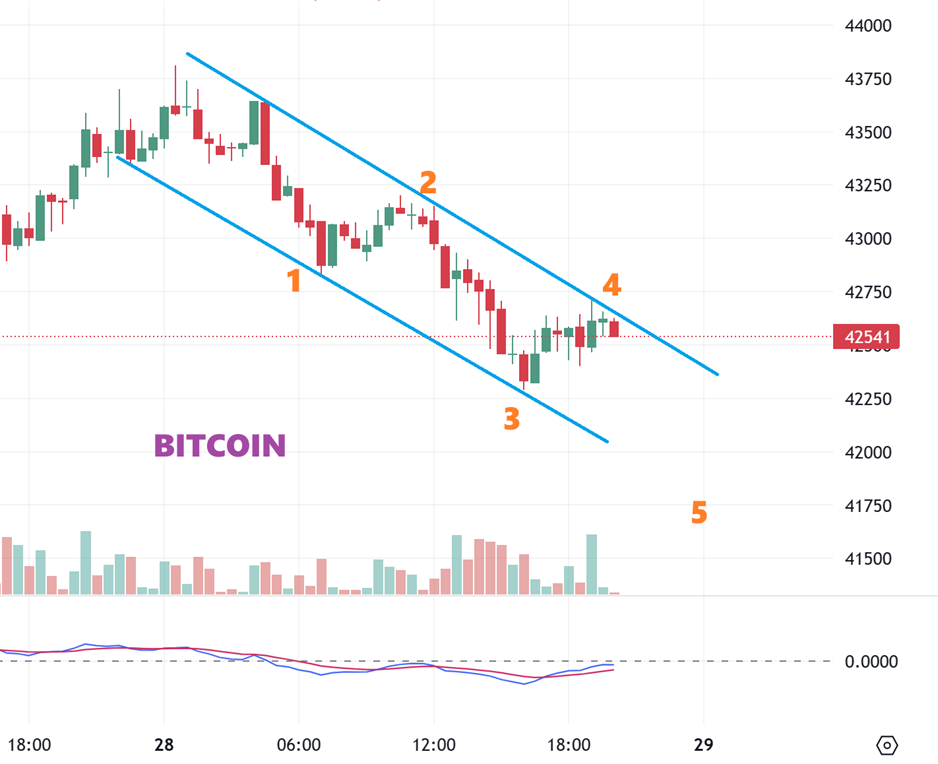
BITCOIN Live Friday 6 a.m. ET: I drew an even wider downtrend due to the choppiness that took place at the lows and it still looks clear that the downtrend is broken and that selling should be done for now. Hopefully we go out this Friday (or this week) with upside gains on the crypto stocks.
BITCOIN DAILY: There is no way to guarantee that this will break out bullishly higher, it may even become a ‘double top’ if it doesn’t push higher soon, but I have had a target above at $48,000 and then $52,000 as a possibility. This has taken longer than I expected and it would be nice if it runs to $48,000 by maybe day 53 and then starts a dip into a dcl. That time frame leads us into late next week.
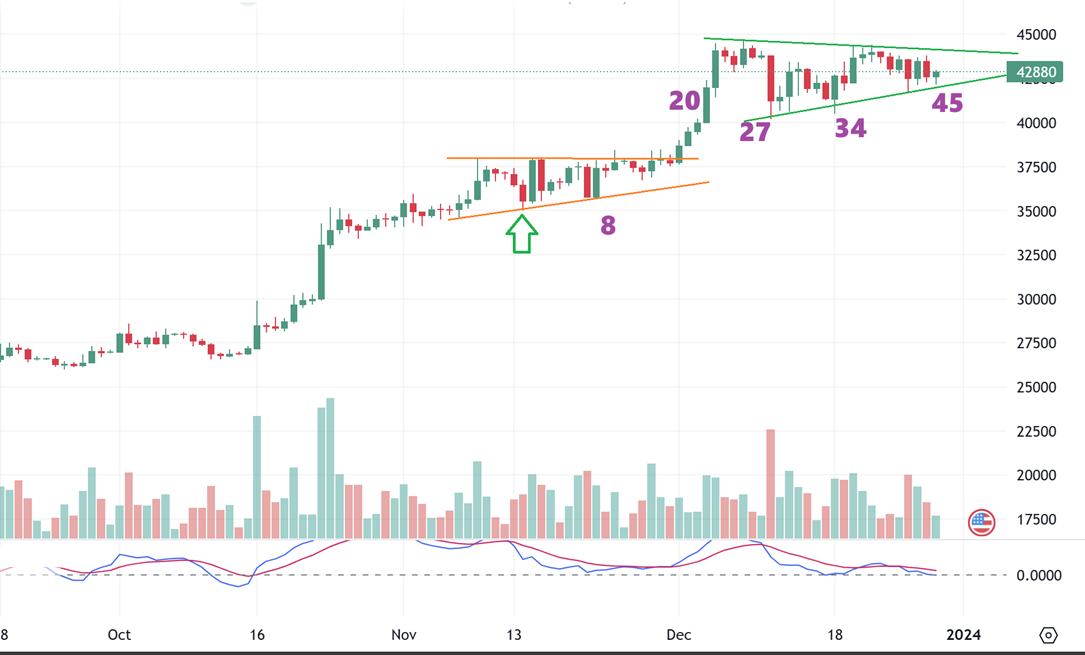
Sidenote: This can repair itself, it still can break out higher to $48,000 and then roll over, but I mentioned that double top possibility because I noticed that the MACD is weakening on that last drive higher. 🙁 I am not letting this hinder me, because this can break out with divergence and then roll over as the ‘peak’ of this 60 day run.
.
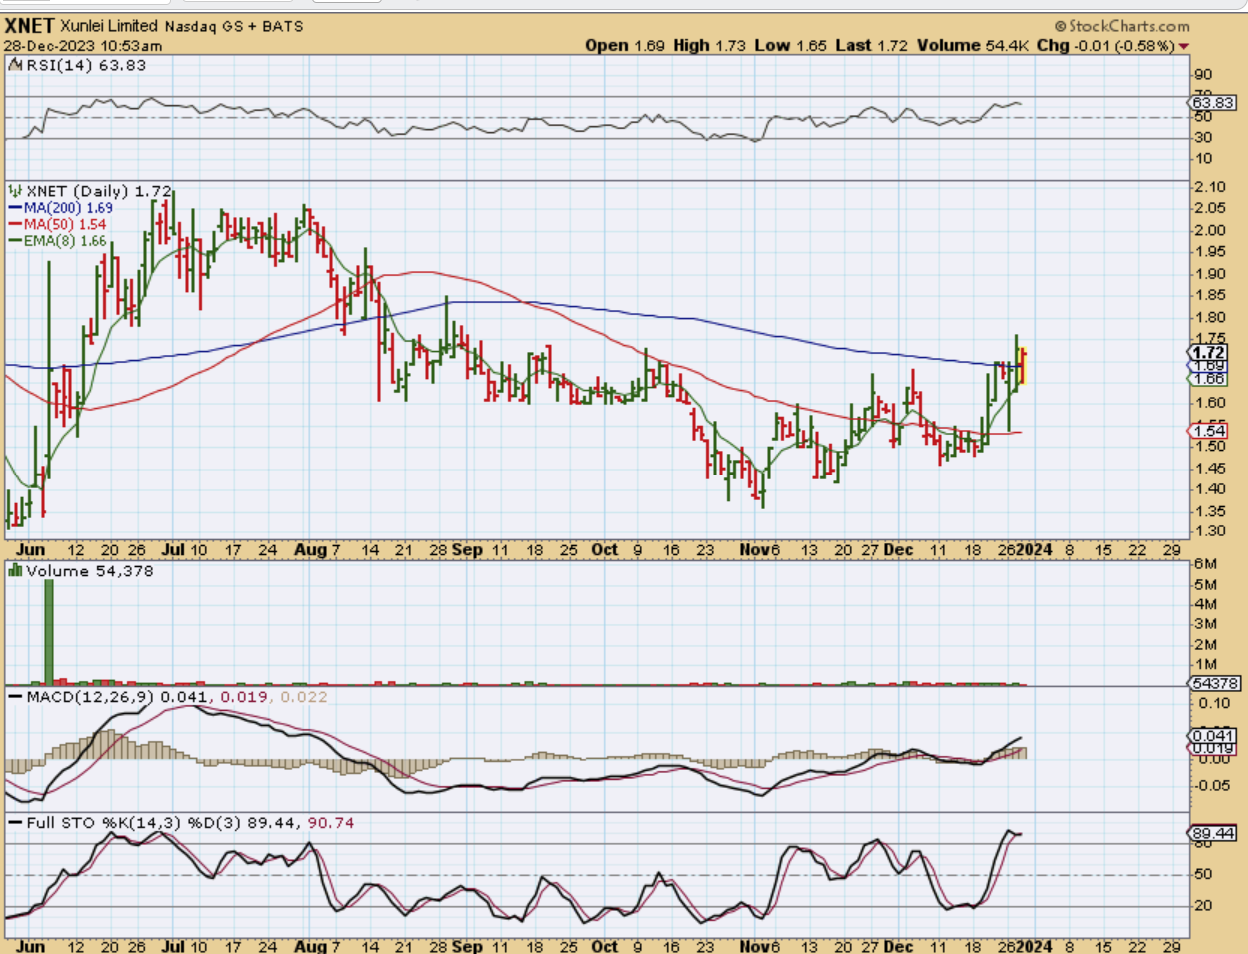
I HAD CRYPTO STOCKS IN YESTERDAYS REPORT, YOU CAN GO BACK THERE FOR MORE INFO. IT INCLUDED XNET:
.
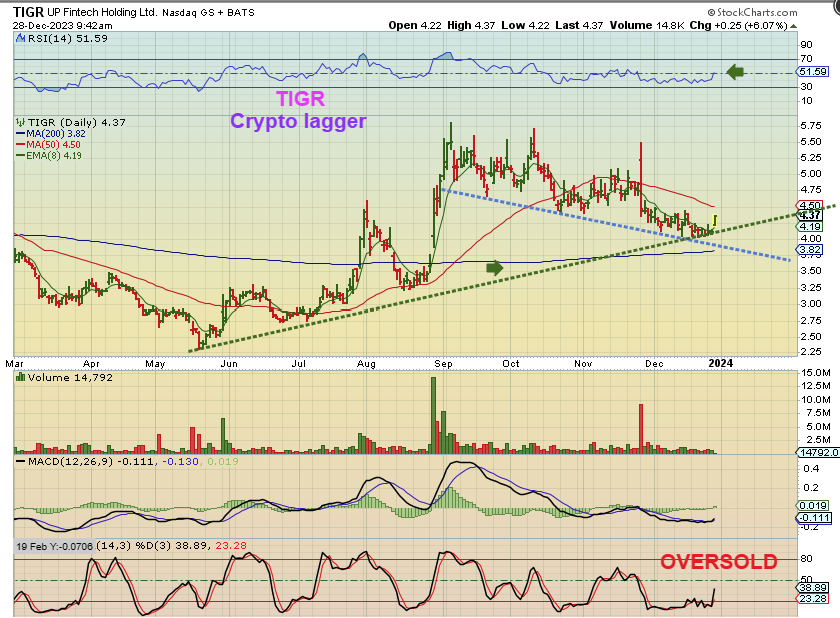
I simply wanted to show this stock again as a possible lagger. It used to trade quickly higher when Bitcoin ran, but it didn’t on this recent run. It is now trying to break out above the 50 % 200sma, so it is a ‘buy’ or at least one to watch.
TIGR was also a runner with the crypto sector in the past