December 17th Weekend Review
This was a Fed Week, and the decision to leave rates alone and then possibly even rate cuts coming in 2024 caused a very bullish reaction in the General Markets and Precious Metals markets too. Let’s take a look at the charts!
.
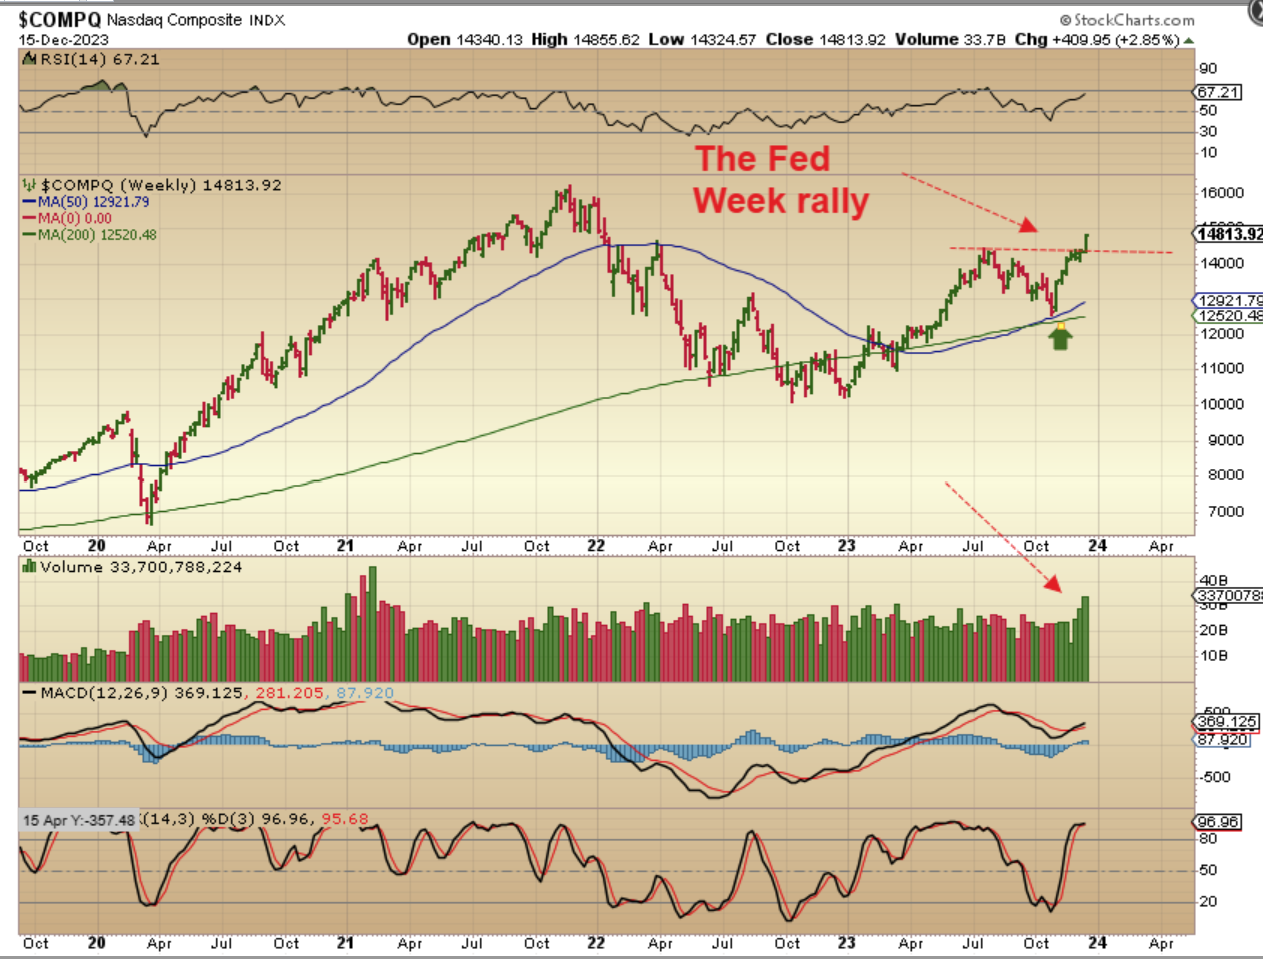
NASDAQ WEEKLY– The Fed Week reaction was a breakout week to new 2023 highs. This is the first daily cycle out of an ICL, so this should rally even higher and the next DCL is a ‘buy’ or ‘add’ to positions.
.
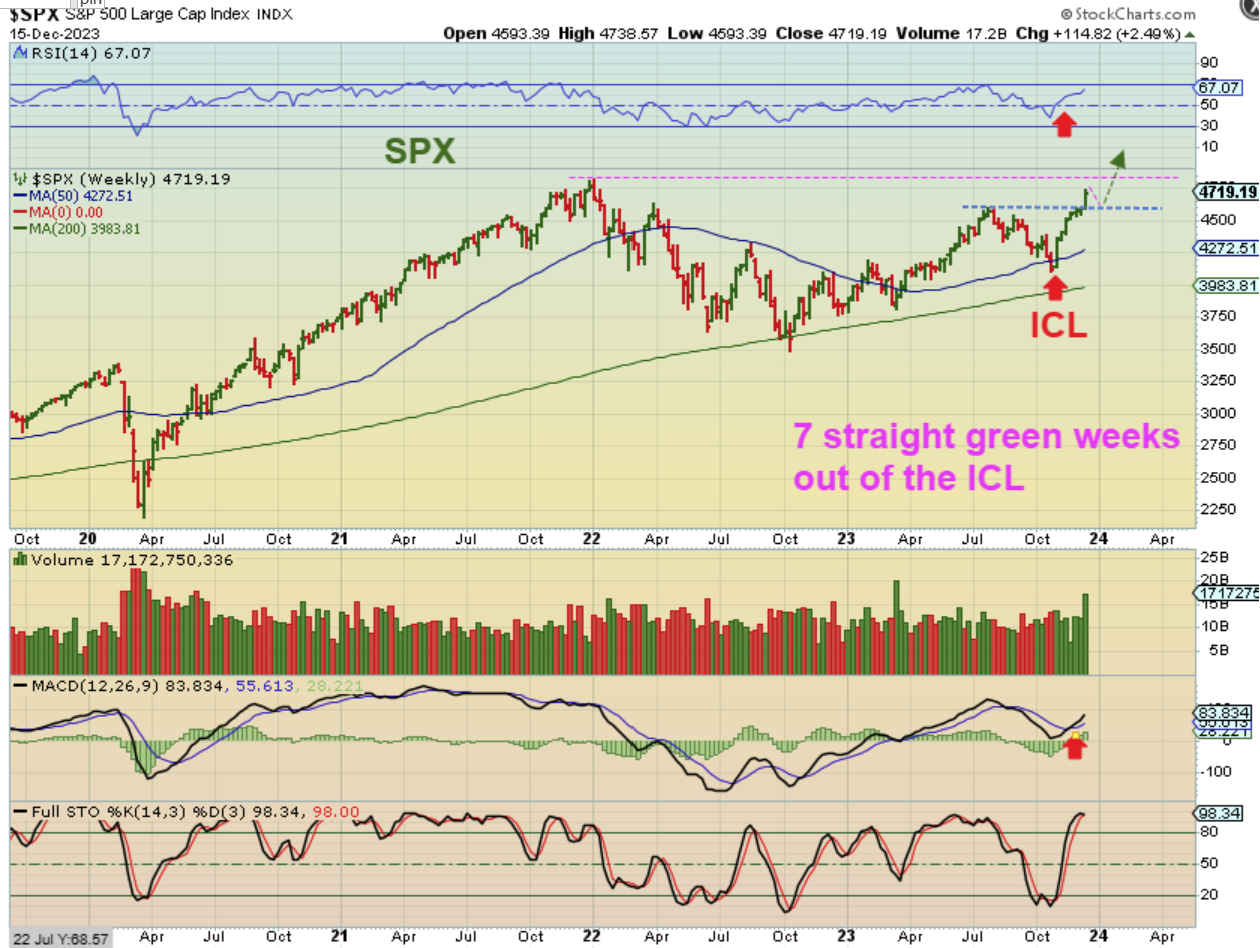
We see the same with the SPX. A Fed Week breakout to new 2023 highs and 7 straight weeks of gains since the Fed hinted in the Novembers meeting that inflation seems to be more under control and no hike was needed. I drew a possible dip and continuation on this chart because…
.
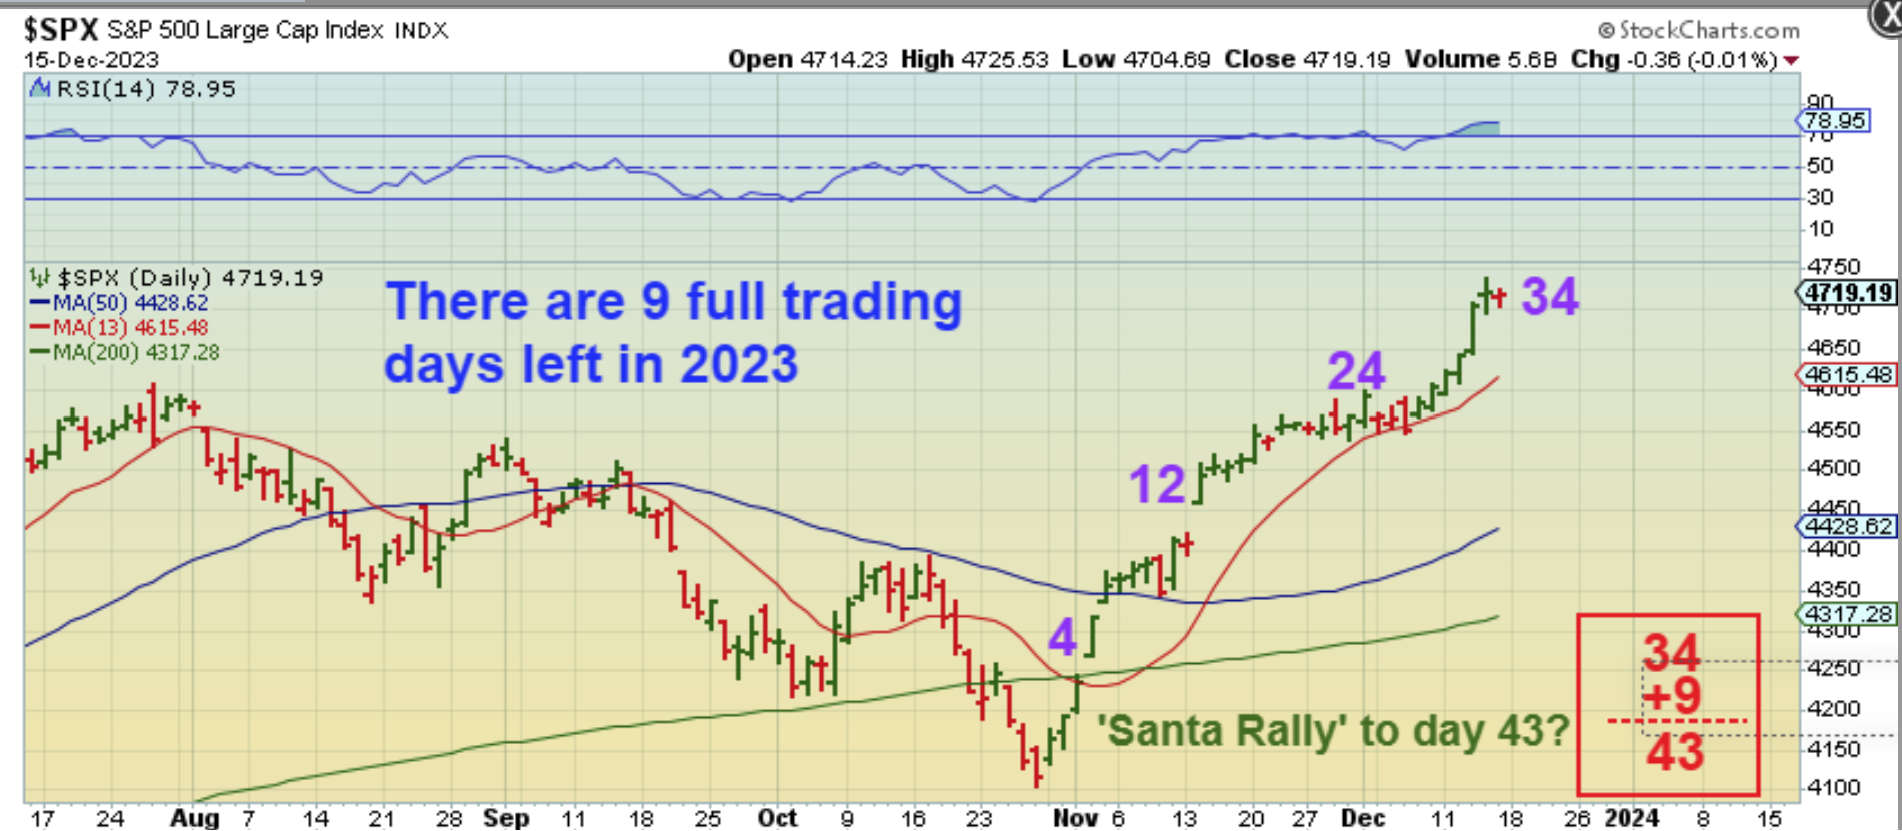
SPX DAILY is on day 34 – USUALLY we get a drop lower around now that leads to a dcl. I was thinking about that ‘Santa Rally’ phenomenon and I wondered:
” With 9 trading days left in the year, could this possibly rally right into the year end and then see a dip into a dcl in January?” The answer is that it could. That would get us to day 43, and it cannot be ruled out as a possibility. See the chart.
.
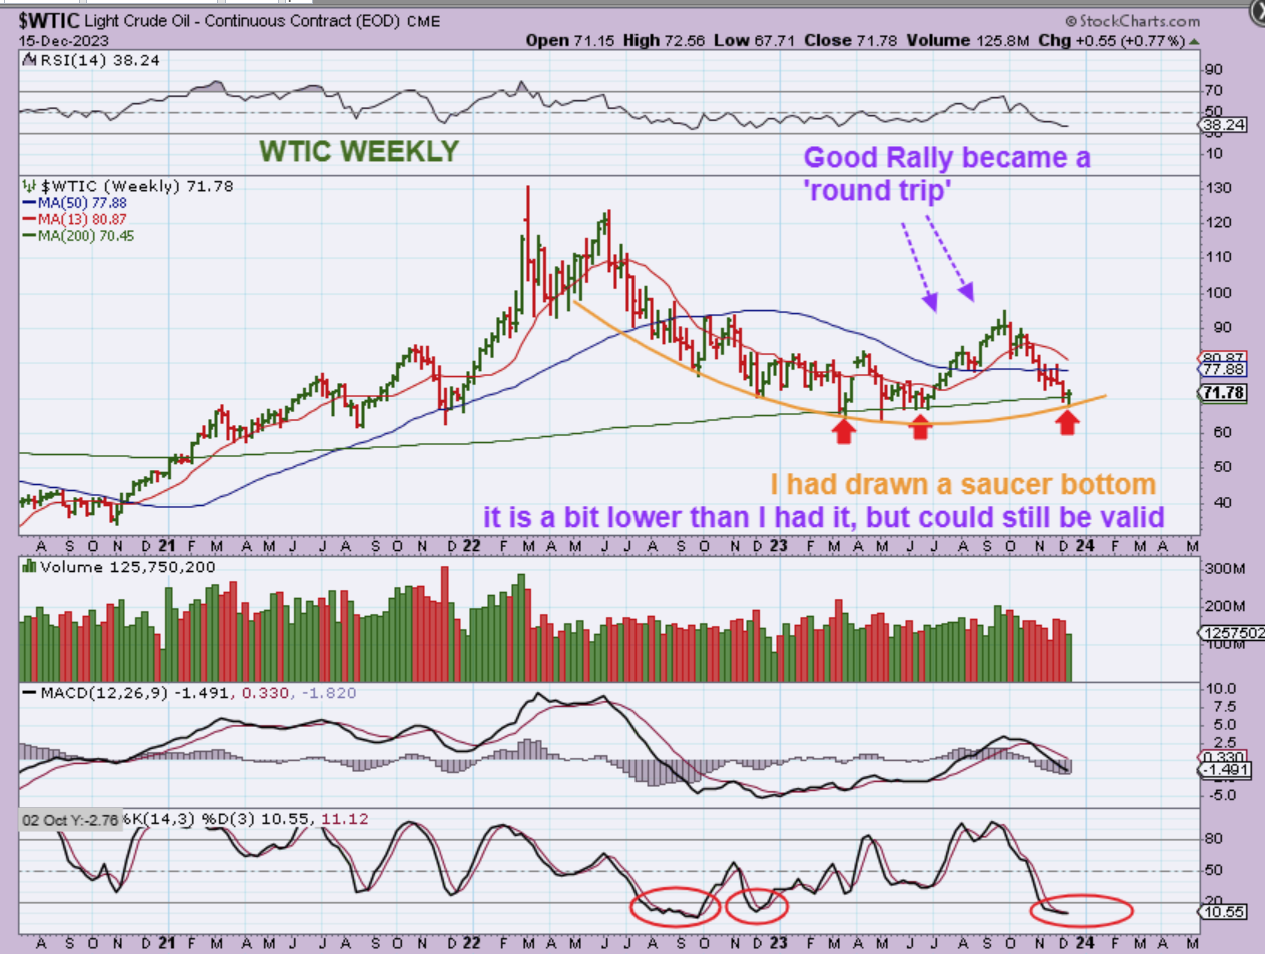
WTIC WEEKLY- Oil rallied nicely out of the last ICL, but it then rolled over and did a round trip back to the lows. I mentioned weeks ago that we could see a saucer bottom or rounding bottom. This would have to be the next ICL support at the 200 week ma for that to form. Oil stocks started to move higher last week, as mentioned in Fridays report.
.
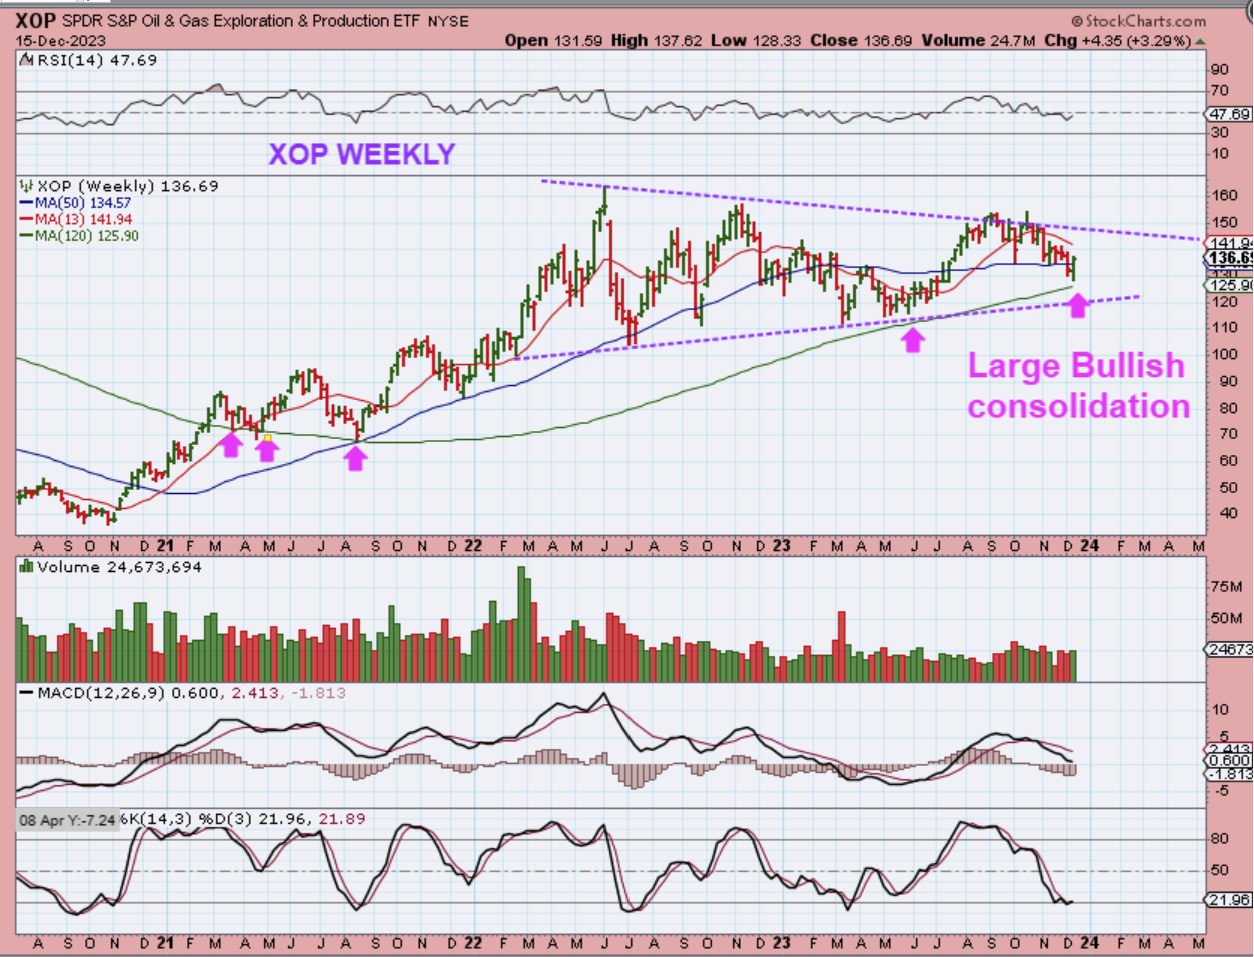
XOP WEEKLY– The XOP is a large bullish consolidation that has become oversold and put in a reversal this week. Notice that Oil reversed at the 200week ma, but the XOP actually reversed at the green 120 week ma. That shows me that Oil stocks have held up better than Oil itself, and also we see that this pattern has higher lows over the past couple of years where Oil doesn’t. So Oil stocks are in a bullish consolidation and have been choppy for a while as a result.
.
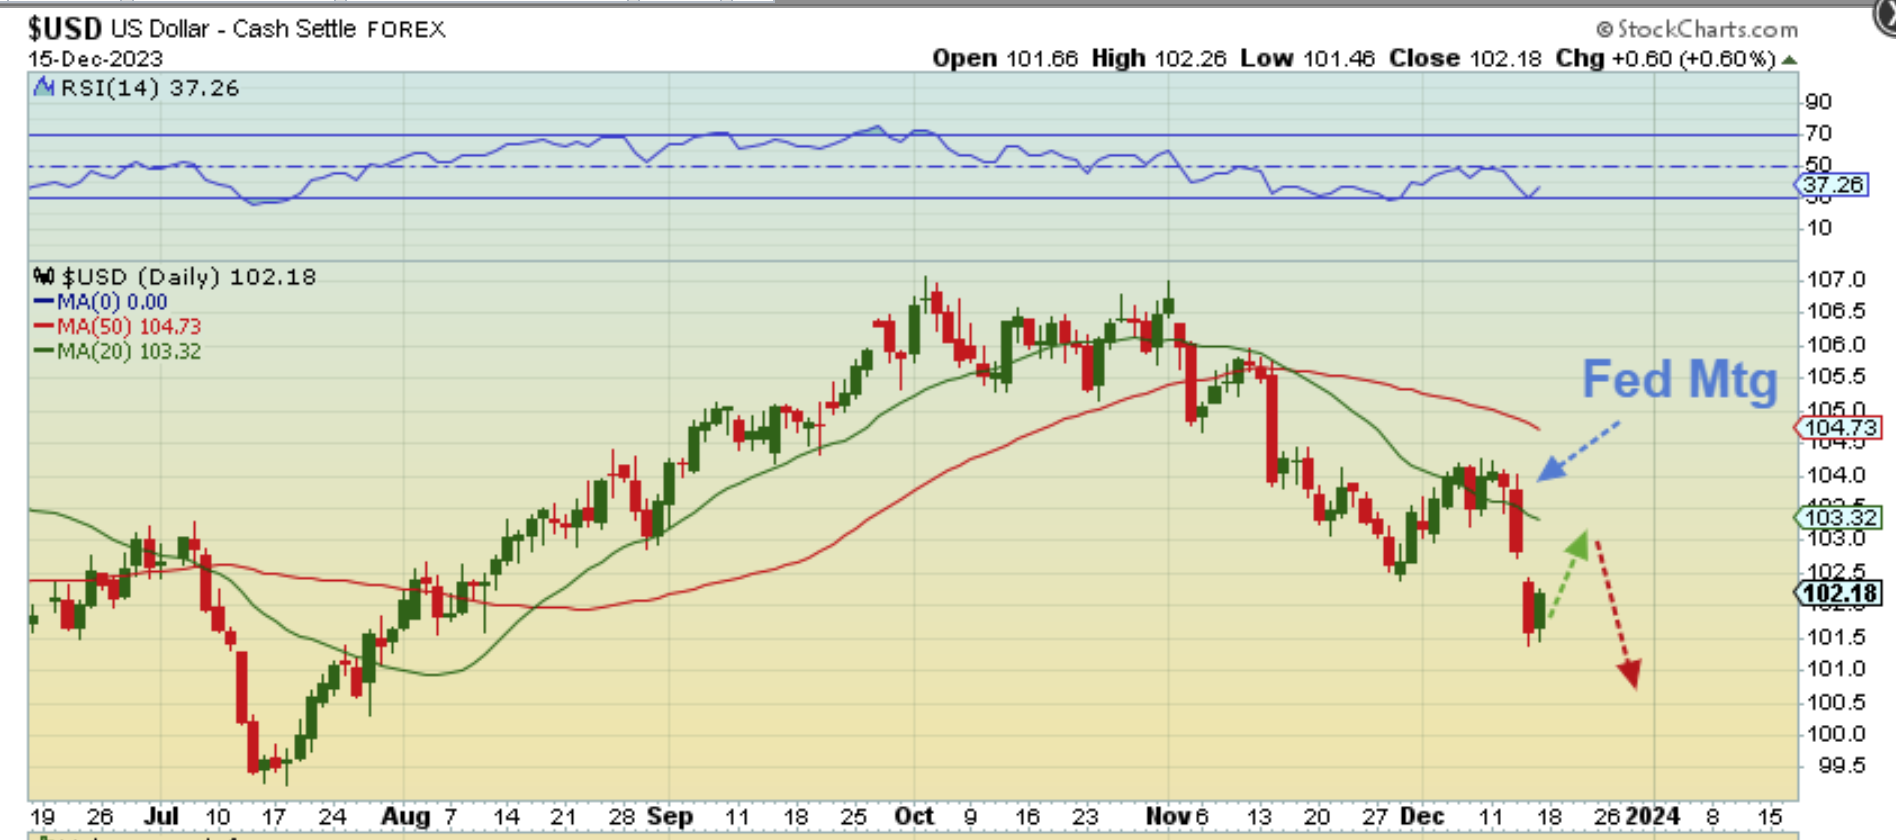
USD DAILY– With the Fed deciding to leave rates unchanged, the USD dropped quickly on Wednesday and Thursday. An inside day candle, as seen on Friday, can indicate that a bounce or reversal of direction is next, so I drew a bounce in.
.
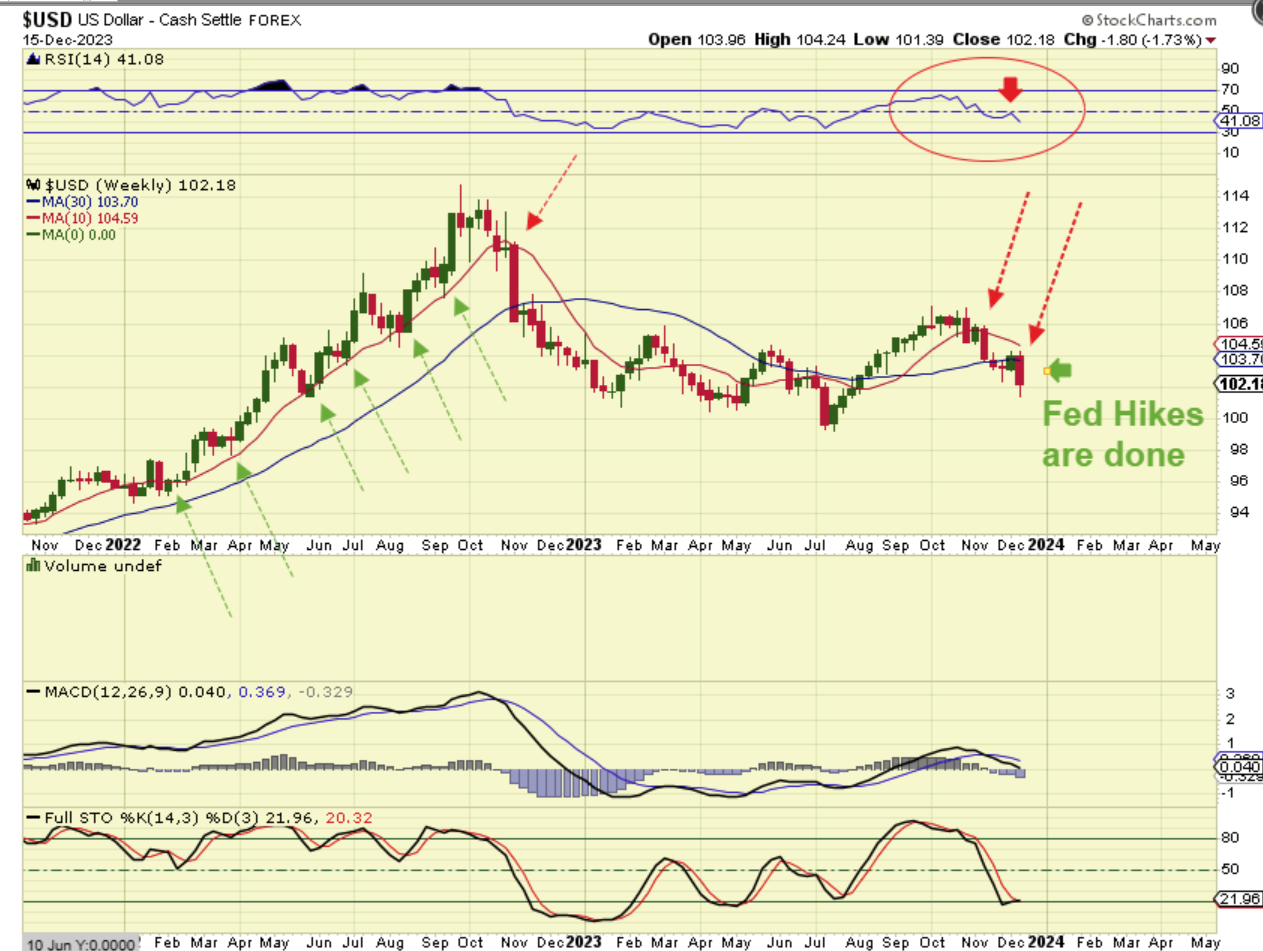
USD WEEKLY– The USD dropped over 2% post Fed last week before the Friday bounce. The weekly chart does look as though The USD was rejected at the 30 week ma and under the 10 week ma. That is bearish for the USD if it remains like that.
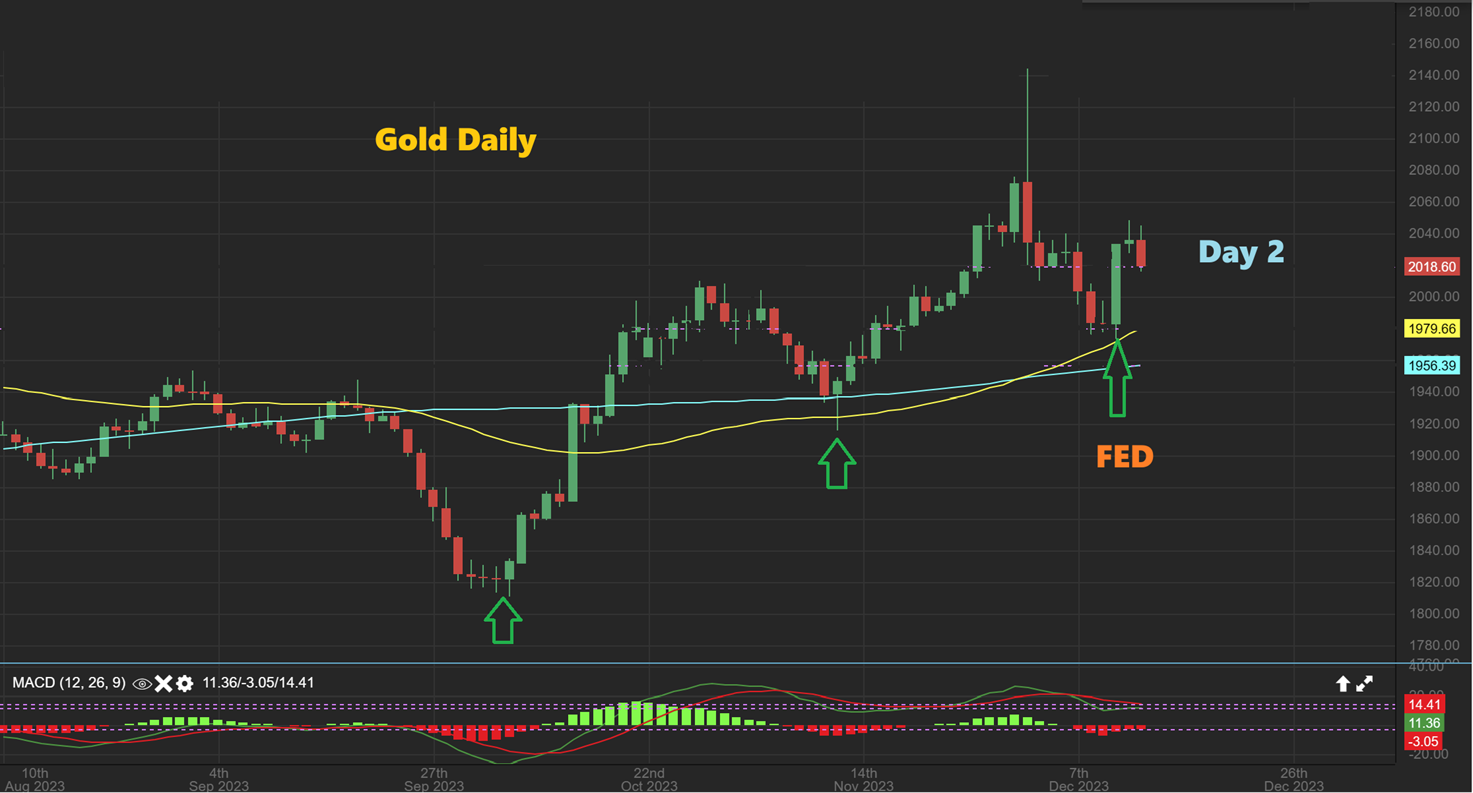
GOLD DAILY – Gold surged higher on Fed Wednesday and paused since then. This should only be day 2 of a new daily cycle, so let’s see how this plays out. Gold could dip a little if that USD does bounce, but that may only lead to a small dip & offer a gap fill on the GLD, SLV, and GDX charts.
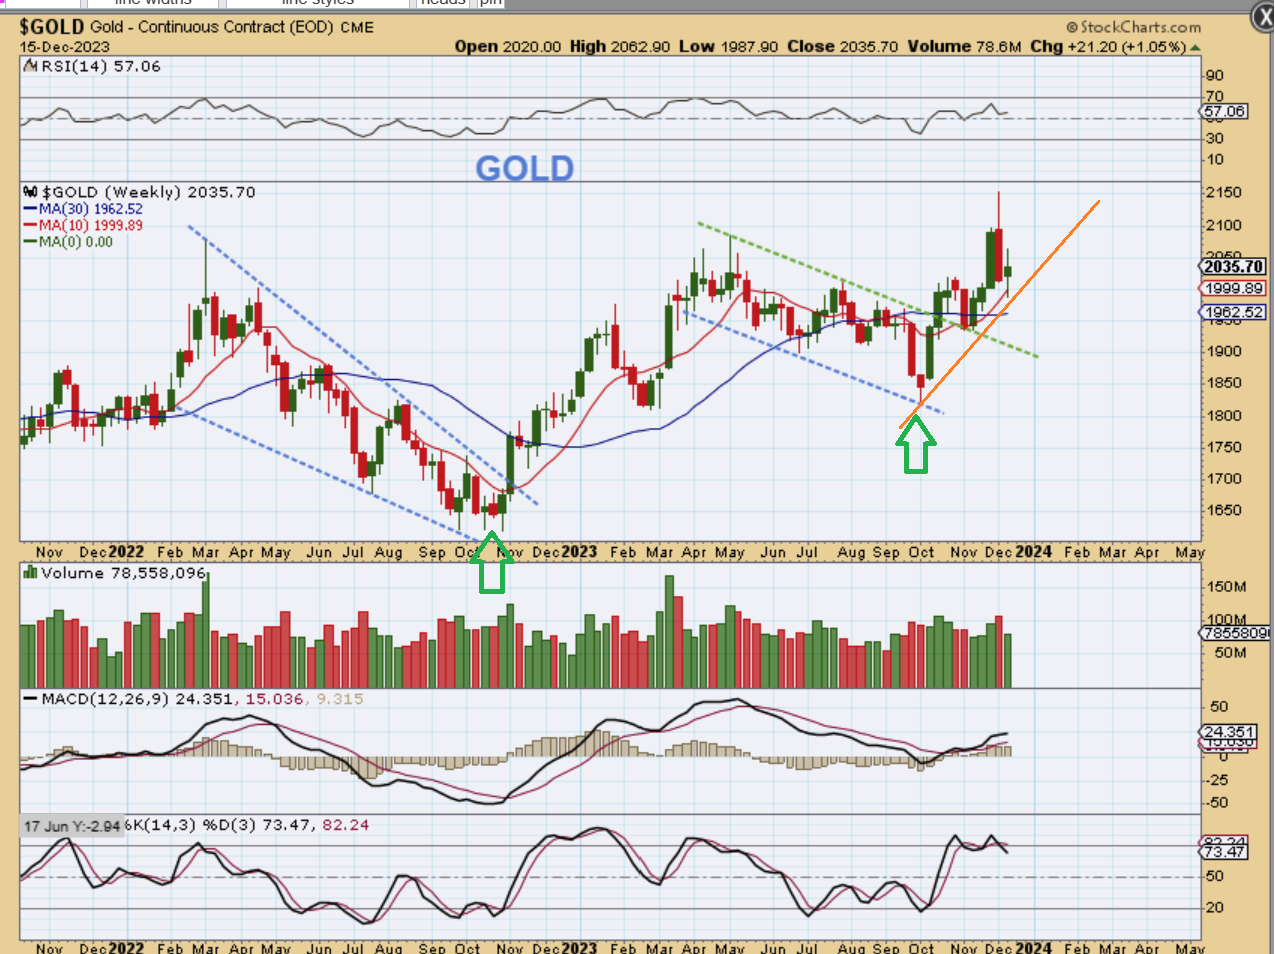
GOLD WEEKLY :
The weekly chart gave us a Doji, so it doesn’t look like a great week, but notice these Bullish factors…
1. Gold reverse bullishly at the 10 week ma
2. Remains nicely above the 30 week ma.
3. Closed above the uptrend line, and
4. The first dcl above the ICL was just a back test of the breakout from a down channel, and this
dcl is a higher low.
This is usually considered a Bullish set up.
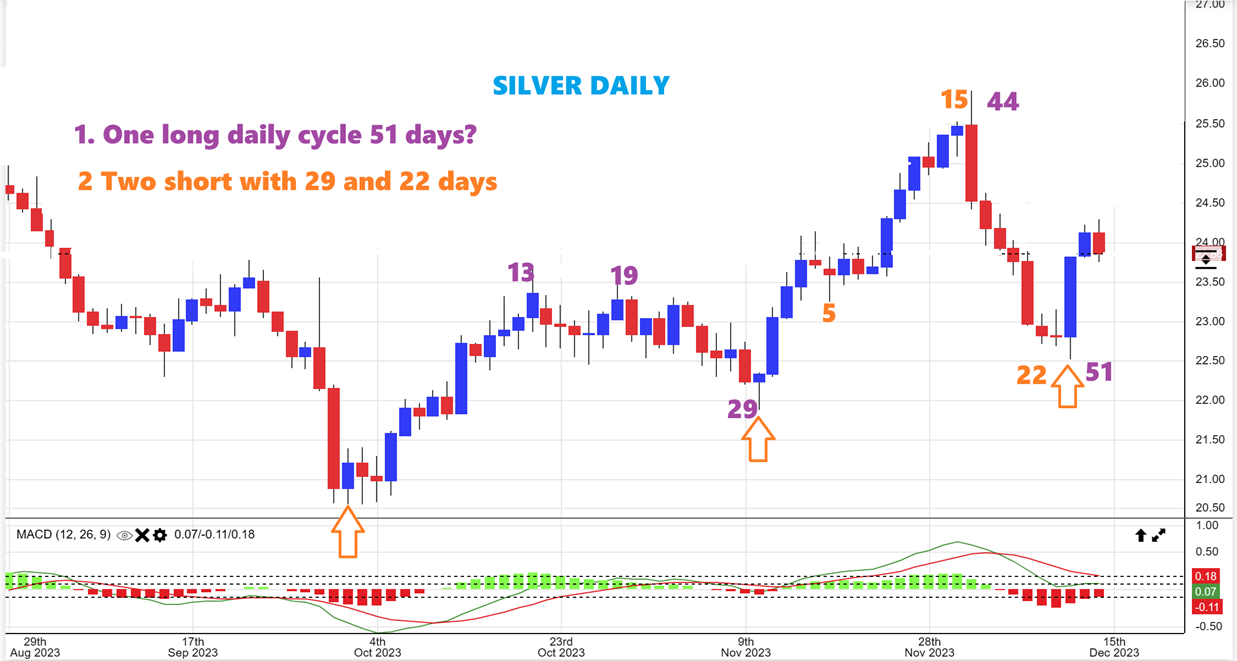
SILVER DAILY CYCLE COUNTS –
This stands for either Gold or Silver. I drew 2 cycle counts, but either one is Right Translated and Bullish. The Purple numbers would represent a VERY LONG first daily cycle of 51 days, with a 1/2 cycle dip at day 29 (this is less likely). The Orange numbers represent where a 2nd daily cycle would have started, and this would be giving us 2 short daily cycles of 29 days and 22 days. That 22 day is very short these days, but all we can do is go by what these markets give us. These are both bullish counts. Read the chart please.
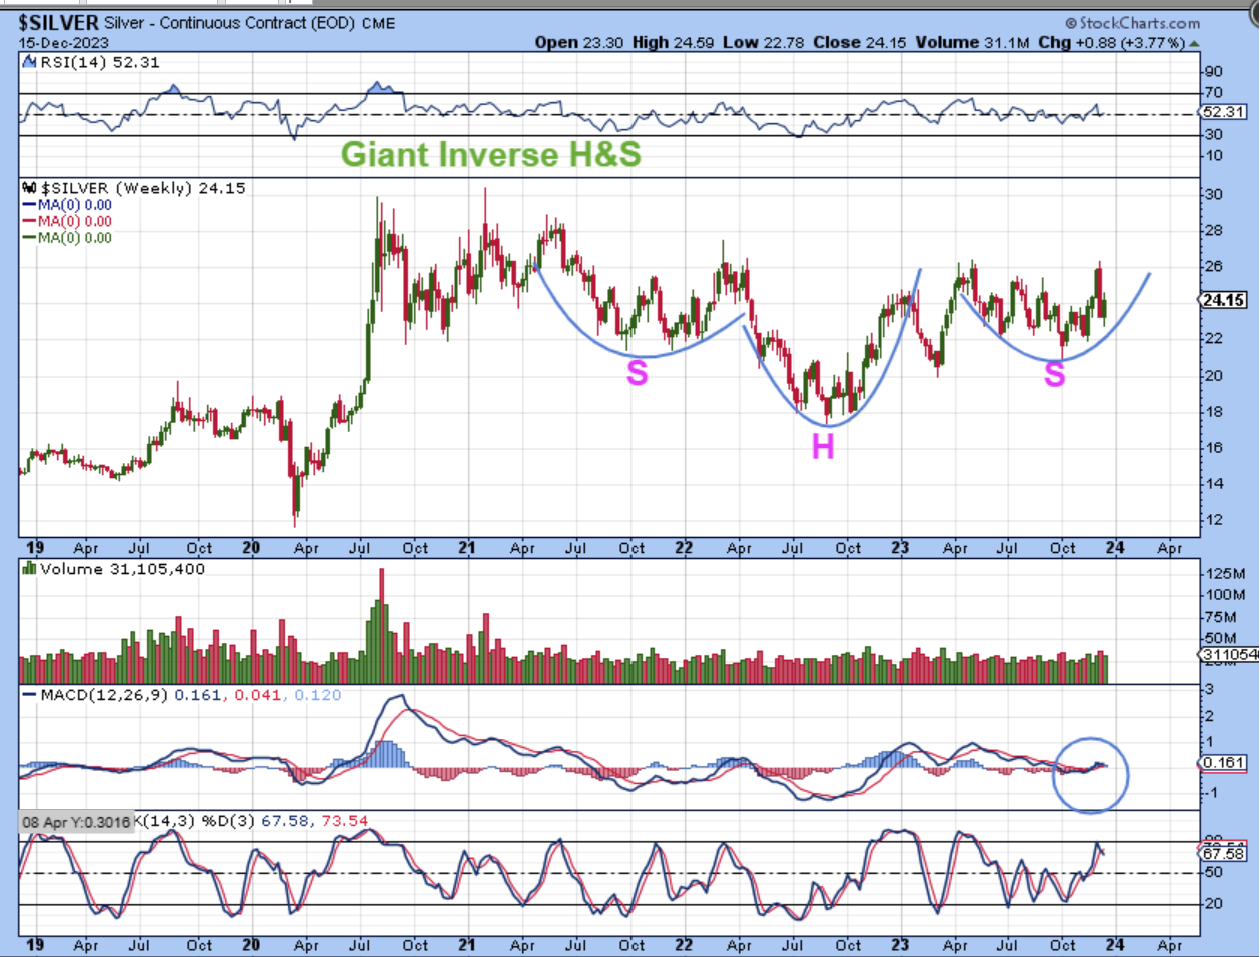
SILVER WEEKLY – Silvers big picture has been a LONG and sometimes painful consolidation of choppy price action, but when Silver breaks out and runs? It can really get going, and Silver Miners will fly too, so we want to stay focused and not allow this to lull us to sleep. The chop will stop and the run can really take off.
.
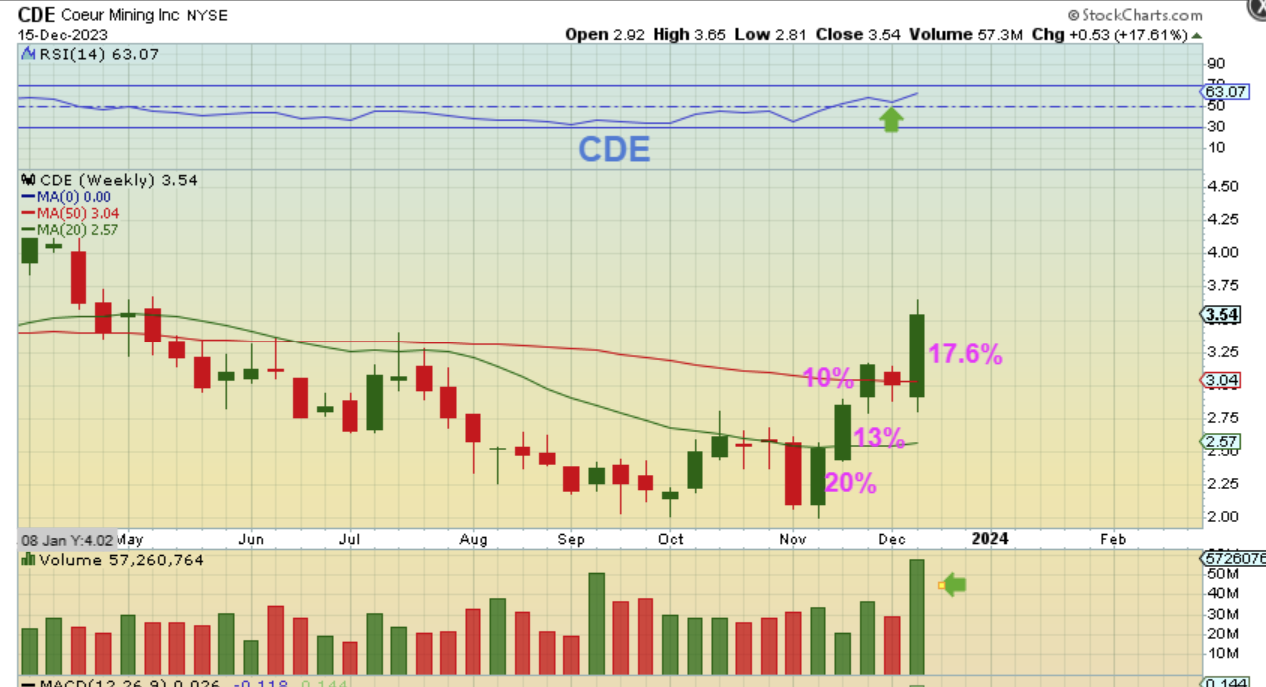
Take a look at this chart of SILVER again. Do you remember that 7 day sell off before the Fed Mtg? Well…
Silver Miners like CDE basically ignored that sell off and has put in strong moves week after week. If Silver takes off and runs, Silver stocks will be one place that you will want to ‘buy and hold’ a basket of. 🙂
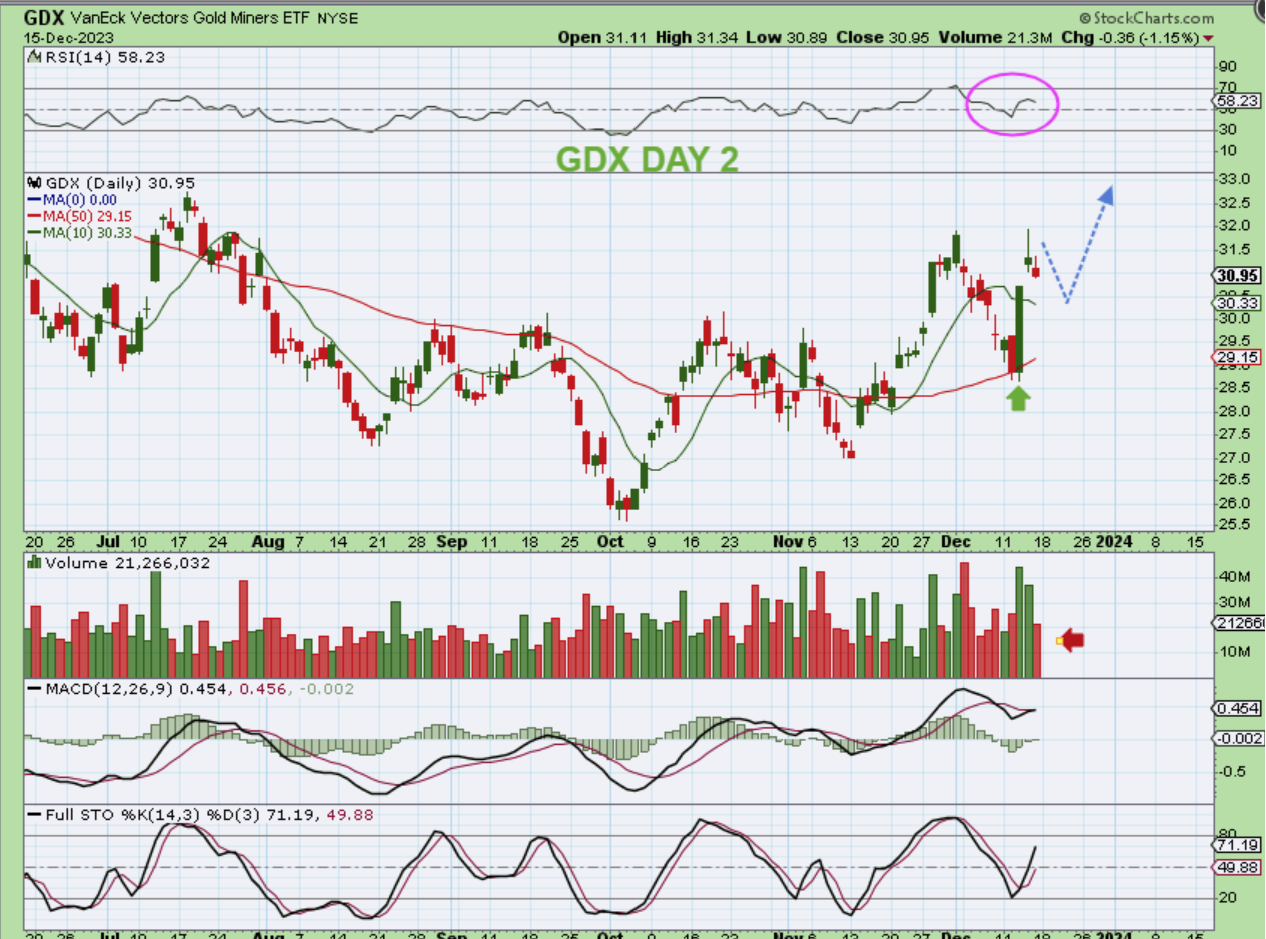
The GDX ETF surged on Fed Wednesday too, reversing right at the support of the 50 sma, and then it paused too. We could dip down to the 10 day sma and finish filling a gap, but so far the volume was only 1/2 of the day that it surged higher, and that was on a quad witching day.
.
The Big Picture for the markets remains bullish. Enjoy your Sunday evening everyone!
…
~ALEX
..
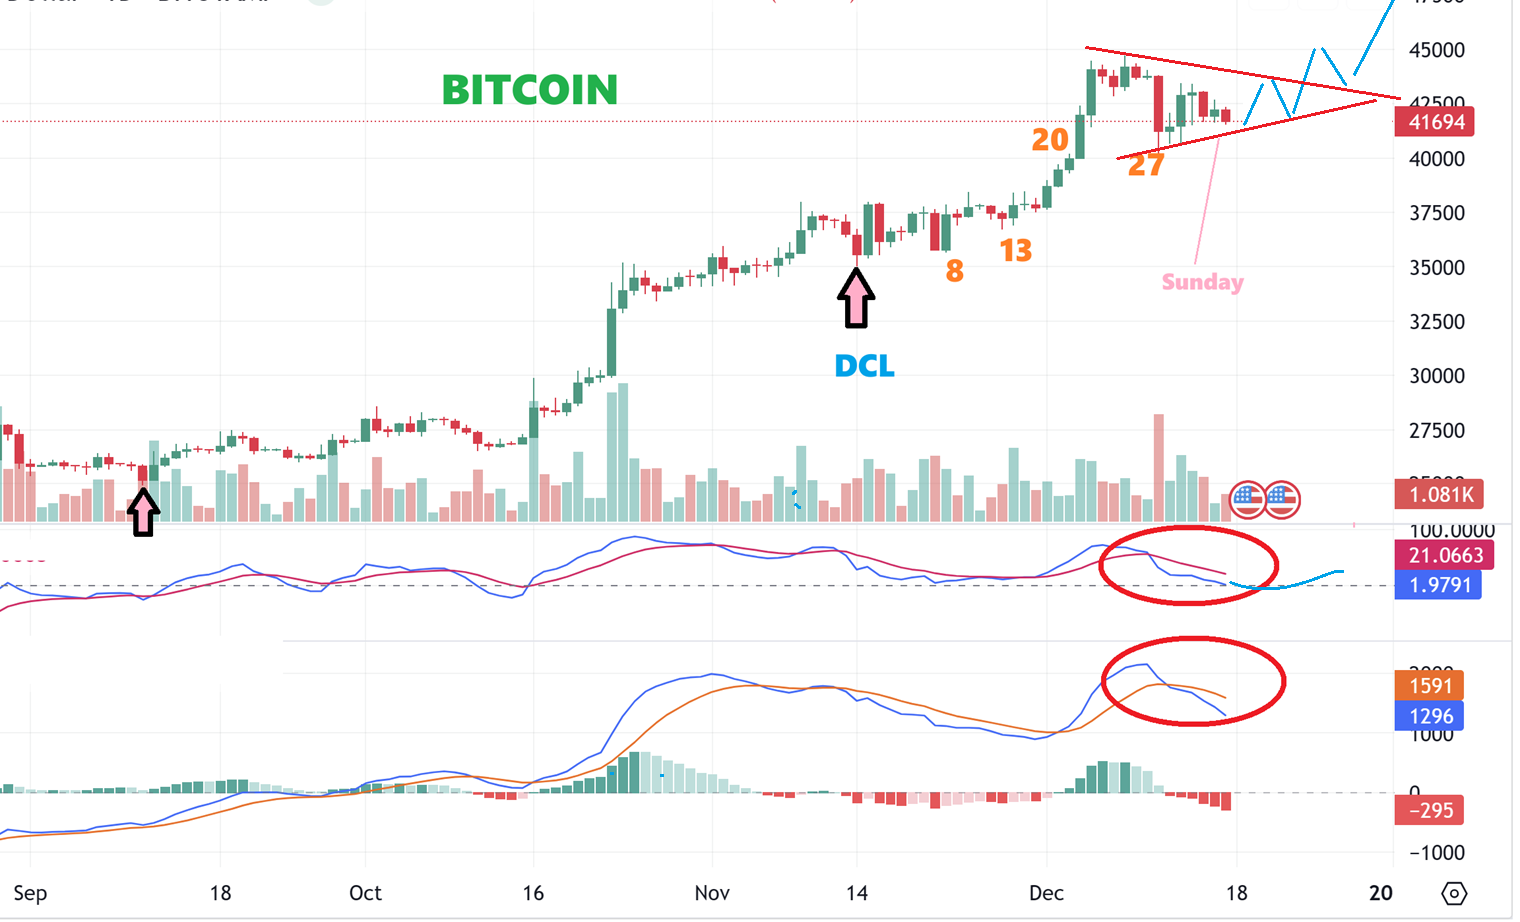
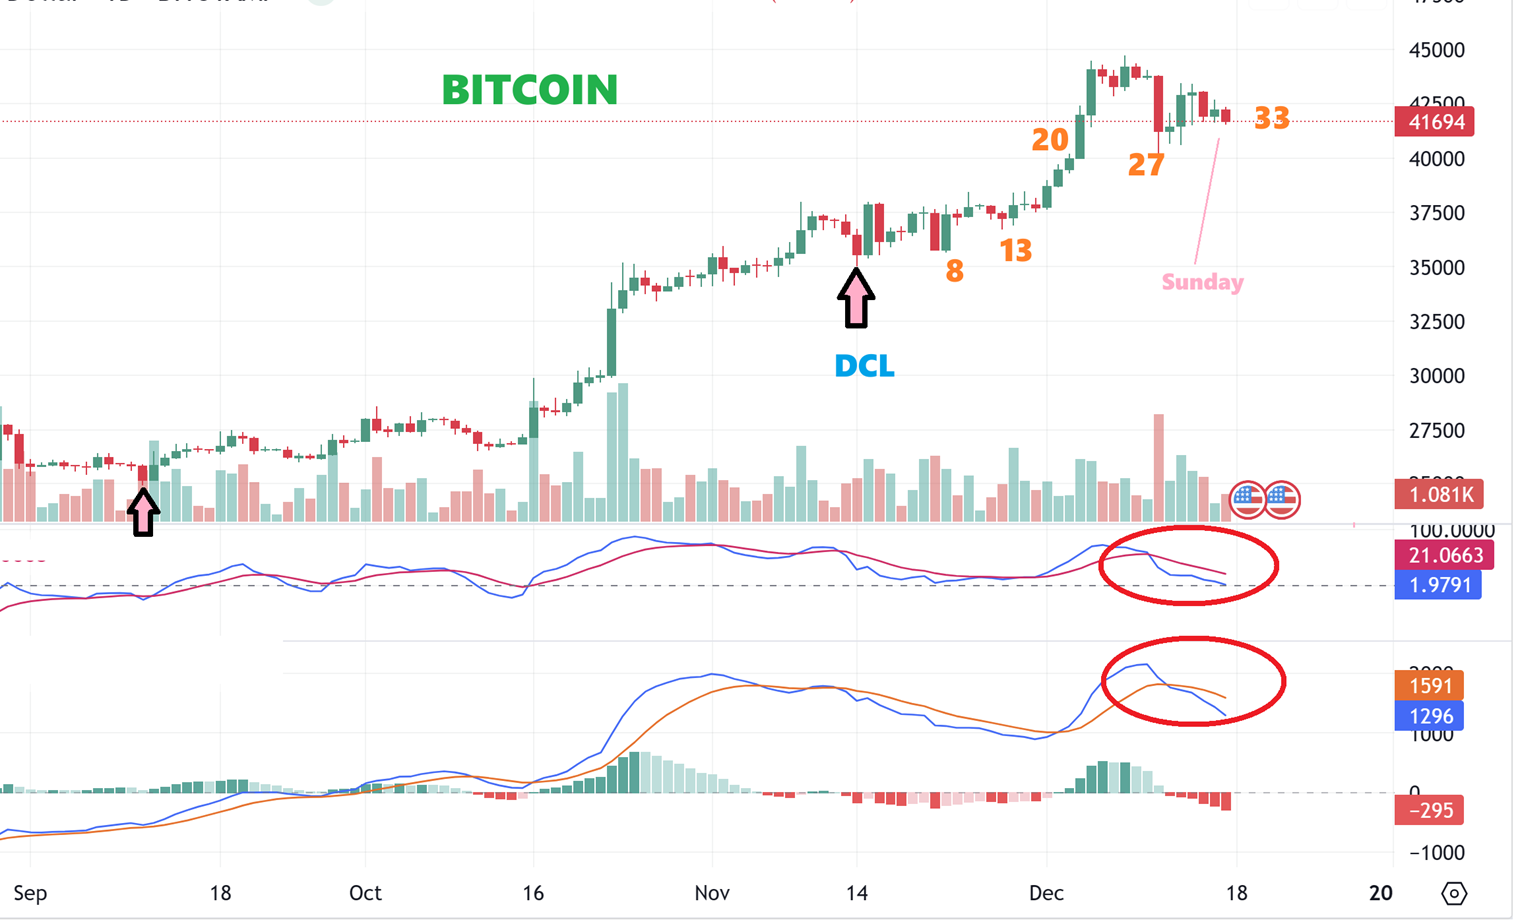
BITCOIN dipped down on day 27 and that may be enough for a 1/2 cycle dip. I had mentioned that the 2 indicators may be indicating that a consolidation could follow after day 27 and we are seeing that take place over the past 7 days. Unfortunately, this means that this could dip lower to a new low on day 33 or 34, or take off higher. It does look like a Bullish pennant, but I’d prefer to see those indicators curling upward with a pennant. We’ll see if this changes over time. WE COULD STILL SEE..
.
WE COULD STILL SEE THIS KIND OF A MOVE THAT ALLOWS THE MACD TO CURL UP. We’ll See.