December 9th – The Weekend Report
SPX DAILY– This market just made a new high on day 31, so this will be very right translated and bullish. It has held up at the 13 sma and the Day 27 low is just too mild to be a dcl. A dcl usually comes in around day 35-40, but they can extend and we’ve seen 50 day daily cycles in 2023, so use the 13 sma as a stop and continue to ride. I was looking at …
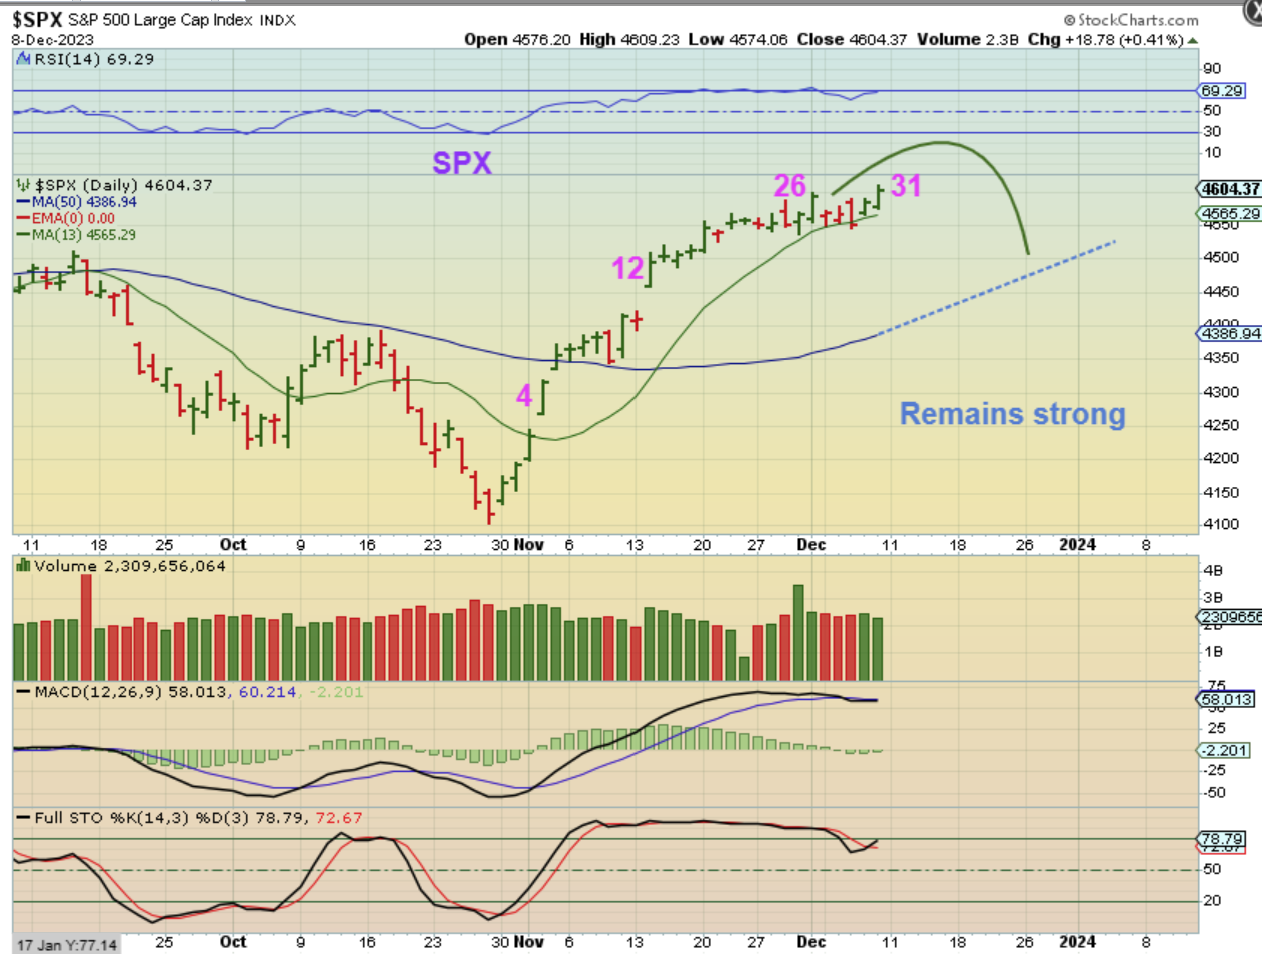
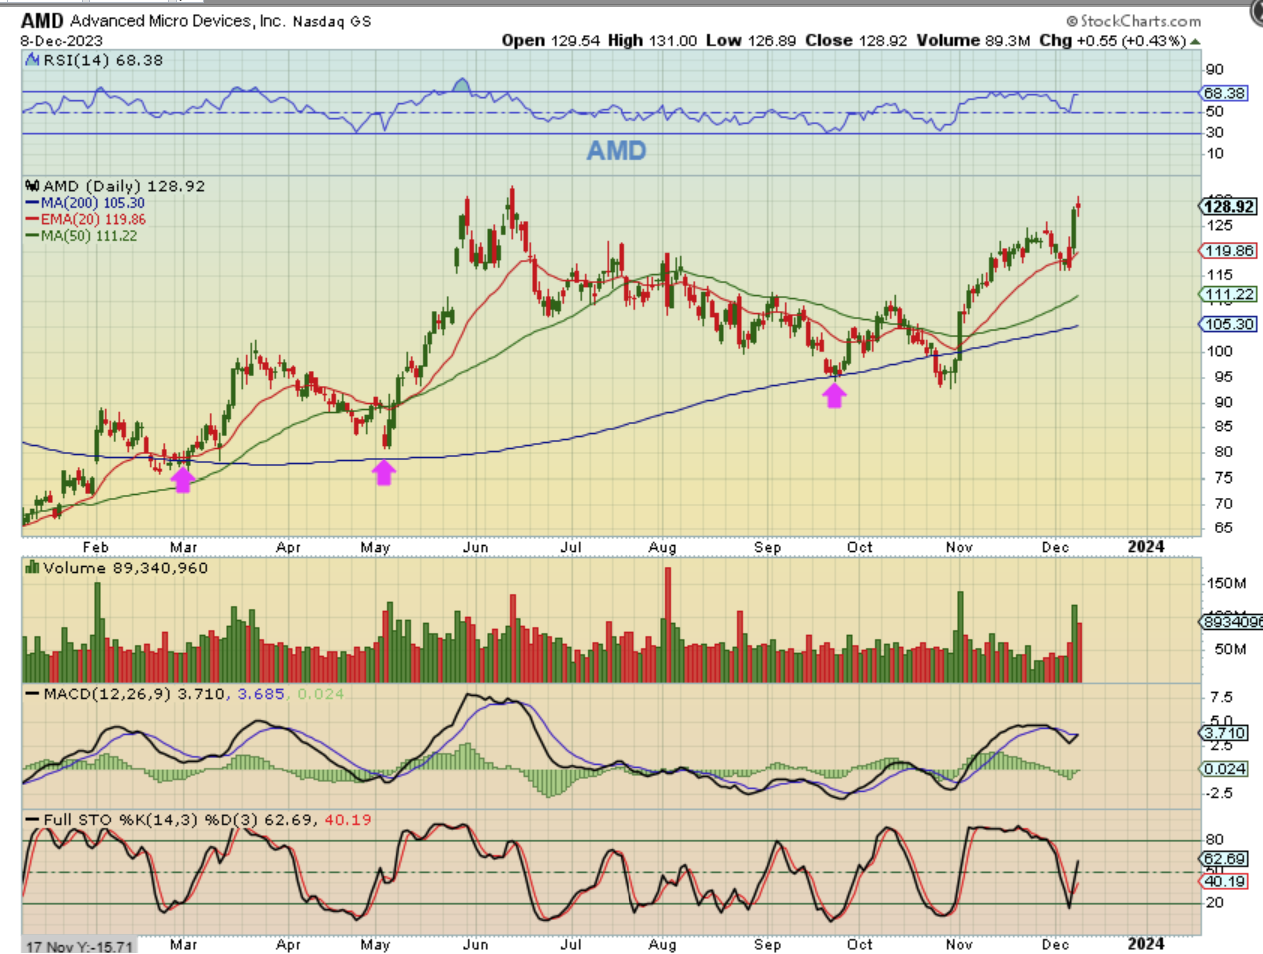
I was looking at NVDA, and it actually did what I thought the Markets would do, so was that a 1/2 cycle low at day 26 on the SPX chart above? It’s hard to say, but the General Markets ( & most of the stronger stocks like NVDA, AMD, GOOG, AAPL) remain bullish. Those stocks and NVDA here look like a buy here. And AMD…
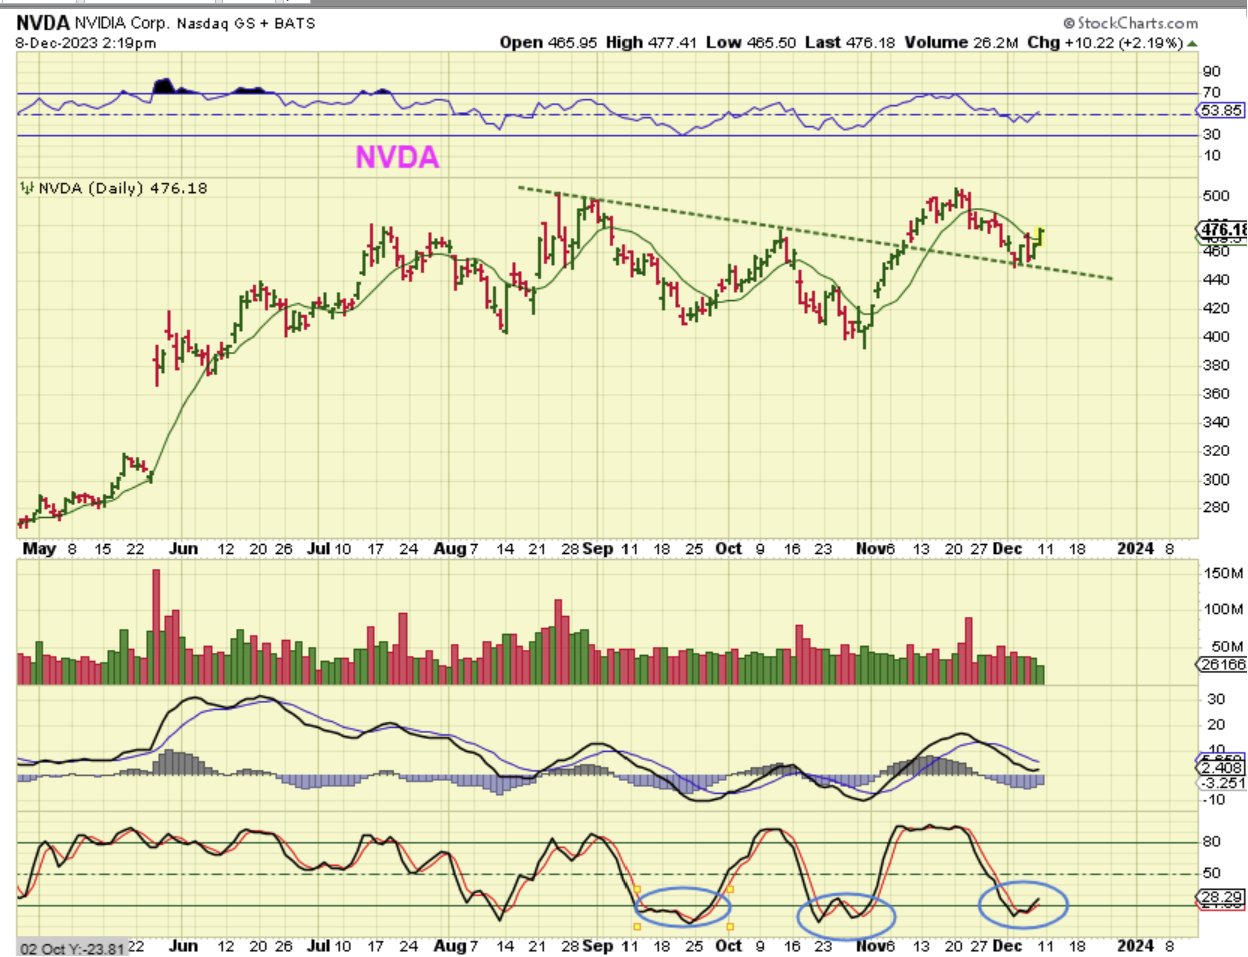
And AMD dipped down, became oversold, released earnings and shot back up, so these continue to perform bullishly.
.
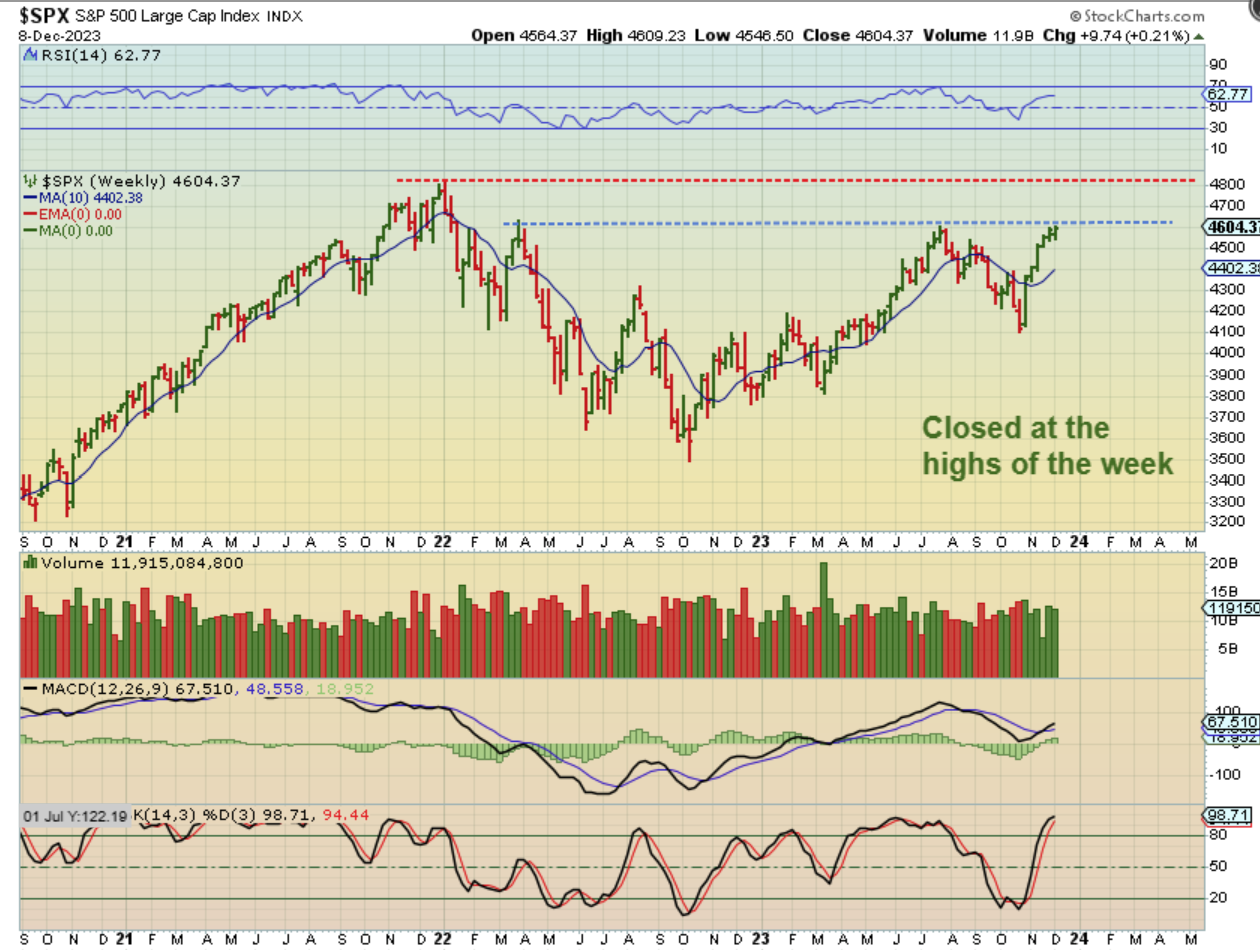
SPX WEEKLY– You can see that we have 6 straight weeks of gains, despite the small dips on the daily chart. We are at a price point (July Highs) that I would have expected a dip into a dcl and then a continuation higher, but they just keep buying this market so far. We’ll see if we get a dip next week heading into our Fed Mtg, and then a ‘Santa Clause Rally’ to finish the year.
.
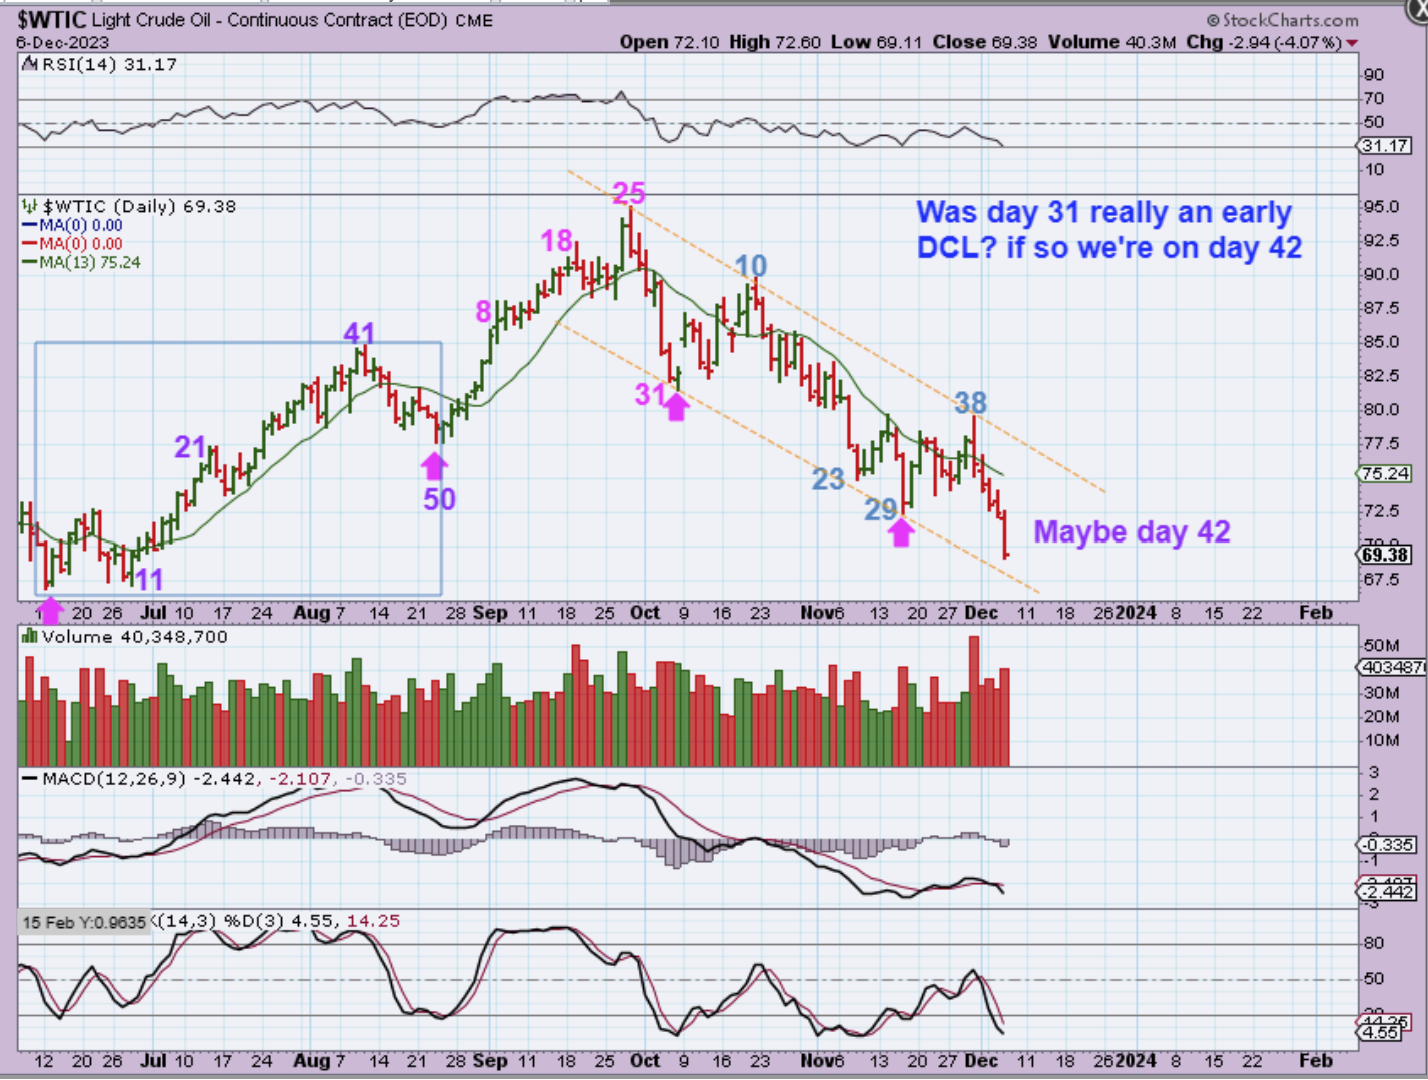
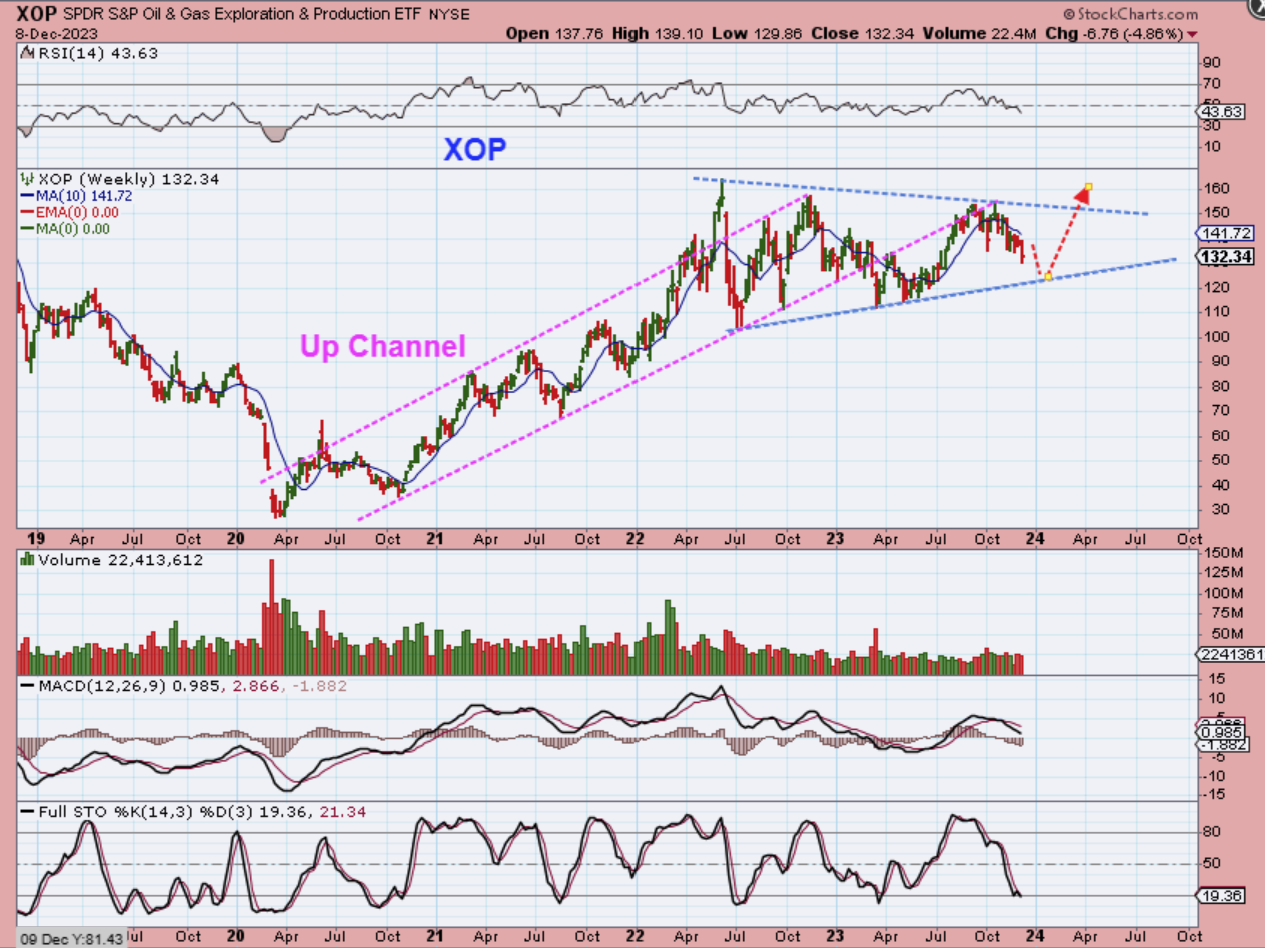
In Fridays report I put this down for Oils Cycle count. Oils cycles can last anywhere around 50 days, so we should be close to a low…
.
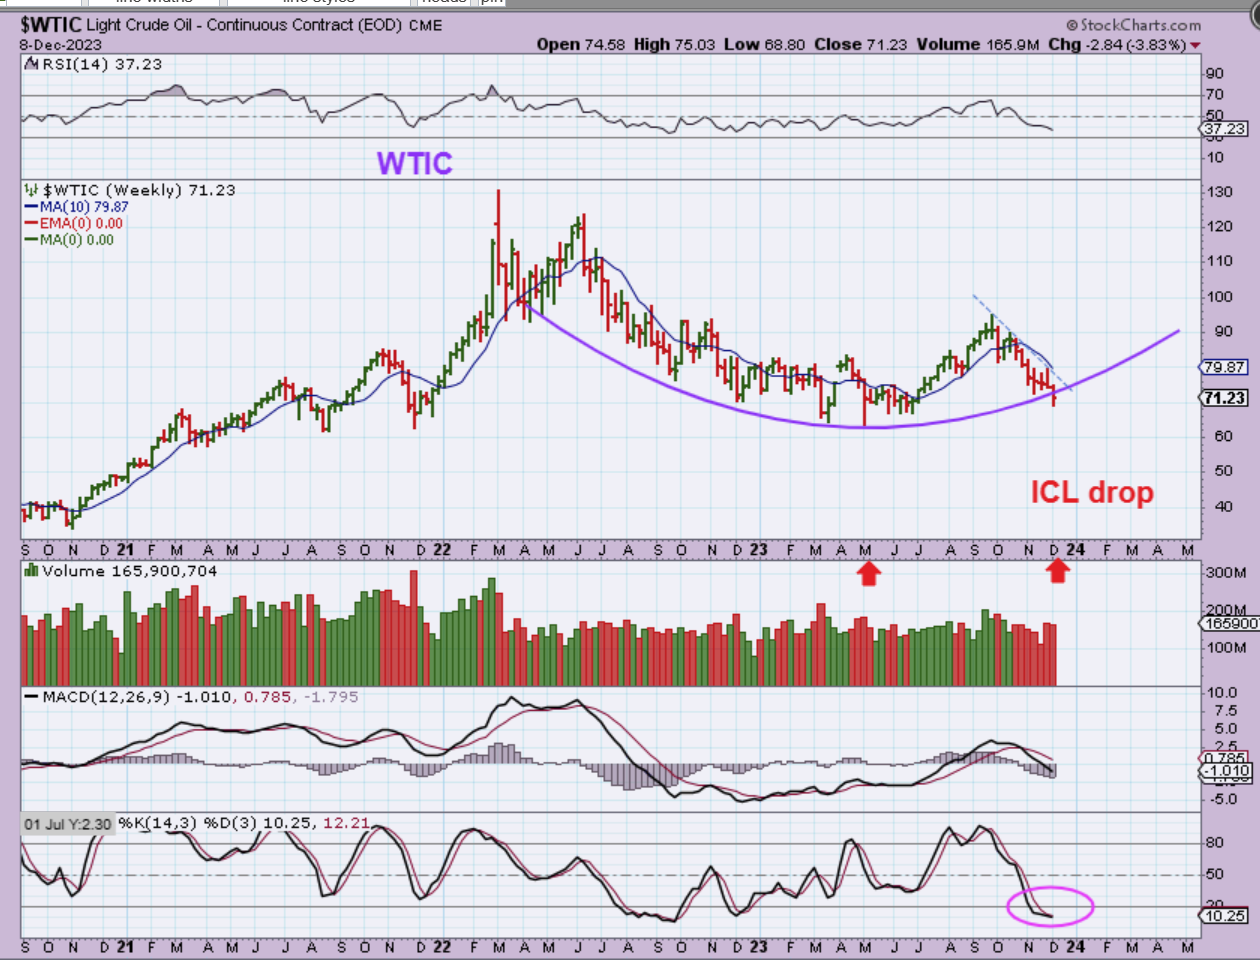
WTIC WEEKLY– Oil is dropping into an ICL and it broke through my round bottom drawing, but the daily chart is on day 43, so we could get a ICL/ DCL any day now. This may just drop down to the May lows again.
THE XOP WEEKLY – This represents some of the Oil & Gas Stocks. It isn’t all that bearish when you consider that Oil is back at the lows and this is a large consolidation triangle formation. In 2023 this broke down from the up channel, back tested it, and has now been chopping sideways. It could break out higher and resume that uptrend if Oil finds a low and does the same.
.
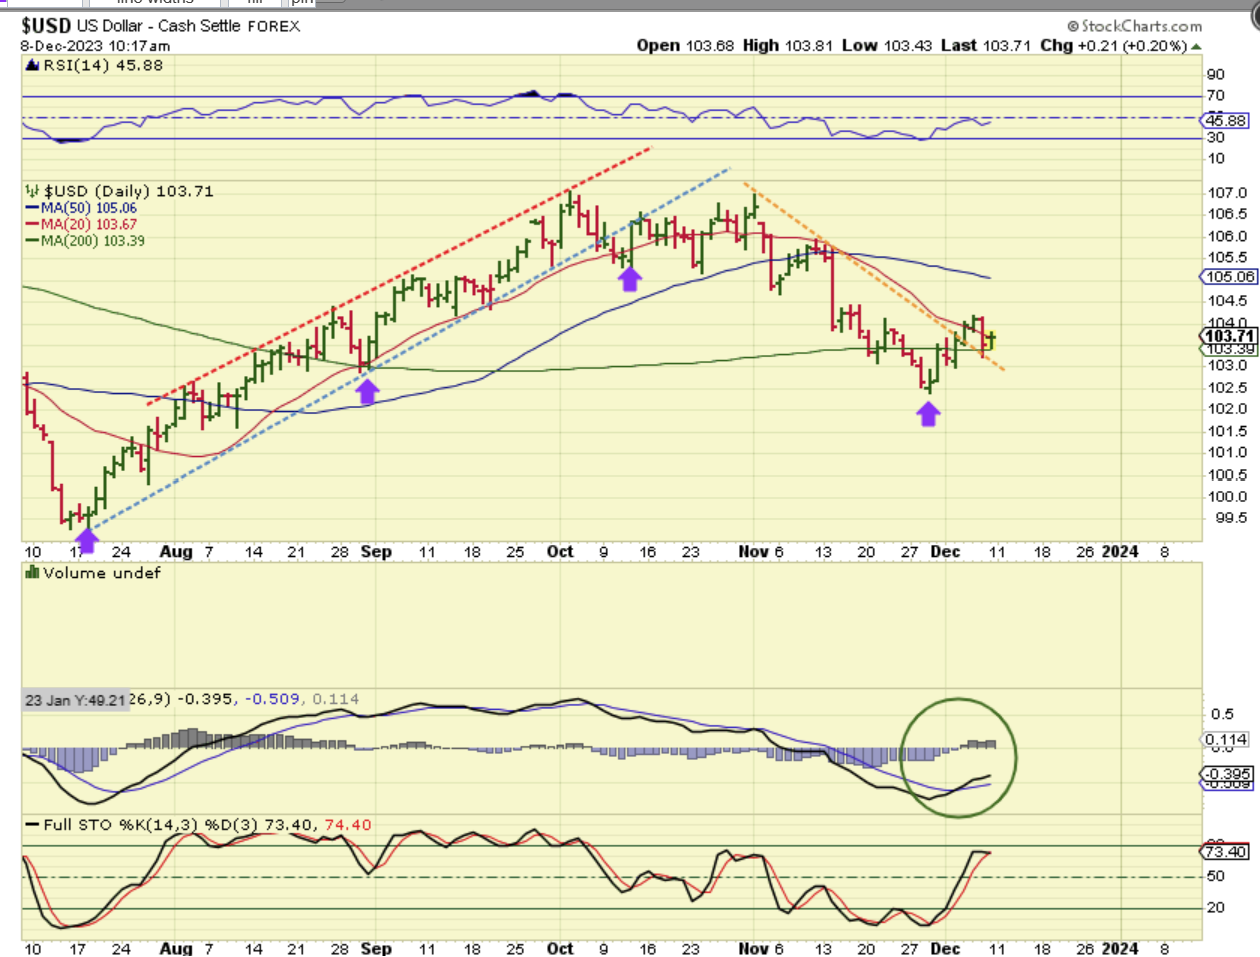
I want to repeat what I see with the USD. Please notice what I wrote Friday, I’ll highlight it in Red and it is a little concerning when we are waiting for a 3 yr cycle low. Then we’ll look at the weekly chart…
.
THE USD did a shake out at the 200sma and recovered, leaving a dcl behind. Breaking that downtrend and seeing a MACD cross does concern me, because it is a sign of strength that I just wouldn’t expect on a 4th daily cycle. A break above the 50sma would tell me that we just put in a higher ICL.
.
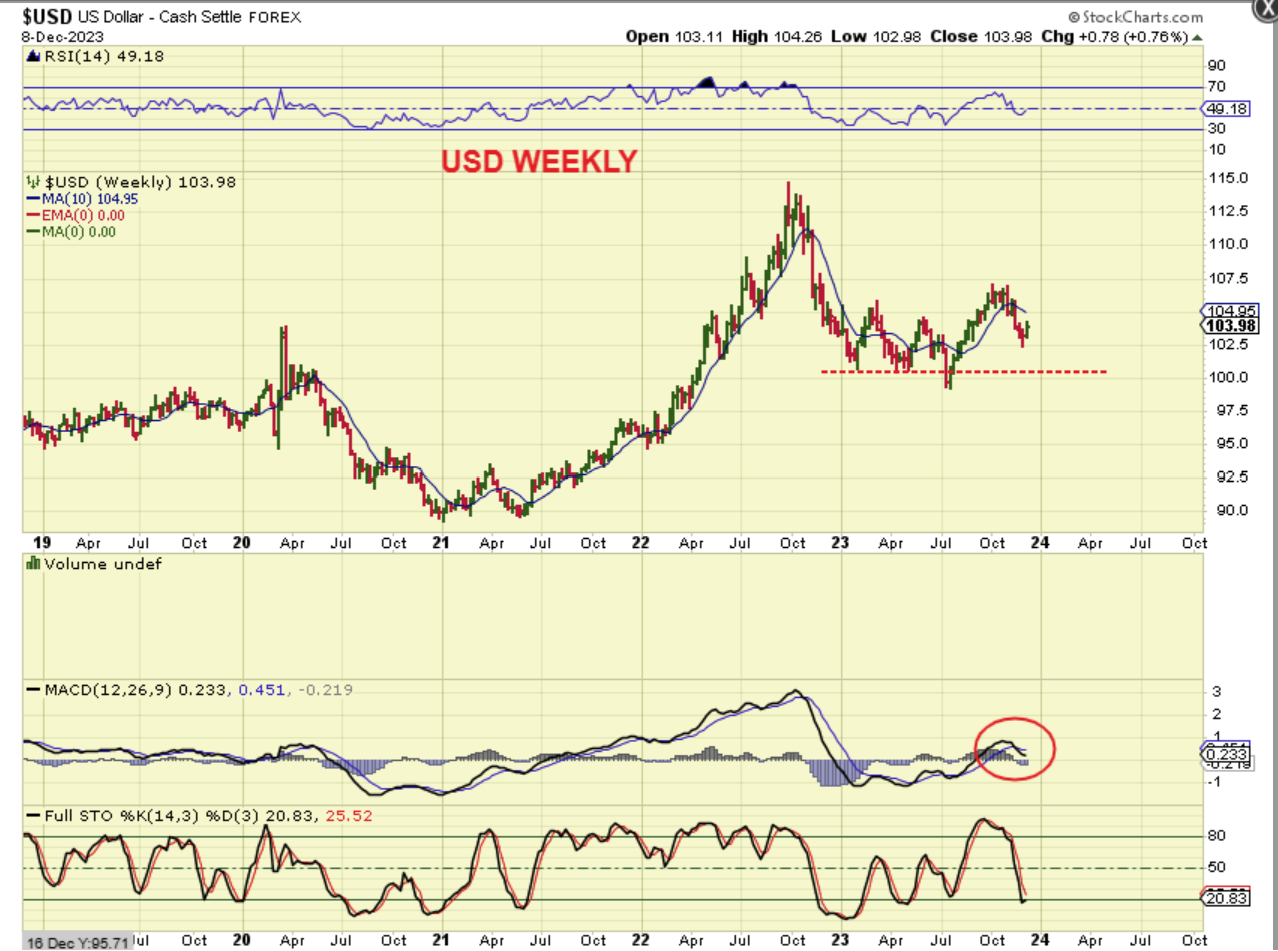
So let’s be honest here, I do not like what I see with The USD WEEKLY if that was an ICL that formed. Why?
We would now have a ‘higher high / higher low’ following the July ICL. That to me sounds like the 3 yr cycle low would have come in in July, like I mentioned as a possibility in prior reports when the rally from the shake out was so strong. A move above the daily 50sma, or that weekly 10 week ma has me viewing this as an ICL.
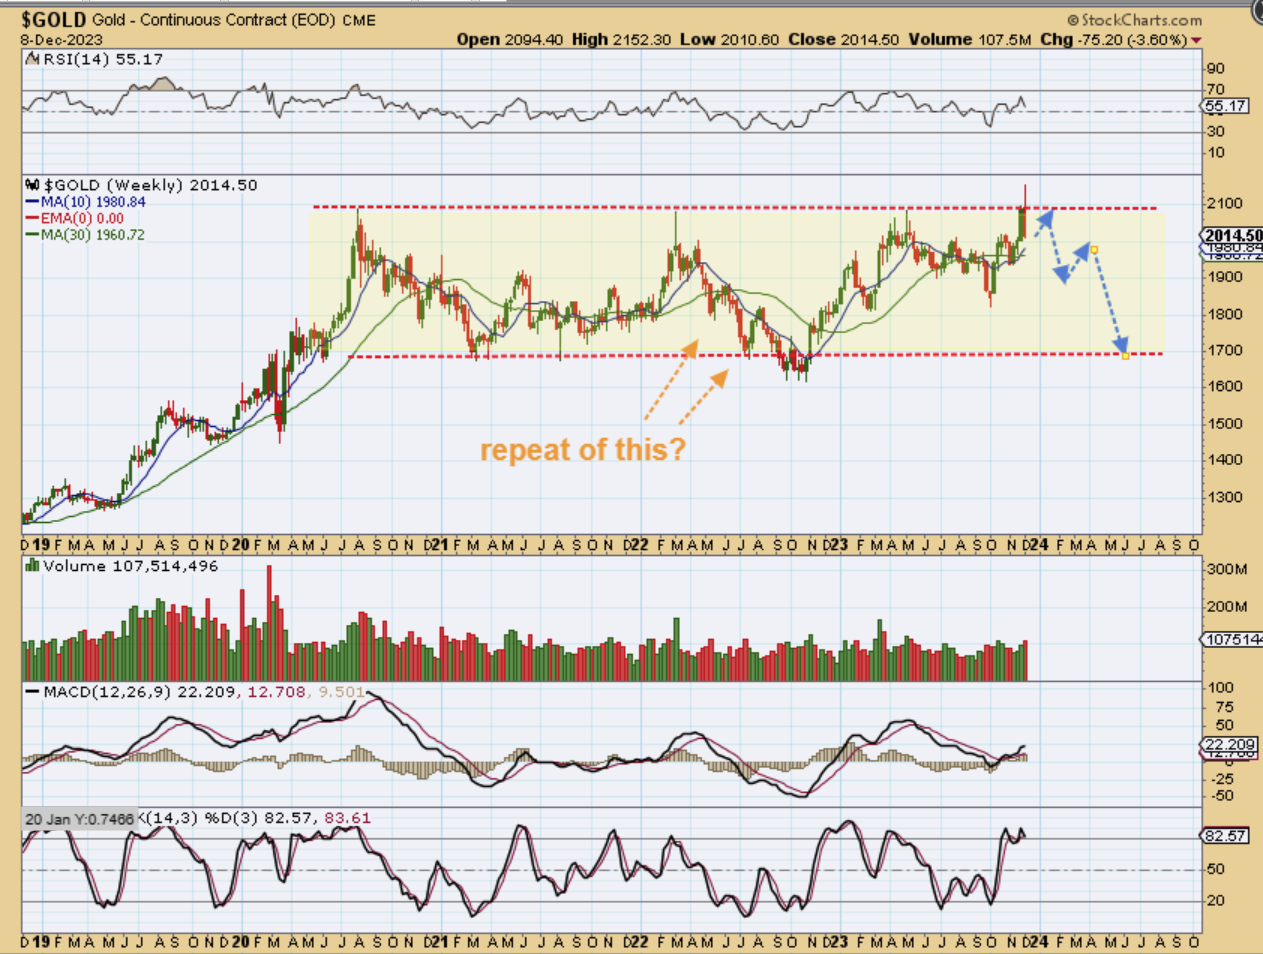
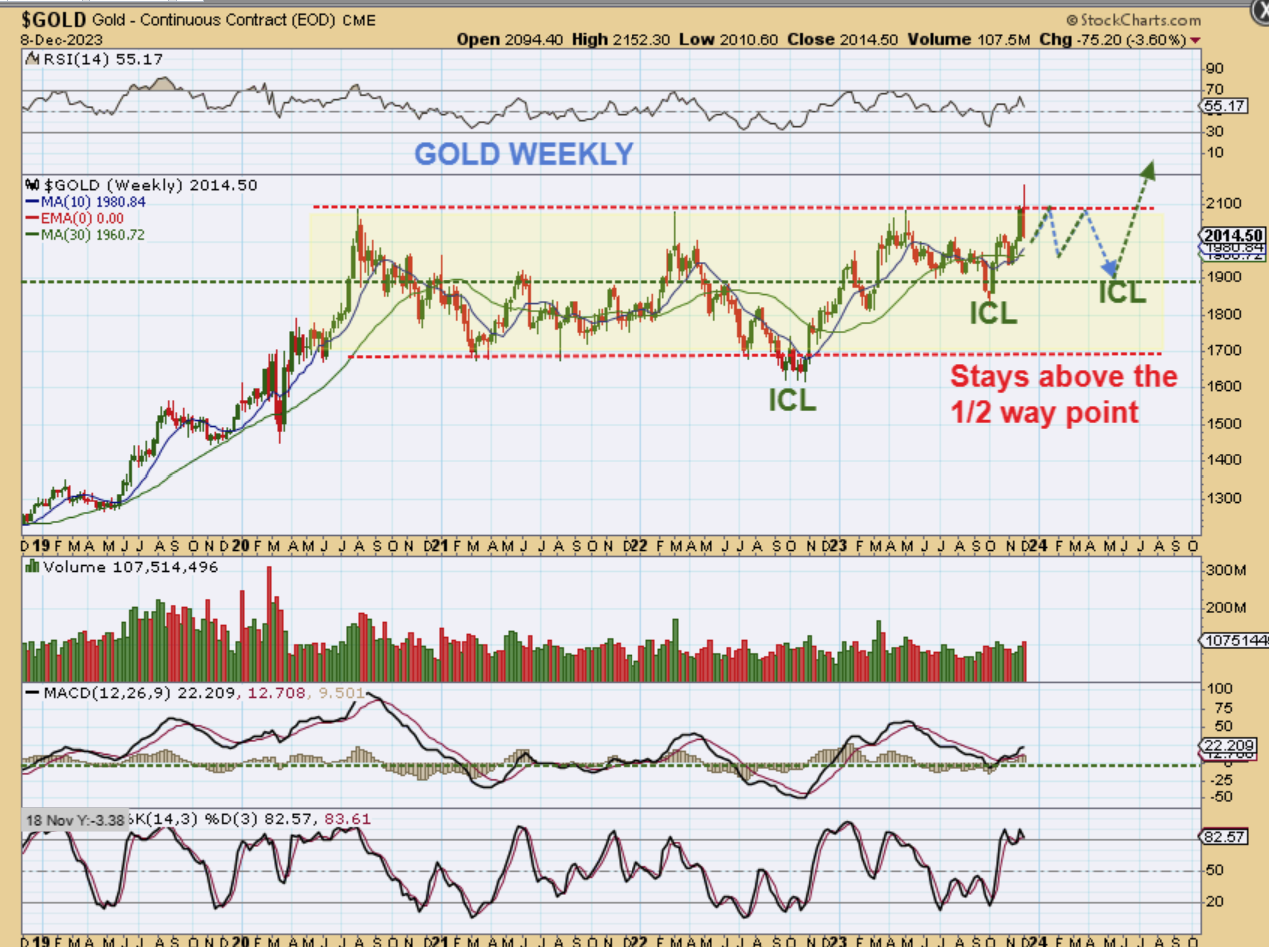
GOLD WEEKLY – Last week we saw Gold close at weekly and monthly all time highs. That was very bullish and it fit the idea that a breakout and rally was coming next. Gold shot up 70+ Points on Sunday night and sold off into Monday with an exhaustion reversal candle. It then closed only $4 above the weeks lows. THIS WOULD BE BAD NEWS: Is this going to put in a 3rd and 4th daily cycle lower as drawn again, like we saw in 2022? Or…
.
GOLD WEEKLY – Will Gold chop up and down at the highs, put in another higher low ICL, and break out and run? THAT WOULD BE GOOD NEWS. This also seems quite likely, based on how bullishly the Miners have been acting, but it pushes the breakout further out in time.
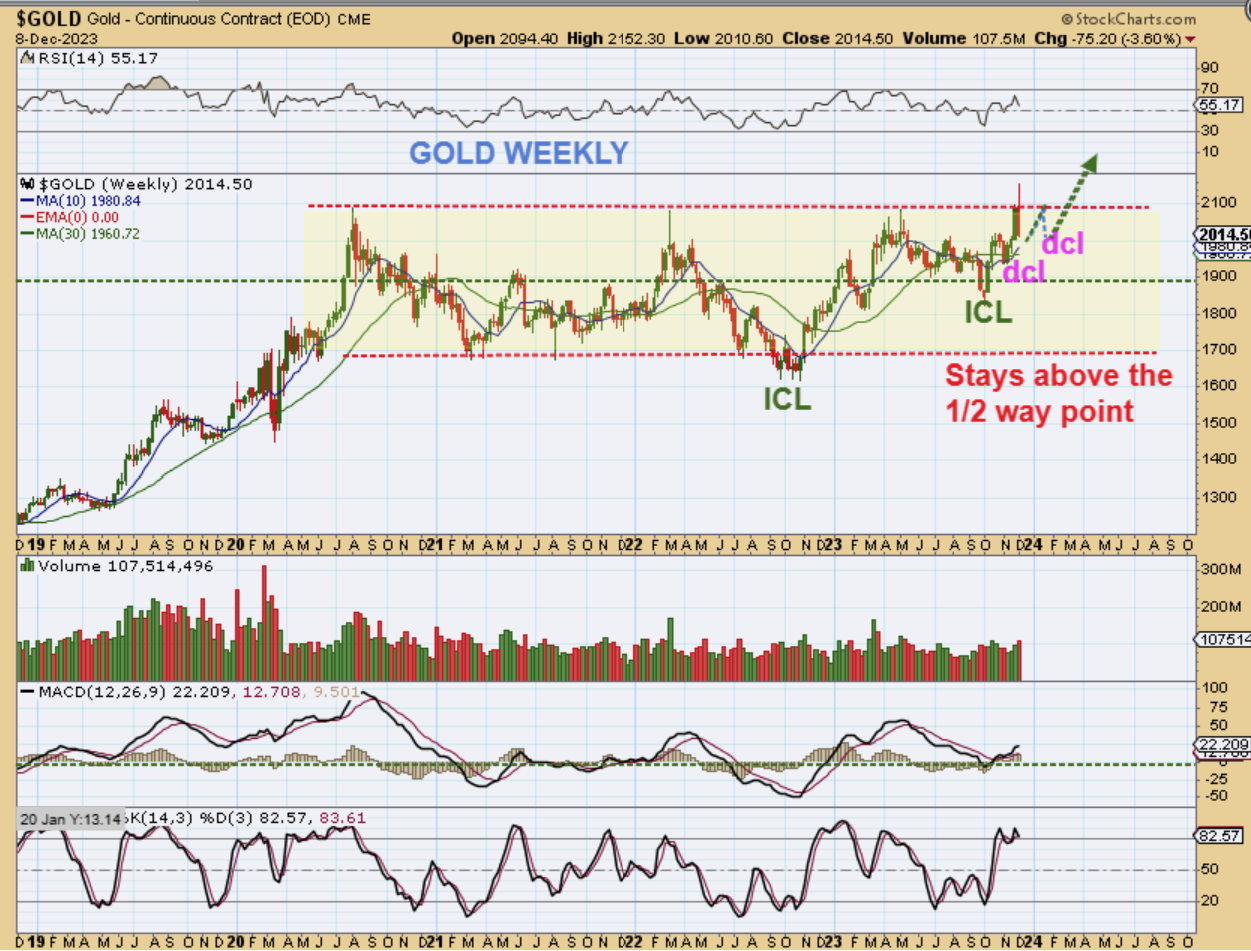
GOLD WEEKLY – Can Gold possibly put in a higher dcl with this 2nd daily cycle and then attempt to breakout on the 3rd daily cycle? It does seem possible, but only because the Miners are holding up very well. If that 3rd daily cycle sells off though, I think the Miners will be forced to follow. So what would Gold look like on a daily chart if the 3rd daily cycle attempts to break out?
.
So what would Gold look like on a daily chart if the 3rd daily cycle attempts to break out?
.
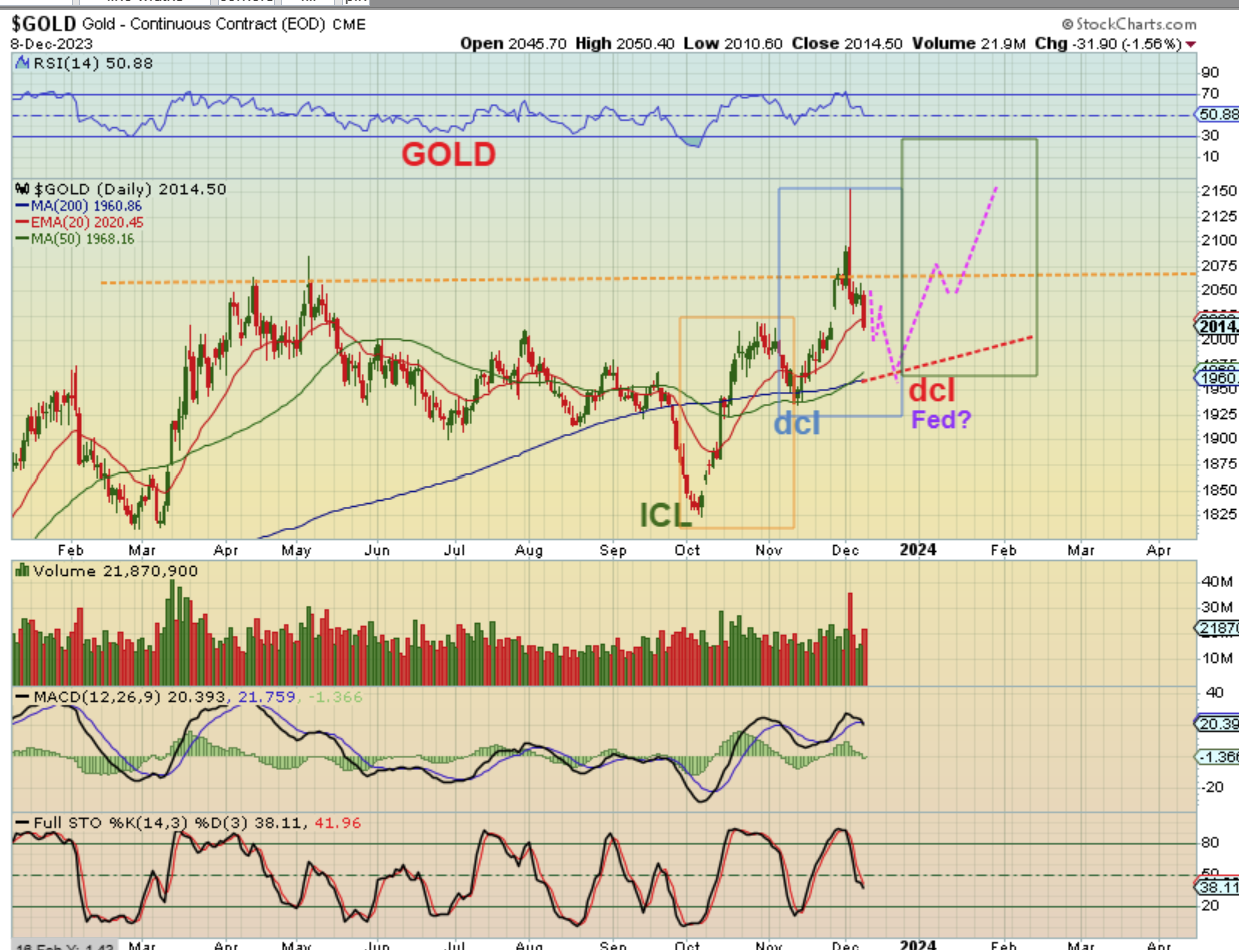
GOLD WEEKLY – It might look something like this. Gold would drop next week into that dcl around the time of the Fed Mtg. The 3rd daily cycle would have to start out strong after the Fed and run back up toward all time highs. Normally I would just say that we had a blow off top and peaked, because that is how markets do peak…
.
Normally I would just say that Gold had a blow off top and peaked this intermediate cycle, and the next couple of daily cycles would just be choppy. That means that this chart may fit best, but with the Miners being strong ( NGD, KGC, etc still up near the highs), it may be that Gold exhausted the 2nd daily cycle, yet will try it again on the 3rd. We’ll see, but I sold my miners and need to be patient for the next dcl. I’m watching that Fed Mtg.
.
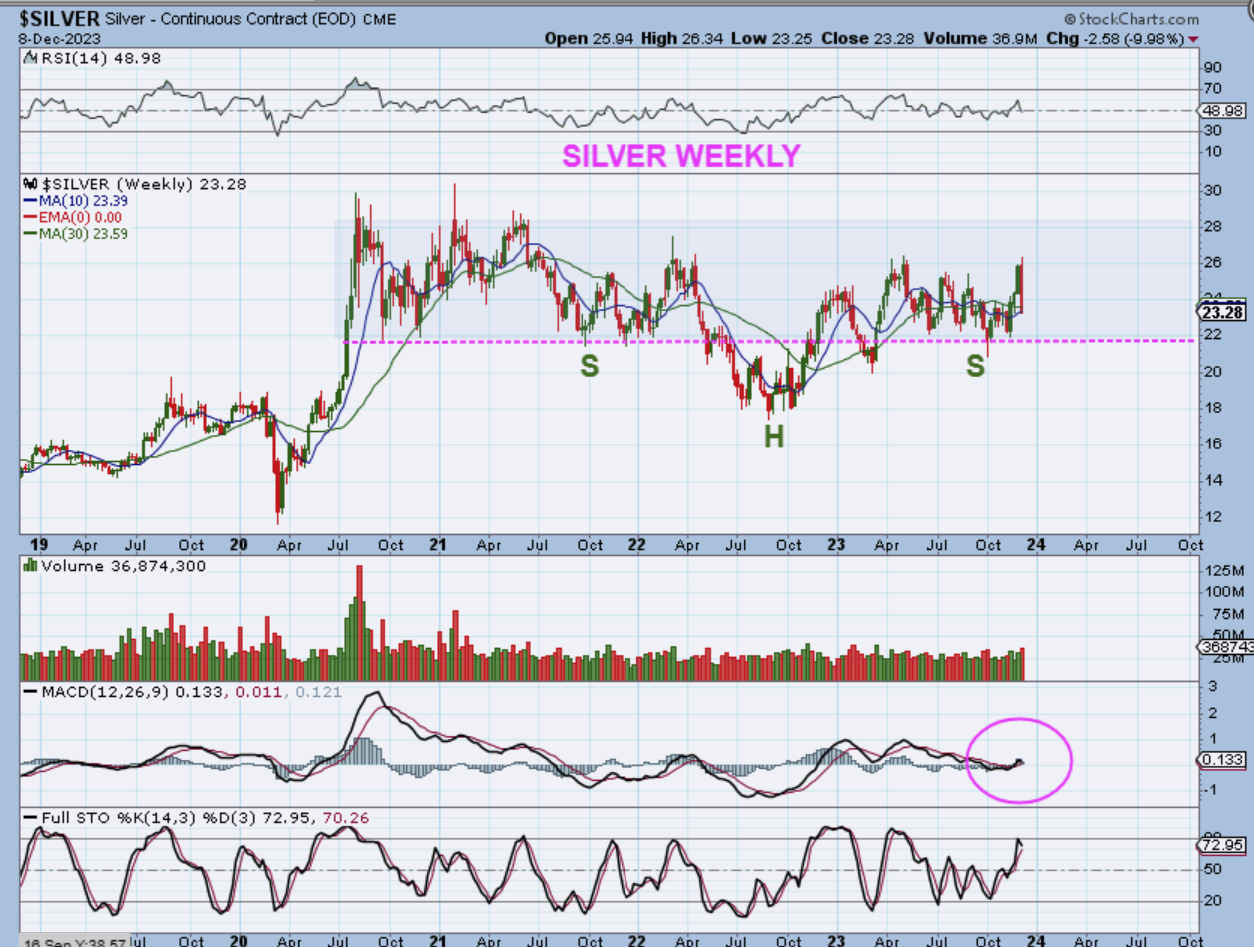
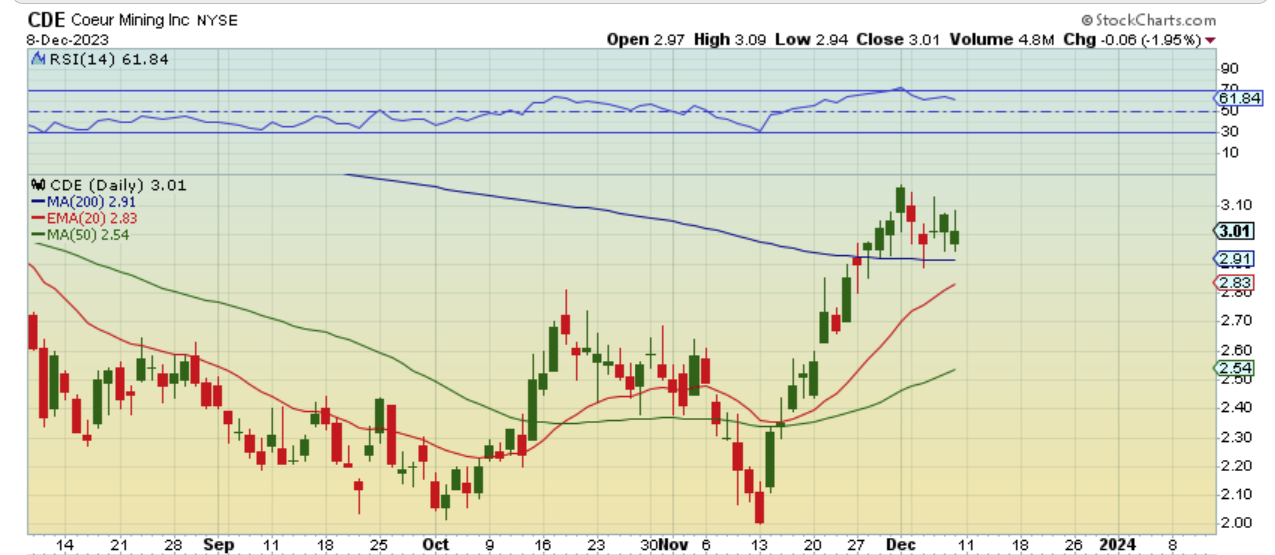
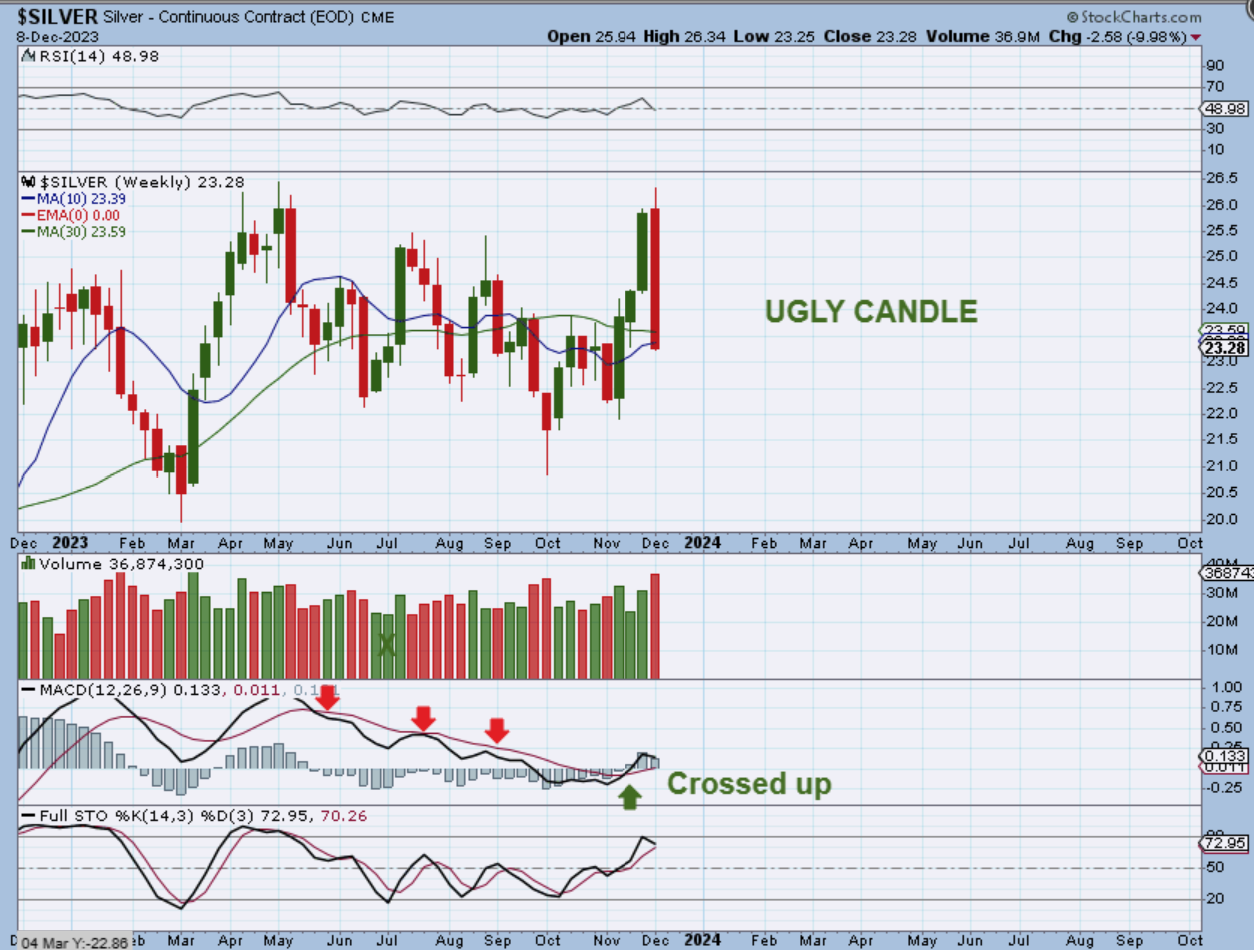
SILVER WEEKLY – Silver crashed 10% this week! Wow that is ugly, but then you look at CDE, HL, AAGFF, BADEF, and other silver stocks and they look normal. EXK and SSRM actually look like they bottomed on Friday, so it’s odd. In the big picture I still see a large inverse H&S. Now let me show you something…
.
CDE looks str0ng and is hanging around up at the highs with a silver crash? CDE had 3 green days at the end of last week, when Silver looks as ugly as the next chart shows?…
.
SILVER WEEKLY – Why didn’t Silver stocks Crash with this ugly week? Close up we just had one big ugly weekly candle, down 10%. Again, Silver stocks did not reflect the pure ugliness of this sell off, so I have to wonder if this will recover sooner than later, after some consolidation? I guess time will tell and maybe the FOMC Meeting will give us a clue too.
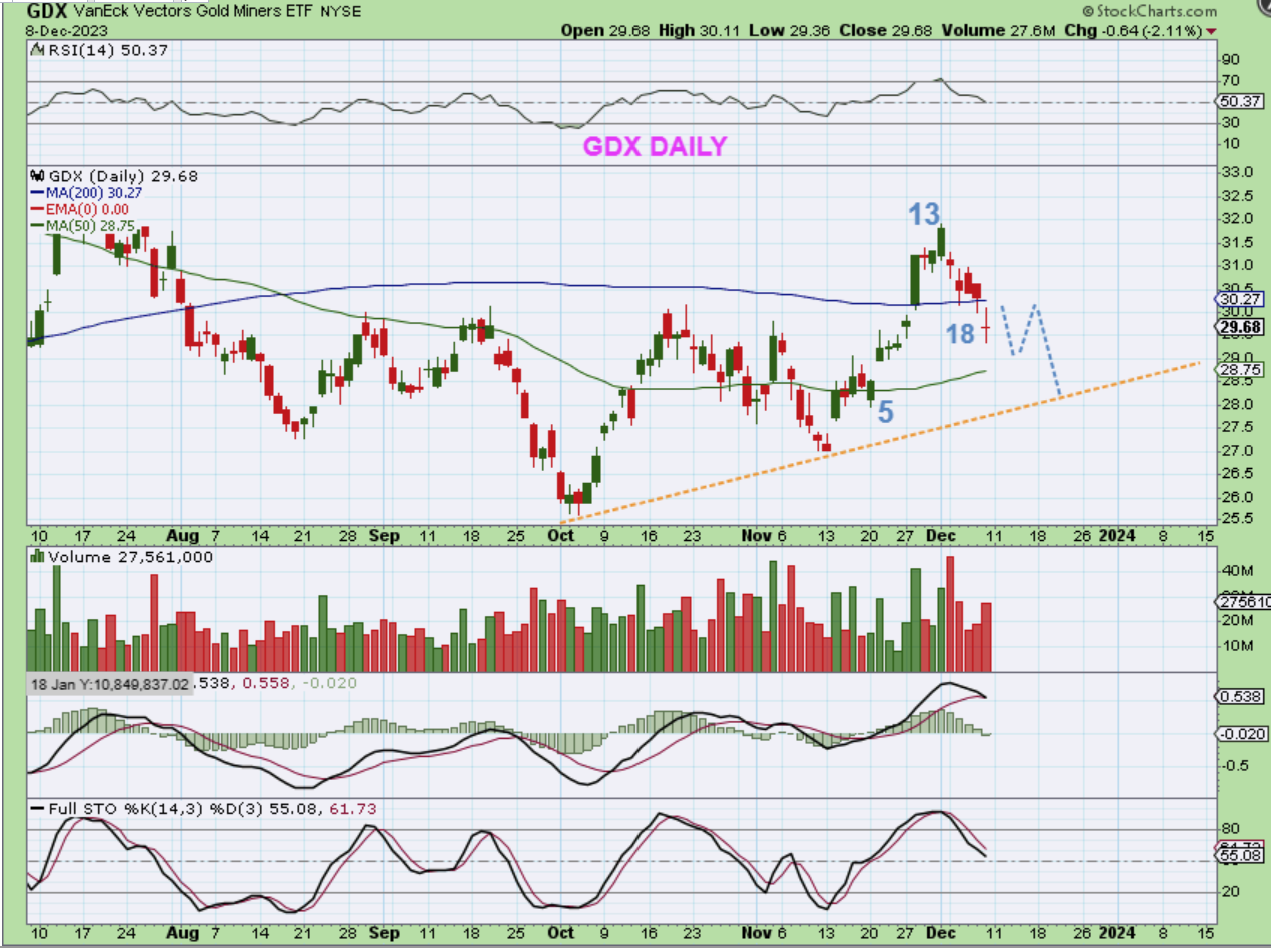
GDX sold off to the 200sma and held up for 3 days, but it did lose it on Friday. This is a doji, and indecision candle.
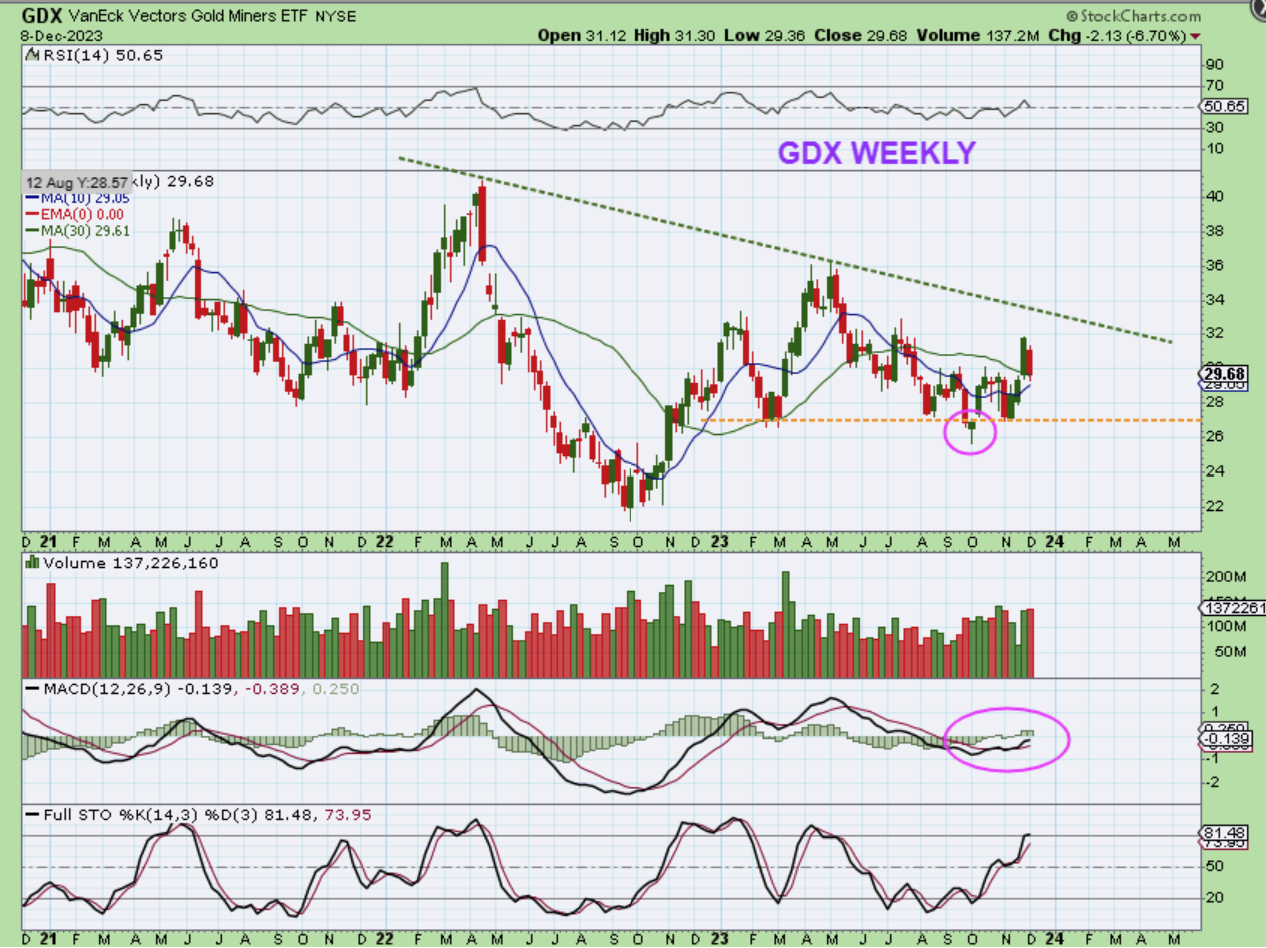
The Weekly GDX Chart shows a shake out reversal candle in October and then a push higher. At this point in time, last weeks drop still has price above the 10 & 30 week ma.
.
We are heading into a Fed Week, and we know that Fed Decisions and his speeches can affect price, so we’ll see what happens then. For now, The General Markets and The Crypto Sector /Stocks are very Bullish, and Oil may be close to putting in an ICL. The USD looks to be turning bullish again, and Precious Metals are mixed. I see miners staying bullish while Gold and Silver may need to consolidate after that exhaustion run. How much consolidation remains to be seen, but honestly, even with Silvers slam down, The Miners look bullish. Let’s see what this week brings, along with a Fed Wednesday. There is more below with Crypto. Enjoy your weekend! 🙂
.
~ALEX
.
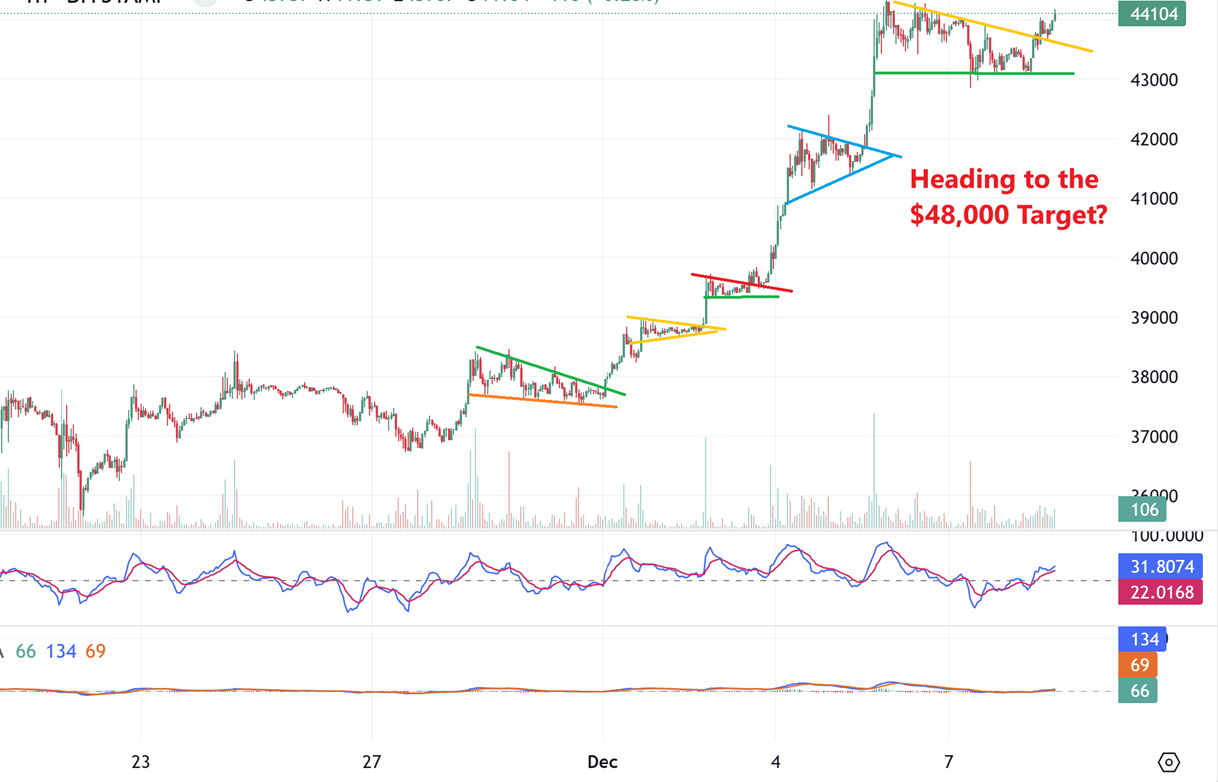
BITCOIN HRLY CHART – Bitcoin has moved higher all week again, as seen in this chart of rallies and consolidation patterns. On a daily chart it looks like it is going straight up, but this shows healthy consolidations as continuation patterns.
.
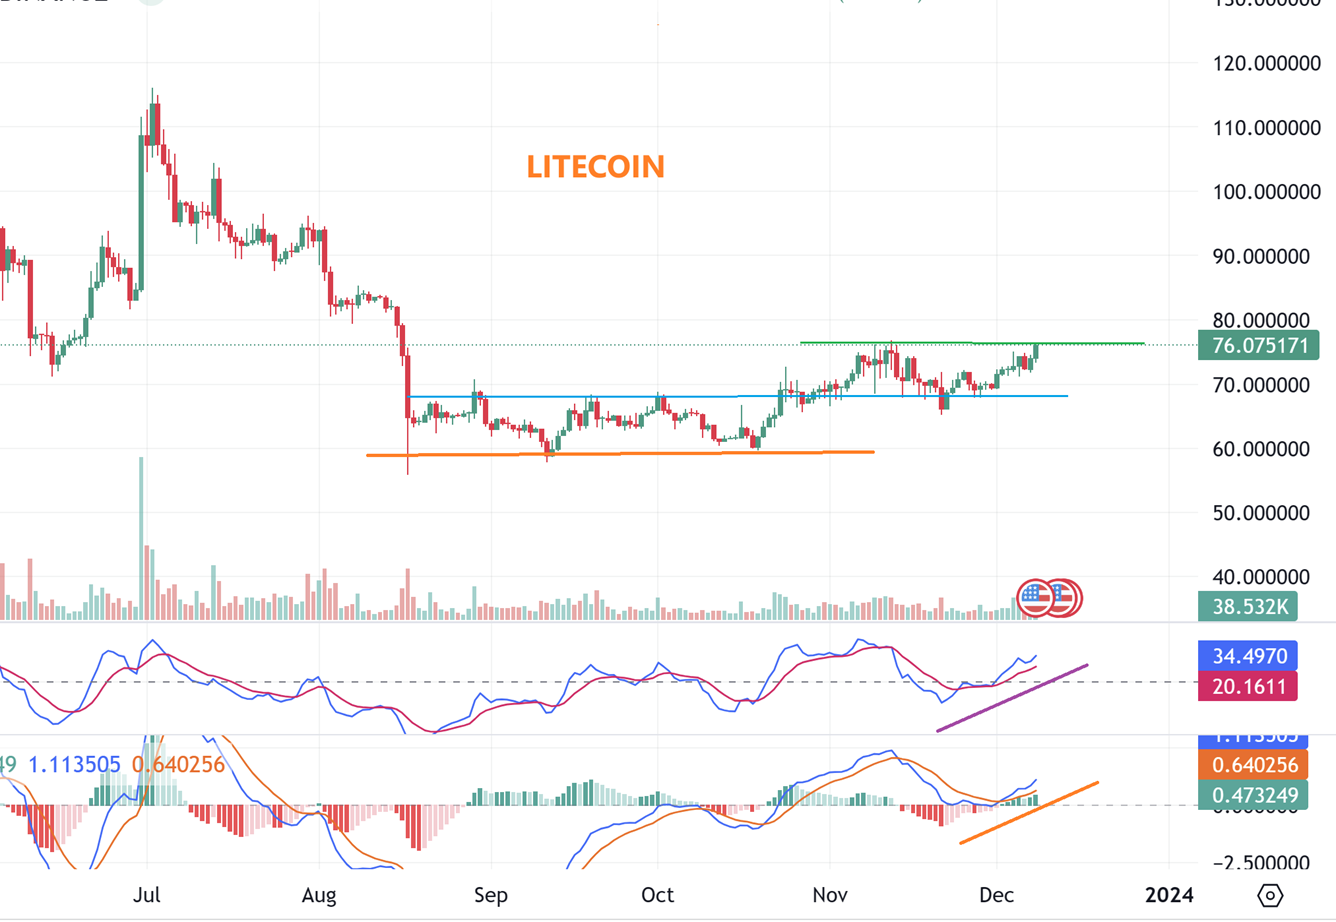
LITECOIN, ETHEREUM, DOGECOIN, ETC all seem to be basing and breaking out on their weekly charts.
.
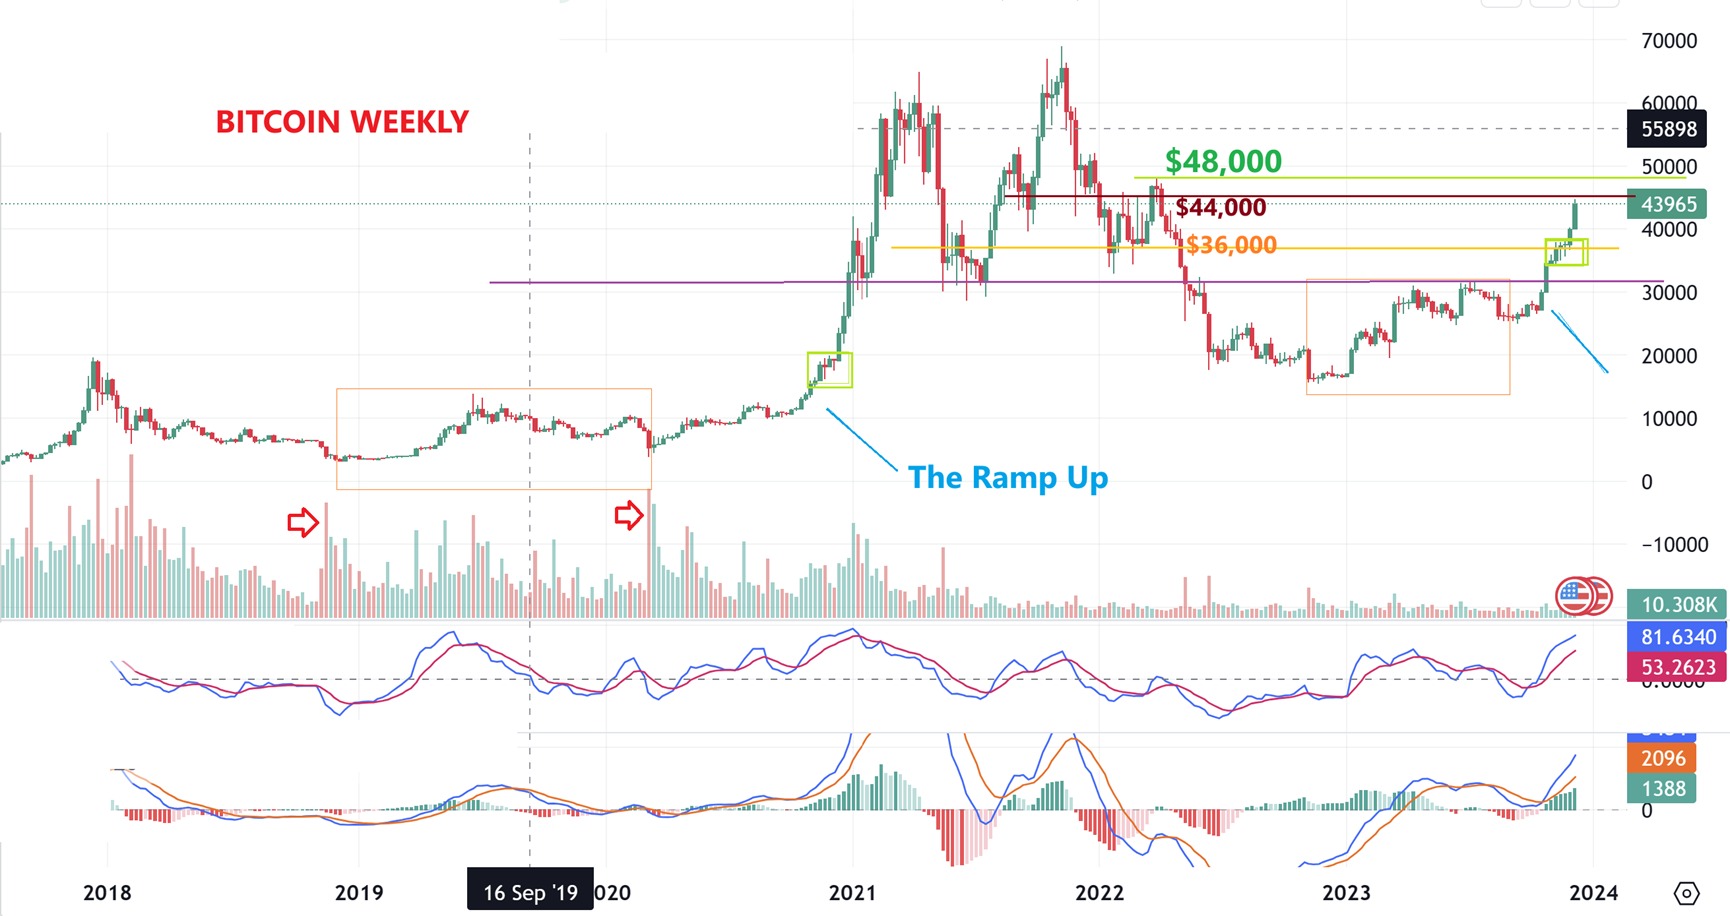
With weekly charts like this one of Bitcoin, I have been pointing out the upside Targets, and targets are based on Cycle counts, technical analysis, and price points of support & resistance. Bitcoin has been strong and simply moving from one target to the next, which leads me to something else that I have been watching for and discussing. Notice the big ramp up that took place in 2020, with some chop at the green box…
.
I’VE DISCUSSED THE BIG RAMP UP THAT COMES EVERY 4 YEARS DUE TO HALVING, ONLY THIS TIME SOMETHING EVEN MORE EXCITING SEEMS TO BE HAPPENING. THE RAMP UP IS TAKING PLACE EVEN EARLIER THAN USUAL (LIKELY DUE TO THE ETF PROPOSAL), SO I’M THINKING THAT IT MAY LAST EVEN LONGER. NOTICE THE SIMILARITIES…
.
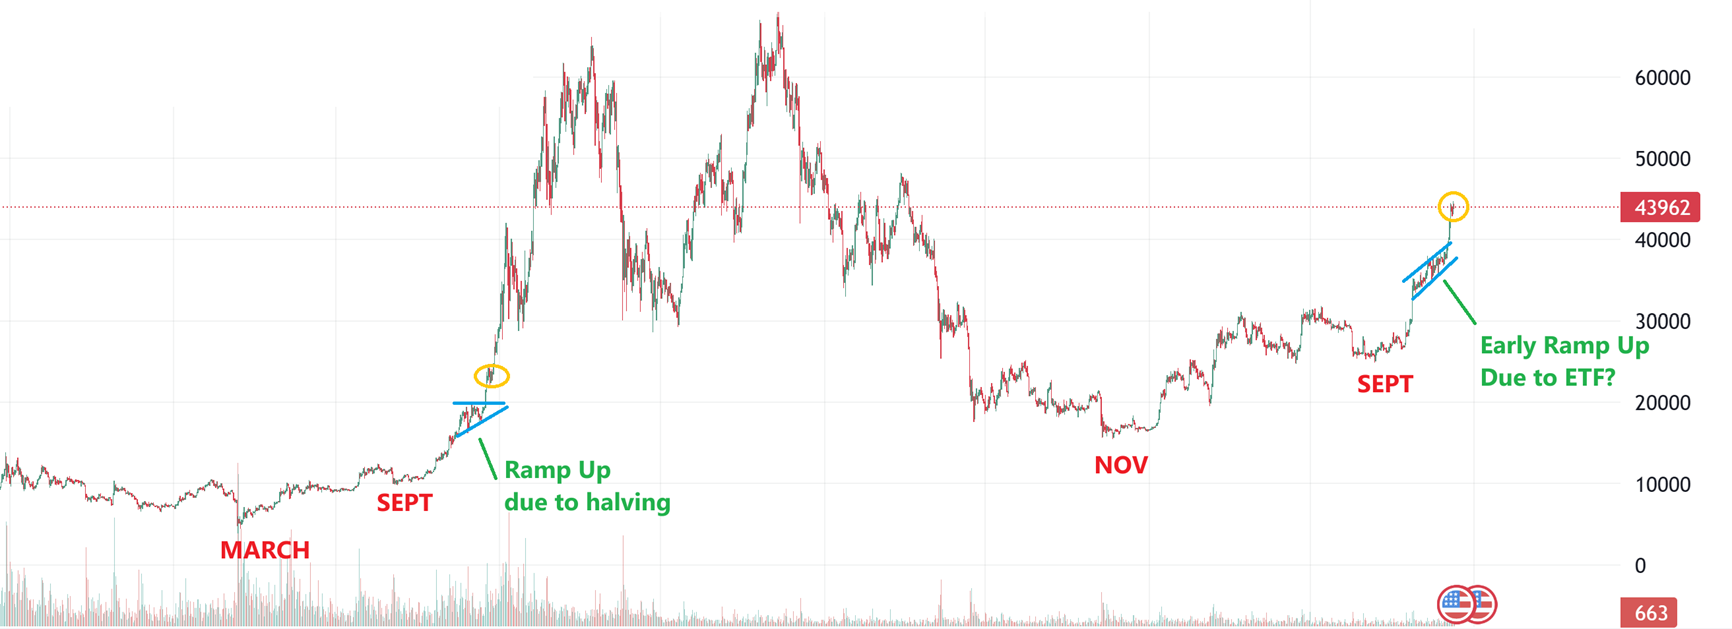
BITCOIN began to move out of an ICL in March of 2020, and then after a brief drop in Sept 2020, it started to ramp up in a much steeper manner. I was expecting that in 2024 too, with some nice gains at the end of 2023, however we seem to be already in a steeper ramp up phase due to the possibility of Bitcoins ETF. Notice the Similarities…
.
1. A quick dip in September starts a choppy base.
2. That base starts the ramp up , but instead of the same old pop and drop,
3. We start to see price consolidate in a choppy bullish manner, unable to sell off, and broke higher. Price then broke out from the blue consolidation…
4. Price then broke out from the blue consolidation and it ran straight up. The yellow circle was a pause then and a pause now, and it then continued higher. Will this just continue to push higher like it did in 2020? It could. Let me show you why this very is able to continue to run higher…
.
BITCOIN -Many years ago (2016 & 2017), I was noticing that the deeper dips came every 60 days (Dcls), and yet we did get milder dips every 30 days too (they must be roughly 1/2 cycle dips). Back then those deeper dips tagged the 50 sma until it went parabolic, so I pointed that out then with this chart. That isn’t happening now, so ignore it, but the roughly 30 & 60 day dips do still happen. We madegood money trading it that way then & again now. Nothing has changed. I still see the main dips every 30 & 60 days. Let’s move forward to today…
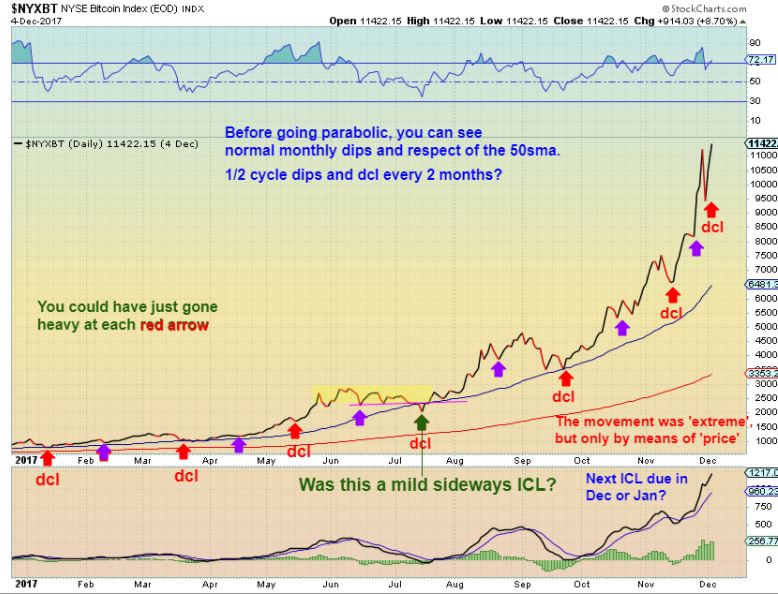
.
We were counting out the cycle counts recently and BITCOIN only had a slight 4 day dip at day 30, and then the deeper dcl dip was also minimal at day 64. This may indicate that it was starting to go parabolic. RIGHT NOW, we are only on day 25 of the next daily cycle, and that last run peaked on day 59. I’m NOT saying that that this won’t ‘peak’ until day 59, but what that does mean is that possibly we will see another mild dip around day 30, and then it can just continue higher. So…
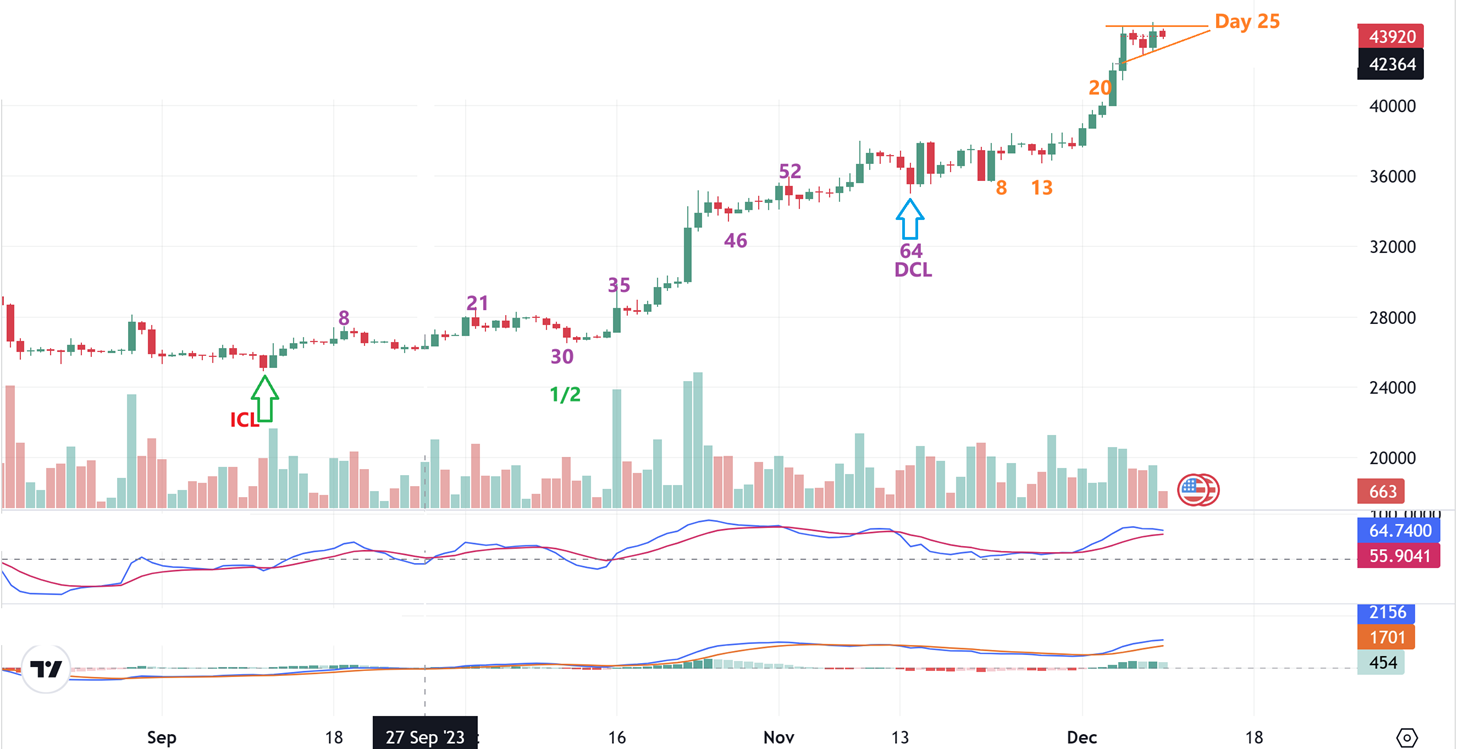
.
Saying that we are on day 25 of 60 and that this could go higher brings me back to this chart and that yellow pause.
Price could continue higher if this is a repeat of what we saw in 2020. I would normally expect a pullback after an extended move like this, but right now I just want to ride our basket of cryto stocks and see where it goes. We may start to dip into a dcl sooner than the last daily cycle did, but that next dip still may not happen until day 40 or so. We’ll see, but the crypto basket has been ‘buy and hold’ for weeks now, and the gains are BIG. I also feel that due to the halving of 2024, any dip later will become a major opportunity, because the halving ramp up may follow in 2024. New highs are expected, and I’ll discuss that as time goes on, but that ramp up could become very very strong.
.
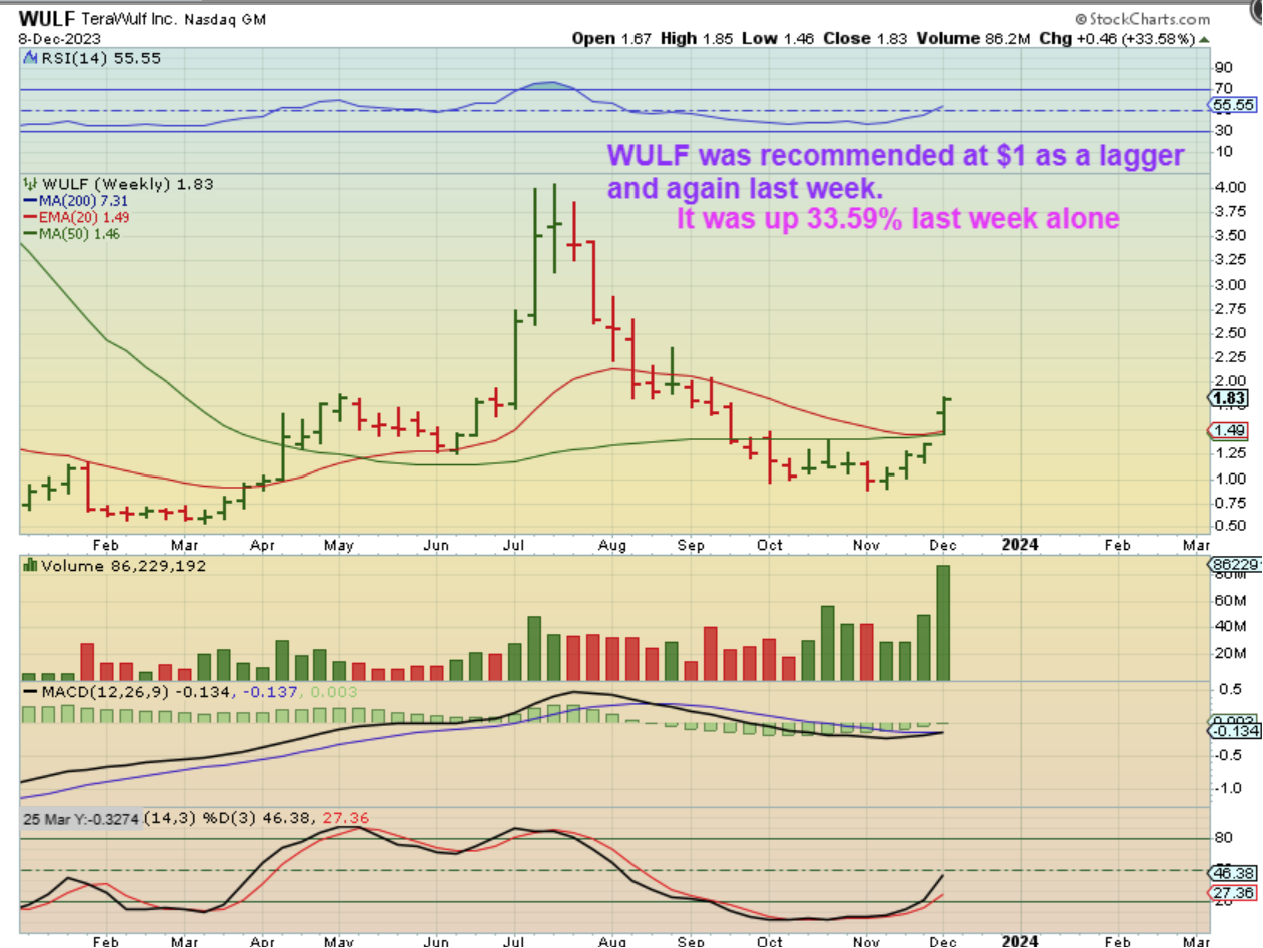
WULF WEEKLY: This was a buy for our baskets at $1 and again last week, as it approached the 200sma on a daily. WULF was up 33% last week alone. It can run to $4, and then more later in 2024.
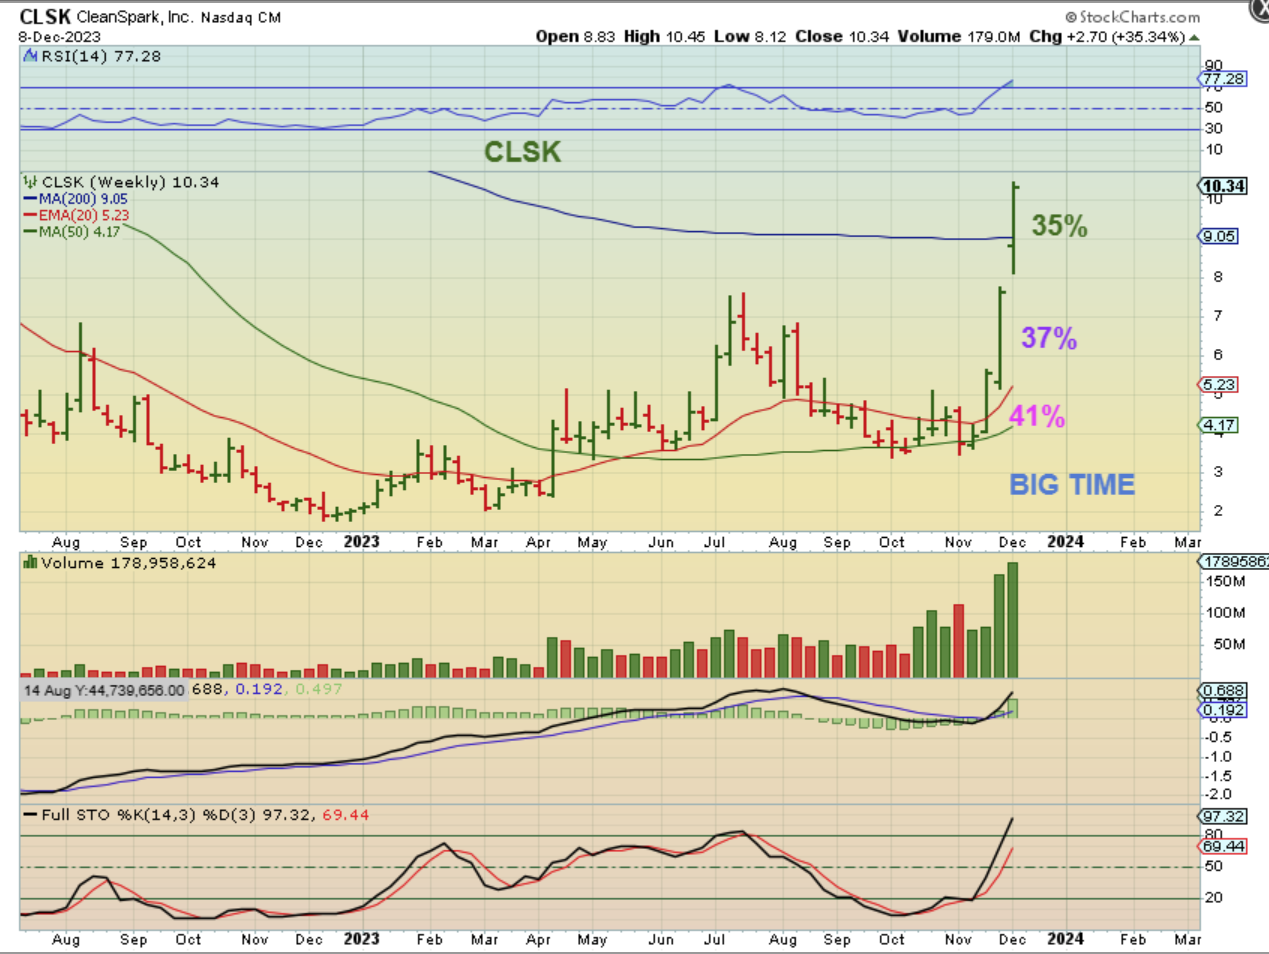
CLSK WEEKLY: This one has been ridiculously profitable, week after week. Under $4 to over $10 in 3 weeks.
.
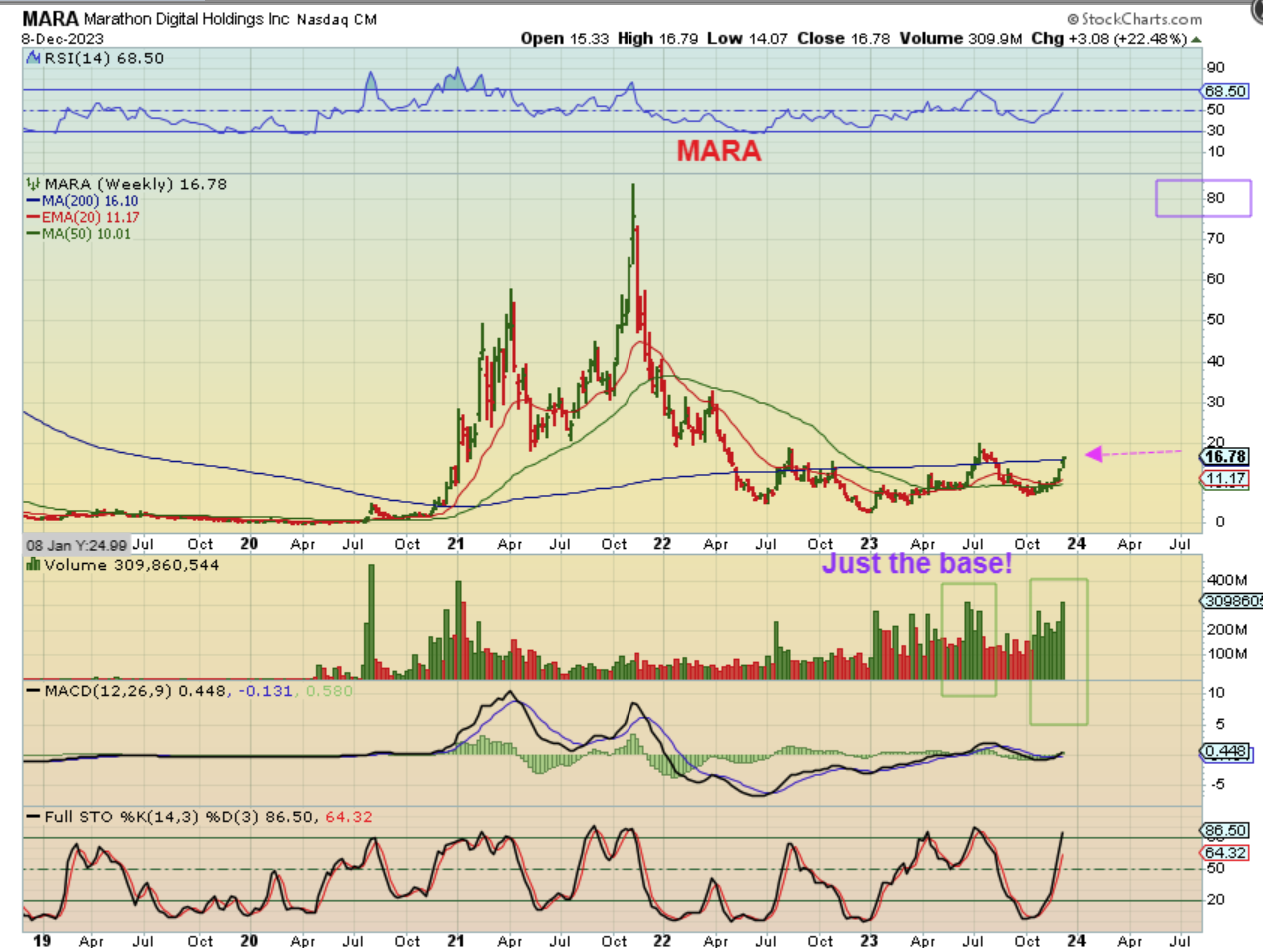
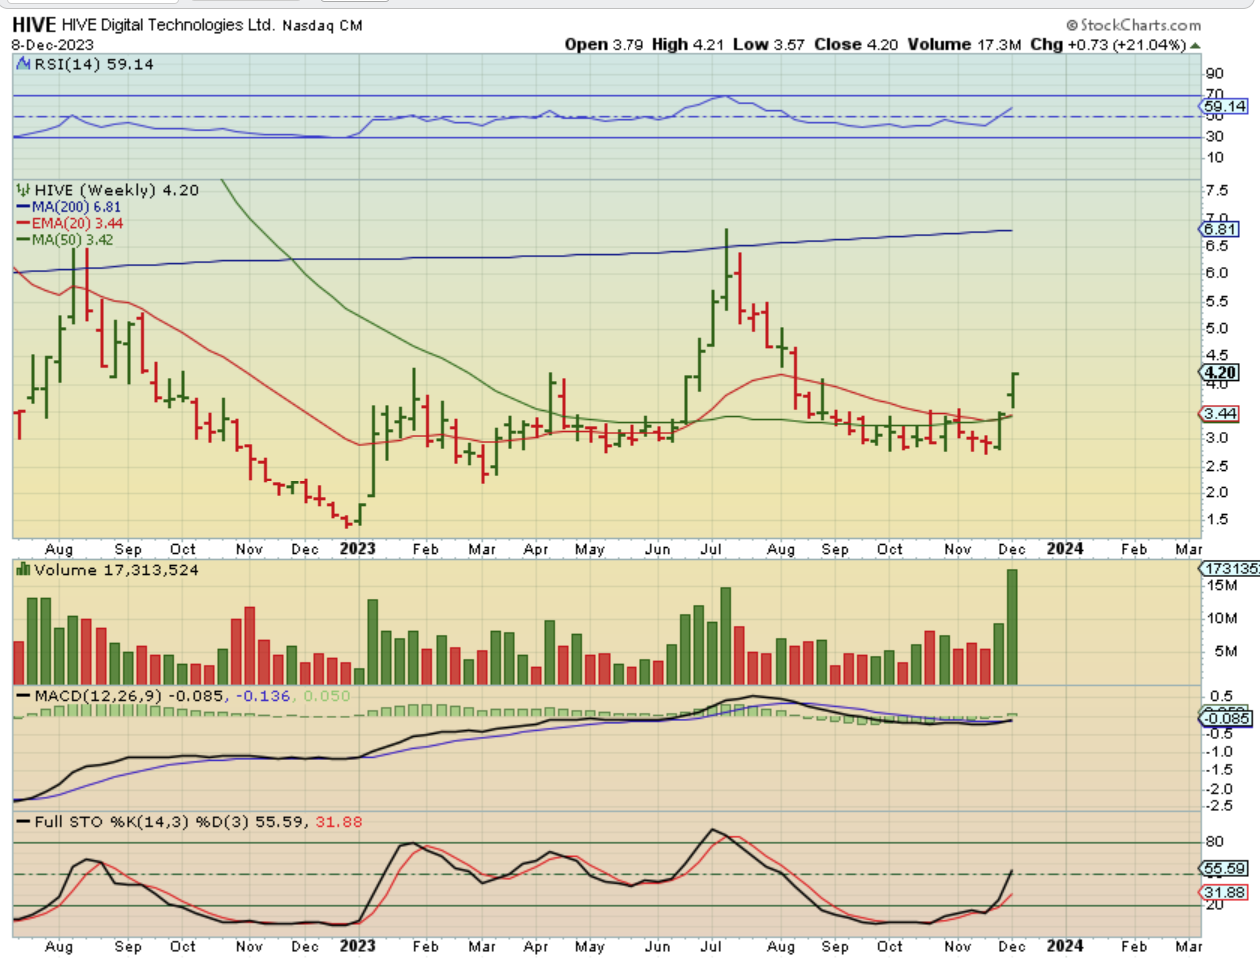
MARA WEEKLY: MARA was up another $22.5%. These gains are FAST. 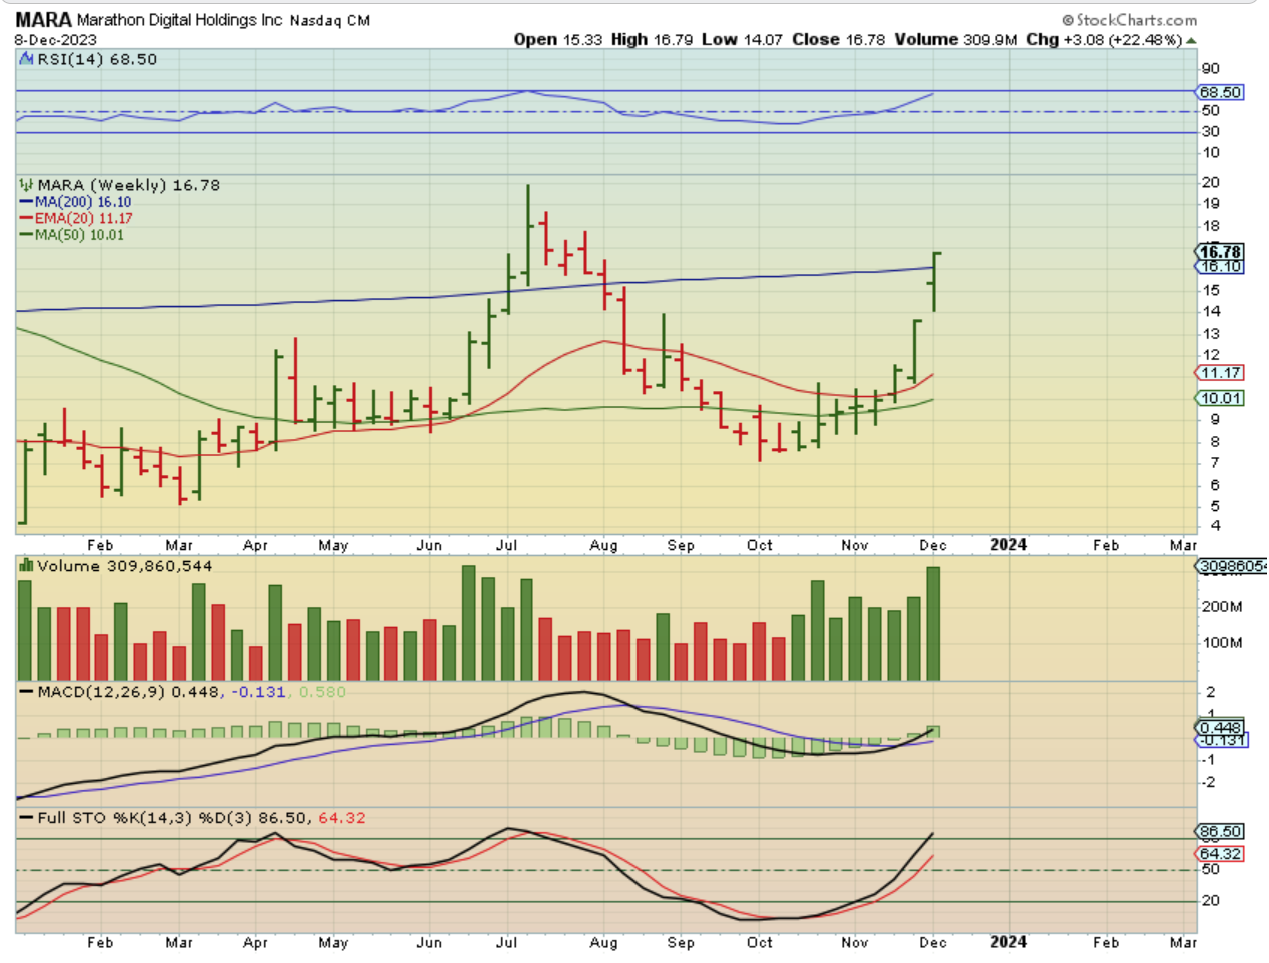
It’s funny to say that a stock that was up 21% could be a lagger just getting going, but take a look at weekly charts of HIVE, EBON, and CIFR. They have Popped, and yes, they could pull back, but they may just be starting to go now too. Even BTBT was up 25% last week alone, but it looks like it has more to go.
.
IF BITCOIN / CRYPTOS CONTINUE HIGHER, THEN I FEEL THAT THESE STOCKS WILL TOO. IF CRYPTOS HAVE A DOWN WEEK OR PULL BACK FOR A BIT? THESE COULD TOO, AND WE ALL KNOW THAT THEY DO PULL BACK SHARPLY! They can be hard to hold, but easier if you buy near the lows or after a pullback, so please be aware of that. If you can buy the lows on the next dcl pull back or get in on a dip, then it’s a bit easier to ride in 2024,
.
…but many of these are actually still breaking out from recent bases, and they should may have a LONG WAY TO GO over time and in 2024! 🙂