
November 5th Weekend Report _ Bullish Set Ups
,
FRIDAY I GAVE THIS TO YOU AS THE CYCLE COUNT:
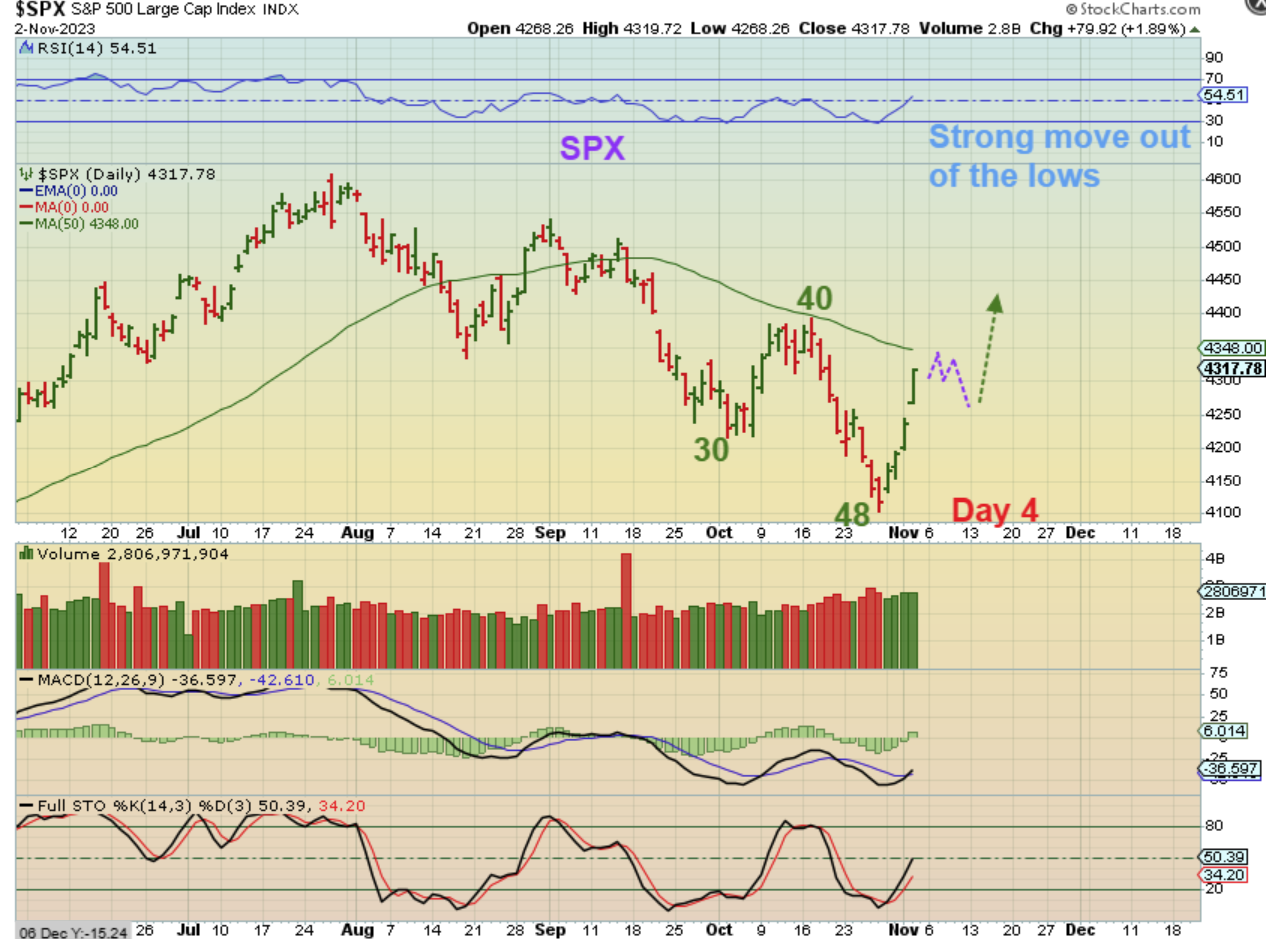
THE SPX was up almost 80 points Thursday. I am thinking that we have a 5 wave drop into the ICL and on day 48 we see our lows. The General Markets ripped out of those lows, adding really good gains Wednesday and Thursday with the FOMC Meeting.
.
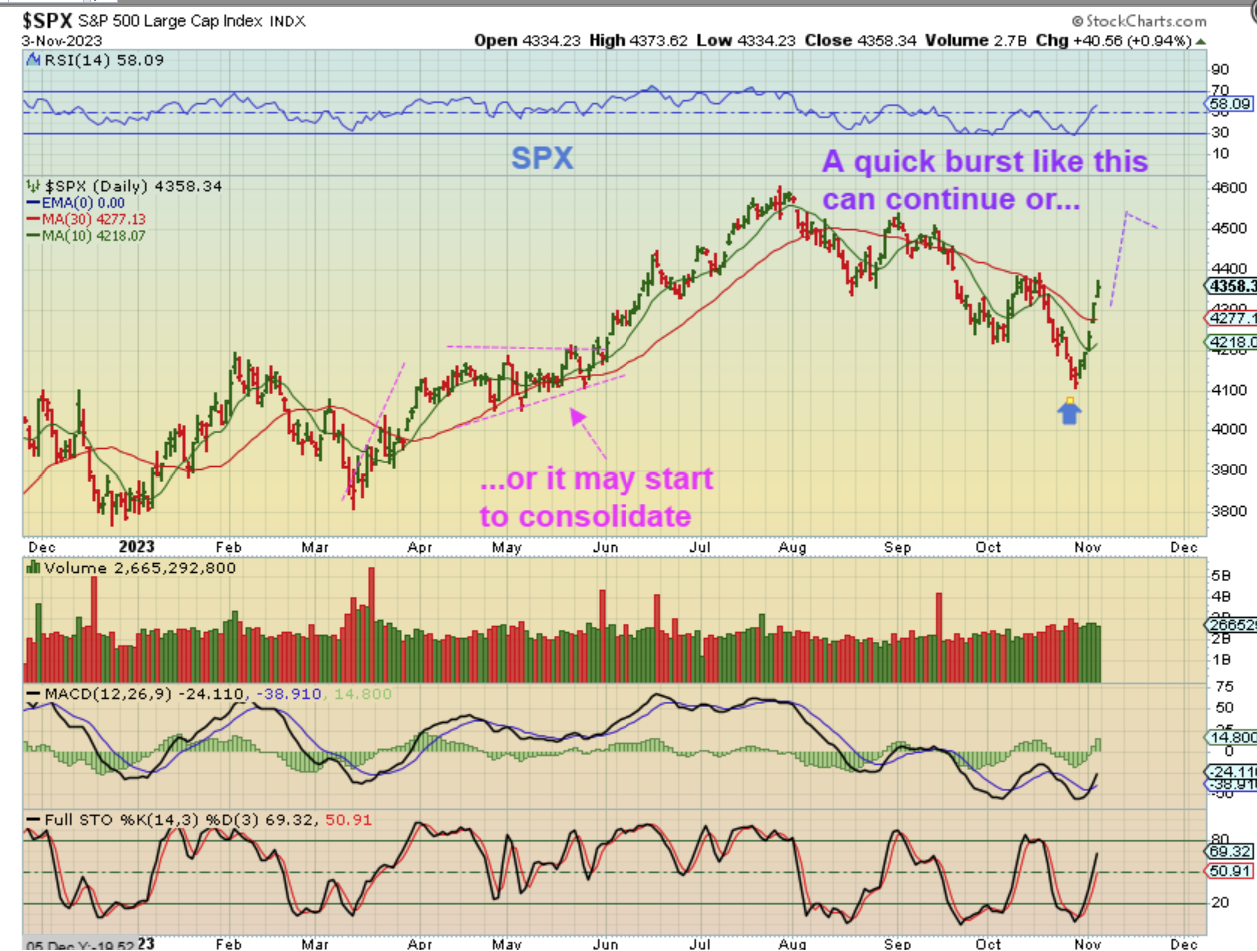
THE SPX – This is a Post Fed rally, we were expecting an ICl, so this definitely looks like the ICL is in place. This would be day 5 and it can be both buying and short covering. Please read the chart.
,
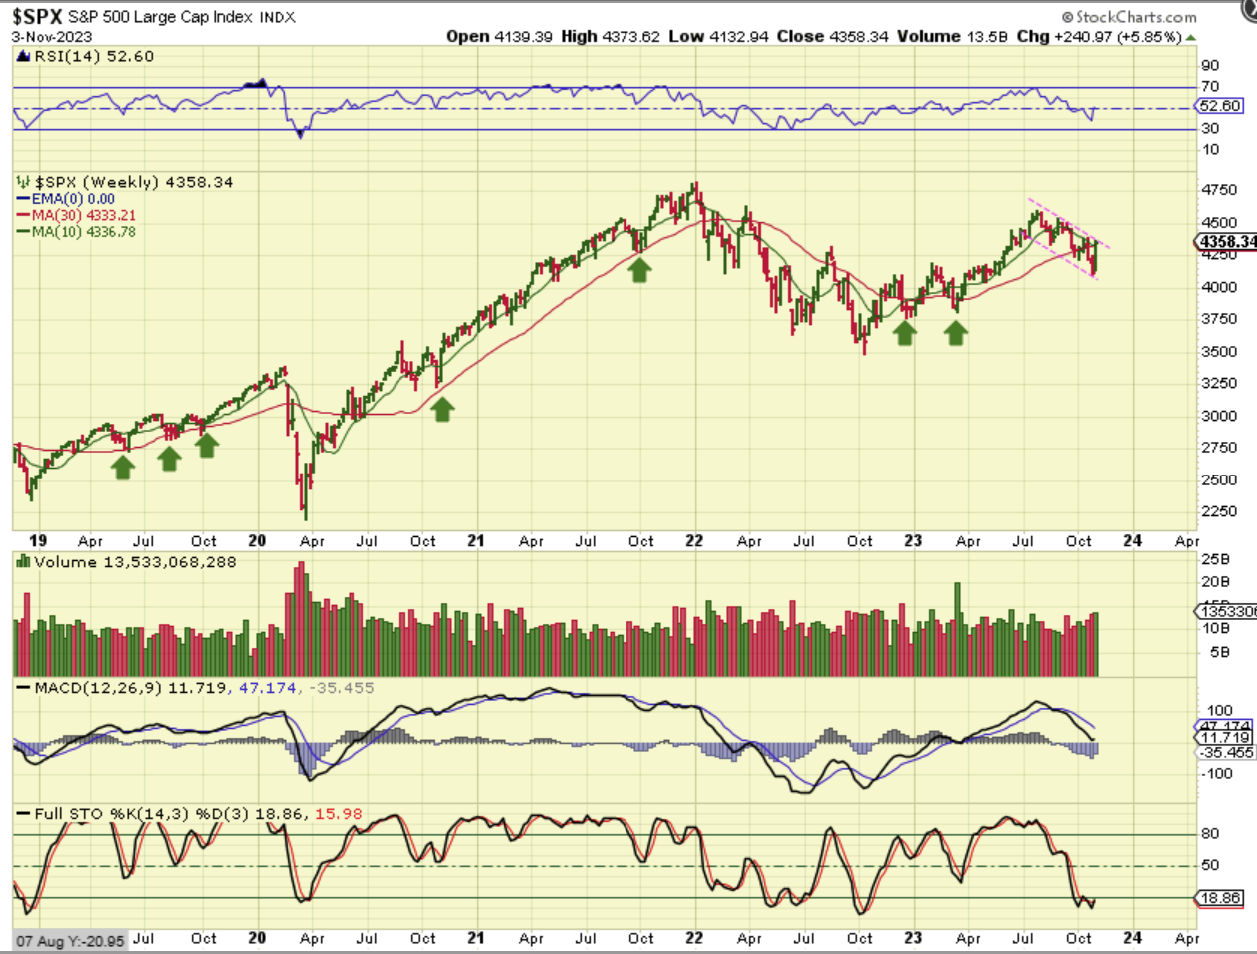
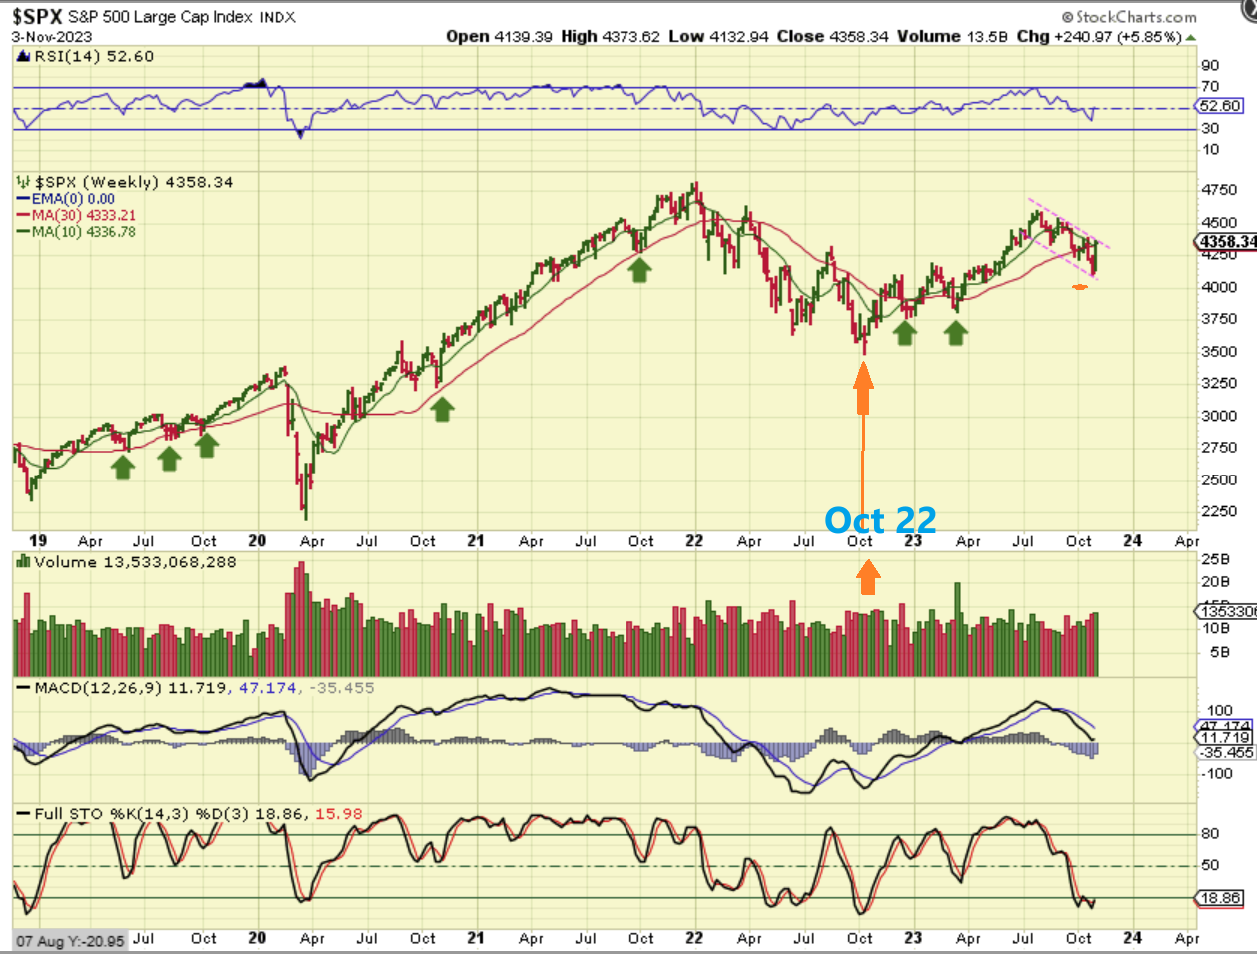
This is The Weekly SPX Chart: It is very oversold and it broke below the 30 week ma, but it is now recovering it with that Post Fed Surge. That is a deep ICL, but we do occasionally see this and then it recovers into a bull rally, so over time this should just continue higher to the 2022 Highs. This does look almost like a very large Cup & Handle now too (the cup didn’t reach the former highs, but it was close).
,
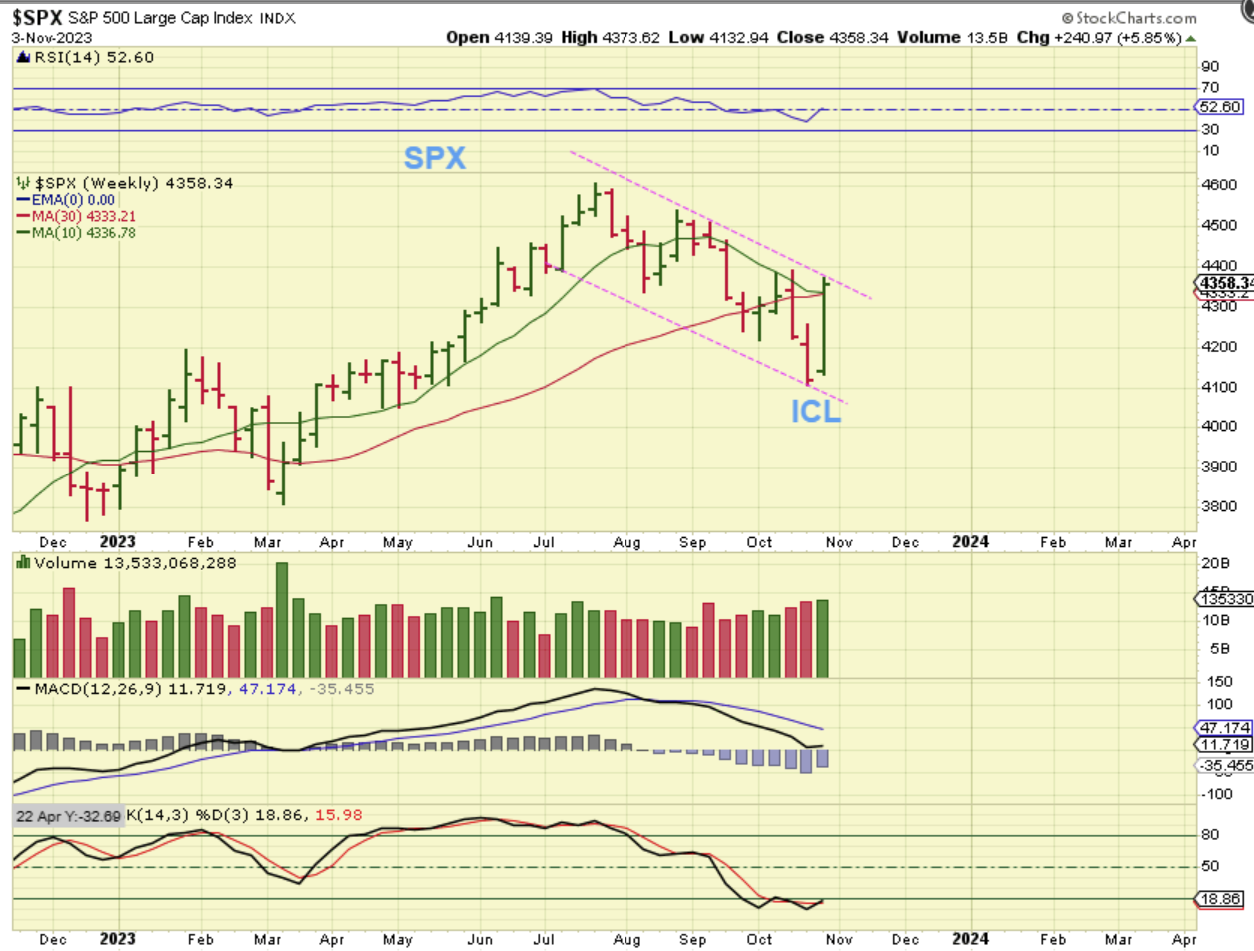
I wanted to take a look at a close up of the weekly chart. That was a break down that looked quite bearish, but what a strong 1 week surge we saw this week.
,
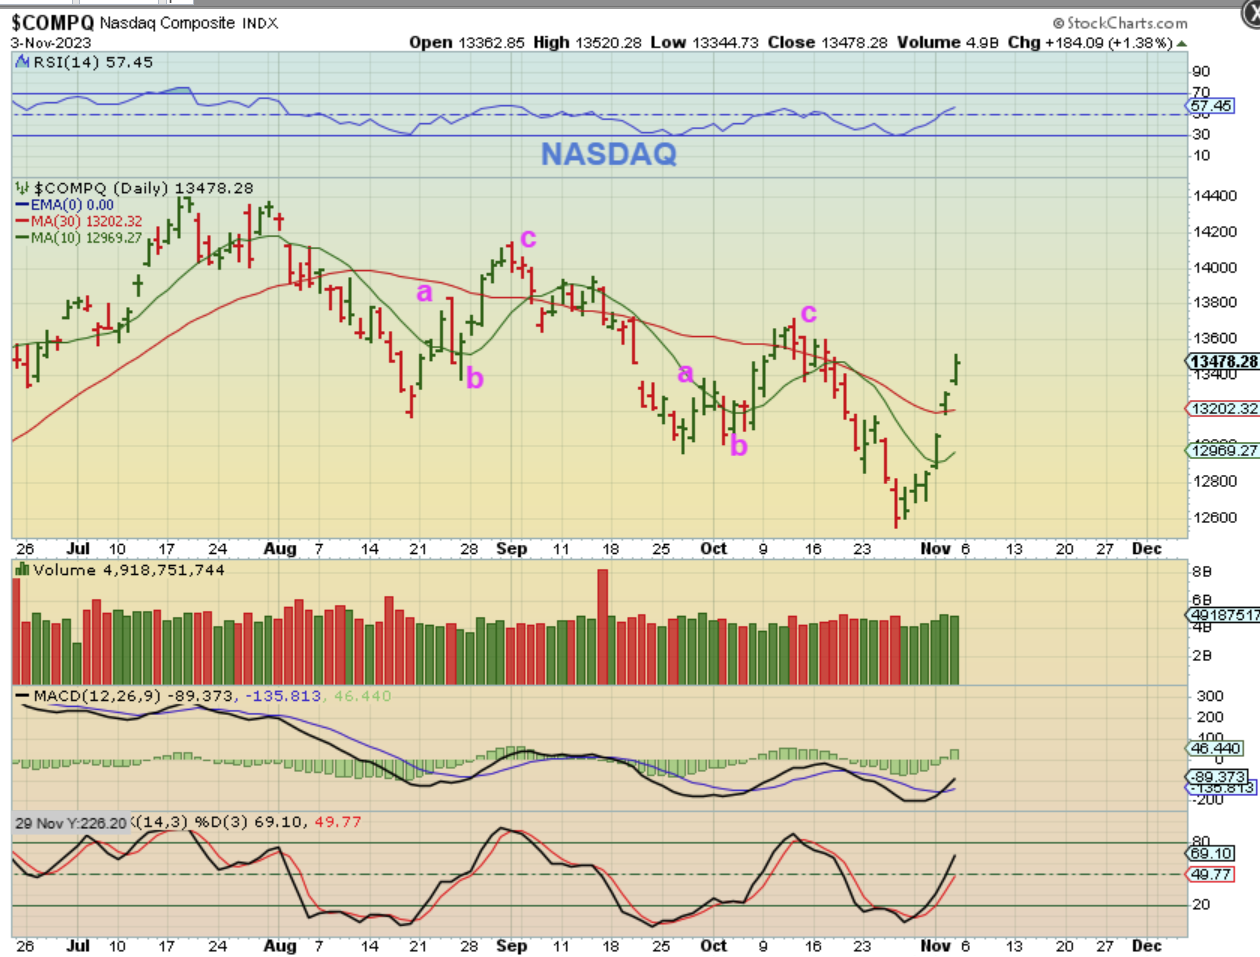
So we are also seeing a change in the NASDAQ. We were seeing a-b-c drop, a-b-c drop, but this rally has been straight up and out of the lows. This does look like a surge out of the ICL. Now let me show you the TLT…
,
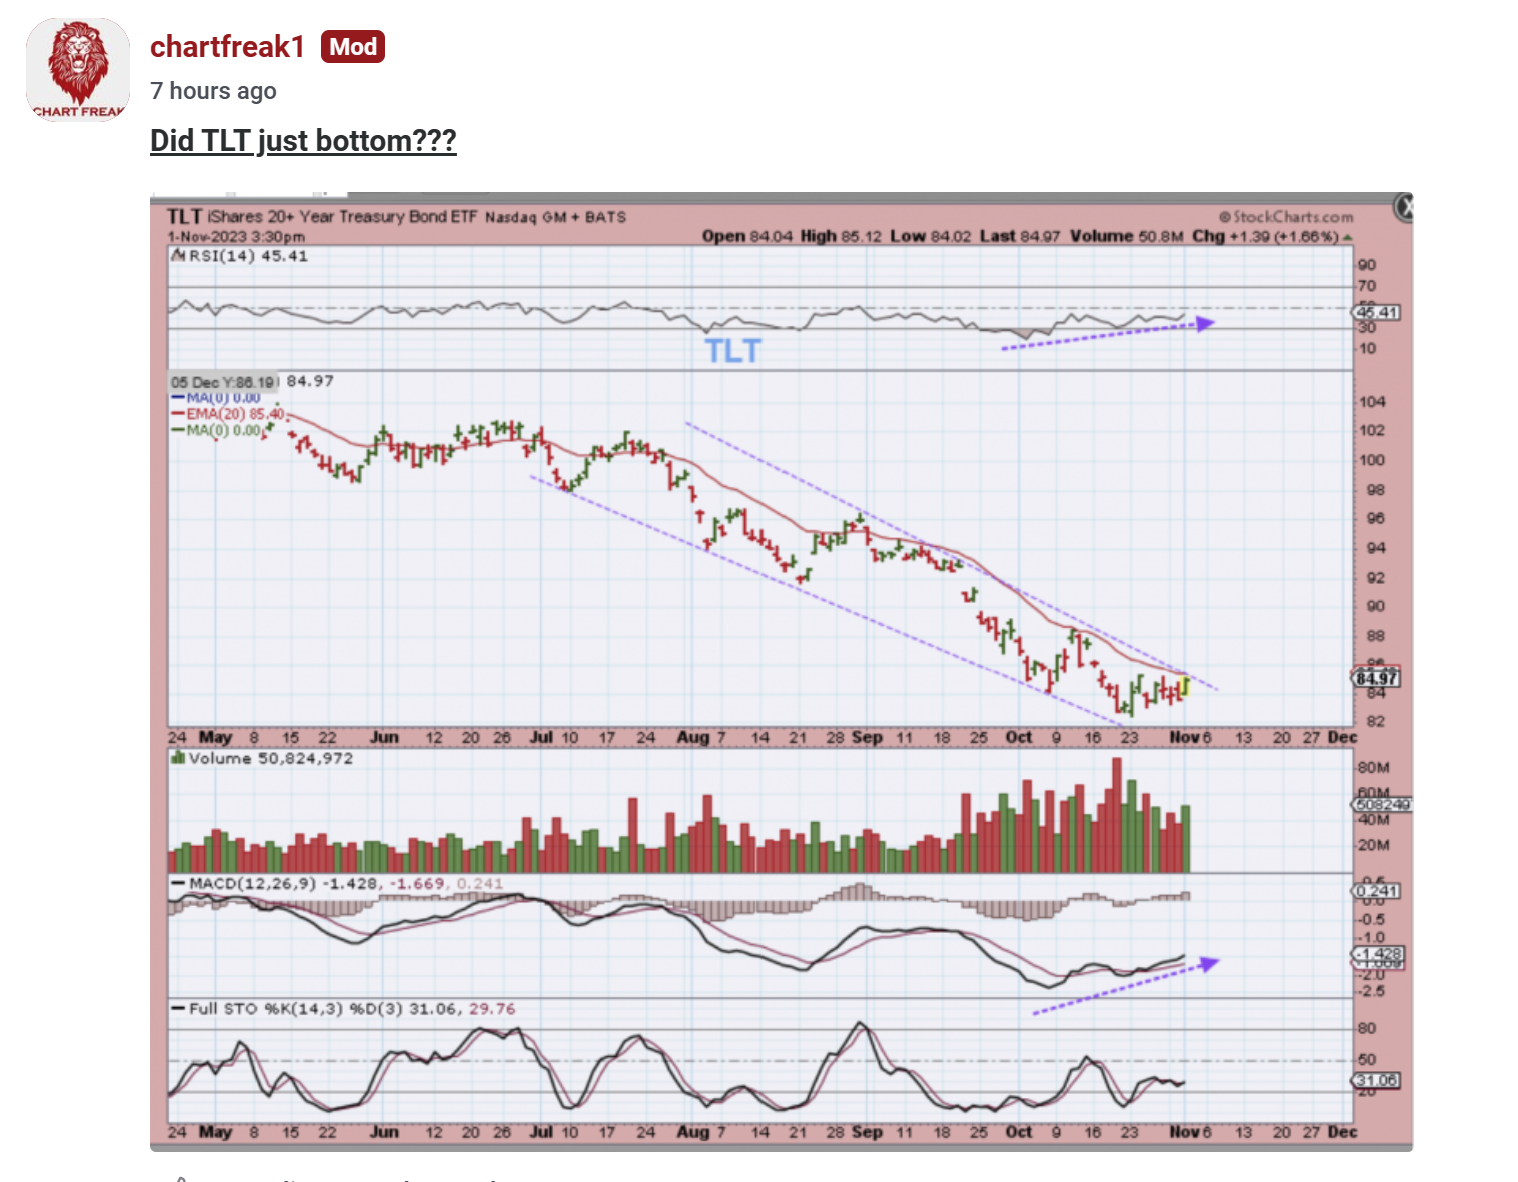
TLT… Last week I mentioned that I was seeing signs that the TLT was bottoming. I wrote this in our live commenting area. I said that one thing that I was watching for would also be a push higher above the 20 ema ($85.40), since that would be breakout of the downtrend.
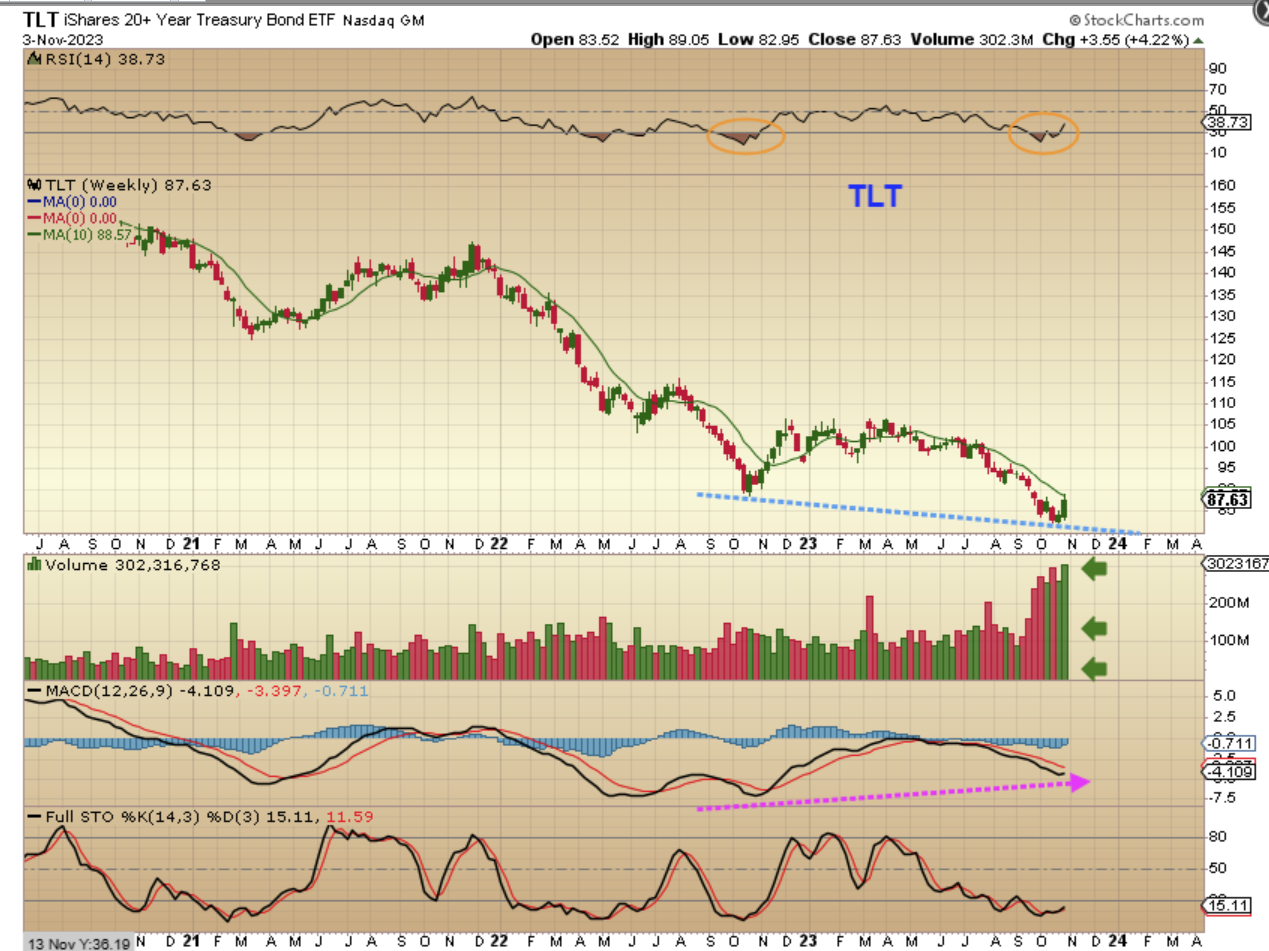
THE WEEKLY TLT IS NOW AT $87.63, and it hit $89. Take a look at that capitulation volume and the divergence on the weekly price vs MACD too. Please notice that the last bottom on the TLT was Oct 2022, let me now show you something …
.
The last bottom on the TLT was Oct 2022, and that is the same time that the ICL formed in both the General Markets and The Precious Metals Markets.
.
Take a look at OCT 2022 on this TLT CHART. It bottomed on Oct 2022.
Now take a look at October 2022 on this SPX chart: That is when the TLT Bottomed and that is when the General Market ‘bear market correction’ bottomed. Next…
‘
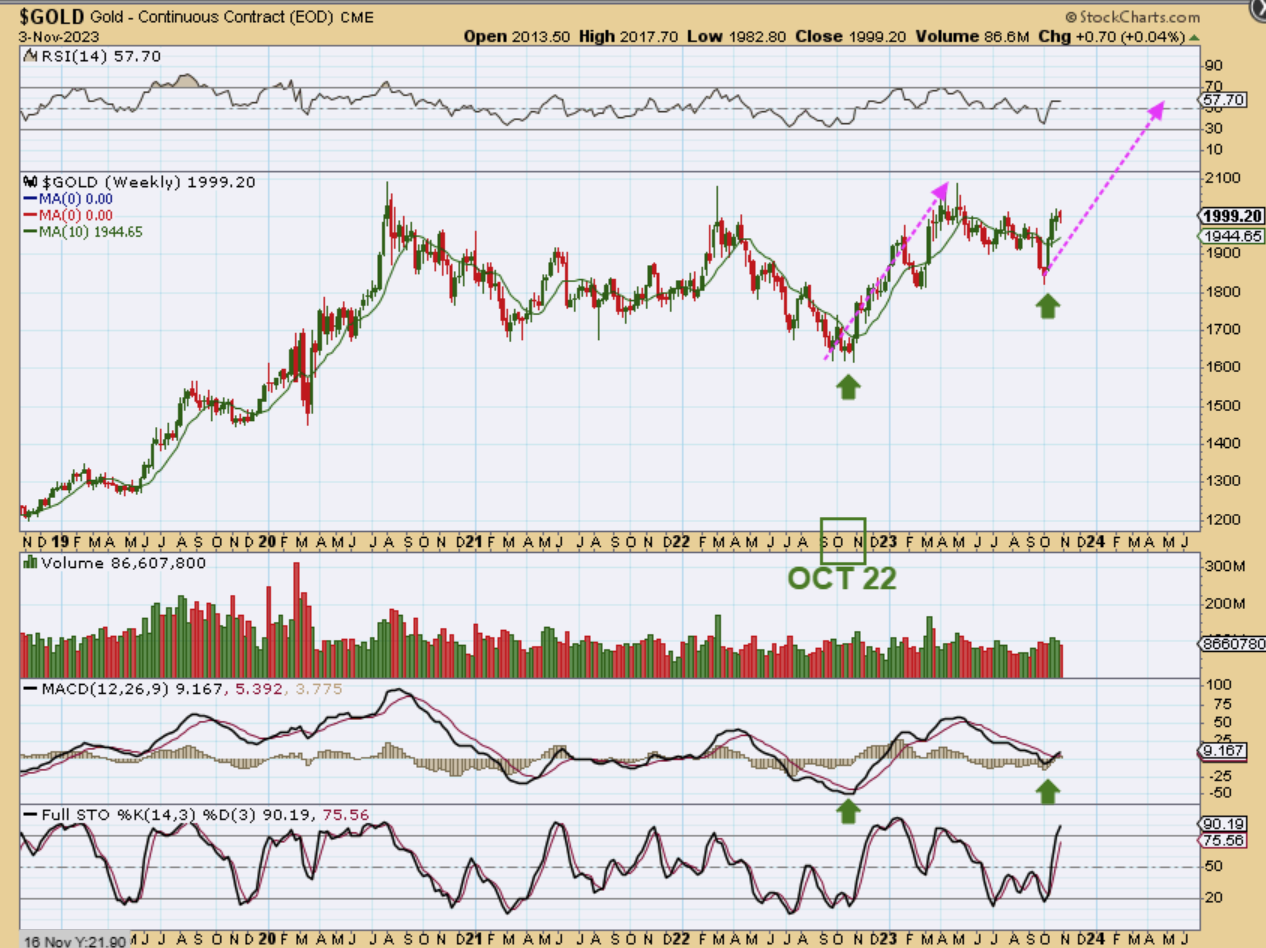
Next take a look at Gold on October 2022. That is when Golds large correction bottomed too. We now have all 3 bottoming simultaneously again. The rally out of those OCT 2022 lows was great, and I am expecting this next one to launch Gold into all-time highs. Got Miners??
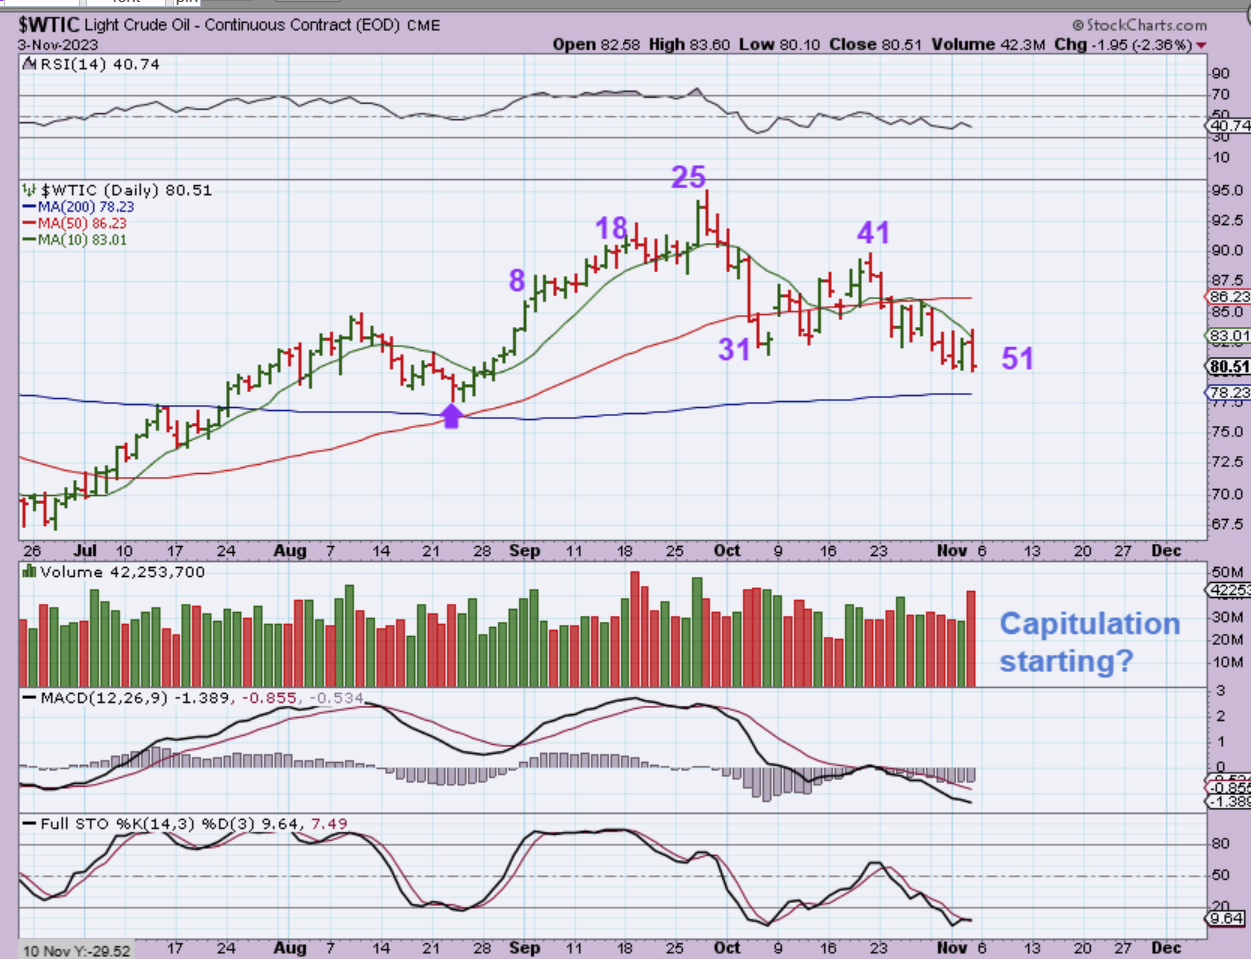
WTIC – Oil is acting as expected too. I have been calling for price to return to that 200sma for weeks and we are almost there. We are on day 51, so it is possible that we get a reversal, and it bottoms above the 200sma too. At day 52 on Monday, I would just look for a reversal anywhere in this area as a dcl (if you want to trade this with UCO or UCO, etc).
,
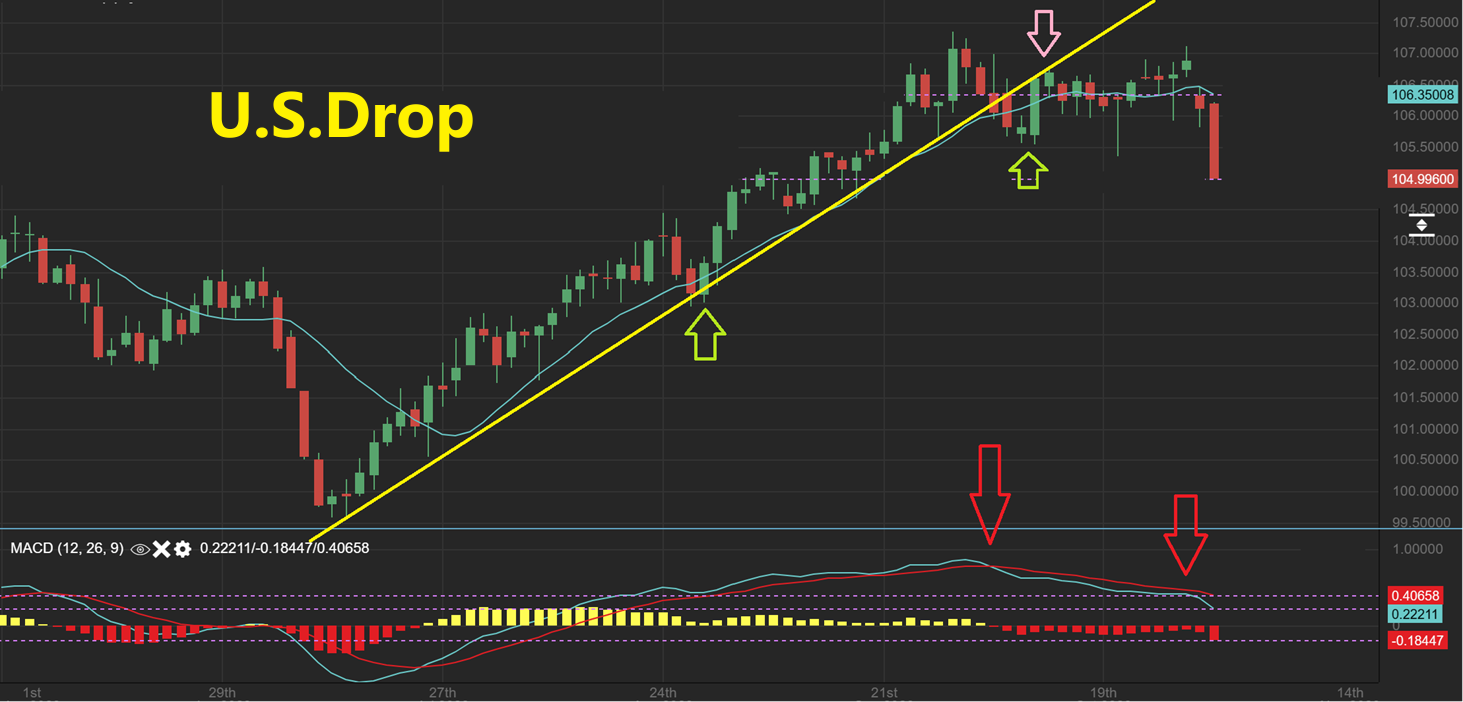
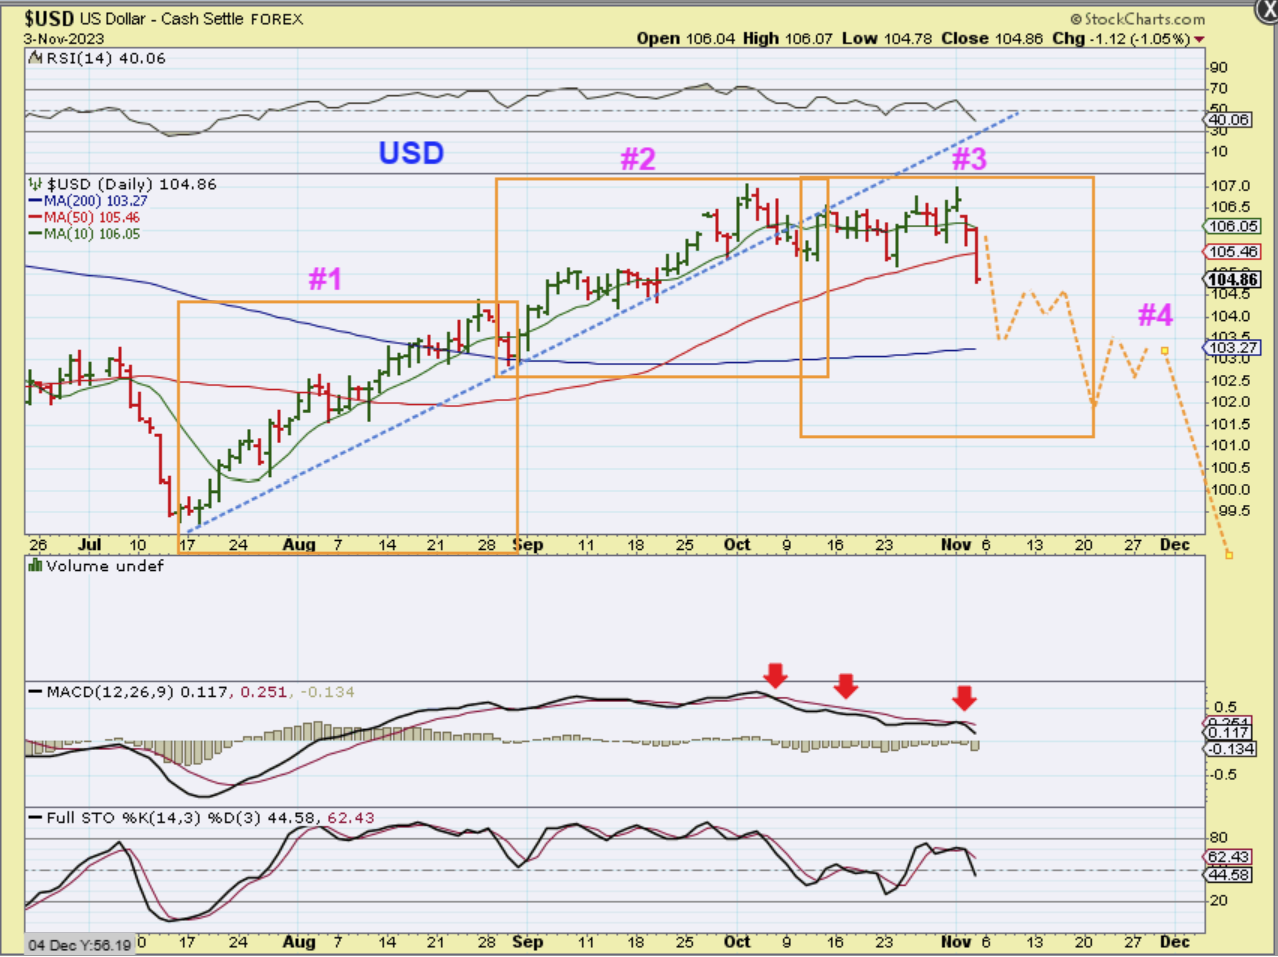
This is what we have been waiting for – The USD finally rolled over. YAY! This is a Left Translated 3rd daily cycle, and that means that the USD should chop lower for weeks (also good for Gold). So…
,
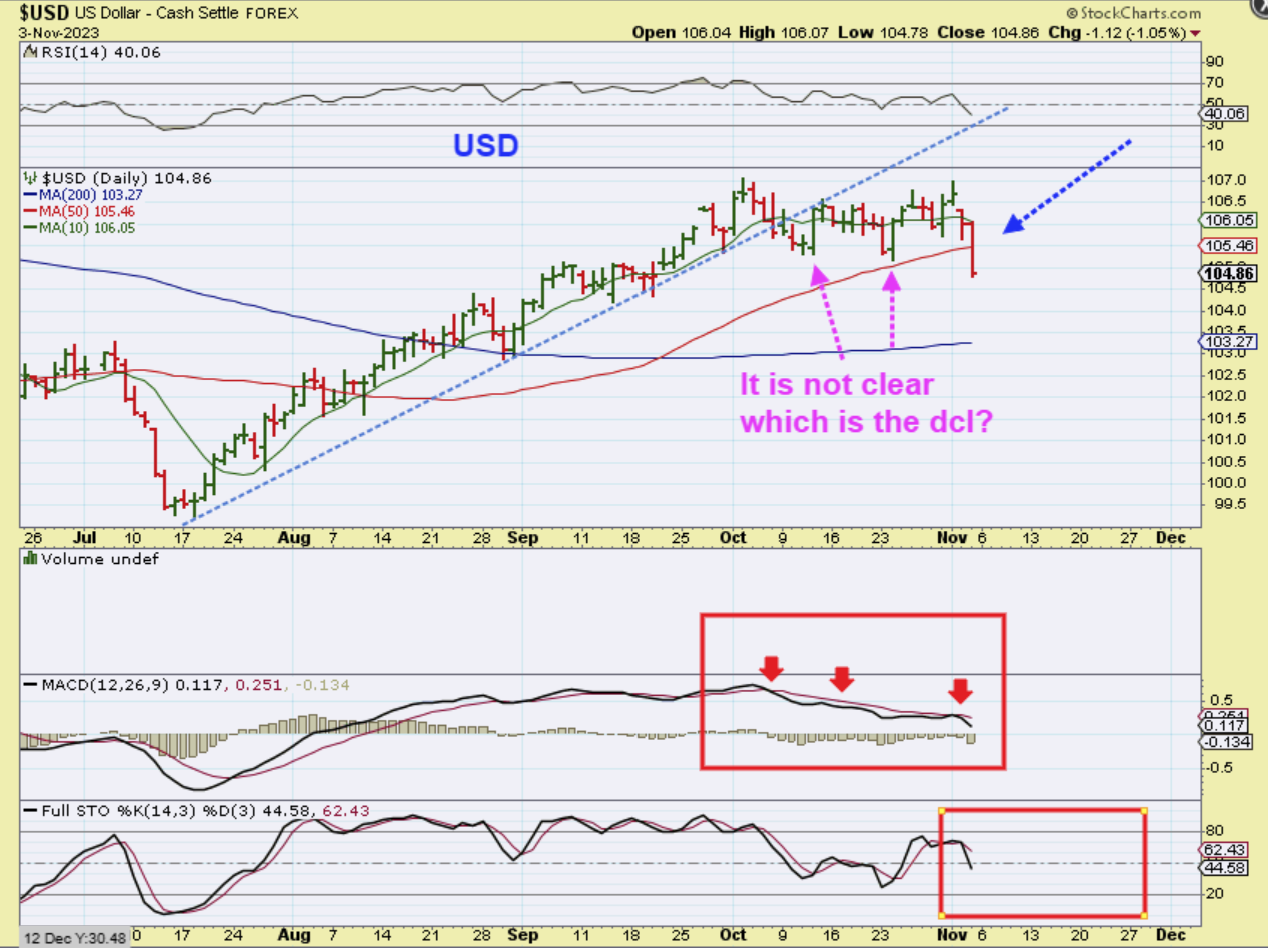
When we look at The USD, I had called the first Pop with the magenta arrow the dcl, but it may actually be the 2nd Pop at the 50sma. Either way, this is now a failed 3rd daily cycle and it also closed below the 50sma too. The MACD has been weakening with the sideways churn. So let me show you our expectations for the USD…
,
1. I see 2 strong daily cycles out of the ICL for The USD.
2. Now we broke that uptrend and started the 3rd weaker daily cycle, and that is breaking down early as a failed daily cycle.
3. We can have 4 or 5 daily cycles lower from there, so this can push The Precious Metals Sector higher for months.
,
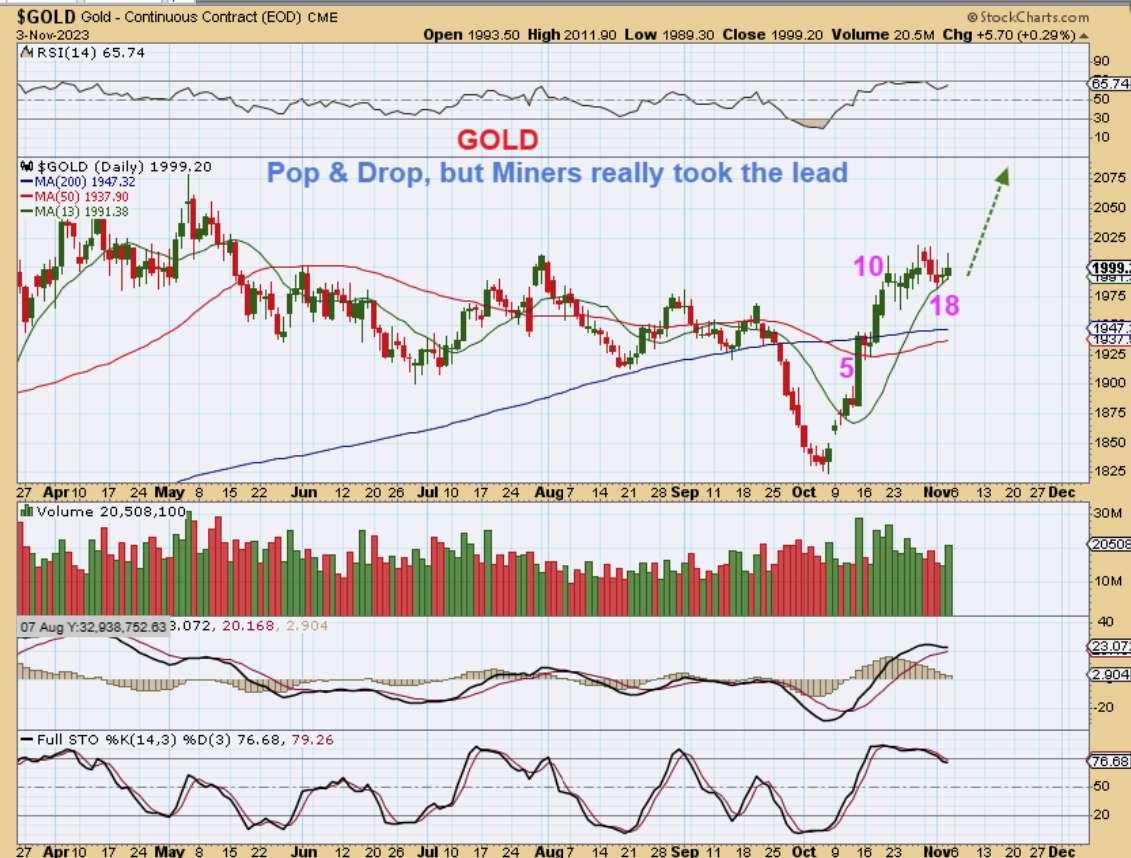
GOLD actually popped and dropped on Friday, but the good news is that Miners Popped and ran. Gold is on day 20 and can run higher from here. This is why I wanted to show you that the TLT Bottomed. People may worry that Gold popped and dropped on Friday, but Gold has been very strong and is just in a supply zone or an area of resistance on the left. It can & should run higher.
.,
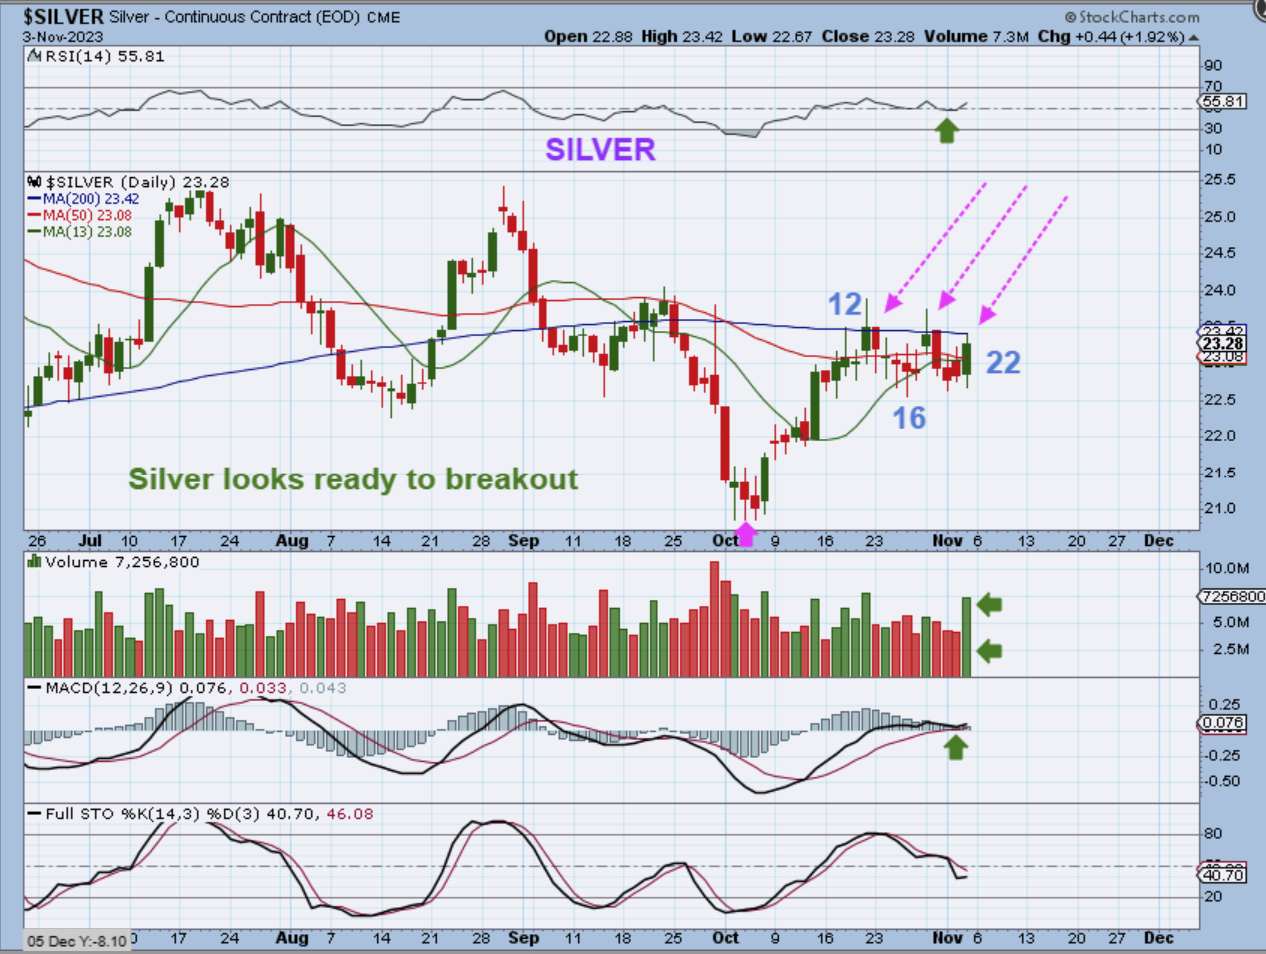
SILVER has been struggling under the 200sma, but really it is crawling along under the 200sma building energy to break out and run. That could happen this week.
,
You just saw that Gold and Silver moved a little higher on Friday, but notice that the Miners burst higher by 4.67%! This is a great sign that Miners are going to start leading the way.
,
I want to point something out to you here, but I also would like you to notice it on some of our individual miners: There has been a lot of complaining about this recent sell off, but notice that 1 strong day can do away with the down days in a bull market.
.
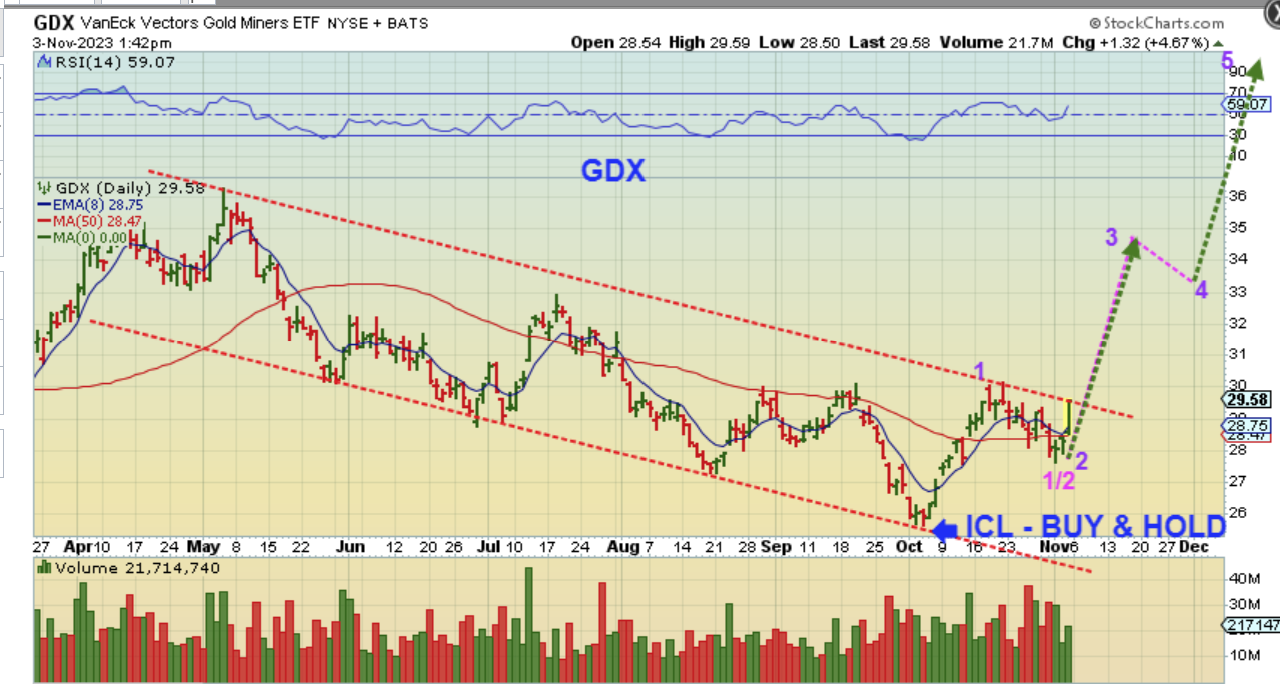
GDX sold off & chopped lower for 10 days, and suddenly it is back near the highs. This is what happens to Bull Markets corrections when we get those ‘surprises to the upside’. This is also why buying a basket of Miners ‘Buy & Hold’ style near the ICL often pays off more than jumping in and out. The bull surprises to the upside and it is hard to buy low on a pop like Friday. Look at the volume.
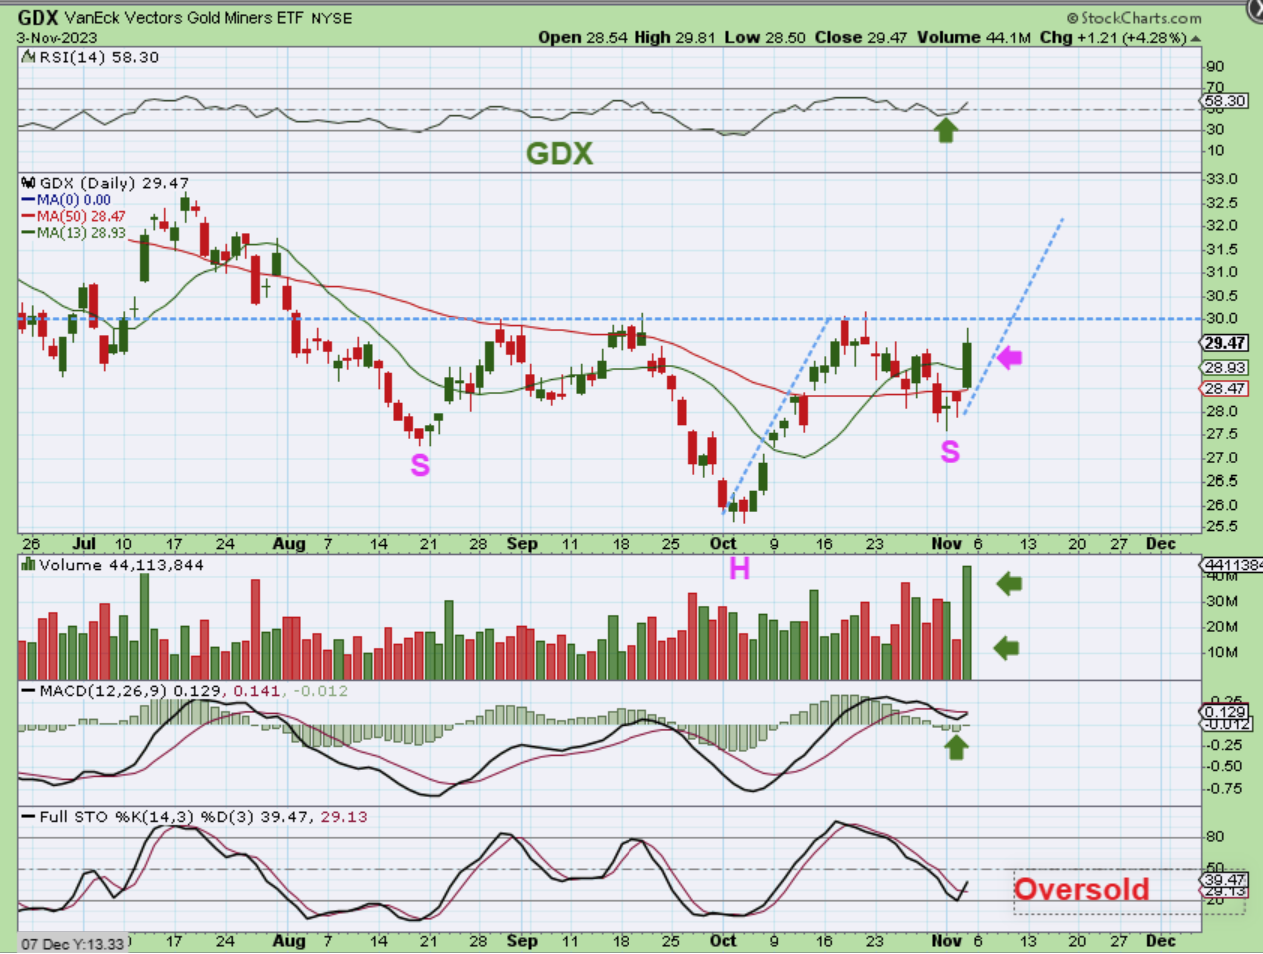
,
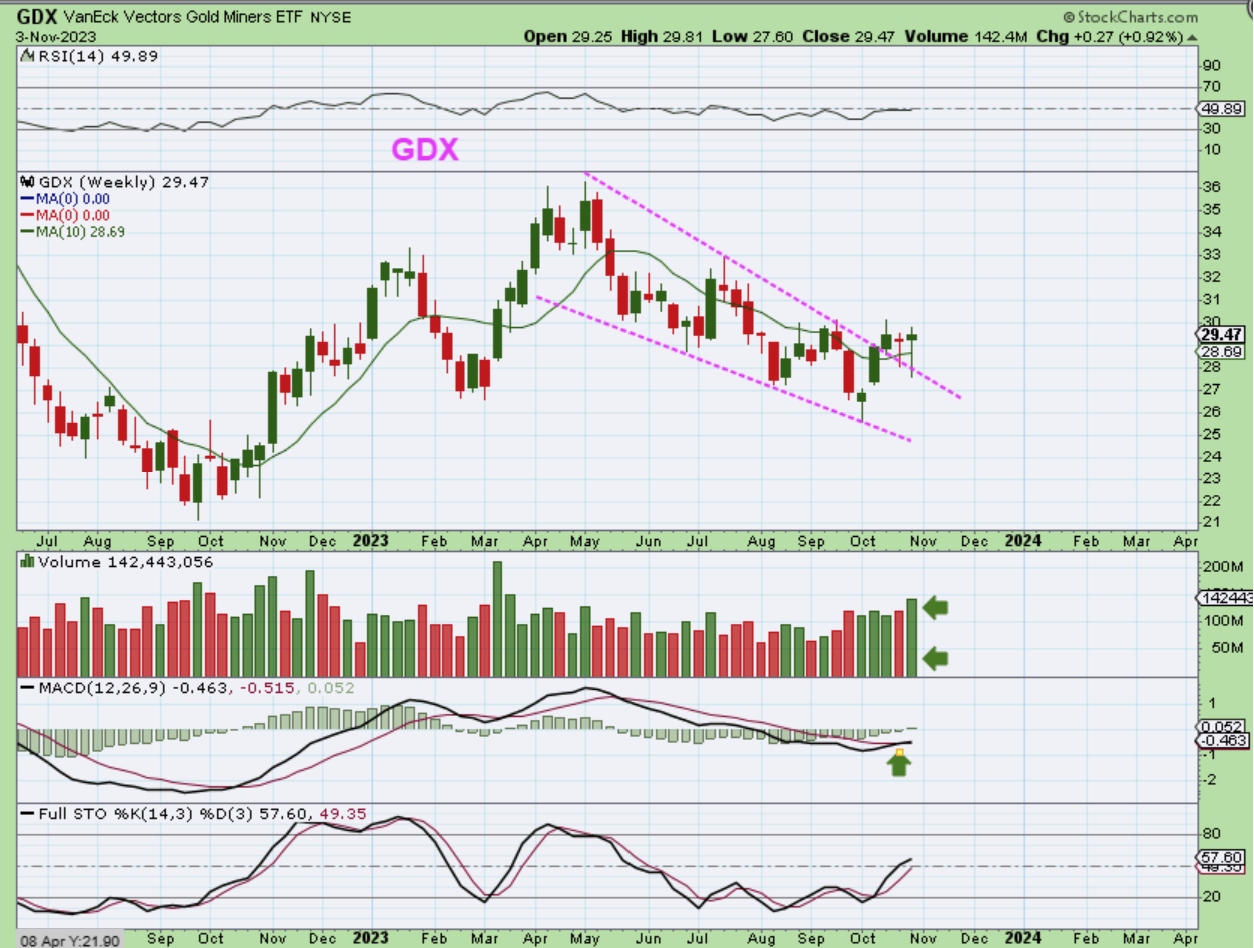
THE WEEKLY GDX can be viewed as a breakout of the wedge downtrend line and a back test with the recent correction. This is a bullish weekly set up. Take a look at the weekly MACD and volume. Got Miners? If we dip this week, it is a buy the dip market.
.
We have a Bullish set up in the General Markets, TLT, and The Precious Metals. Oil also looks ready to put in a dcl and join the upward push higher. With the bottom in TLT and GOLD, and a top forming in the USD, we could see a multi week and multi month rally out of these lows in Gold. Trading should be good in the coming weeks & months!
.
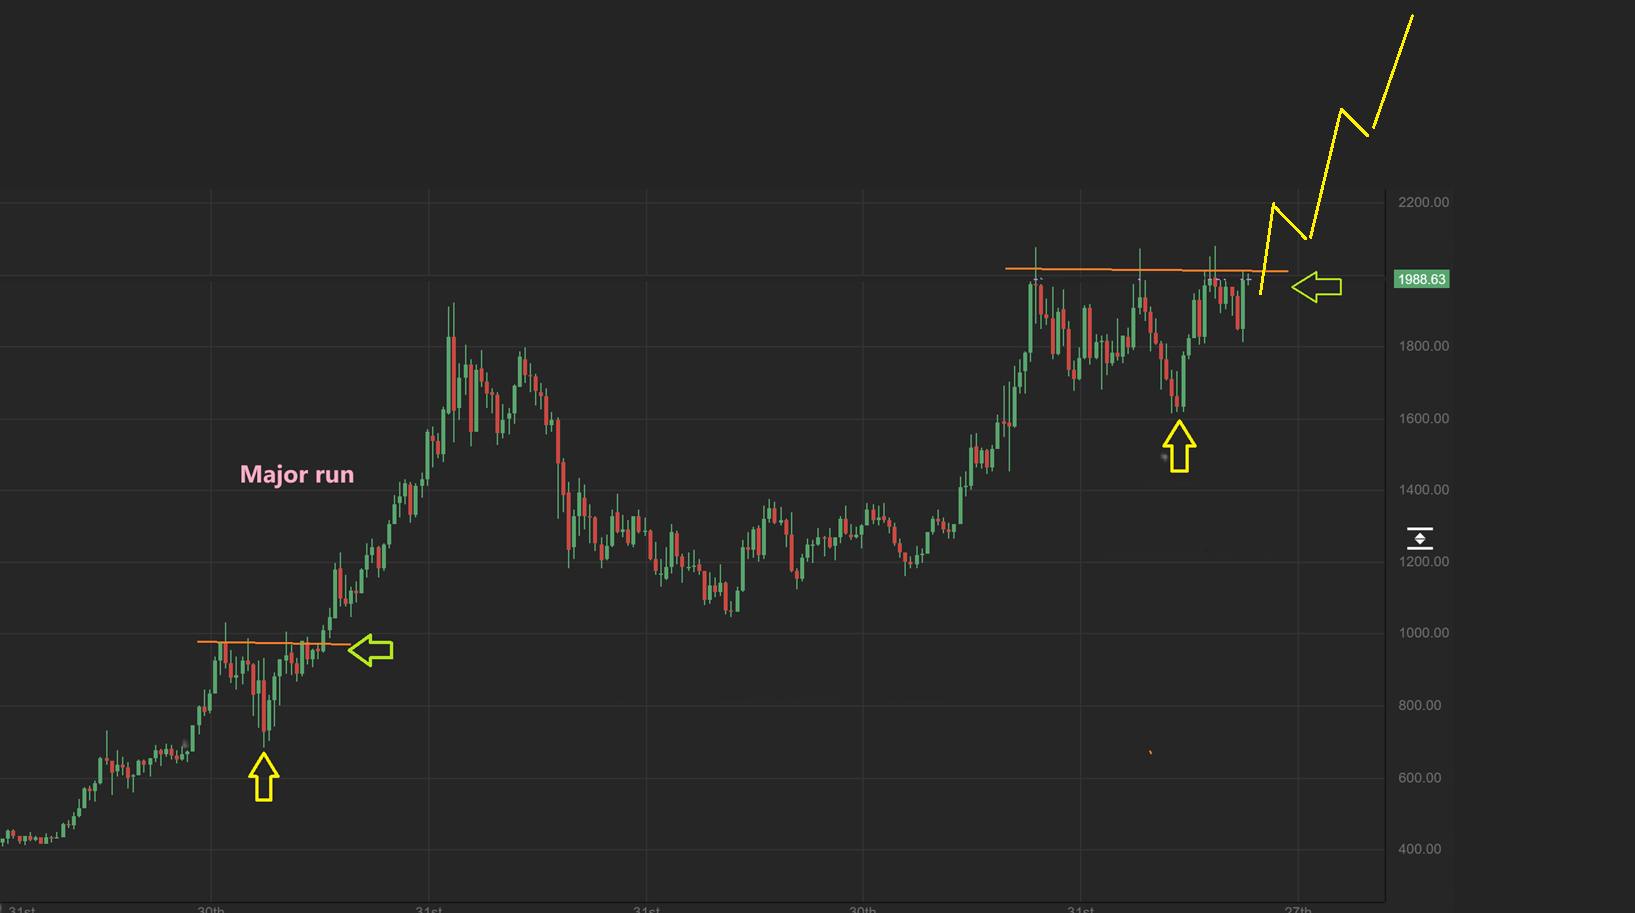
That would mean that Gold breaks out to new All-Time Highs and puts in a major run, even similar to what we saw when it broke from the 2008 V-Bottom correction. Instead of a choppy price action, we could begin to trend higher the way Gold did in 2008-2011. This is the Gold Monthly Chart and we see that Gold has a multiyear consolidation that is ready to break out to new all-time highs. Got Miners? 🙂
.
I had relatives fly in from Arizona and we have been out and about this weekend, so I am putting this report together on Sunday afternoon. I hope you all enjoyed your weekend, and thanks for your patience in waiting for this report. Yes, there will still be pull backs and choppiness along the way, but you can see how powerful just a 1 day surge can be, so dips should be considered ‘Buying opportunities’. Things look very bullish going forward. Below I want to show you a couple more ‘things’. Enjoy your Sunday evening!
.
~ALEX
,
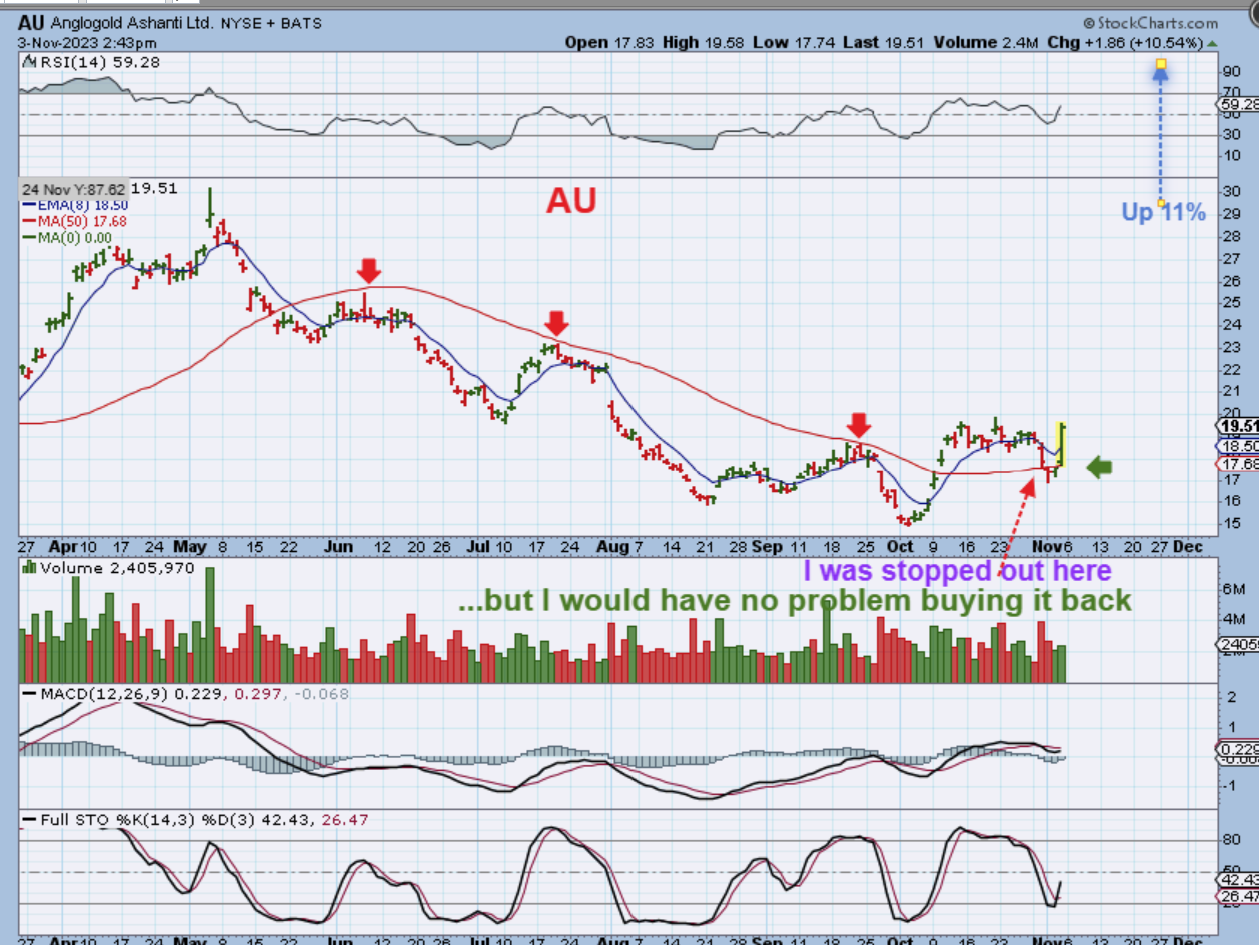
AU – Just take a look at this 1 day surge of 11%. Yes, the selling and sideways chop was boring and frustrating, and I even got stopped out at break of the 50sma! But in a bull market, 1 day can erase 10 days of frustration. I have no problem re-buying this, because it can easily double over time.
,
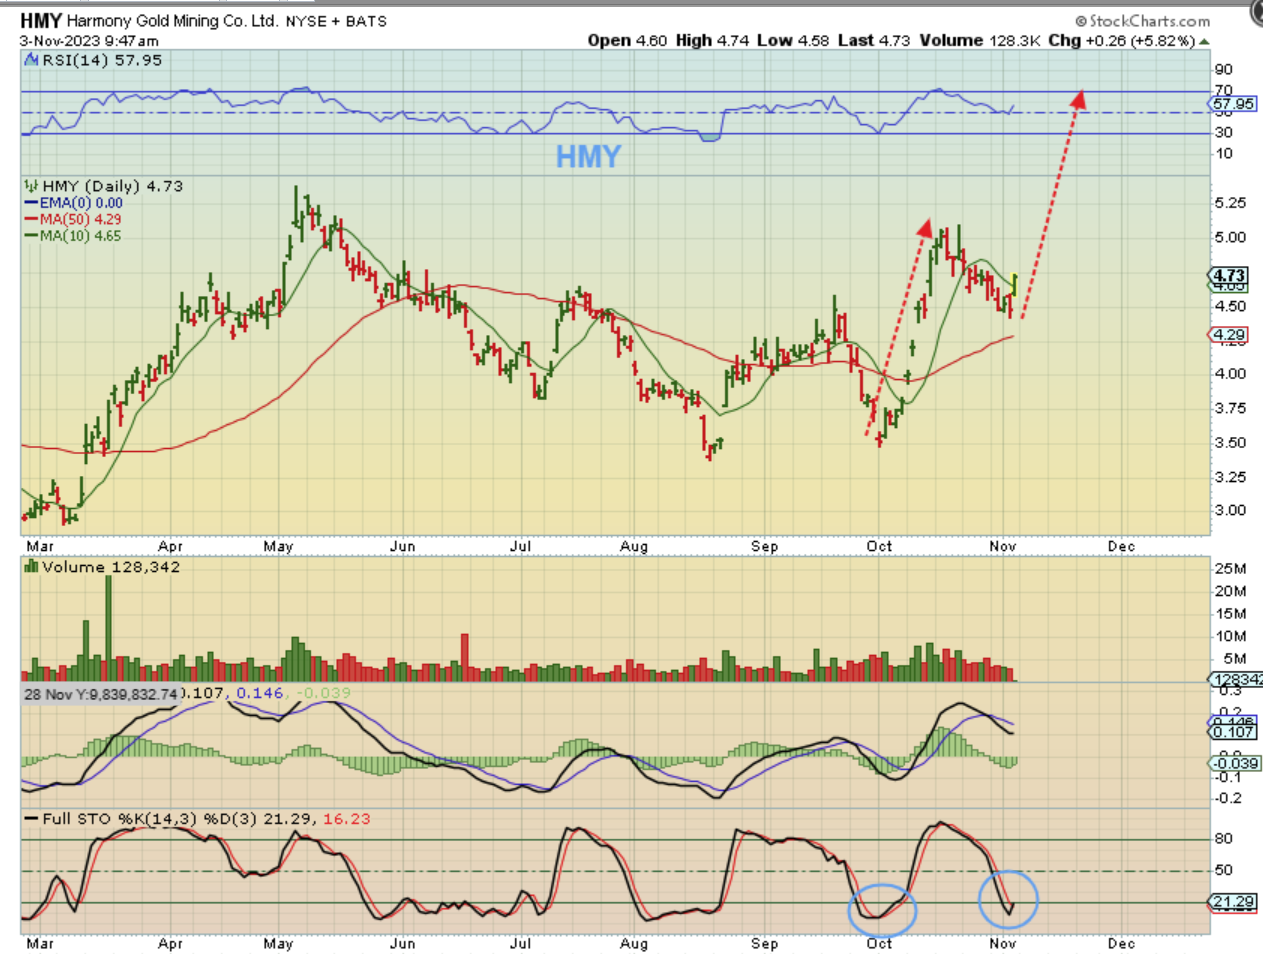
HMY started to run up 5% on Friday , so I captured this as a 1/2 cycle low / bull flag. It went on to close up 10% for the day and broke out of this bull flag.
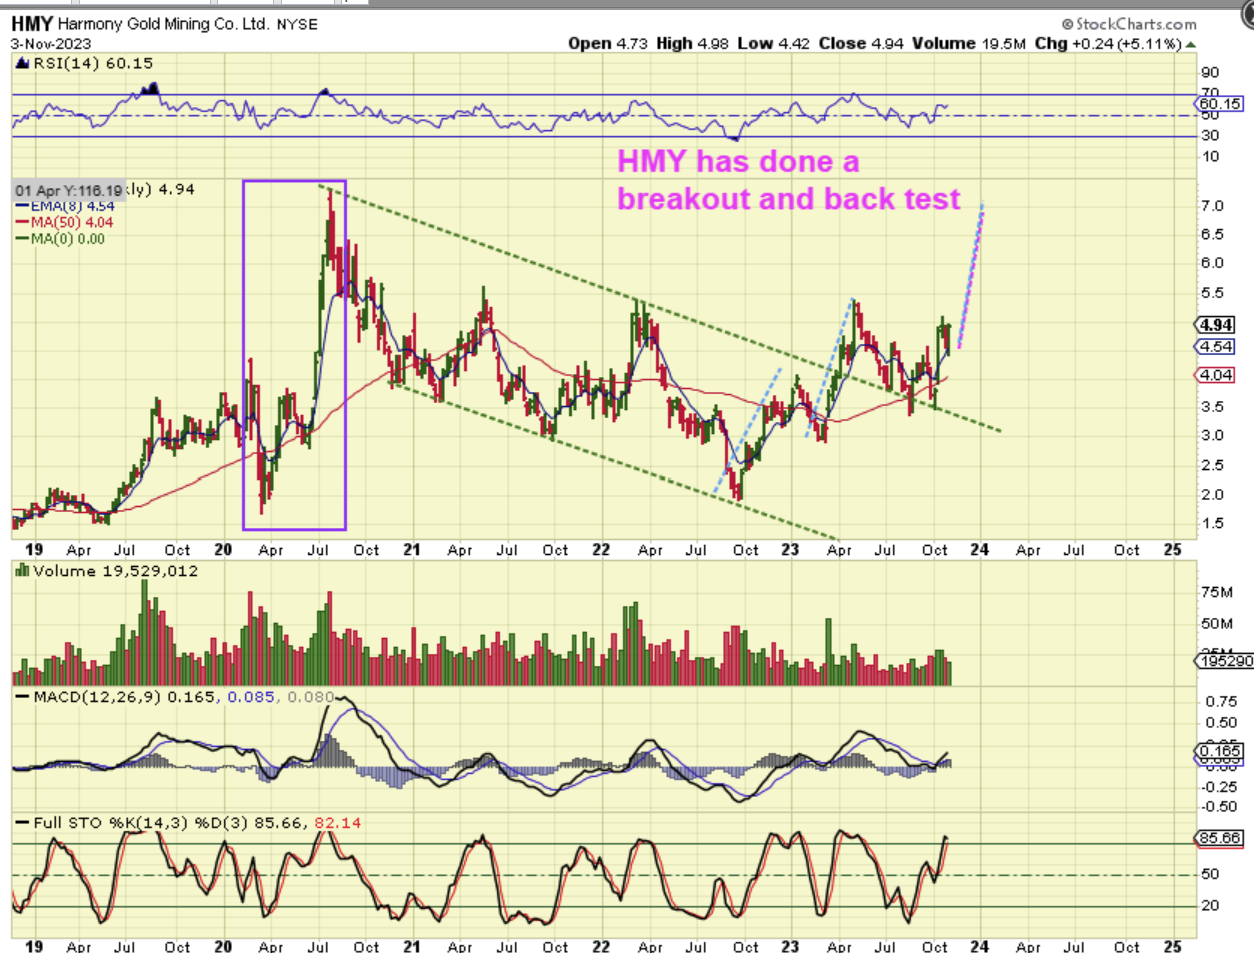
I just captured this weekly chart to show how quickly price can race higher when you are in it…or not in it! 🙂 HMY in the bigger picture has broken out and back tested the downtrend line and is now resuming the rally.
,,
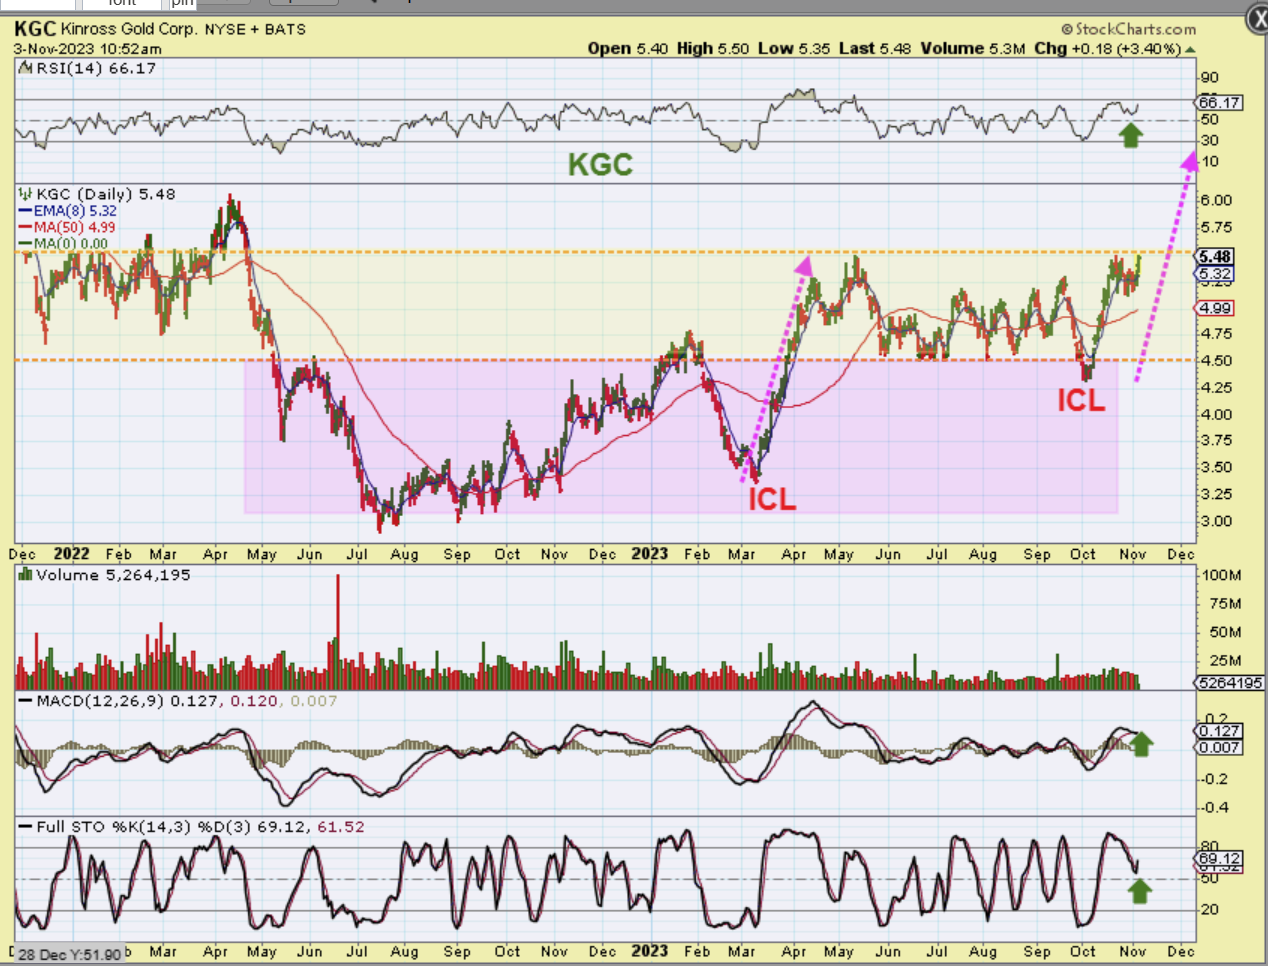
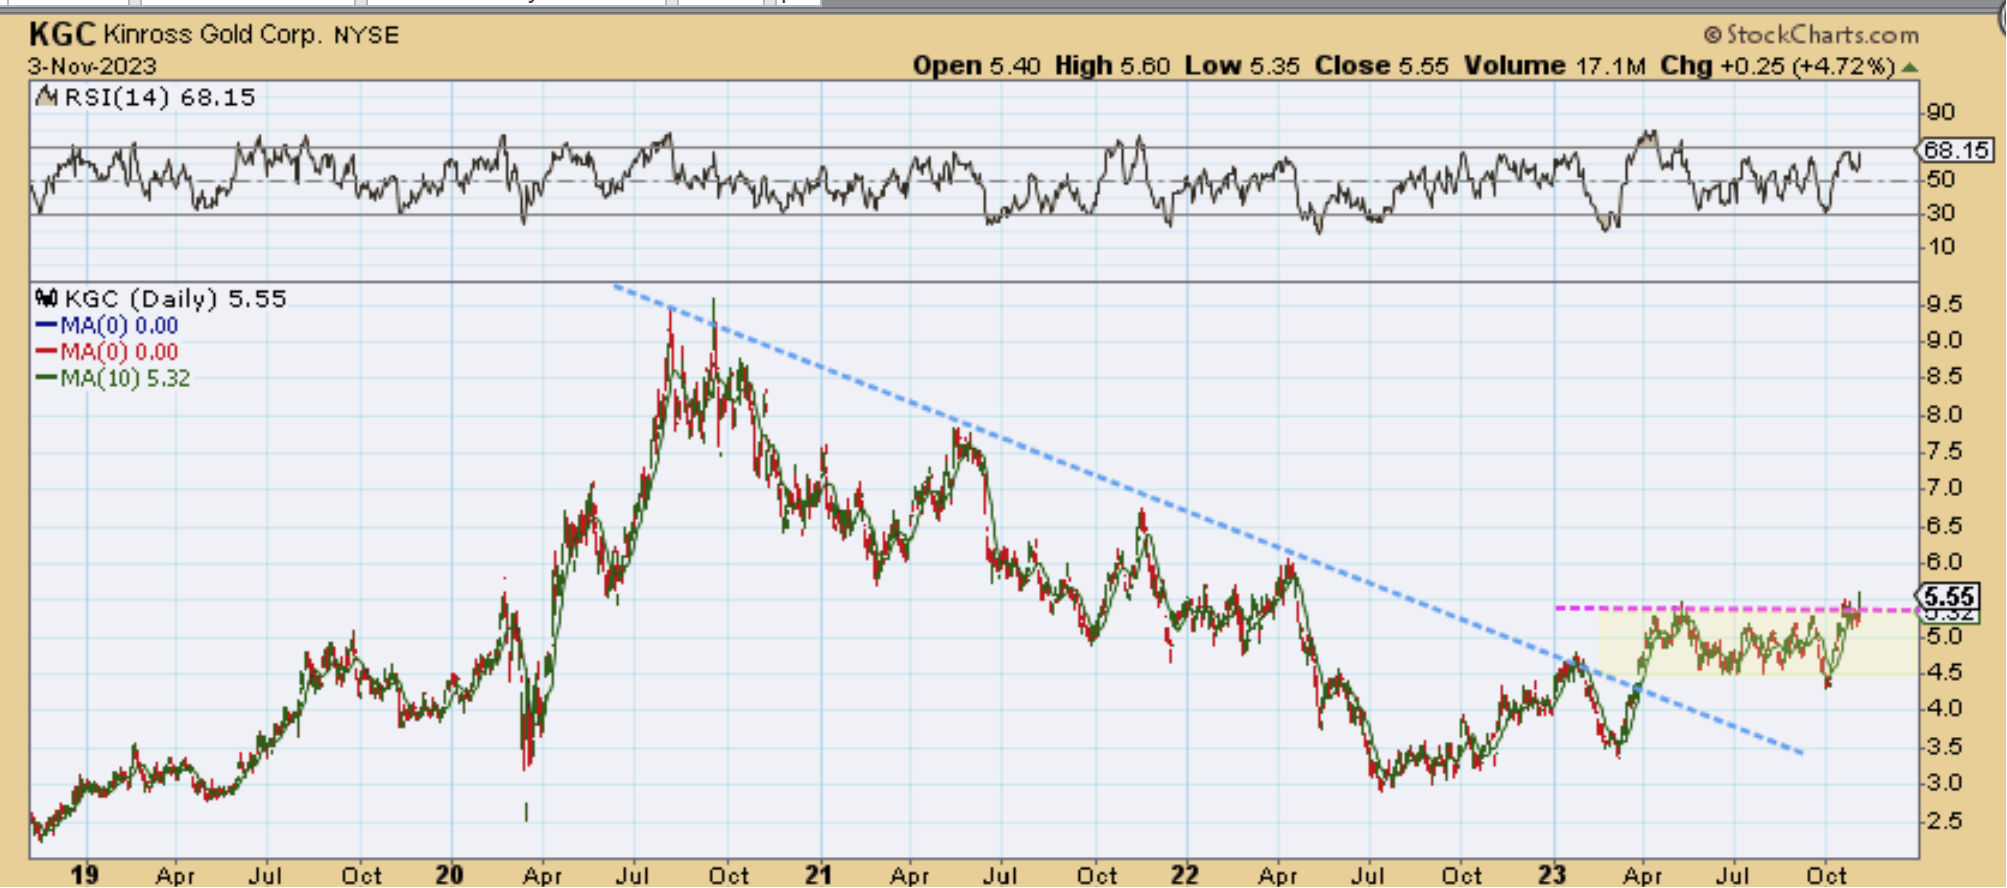
KGC is about to make a major long-term breakout, and…
,
KGC has plenty of upside too.
.
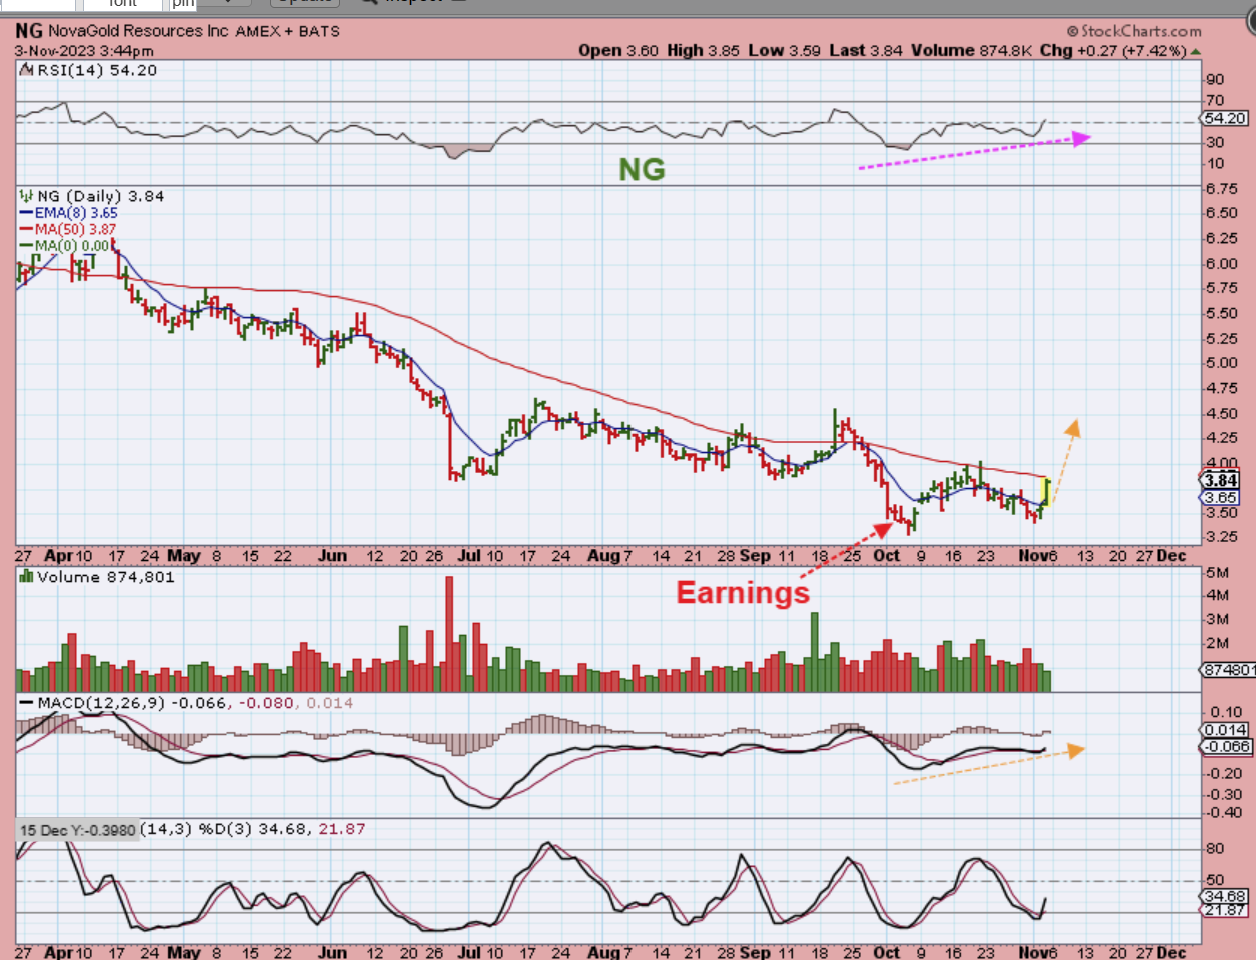
NG is a lagger. It has not been running with the Miners, but it did Pop on Friday and it may be ready to join the party. A breakout over the 50sma would be considered bullish. The good news is that NG has already released their earnings in early October too.
.

