Weekend Report October 21, 2023
.
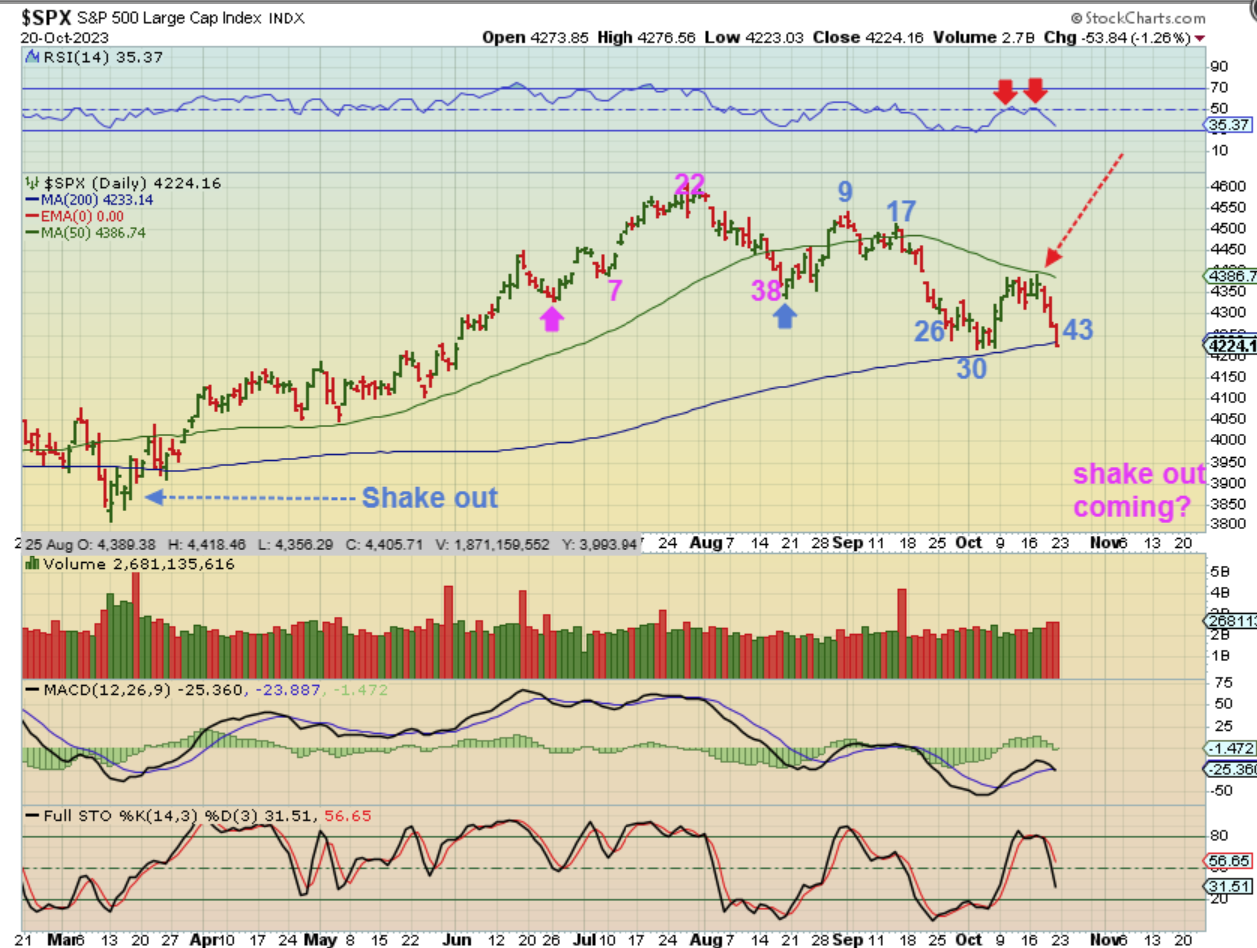
The selling in the General Markets continued from Wednesday through Friday. The SPX is breaking the 200sma and is very close to breaking the day 30 lows. I have been mentioning that day 30 was a bit earlier than the recent daily cycles that ran 40-50 days long, so this sell off is not a complete surprise. Price was clearly rejected at the 50sma.
.
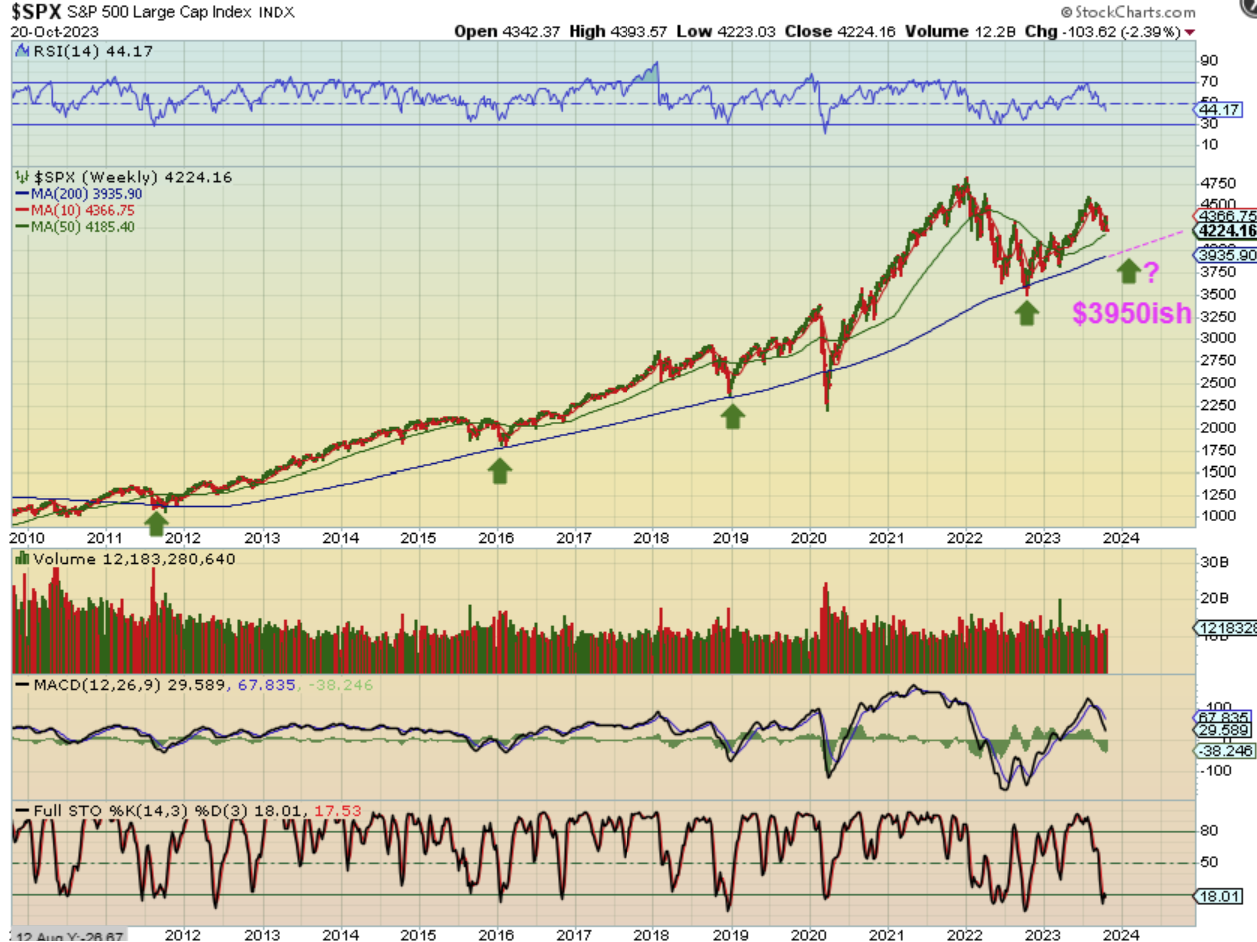
Trying to gauge where this may fall to is tricky, but The SPX used to bounce at or near the 50 or the 200 week ma, and that 200 week ma is down at $3950.
1. Price is 49 points away from the green 50 week ma,
2. Price is 270 points lower to the blue 200 week ma.
3. Since the SPX lost 103 points on Friday, the reversal at the lows might only be within 1- 3 days away if that selling continues.
.
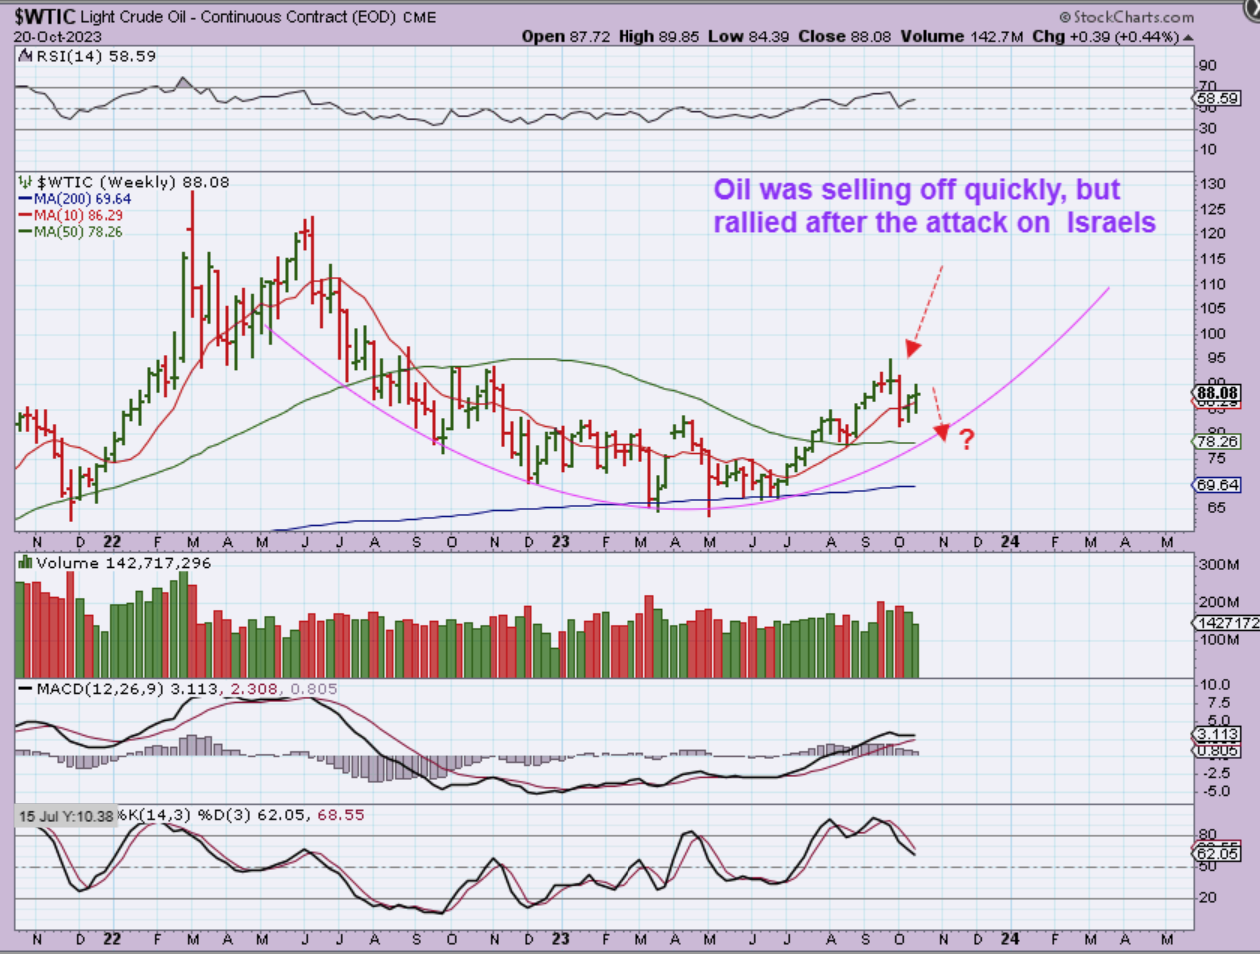
WTIC – Oil slammed down3 weeks ago, then it bounced when Israel was attacked, and may slam down again as an a-b-c style drop into an ICL. We do see support below price roughly near $78, but if the move higher continues, we have to basically see that the lows formed with the start of that war.
.
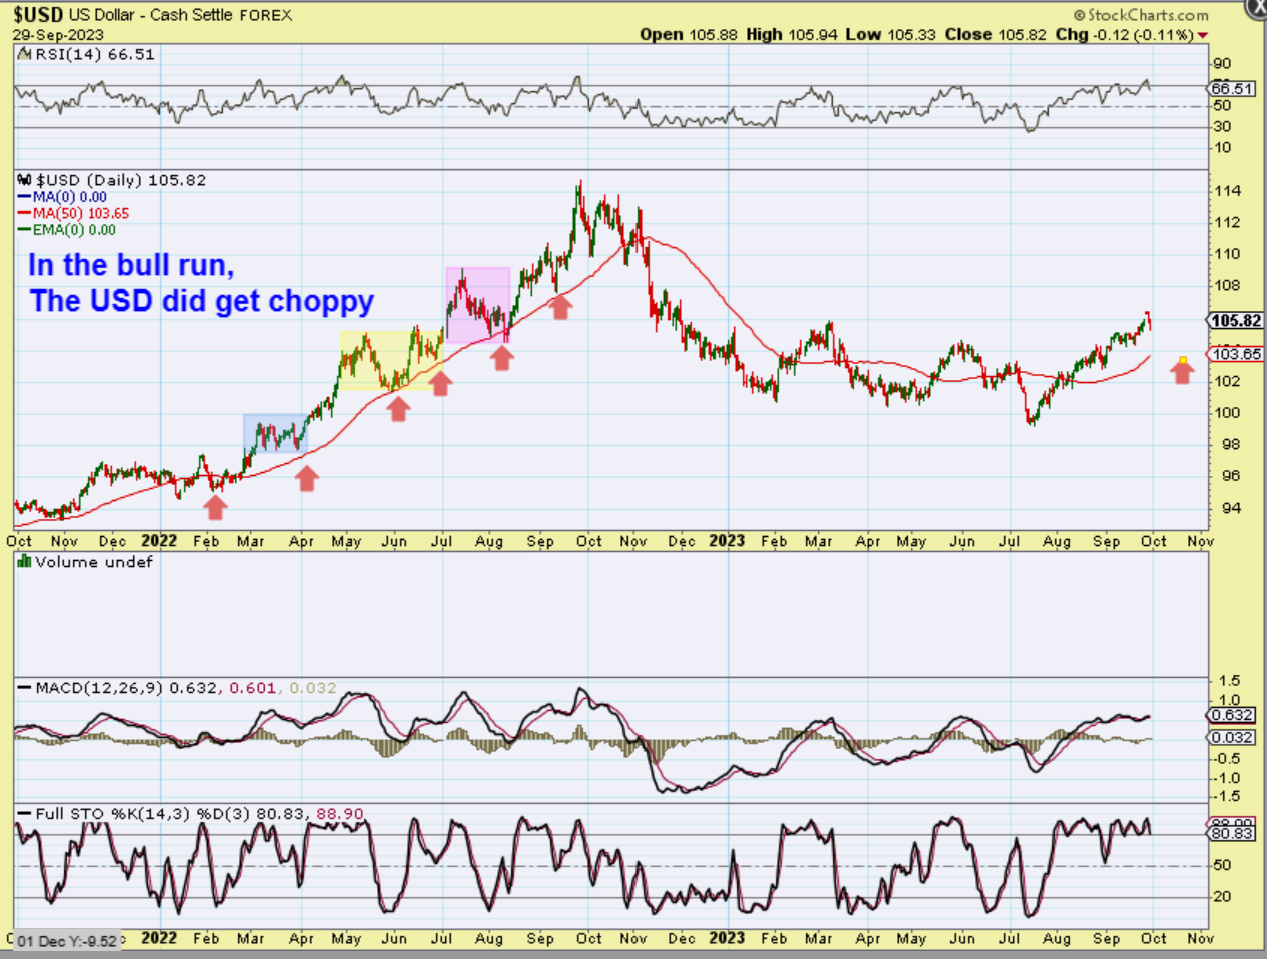
Back in September I mentioned the sideways churn that the USD when it was due for a dip into a dcl and ICL. I said:
.
THE USD has churned sideways in the past bull runs, and I pointed that out using this chart from September 29 chart. I said that we may see that next with the USD, and…
.
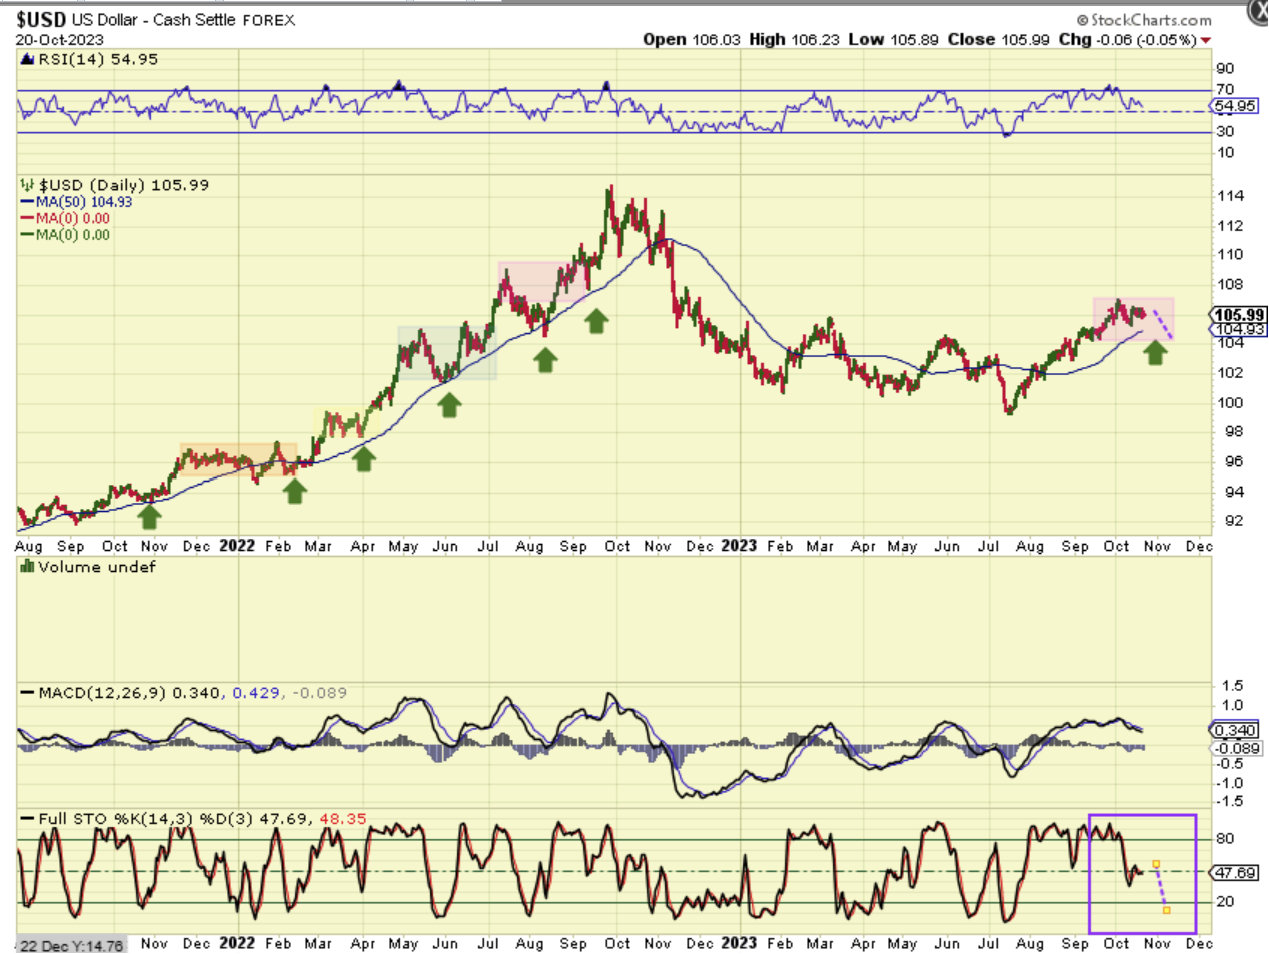
USD – So here we are over a month later and the 50sma has also moved higher. There is still room for downside after the USD bounce out of a dcl, and this can move lower after next week.
.
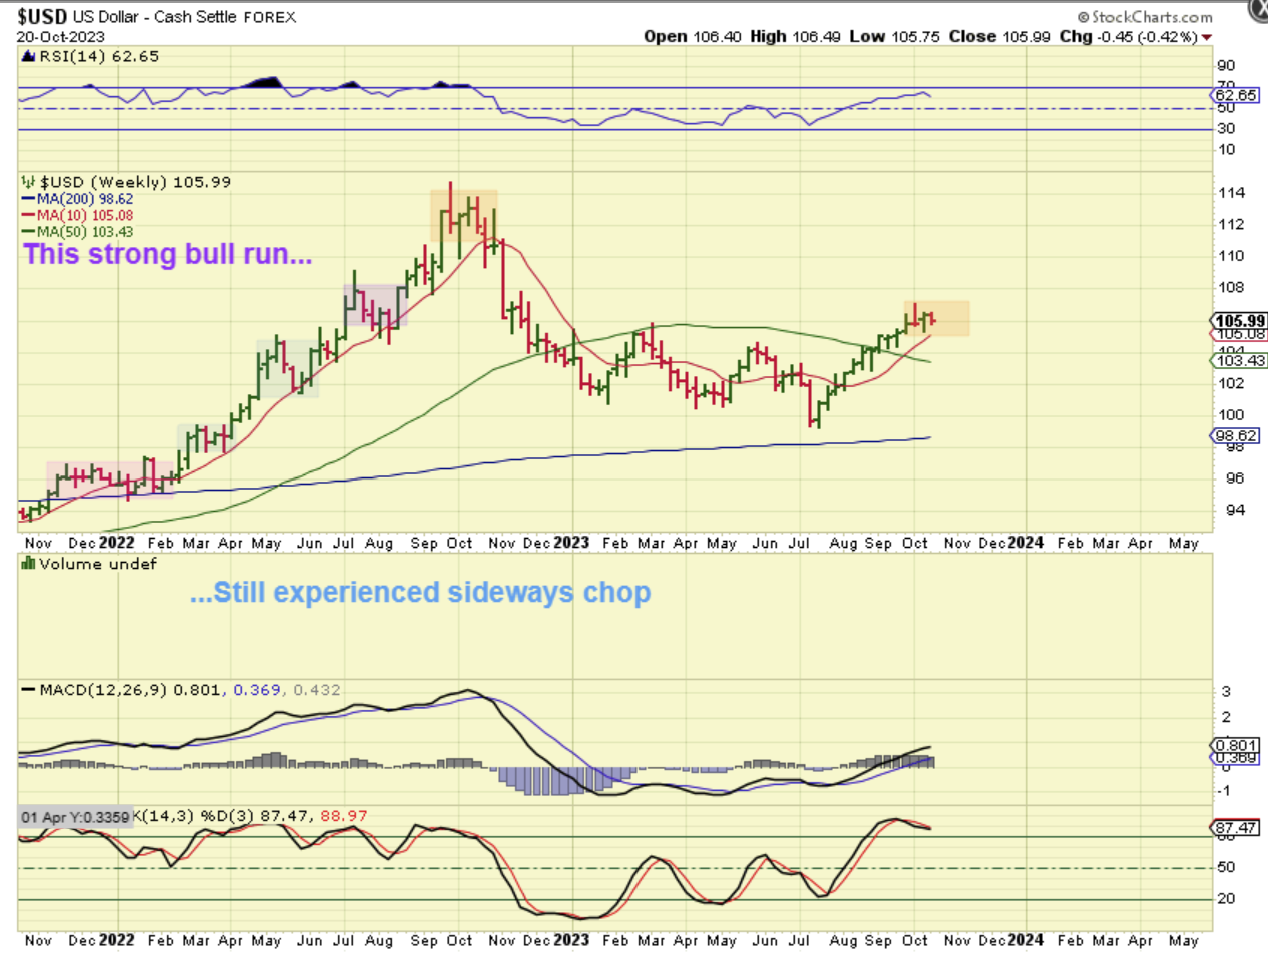
On the Weekly USD Chart we see a little sideways chop at the highs. The USD is coming due for a dip into an ICL, so this choppiness could eventually give way to a little heavier selling. This weekly is overbought.
.
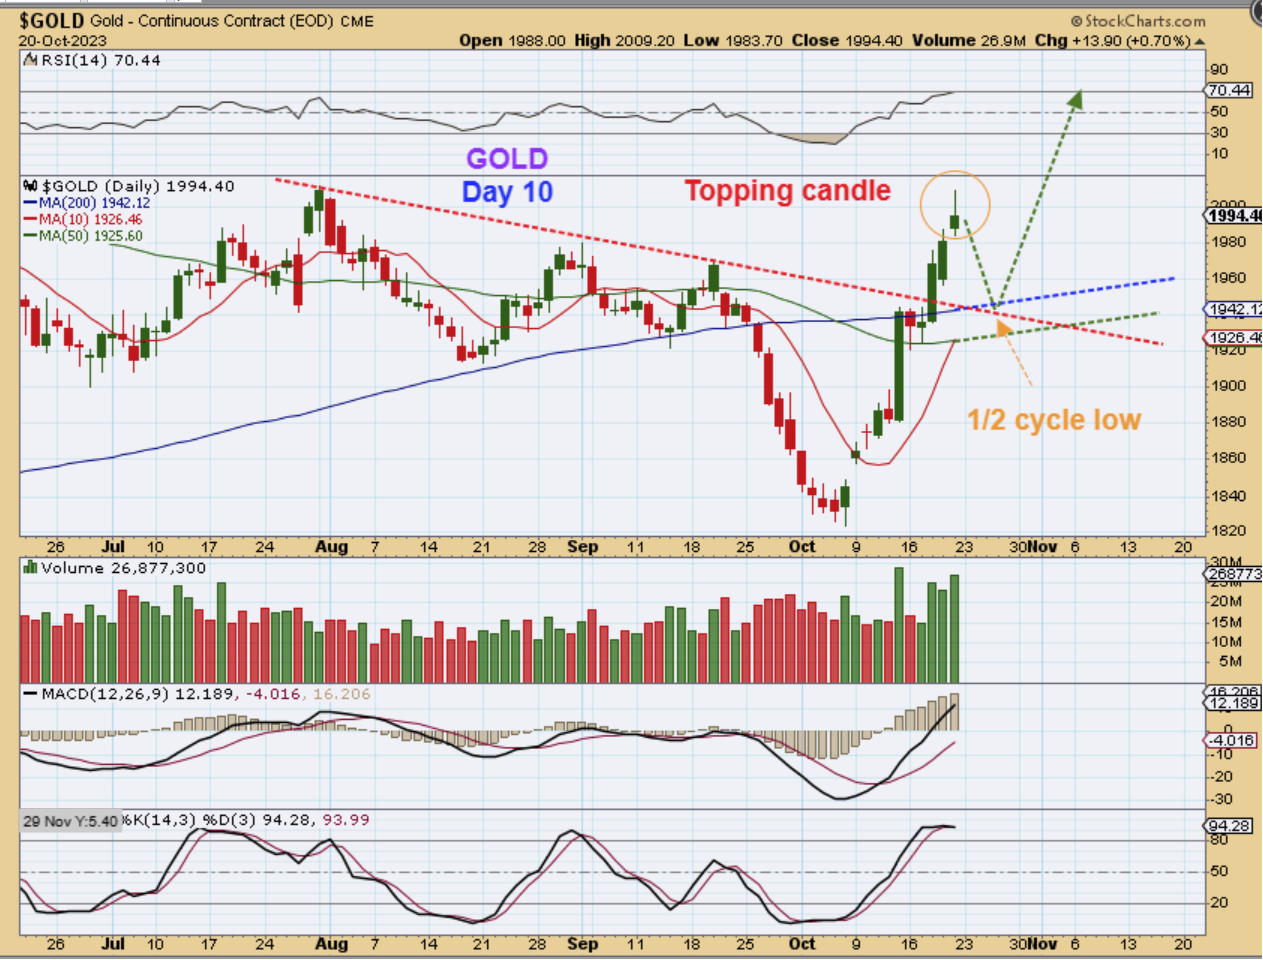
GOLD popped and dropped Friday, which gives us a ‘topping candle’. After a 10 day rally like we have seen here, it is reasonable to expect dip into a 1/2 cycle low. This should provide a nice buying opportunity and it may dip down for a few days to the $1950 area, as drawn.
.
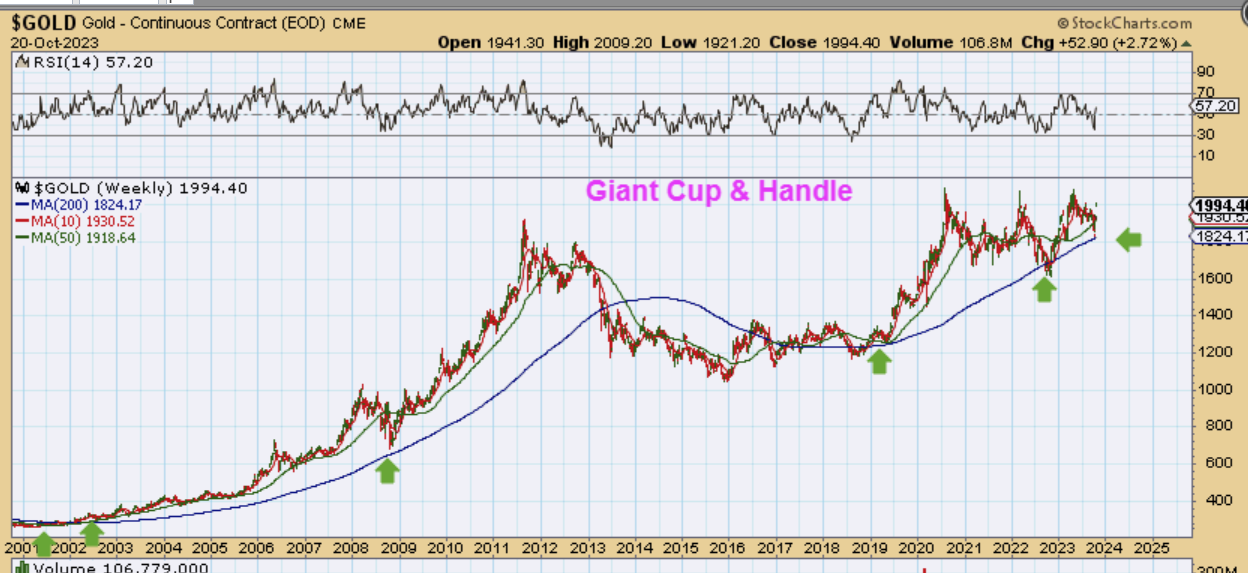
I wanted to show this big picture view to show us that massive Cup and Handle and I wanted to show how price often reversed above the 200sma, or bounced off of the 200 week ma here too. Watch what happens when I zoom in…
.
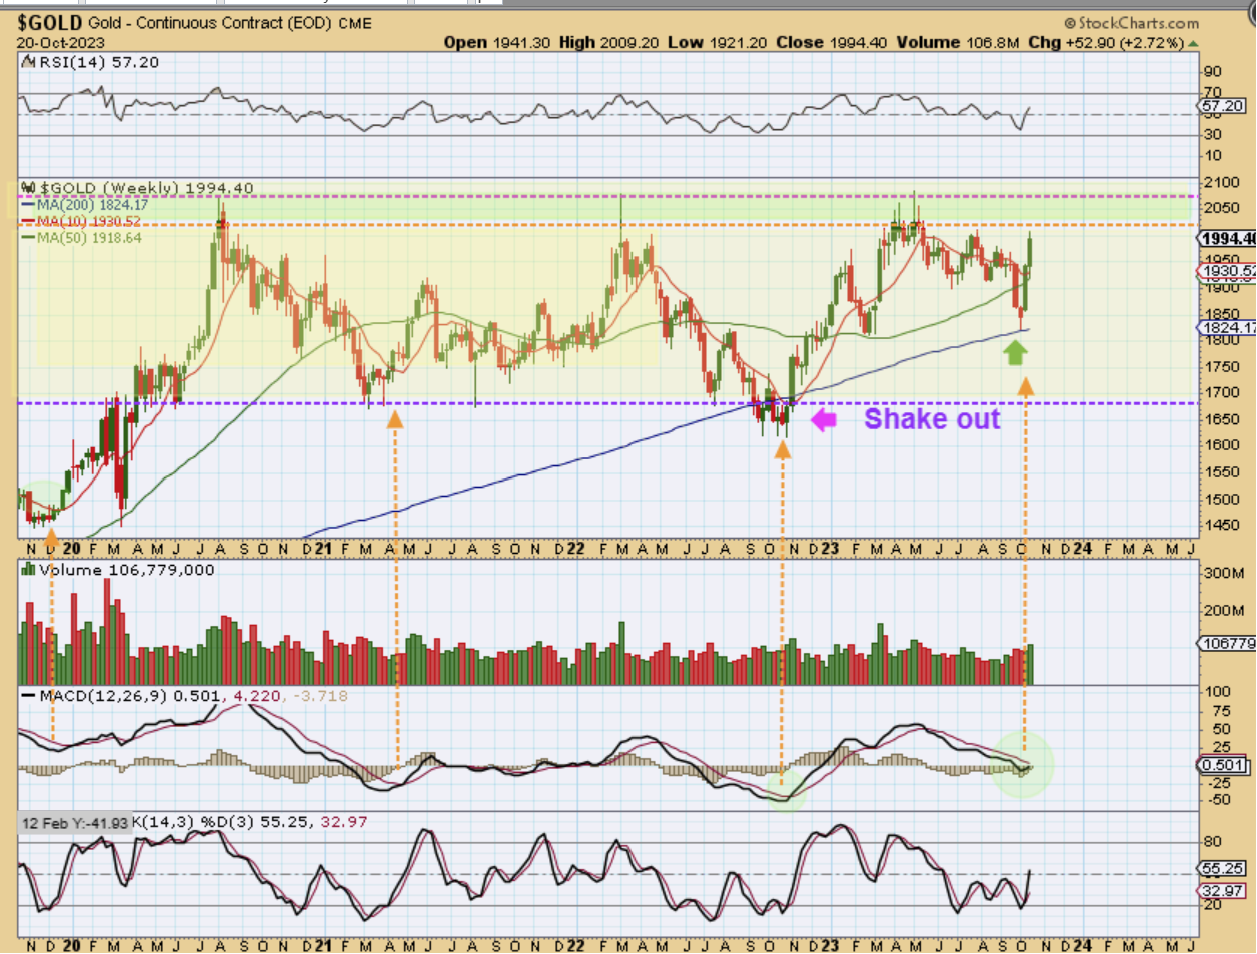
GOLDs Price really did bounce right off of that 200sma. We had that strong reversal at the ICL and now we’ve seen 2 very strong weeks higher. A pause is not unreasonable, and as mentioned, it would be a buying opportunity. This looks to be very early in the rally too. The MACD is just starting to curl up and the stochastics is still quite oversold.
.
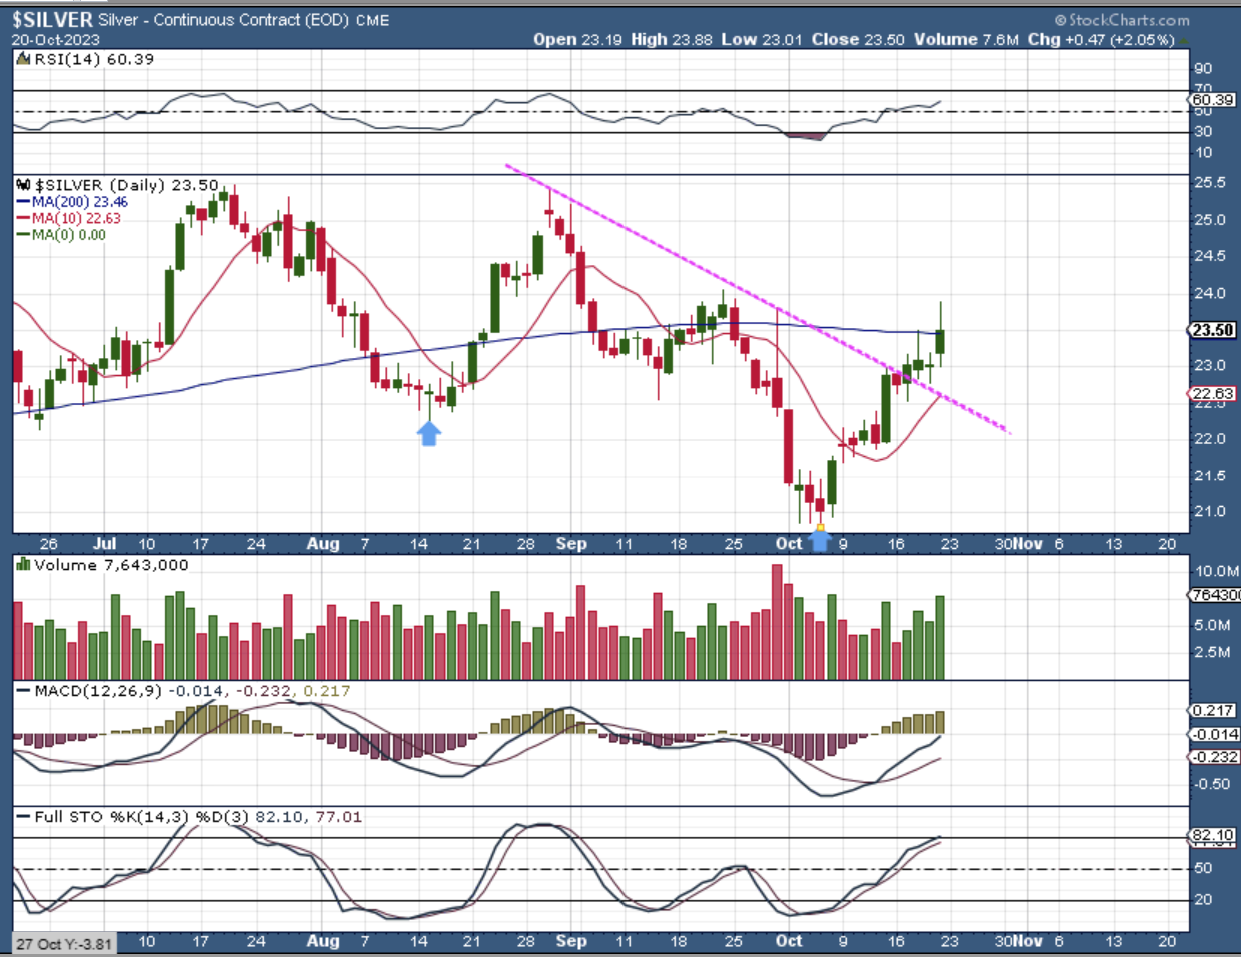
SILVER DAILY – Silver is fighting to get above the 200sma, and it actually popped above it and closed under it on Friday. Volume has been increasing and even if this pulls back to back-test the 10sma or trend line, it should remain bullish.
.
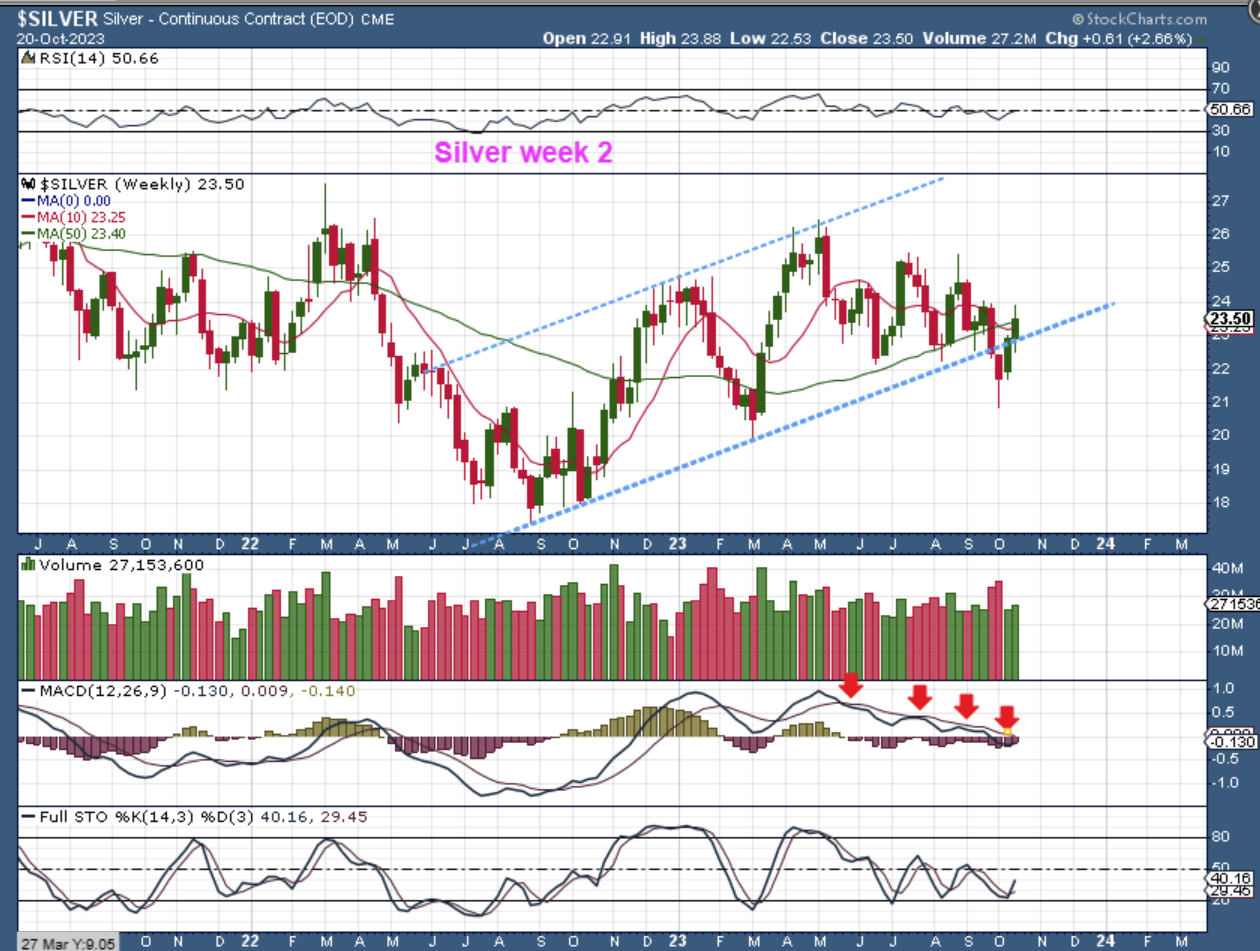
THE WEEKLY SILVER CHART shows Silver as a shake out of the uptrend channel and following that ICL reversal, price pushed higher for 2 weeks but may temporarily stall at the 50 week ma. This should be a temporary pause.
.
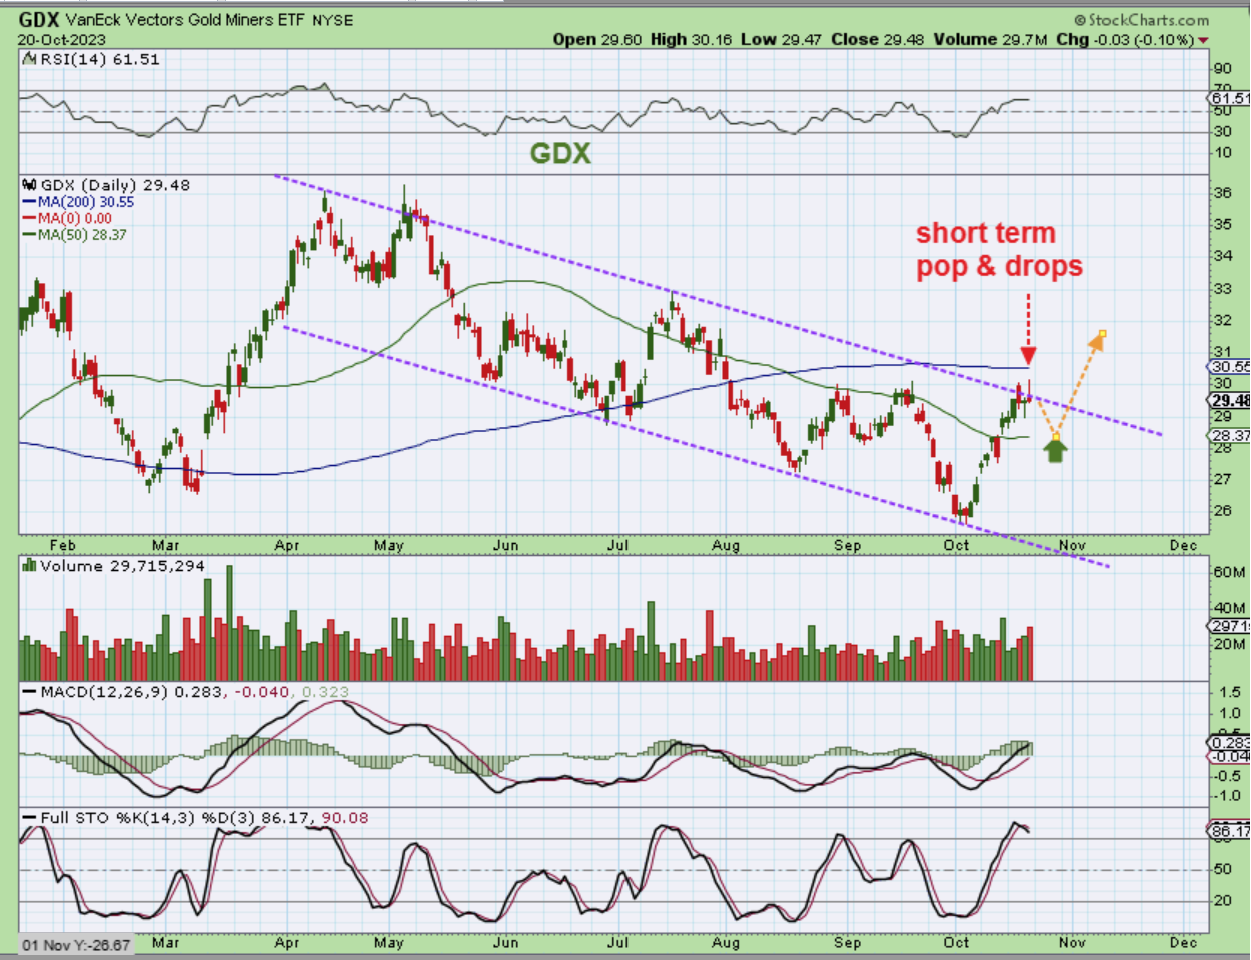
THE GDX ETF reversed at the bottom of the channel as an ICL and then broke through the 50sma. It was heading for the 200sma, but it has popped and dropped twice as it reached that channels’ upper trend line along the way this week. I have drawn a back test of the 50sma as a 1/2 cycle low possibility, and then I’d expect a breakout above the 200sma.
.
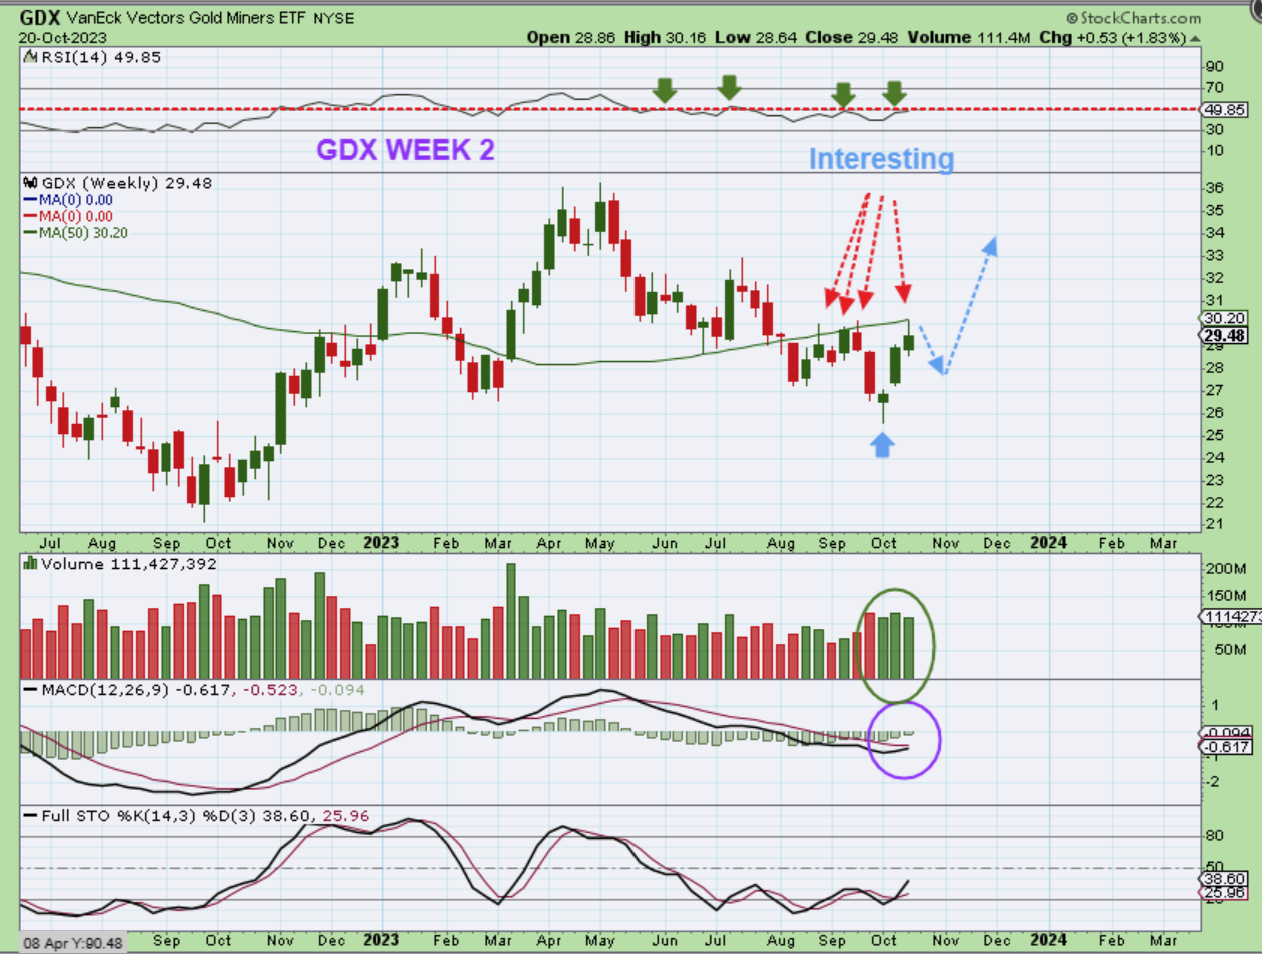
THE WEEKLY GDX CHART shows that price tagged the 50 week ma and that is what stalled it too. I still find it amazing to see all of these different points of interest on a daily and weekly chart that match up as resistance and support.
.
Again as a reminder, we do have a short-term topping candle in Gold and should expect a dip next week.
.
With the current set ups, it does look like next week could see the General Markets sell down into a dcl / ICL, and the Precious Metals may pull back to support in a 1/2 cycle low. That means that next week may be boring and we also could give back some gains if we didn’t or don’t lighten up. In theory, You can buy an ICL and ride it out for months, riding the dips, and the dips are undone over time. Some also would rather try to trade around it, but timing the dips can be very difficult at times, because in a bull run we see surprises to the upside. Either way, I leave that up to the individual trader and I view it as a buying opportunity if Gold, Silver, and the Miners reverse at a support area. So I’ll be watching for that next week and will have charts in the reports as Miners bounce at support (if we get the dip).
I also will discuss my thoughts on Bitcoin and Crypto Miners below, by request. Enjoy your weekend and thanks for being a Chartfreak with me! 🙂
.
~ALEX
.
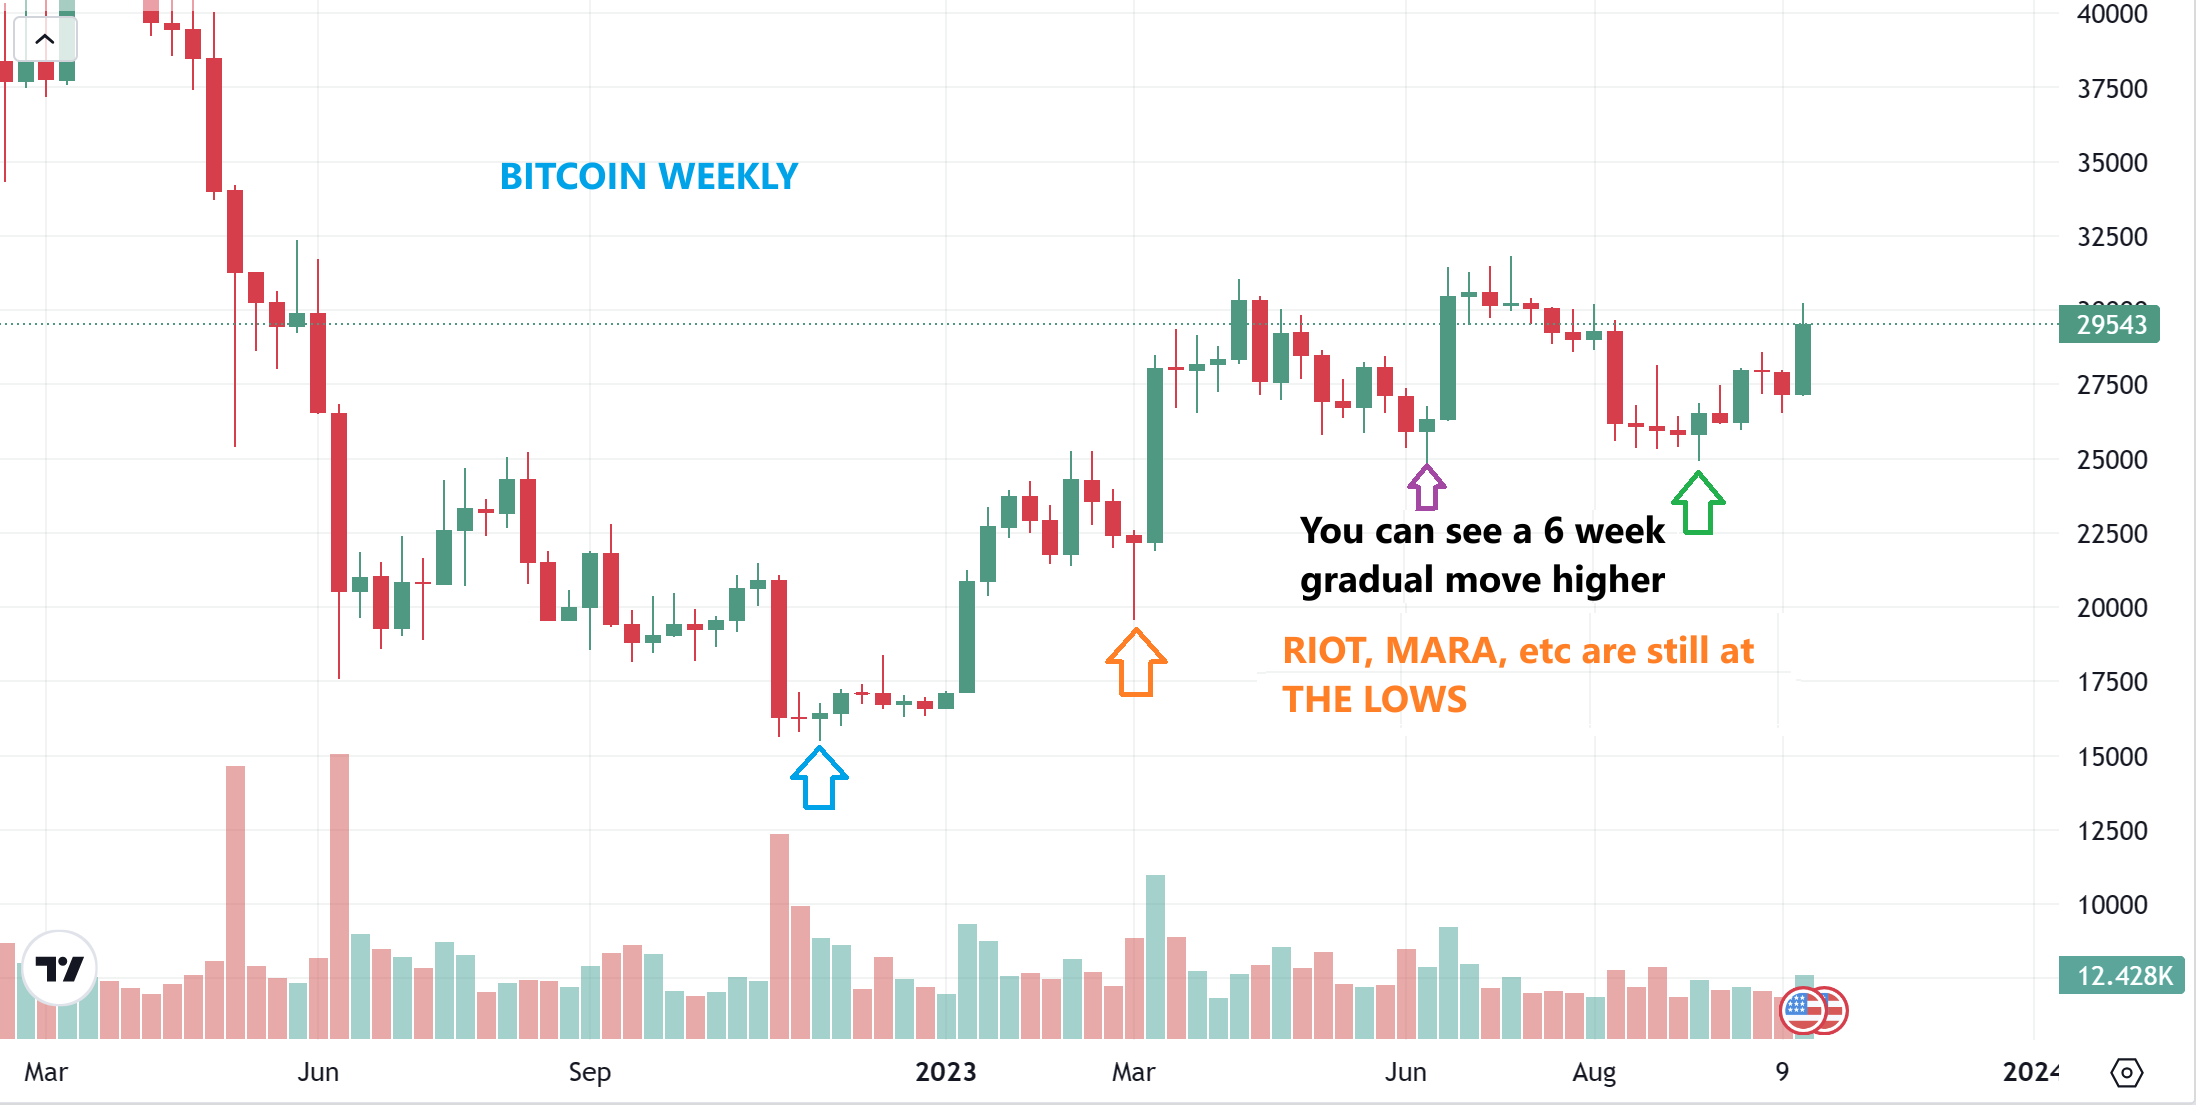
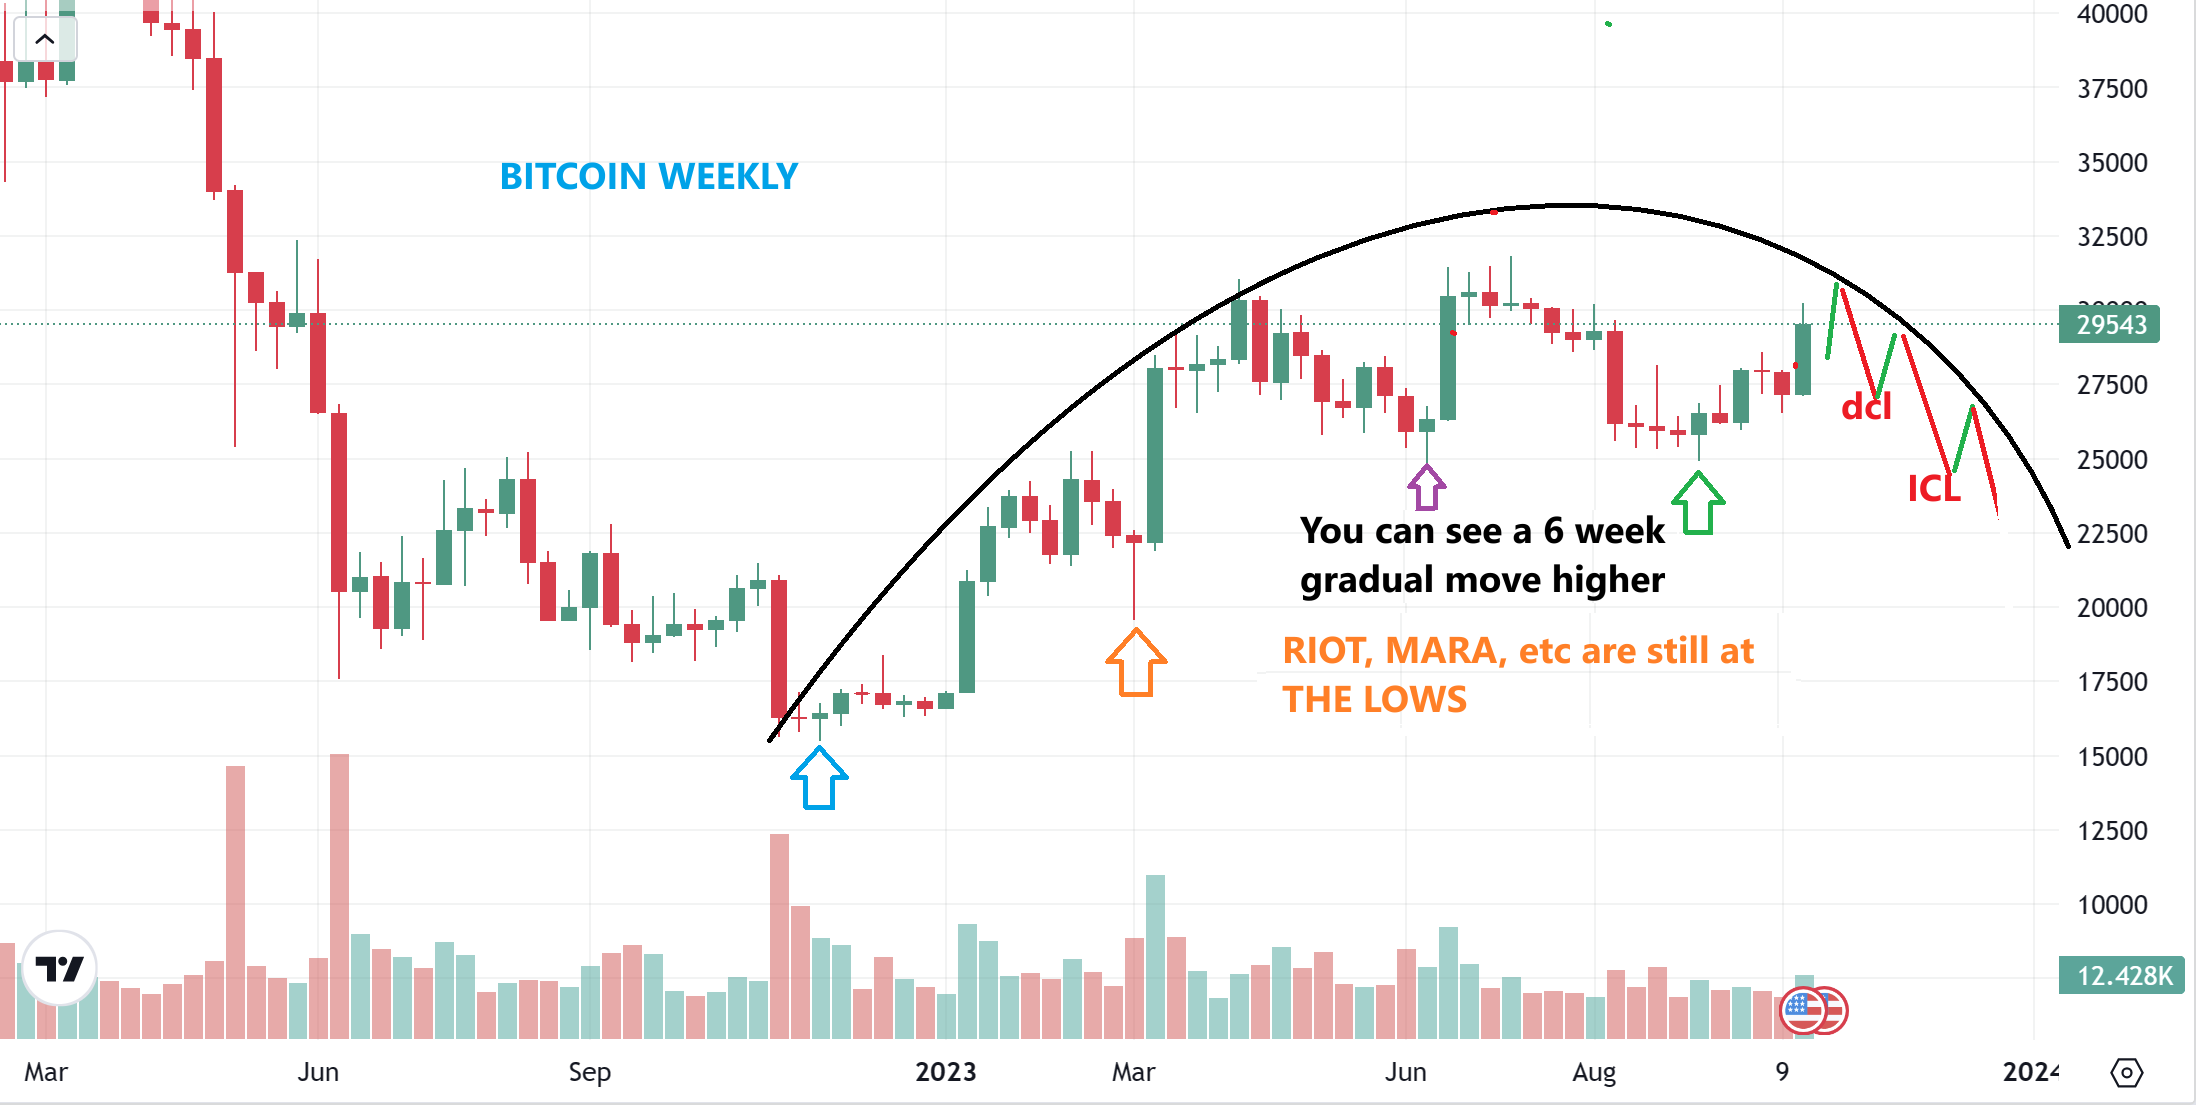
BITCOIN WEEKLY – I wanted to point out again, what I have been pointing out over the past few weeks. Bitcoin is running higher, you can see that here. The Crypto stocks are saying that it is a false rally, they are still at the lows. I believe that this rally is also false, because a drop into an ICL should be coming due, so…
.
In my head I view it like this:
.
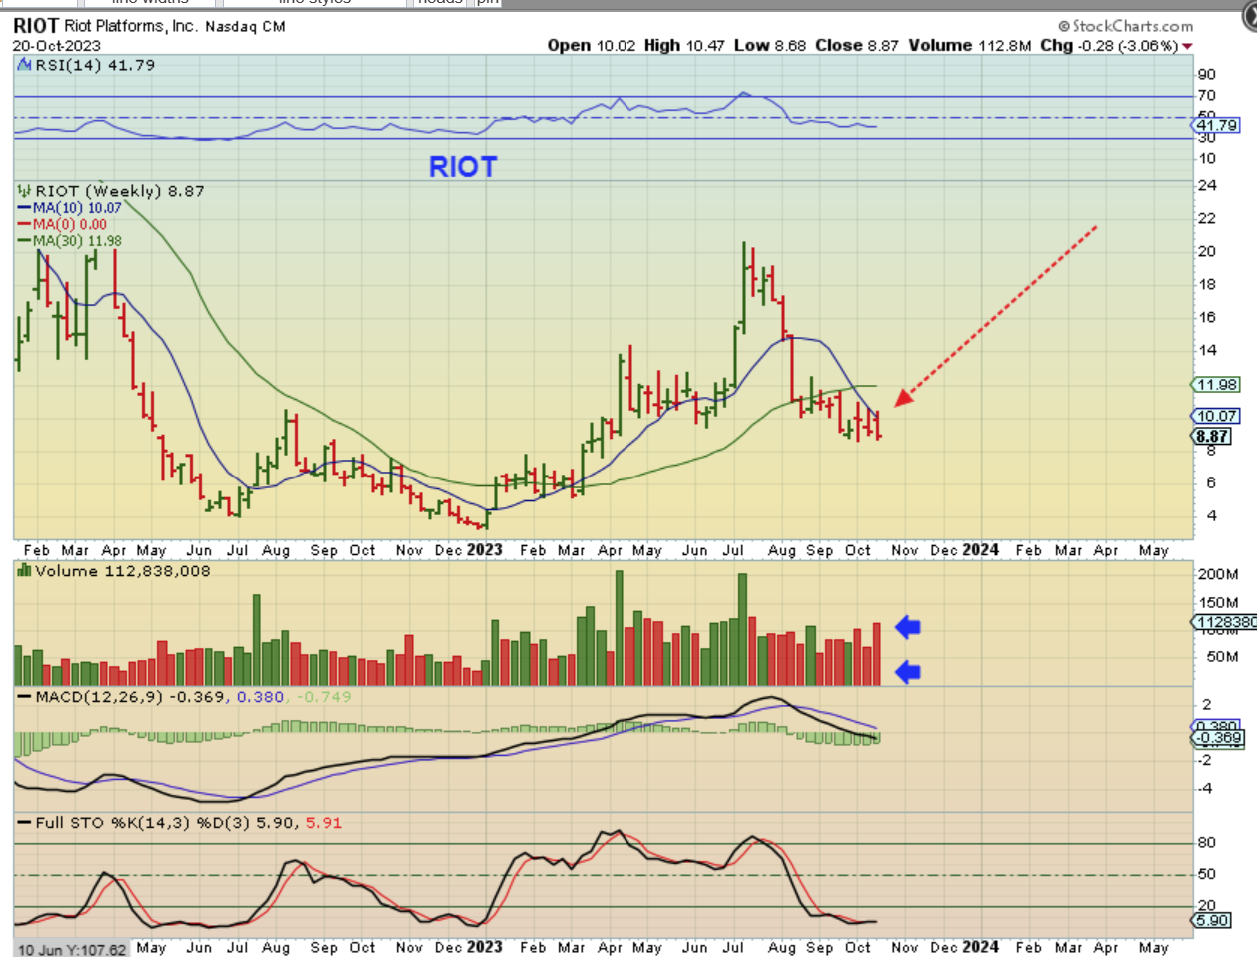
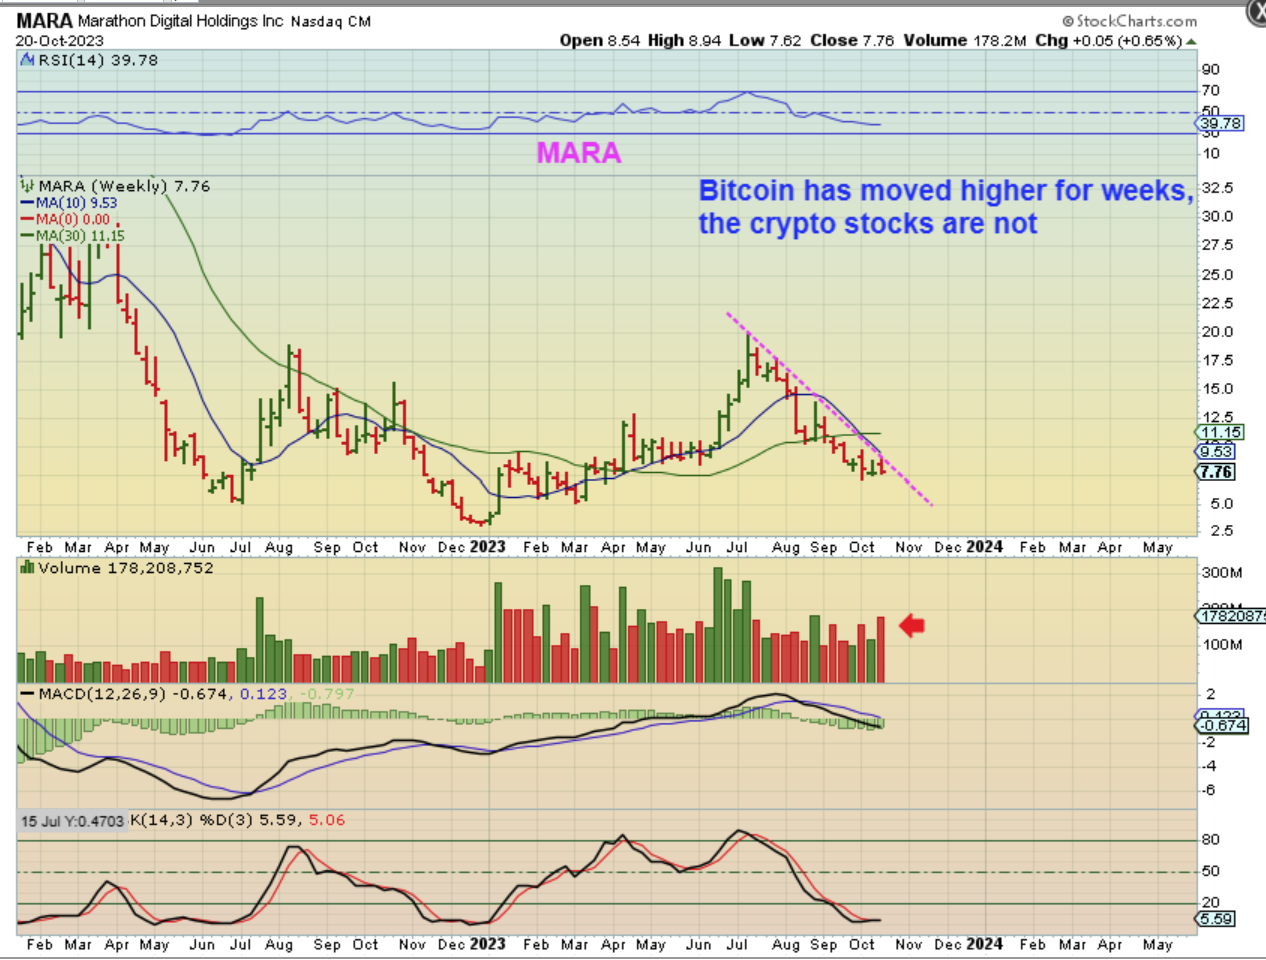
BITCOIN WEEKLY -I have drawn an idea of maybe this dropping into a dcl and then 1 more daily cycle to drop into an ICL. Next year is the halving year and I am expecting a big rally in this sector, so right now while everyone is thinking that an ETF would make Bitcoin rally, I am trying to be patient and watching for the crypto stocks to bottom & an ICL to form in Bitcoin. Lets look at MARA AND RIOT during this recent bitcoin rally…
MARA is still at the very lows of this sell off, isn’t it? During that 6 week rally higher in Bitcoin, MARA is red.
.
RIOT is also at the lows while Bitcoin moved higher for 6 weeks. I see 3 high volume down weeks, so my patience has paid off for now. Can you imagine Bitcoin dropping and MARA and RIOT at $5 or $6? WHAT A BUYING OPPORTUNITY.