
Friday October 20th
Growing up in New England, I can say for a certainly that we definitely have 4 distinct seasons and each has its own beauty! I love various things about each season and in the fall, when the leaves change and a burst of color is found surrounding you in every direction, it is really something to behold. In fact, these and other pictures are beautiful, but they really are never as good as when you are able to see it in person. So when our ‘Foliage Season’ arrives, there is no better way to enjoy the bright vibrant colors of the changing leaves than to be out in it. With that thought, today my parents and sister are going to drive up and join my Wife and I in a day trip to enjoy the scenery while we can. We are expecting a windy, rainy weekend, and that can take a lot of the leaves down if it gets too windy, so we need to go now. Long story short (too late for that, right?) 🙂 , I’m sorry, but I will not be in the commenting area today.

.
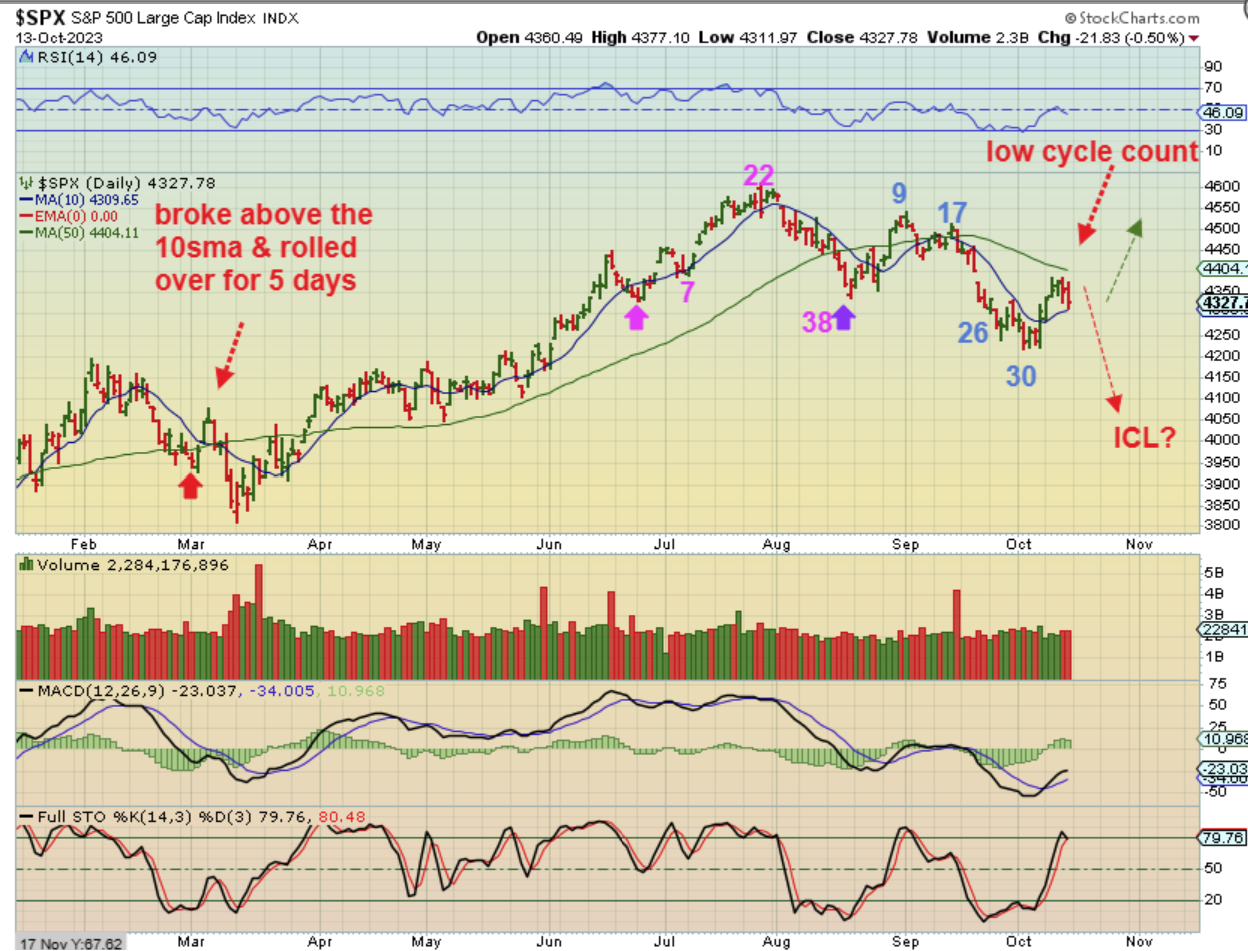
This chart is from last weekends report:
.
The SPX bottomed on day 30 & it usually bottoms later than that. We had two daily cycles bottom at 50 days recently, so I have expressed that I am not fully comfortable or confident in this as an ICL. It COULD be a day 30 low, but that would be early. At the lows I said that it could be bought with a stop.
.
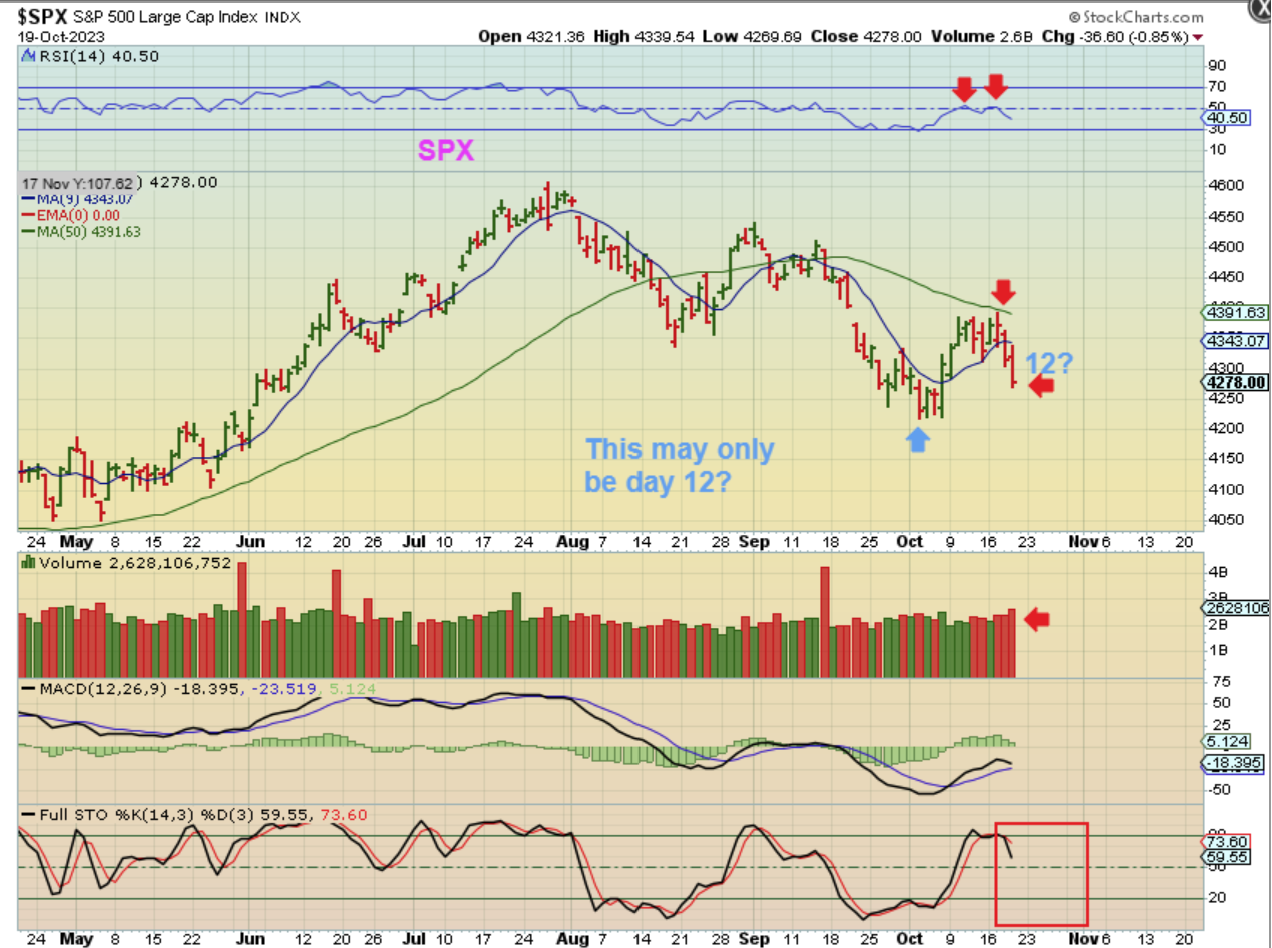
The SPX: I then raised stops to the 10sma and gains were locked in as that broke on Wednesday. Thursday was very choppy with the Jobs Report and the Fed Speech, but in the final hour the markets decided to sell off with follow through lower. Volume increased, we are not at all near oversold, and this is starting to look more and more short term bearish.
.
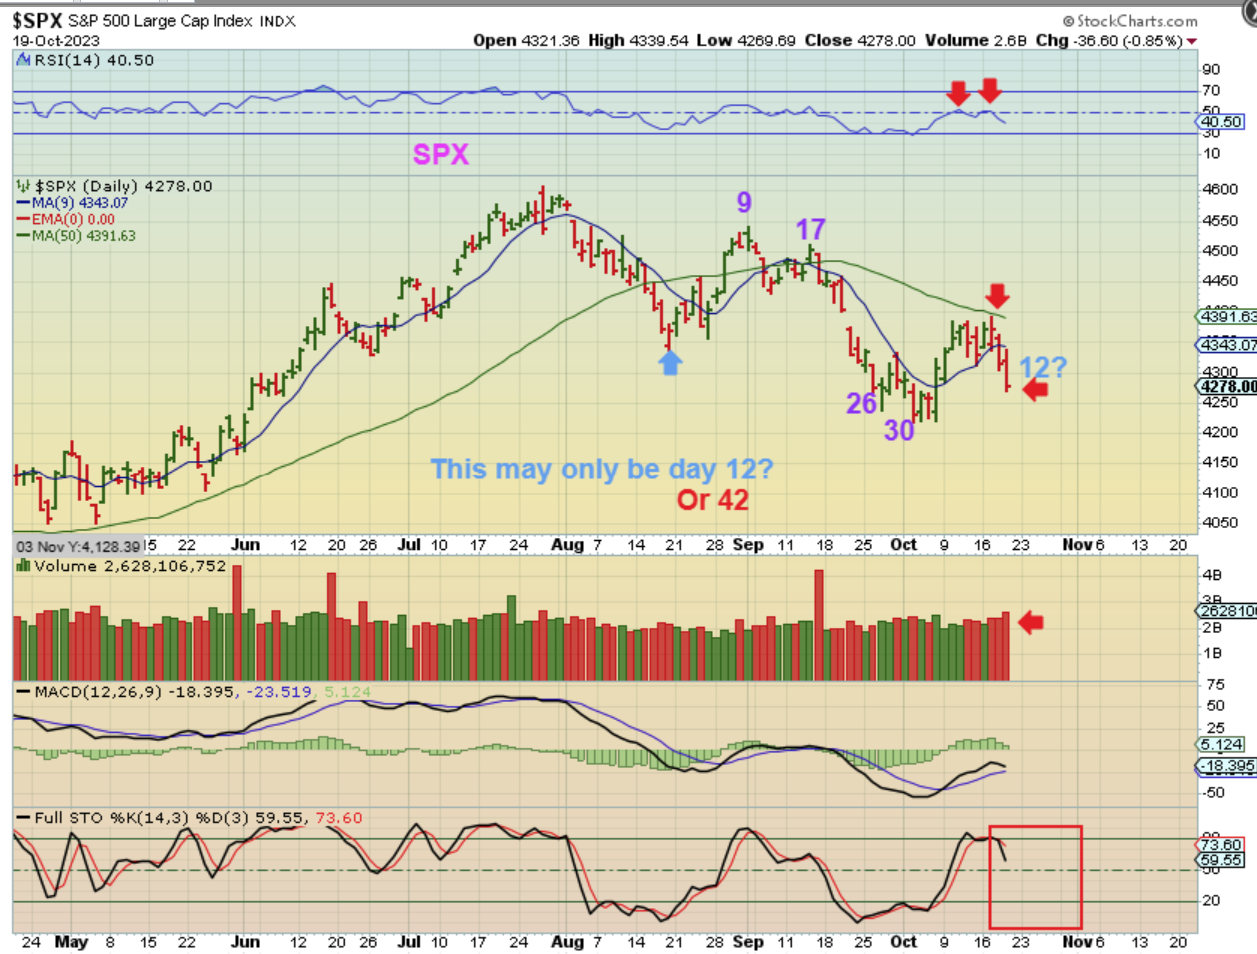
One big cautionary note would be that ‘If that was a day 30 dcl’, and this is now a new L.T. daily cycle, then we are only on day 12 and we would have a LONG way to go. The other thought that I have expressed is…
.
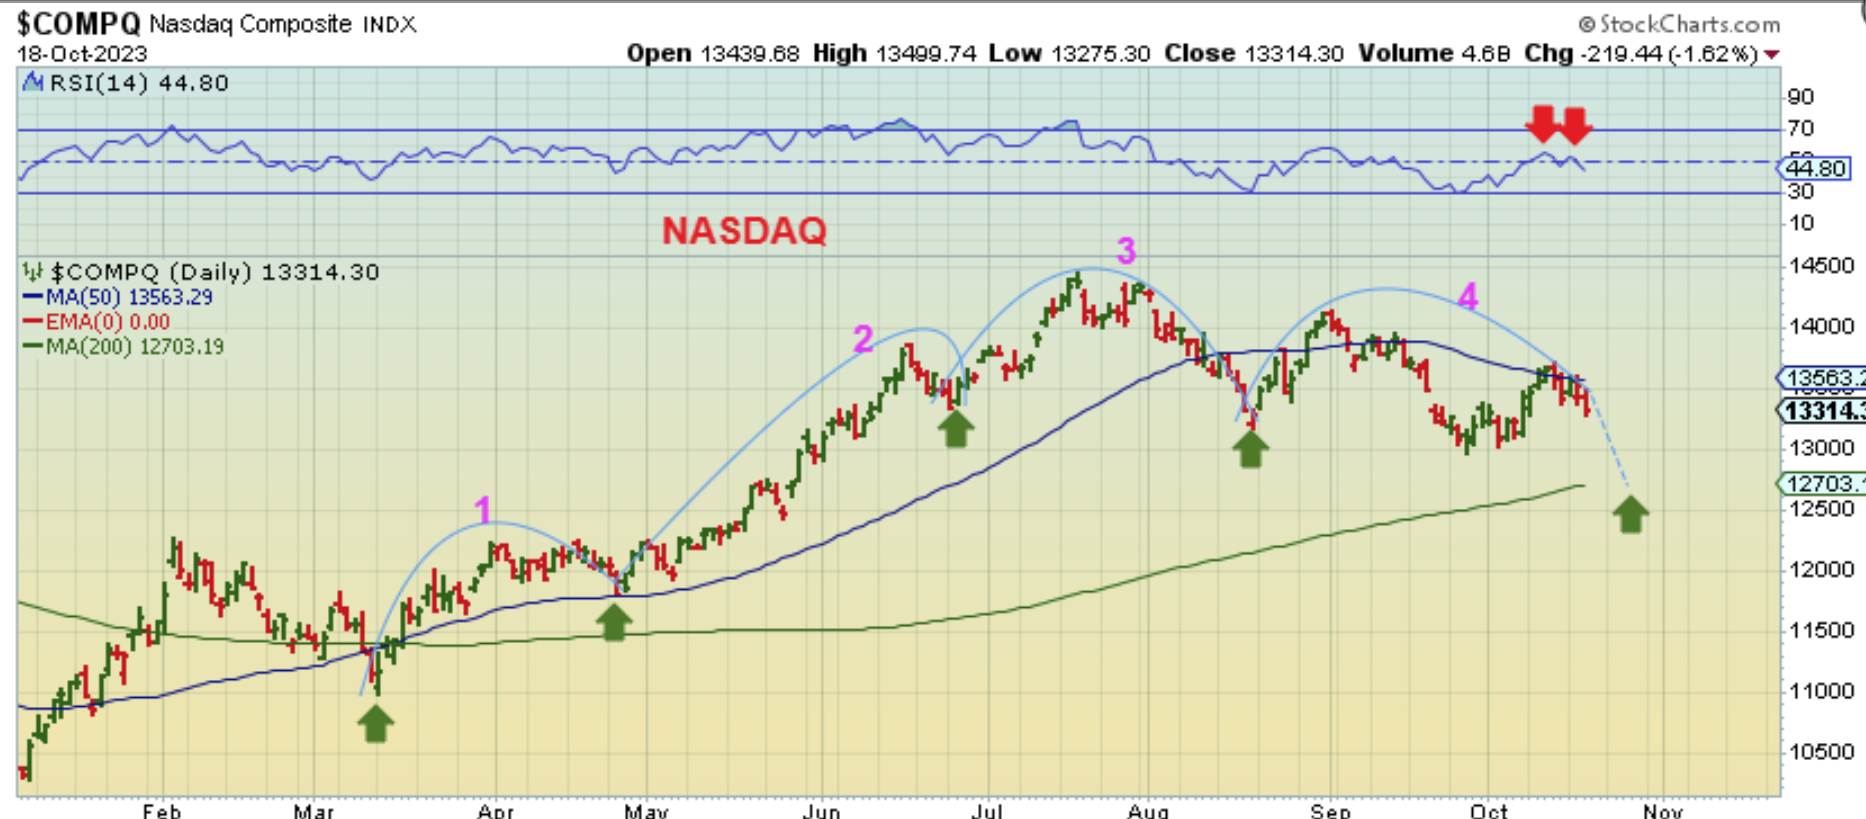
NASDAQ –The other thought that I have expressed is that this may be all one large 4th daily cycle.
The Nasdaq was crawling under the 50sma. Here I drew what a ‘4 daily cycle’ run could look like if the ICL is still ahead and we do NOT have a true dcl in place with that day 30 low. We’ll be watching the 200sma for clues if we break down.
.
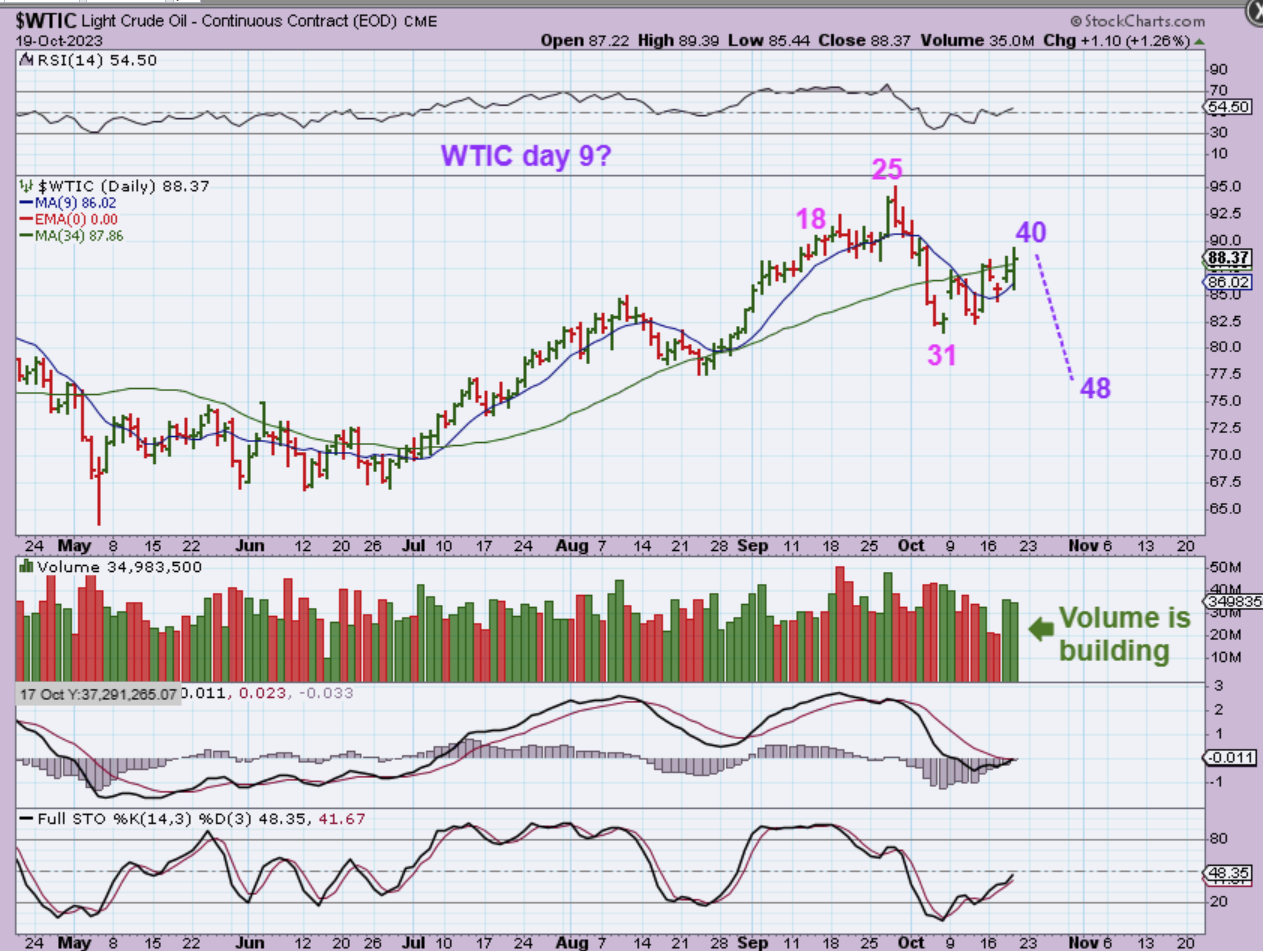
WTIC – Oil started to break higher yesterday, so that early day 31 low could be a dcl, but…
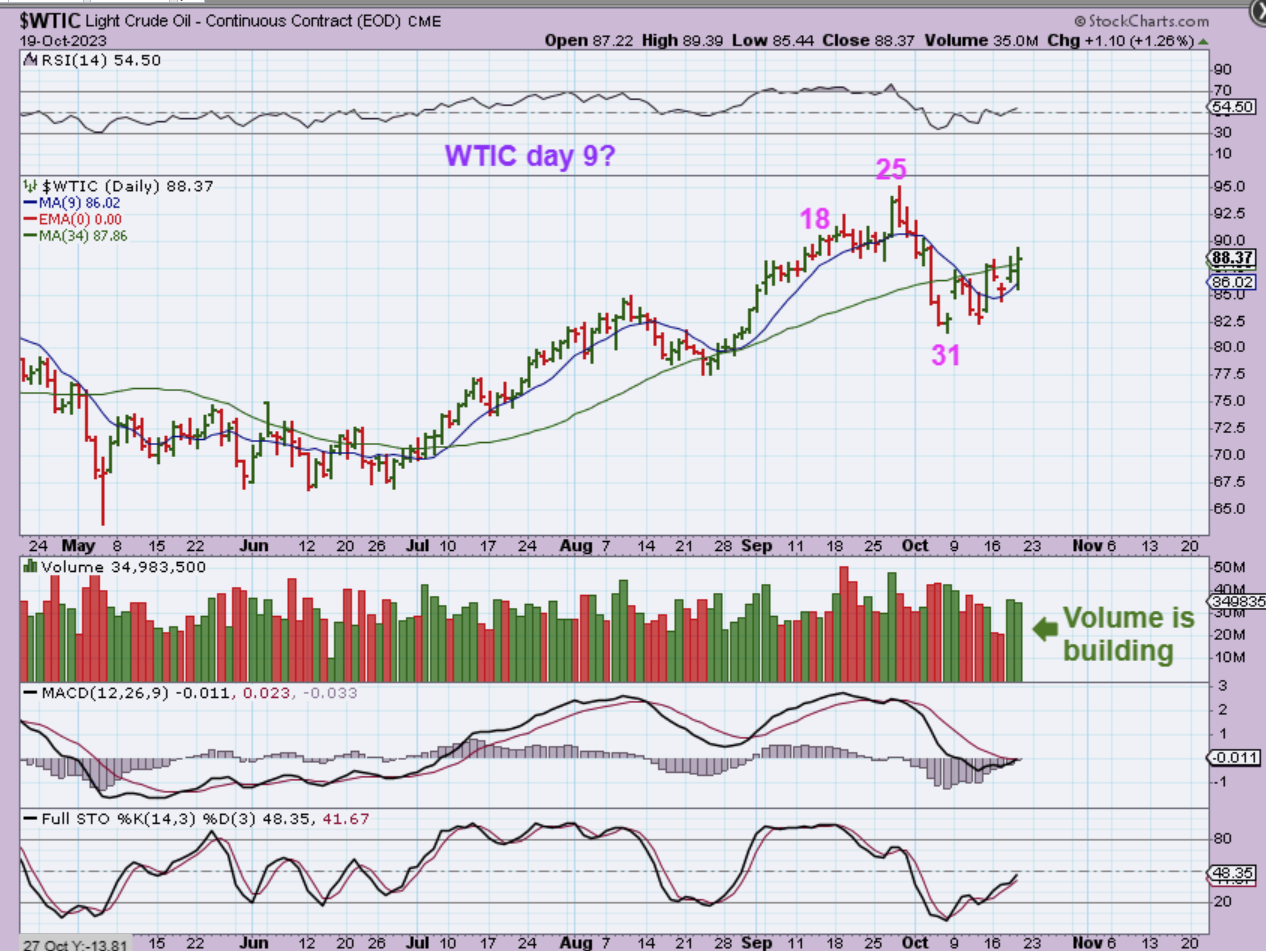
Normally Oil cycles run 45 days or so, so I pictured a drop as seen here to give us that a-b-c drop into an ICL. We’ll have to wait and see.
.wes.
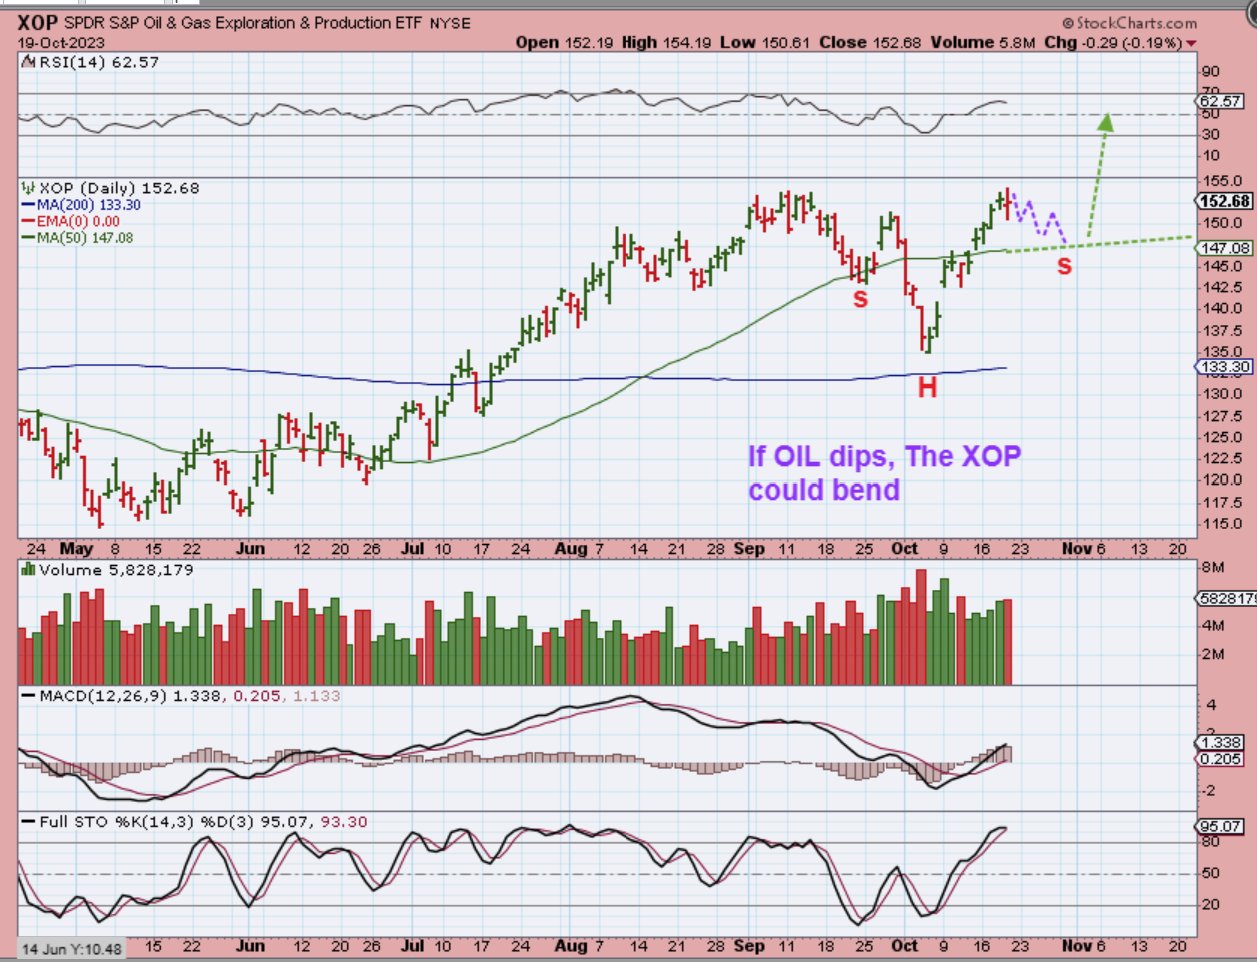
XOP – Since the XOP bottomed ahead of Oil, I would imagine that a drop in Oil would simply give Oil Stocks a pause or gradual dip lower, as seen here.
.
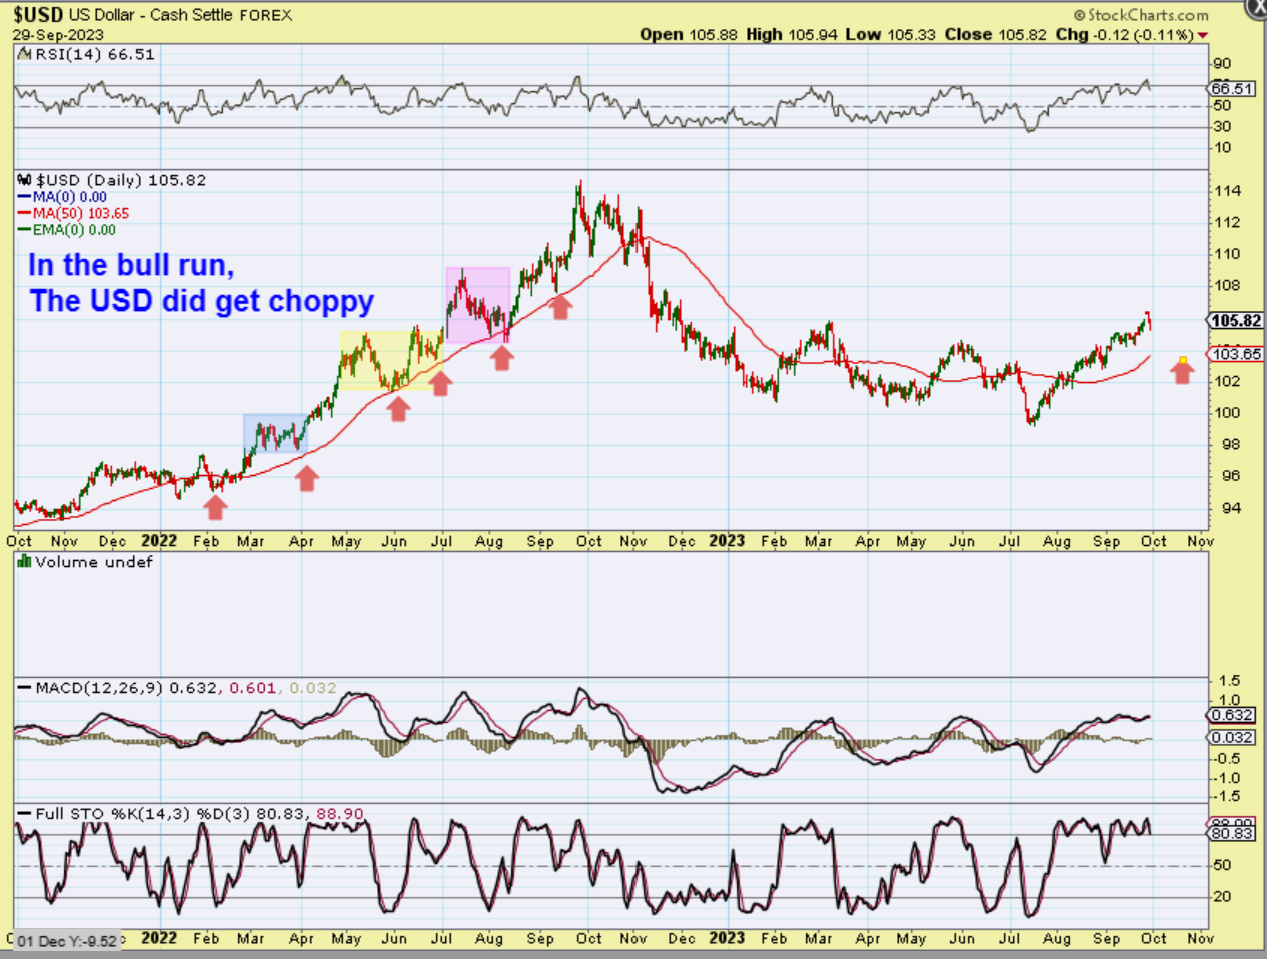
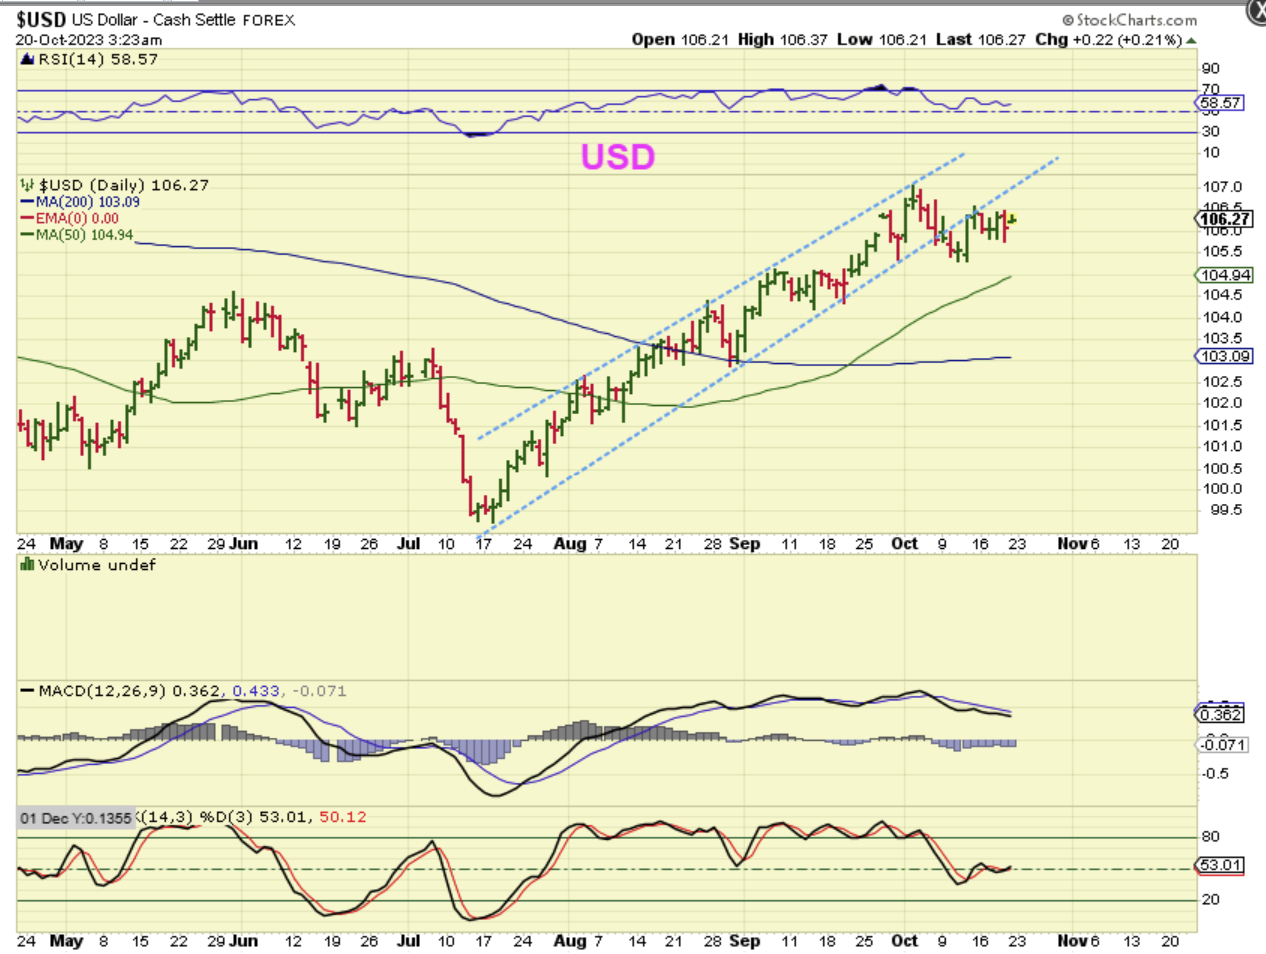
THE USD has churned sideways in the past bull runs, and I pointed that out using this chart from September 29 chart. I said that we may see that next with the USD, and…
.
THE USD is churning sideways, similar to past dips into a dcl or ICL. So I mentioned that in past reports and it’s good to see that here, since it is giving Gold a boost.
.
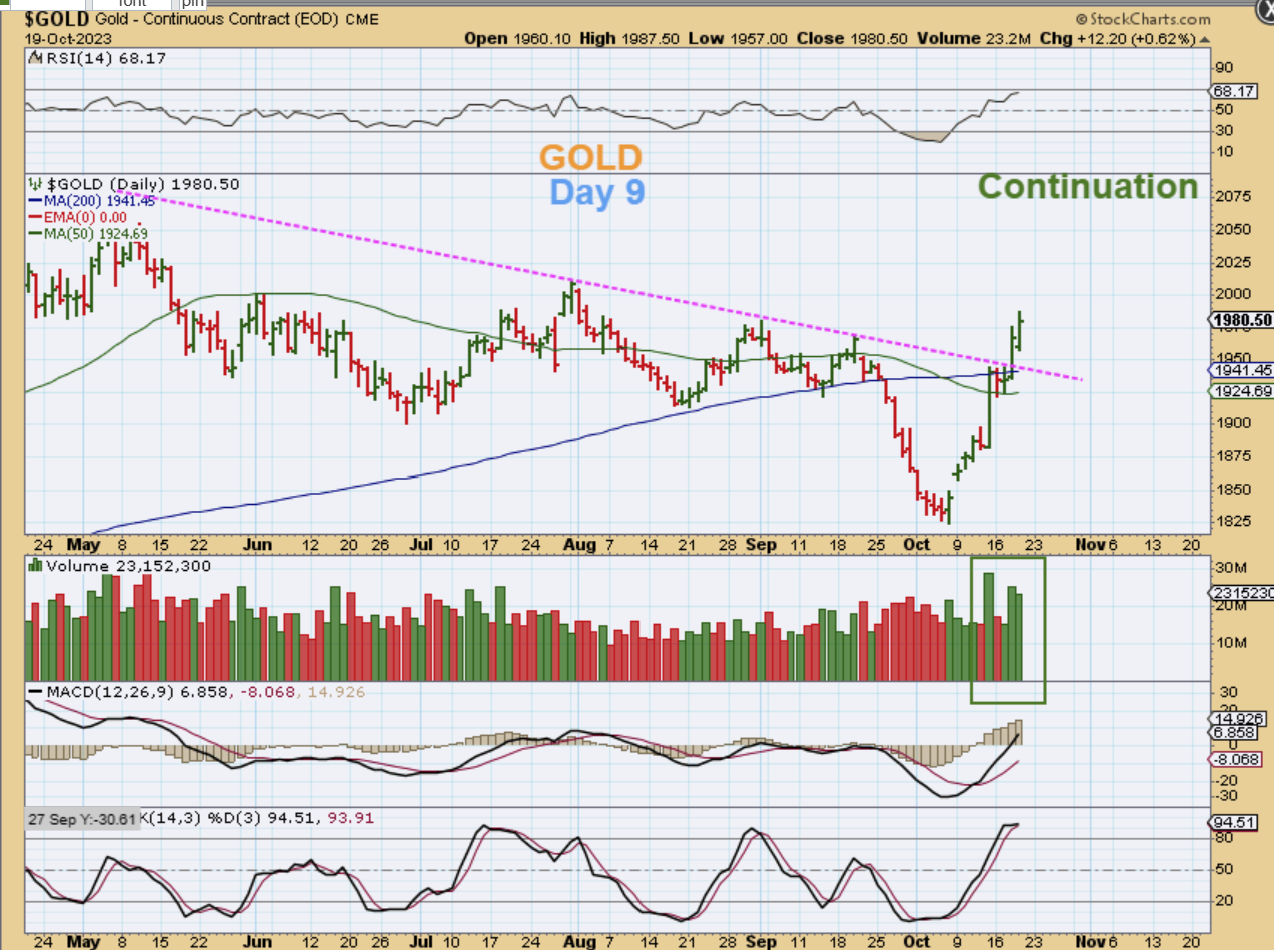
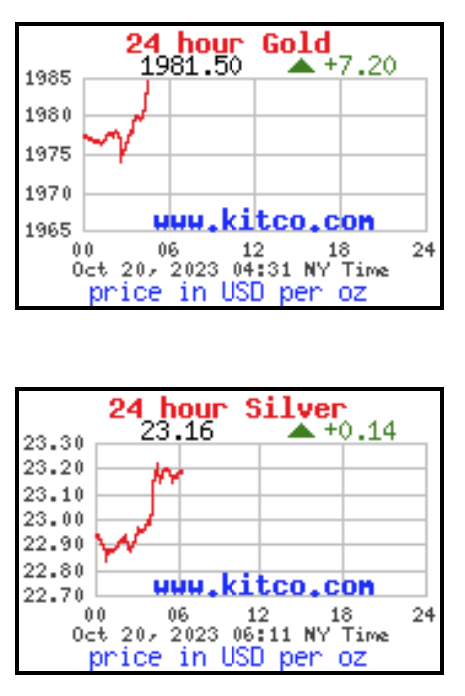
GOLD surged again on day 9. The chart is a bit deceiving though, because it was actually a VERY choppy day with the jobless claims report and the Fed speaking midday, but it resolved to the upside as we headed toward the close.
.
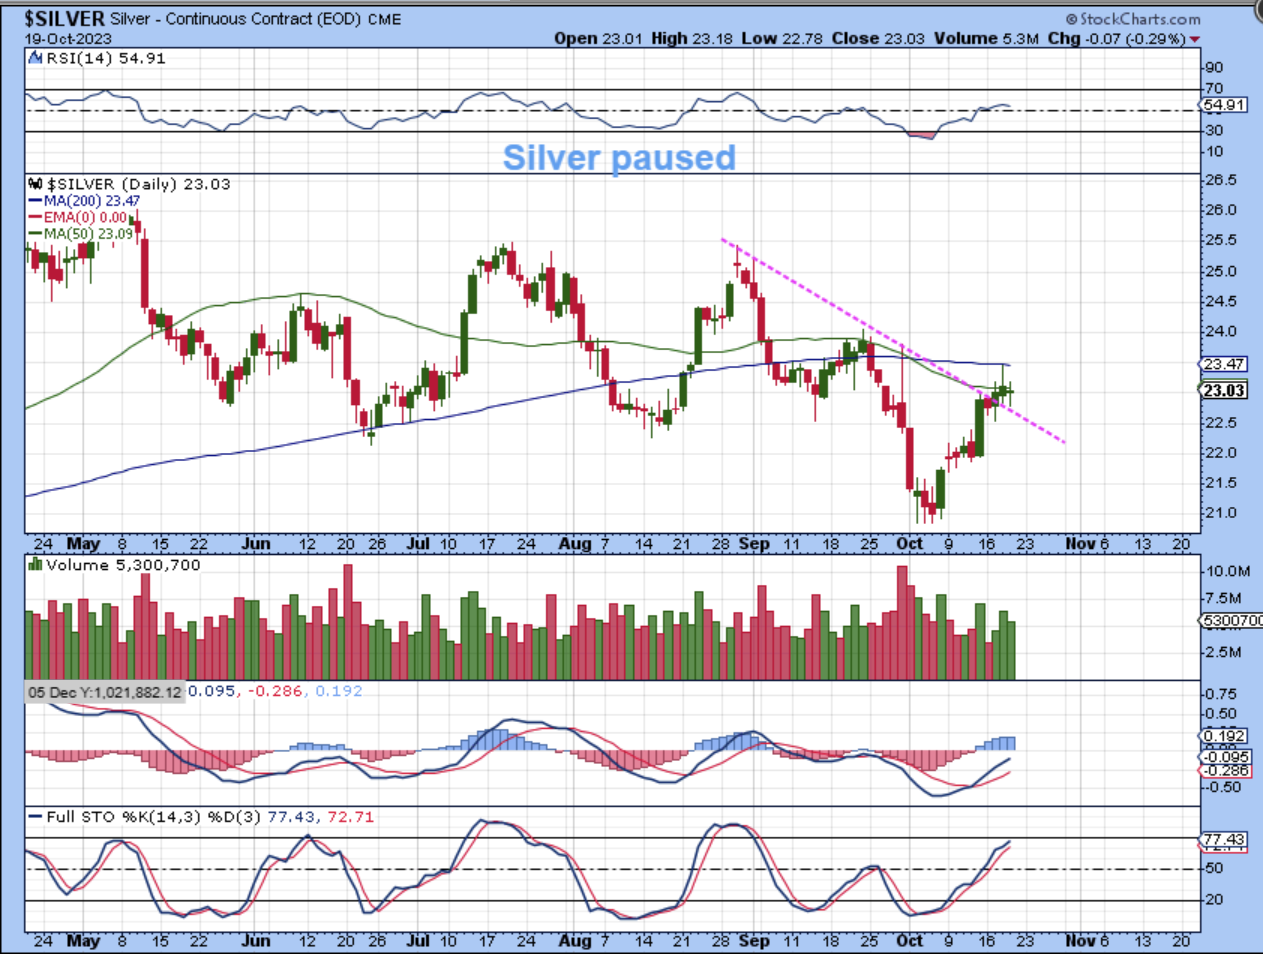
SILVER did not resolve to the upside. It too was very choppy and it pretty much gave us a Doji candle of indecision.
.
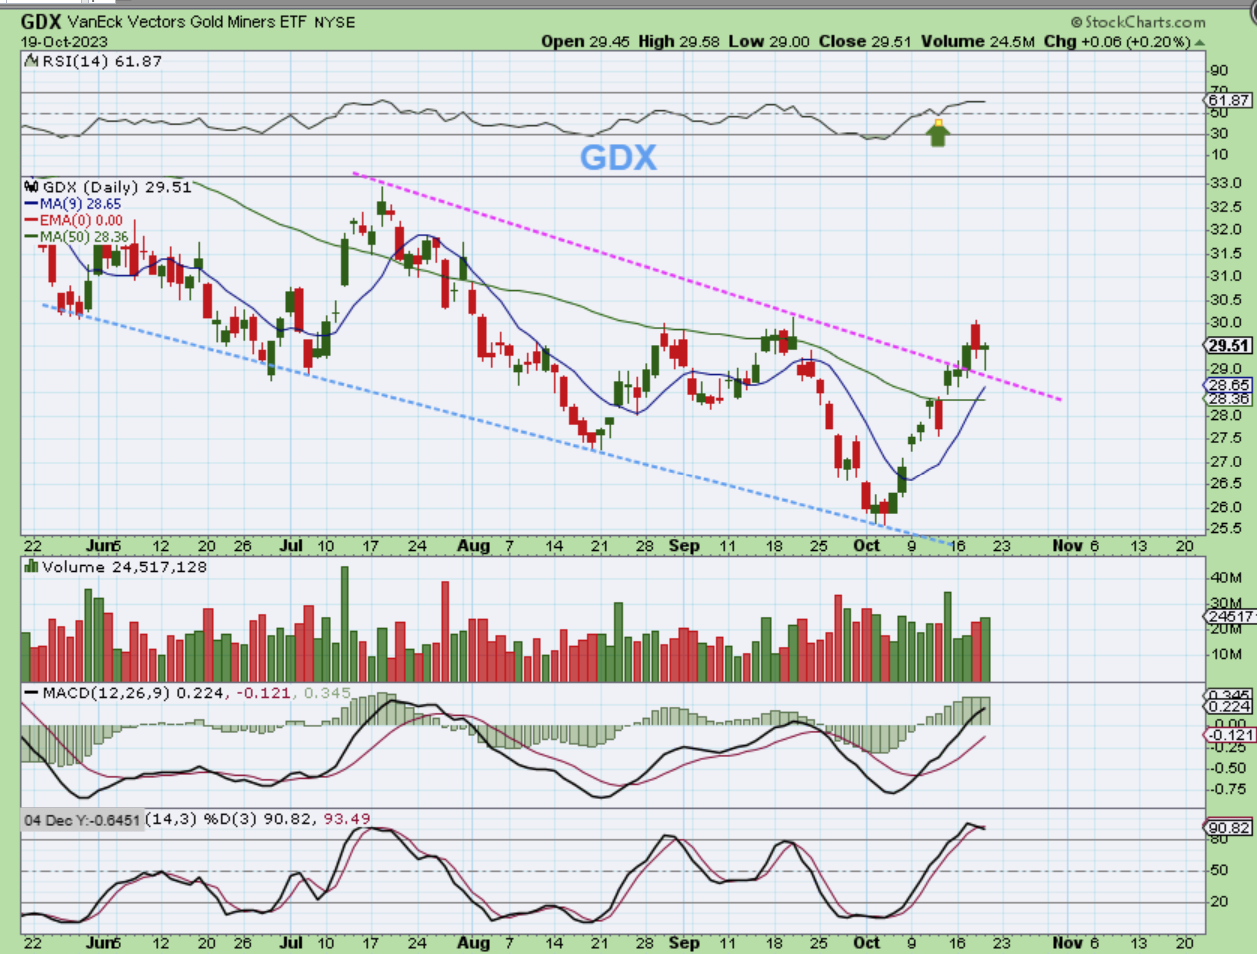
GDX seemed to back test the channel that it broke out from. It dropped and started to recover, but unfortunately it only closed up 6 cents with Gold up as much as it was. I’d really like to see some more upside Friday, just to make the weekly charts look even better.
,
Again, I will be away with family today, but things are looking like we might be off to a good start! This is what Gold and Silver look like as we start our Friday, and hopefully this continues throughout the trading day. More than that, I hope the Miners find buyers and continue to follow the metals higher! Can you believe it? Gold is almost at $2000 and prior highs were roughly 2077.
,
Enjoy your Friday trading and enjoy your weekend too! 🙂
.
~ALEX

