
Wednesday October 18th- Good Morning!
I gathered some charts on Tuesday evening, and as I awoke to finish writing this report at 5 a.m., This is what we have currently going on. A bullish breakout above resistance for Gold. Good morning Gold Bulls! We’ll discuss that shortly, but as usual, we’ll do a review the general markets too.
.
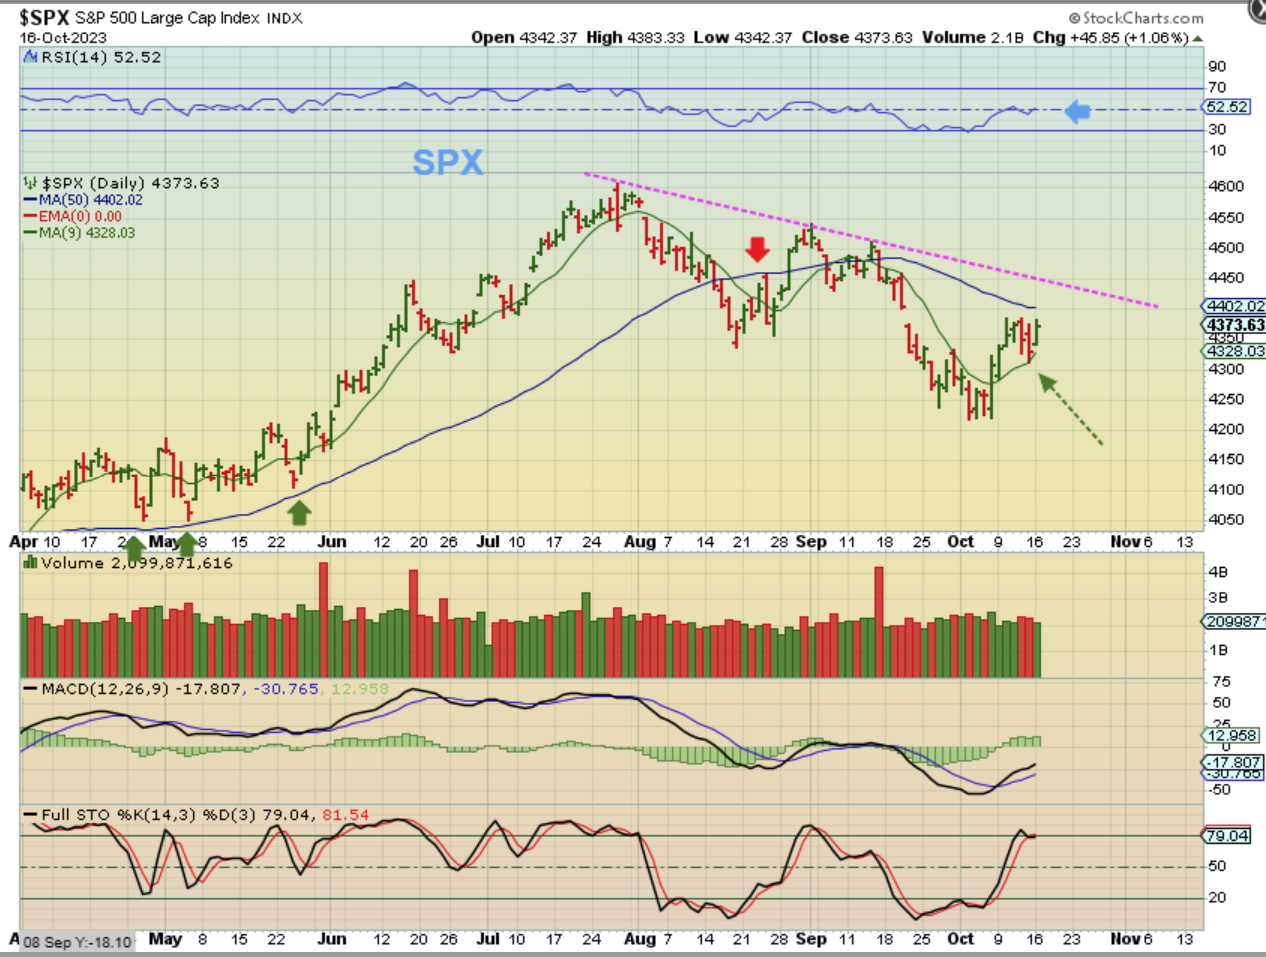
YESTERDAY I USED THIS CHART AND MENTIONED THAT SPX held up after the tag of the 9 or 10sma (Where I had mentioned you could raise your stop to)…
.
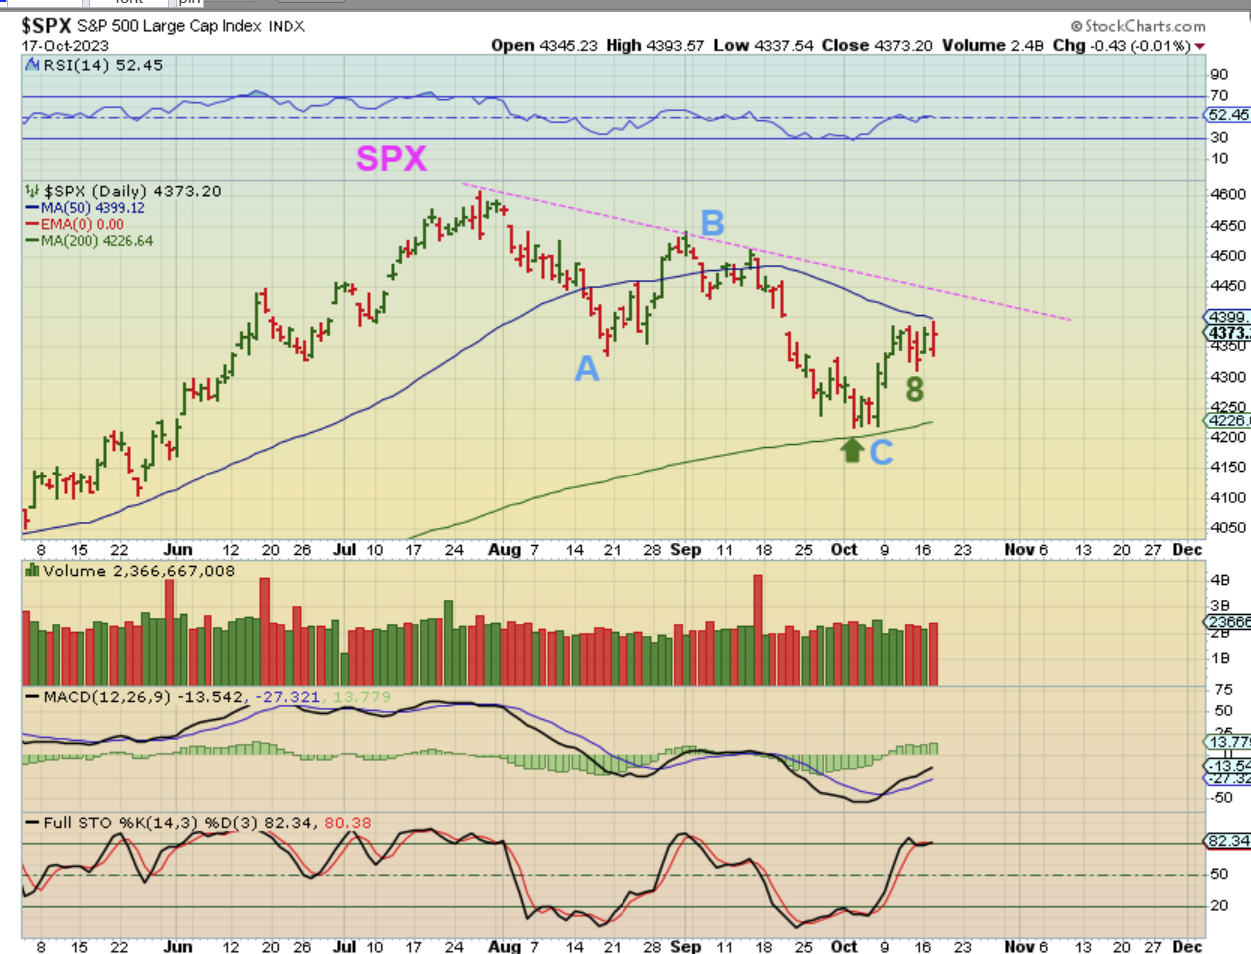
THE SPX is on Day 10, but it has been churning under the resistance of the 50sma. Stops would be under day 8, since that is where the 10sma is and they can be raised under the 50sma if or when we break out above it.
.
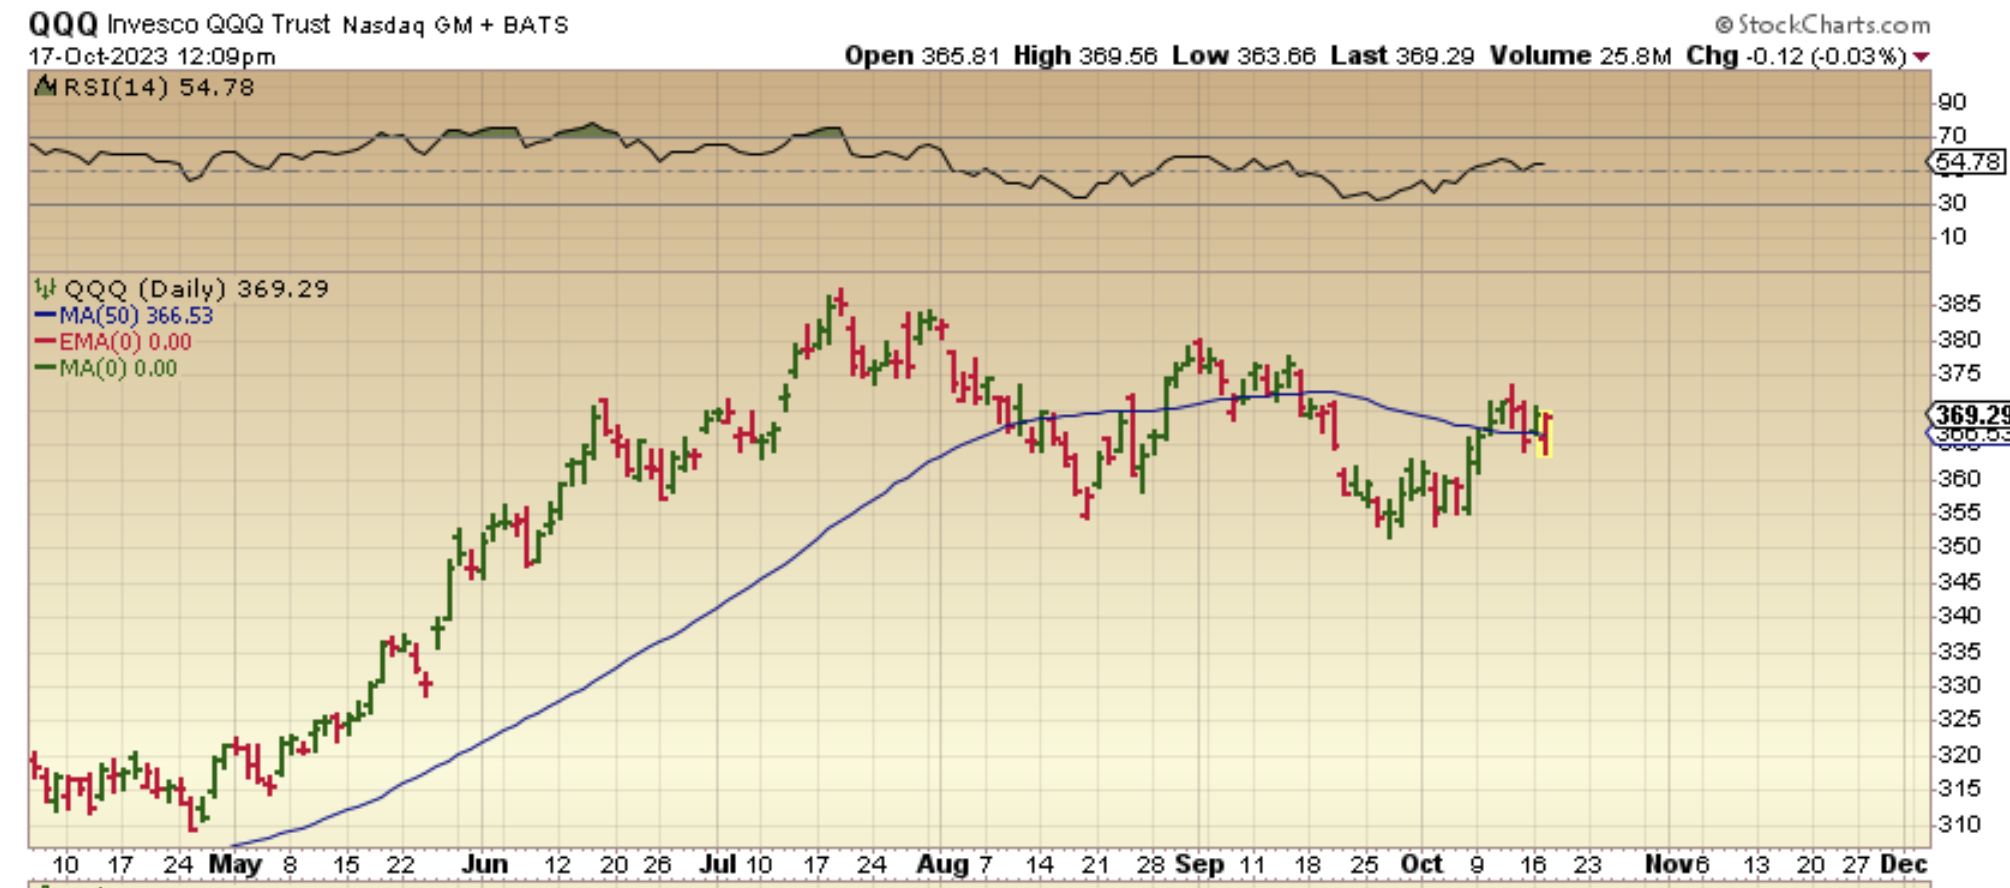
I wanted to mention that I posted this bullish chop of the QQQ Midday. It looks good, but I also should mention that even though the QQQ or SPY may be a bit ahead of the indexes when it comes to the moving averages…
.
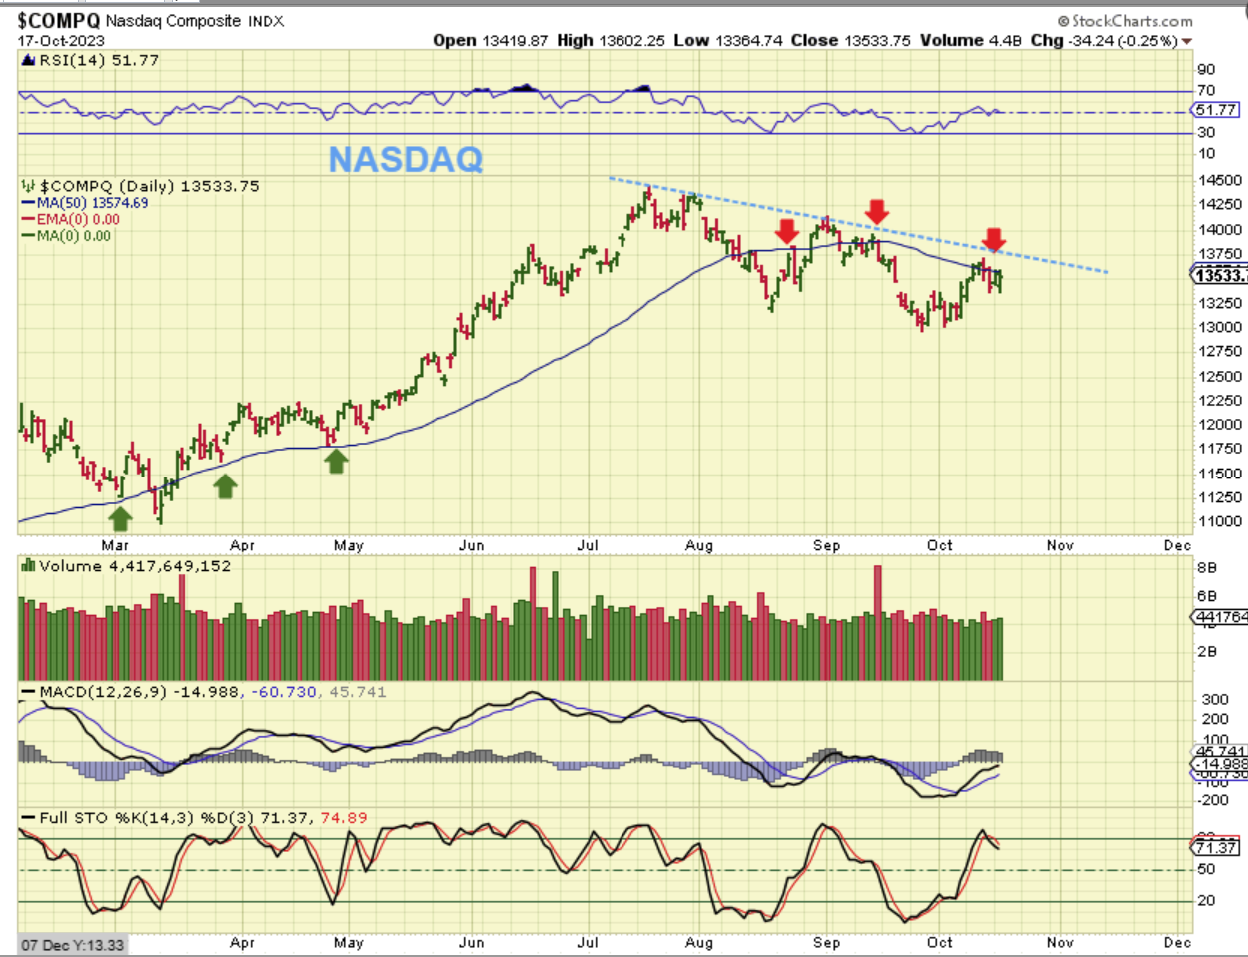
The NASDAQ is still pushing on that resistance area from the underside, and you can see that in the past this has acted as resistance and support.
.
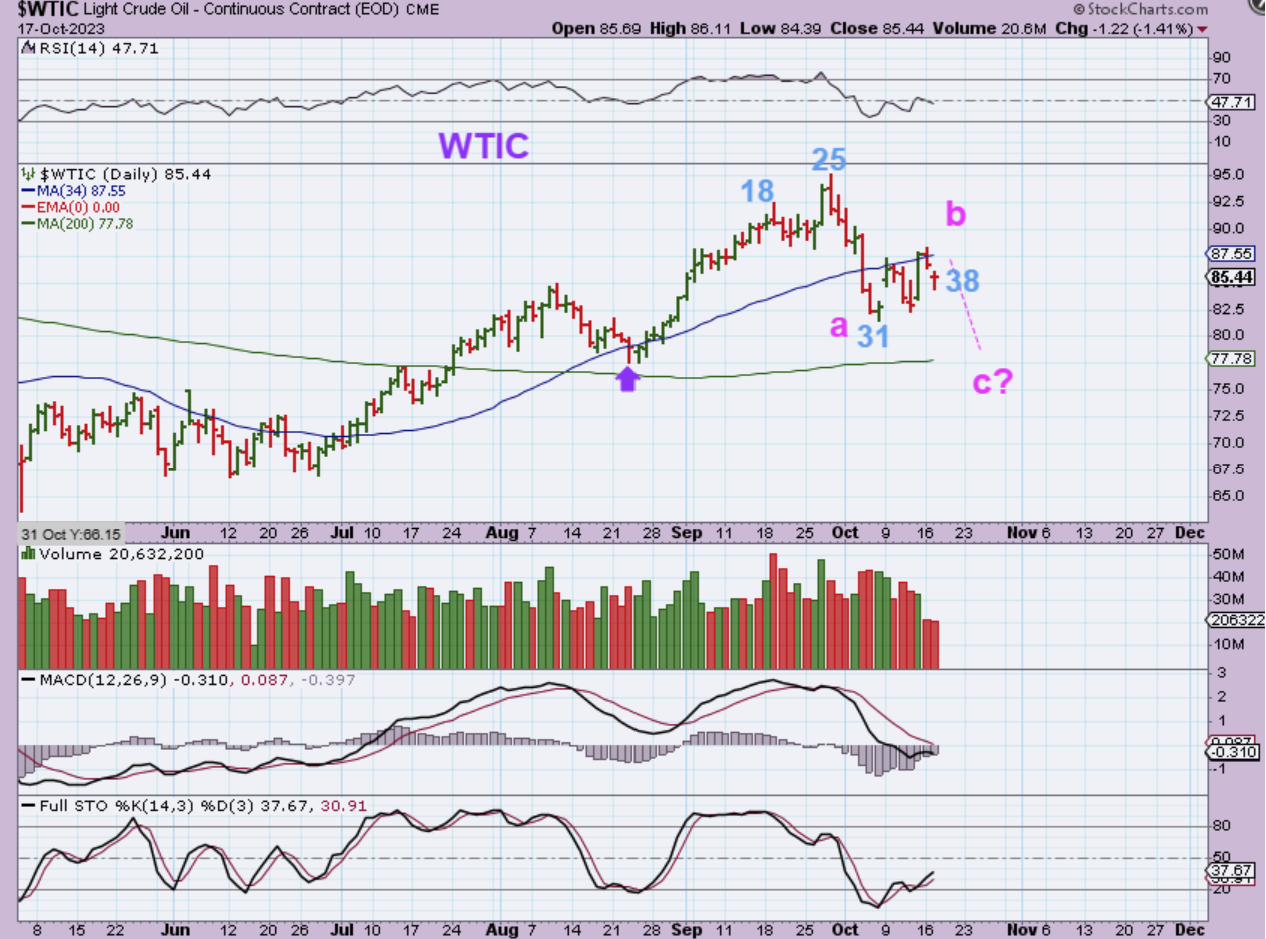
WTIC- I have been saying that the daily cycle count on OIL can be up to 50 days long, and the low here seems too early. Can the War in Israel and Ukraine affect oil? It could, but so far Oil is still under the 34 sma , which is acting as resistance. Oil stocks have bottomed earlier than OIL. Oil stocks have been a buy and a ‘buy the dip’, and that is normal for Oil stocks. They may dip if Oil drops to this ‘c’ point.
.
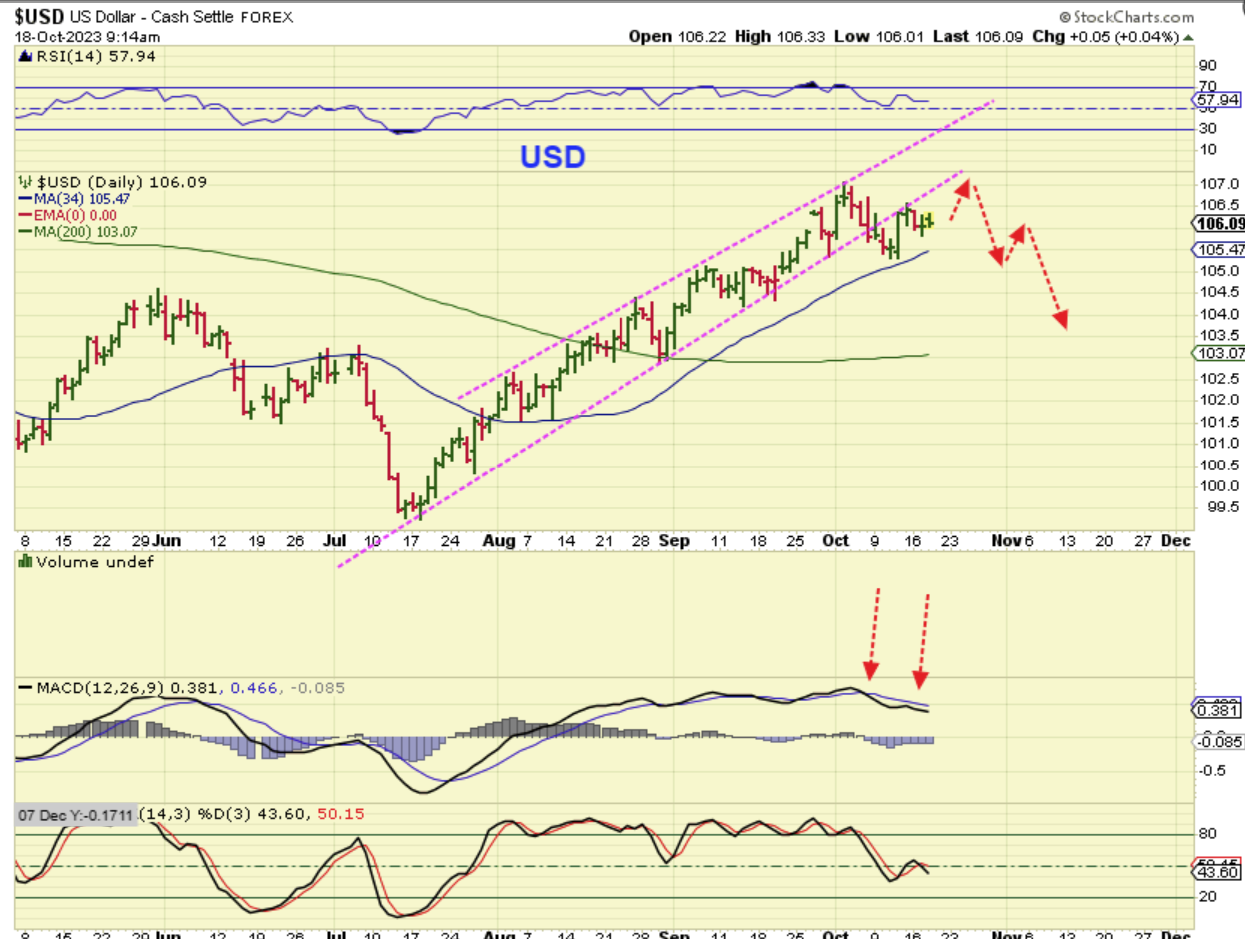
Take a look at the trend line that was formed when the USD raced higher. Price seems to be trapped under it now. We are on the 3rd daily cycle, this should be day 4 and I expect the USD to form as L.T. (Left Translated) and then start to roll over. That should help Gold & Silver too. The MACD looks weak to me.
.
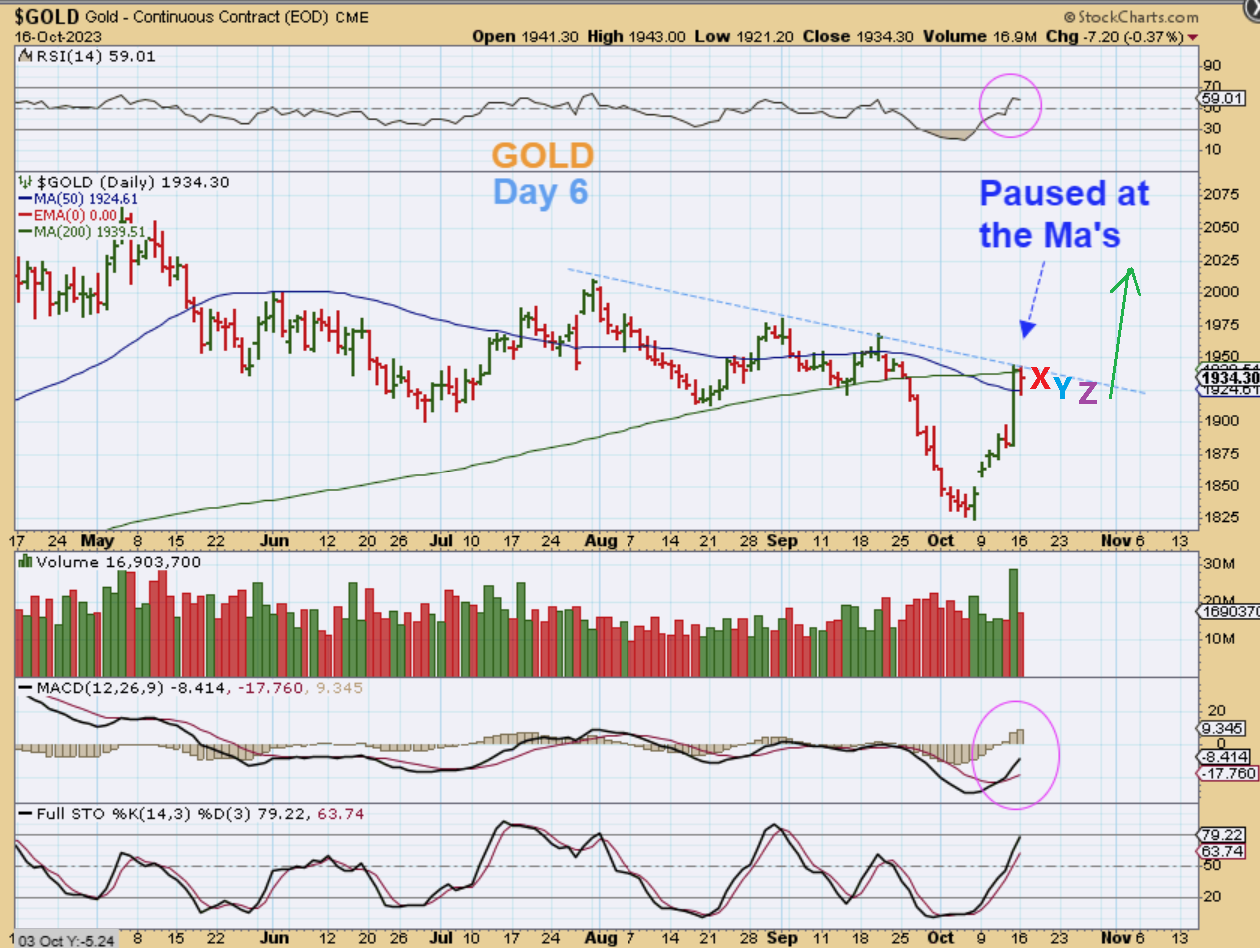
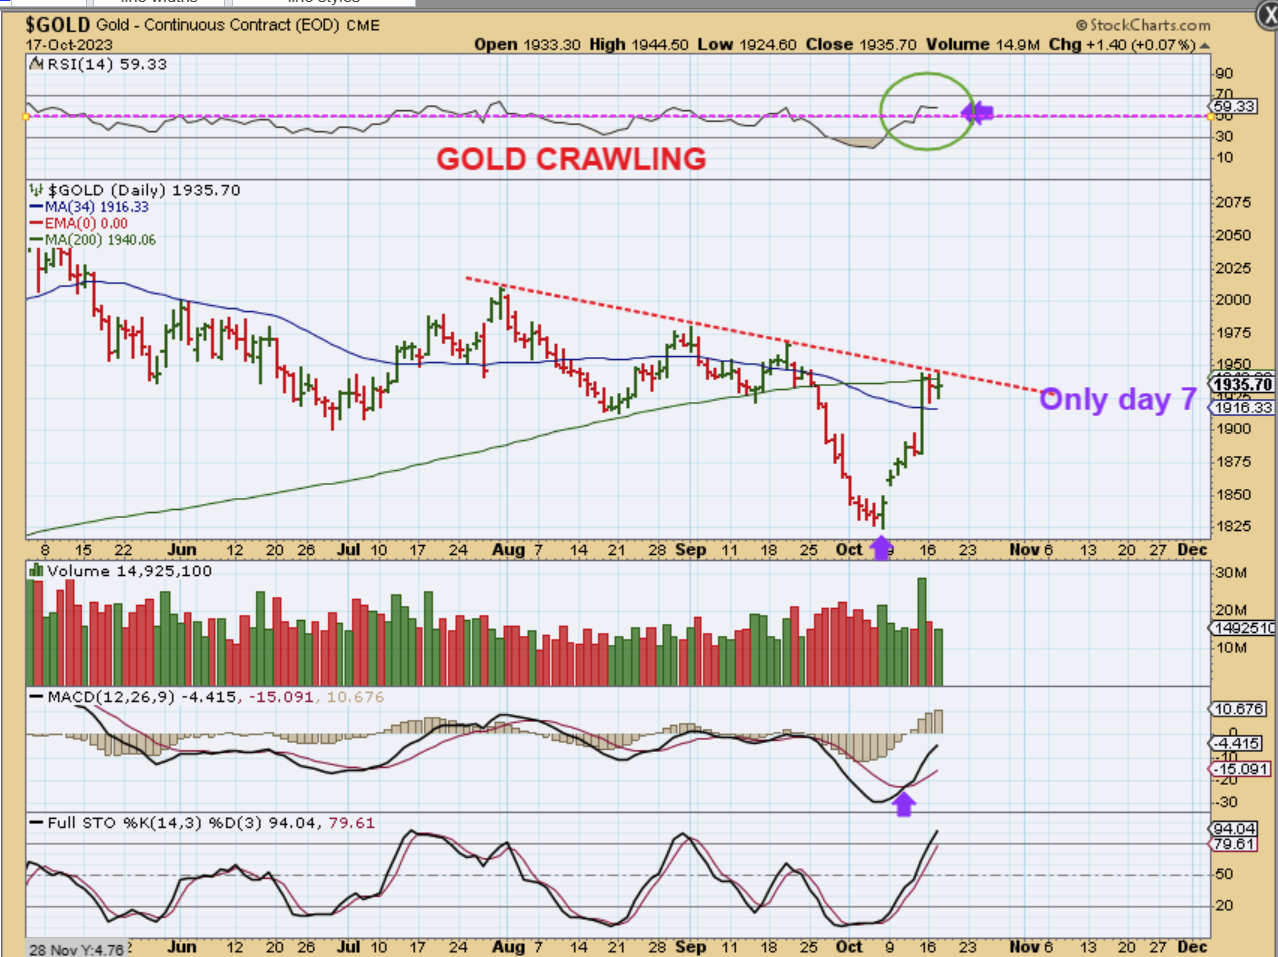
YESTERDAY I DREW THIS ‘PAUSE’ FOR GOLD: It should be short term, so I used XYZ to represent a few days. I wrote…
.
The XYZ represents what price could do if it stalls and crawls along the downtrend and 50sma. I would then expect a strong break out higher.
.
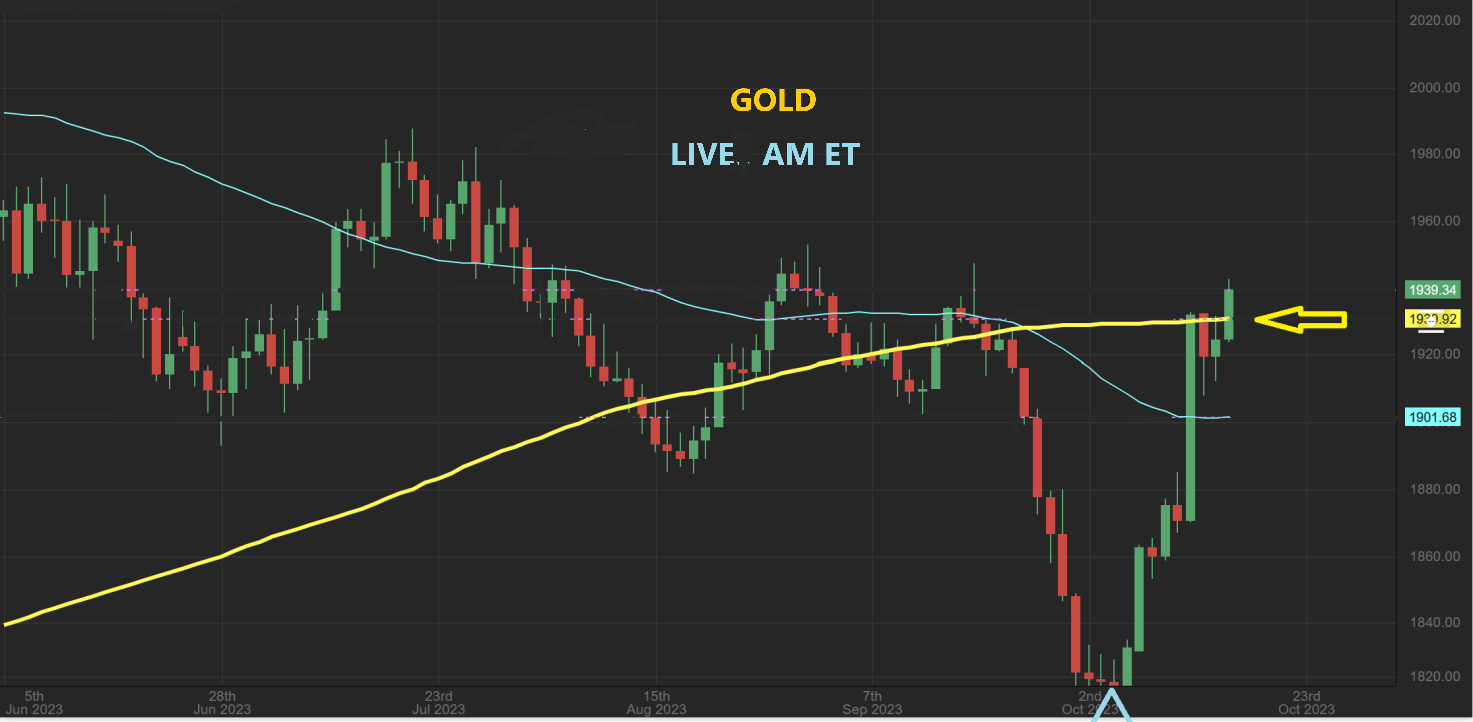
GOLD remained under resistance Tuesday and is ‘crawling under that 50sma, but it looks strong and should break out sooner than later.
.
GOLD LIVE 5 a.m. Wednesday: And here we see that Gold is breaking out today. I mentioned that Gold, Silver, and Miners were a buy at the lows as an ICL and it was a ‘buy & Hold’ for this very reason – it is not pulling back enough to allow people waiting to ‘buy that dip’ to enter.
.
Similar to Gold, SILVER is pushing on resistance too.
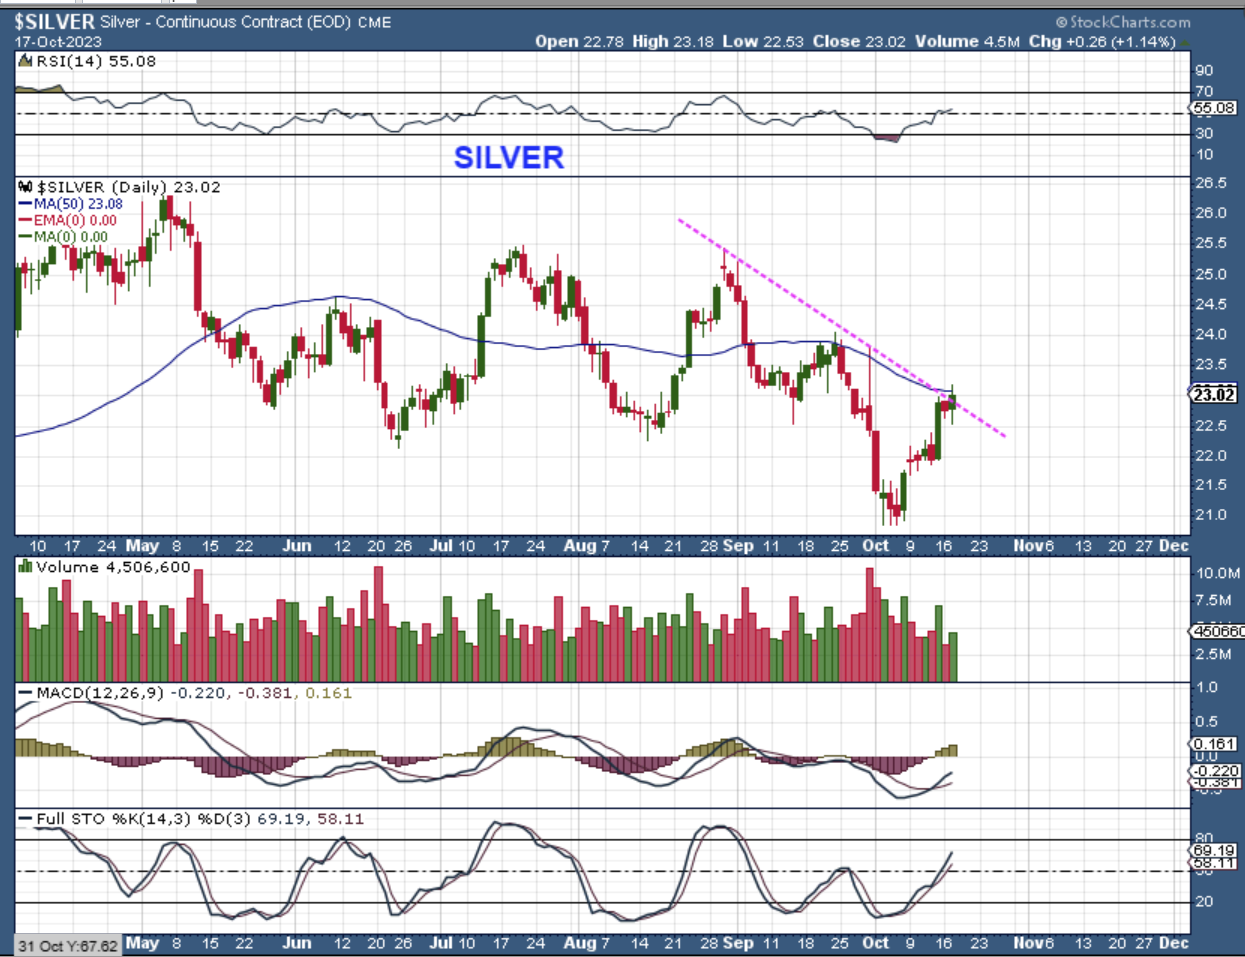
.
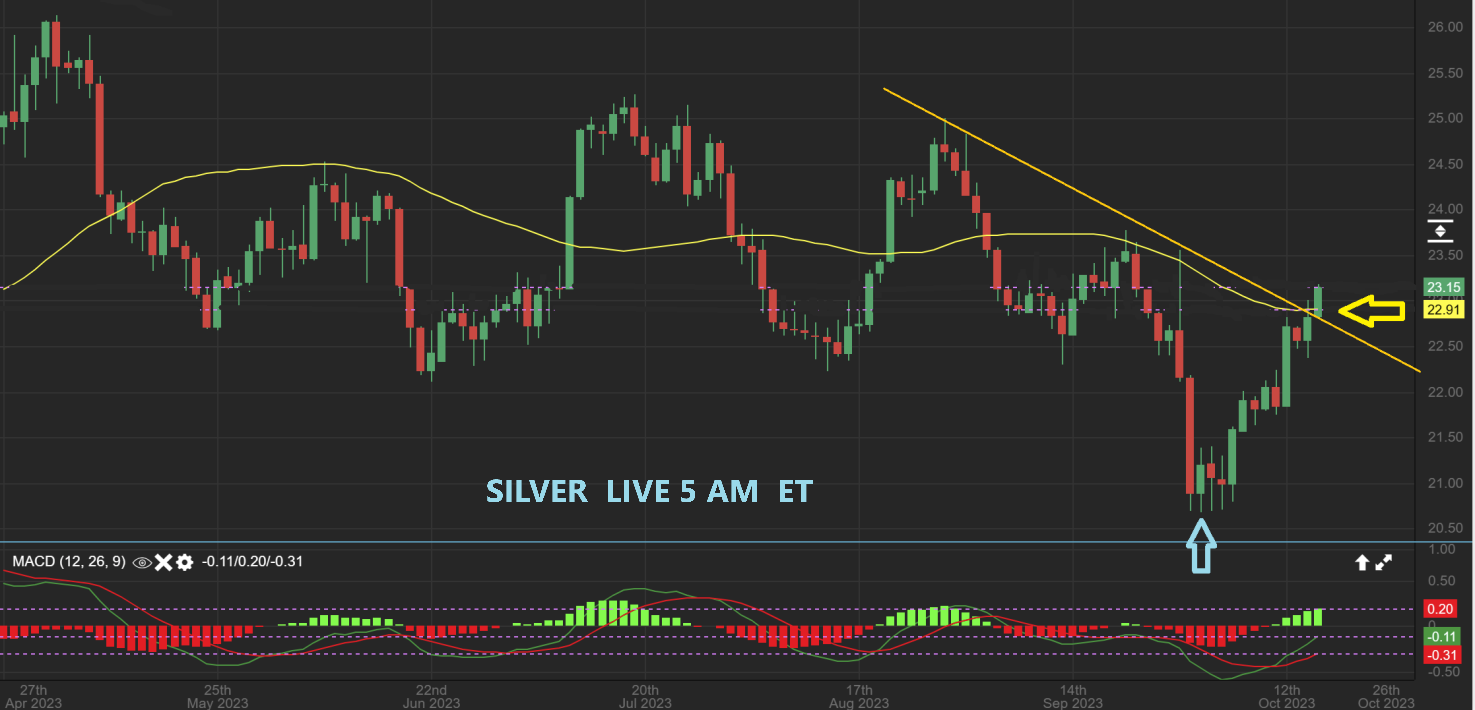
SILVER LIVE 5 am ET – We have Silver breaking out this morning too. This move is not allowing people to buy the dips, because the dips are just ‘pauses’ so far, but Silver stocks have been pointed out as bullish set ups despite the lagging. They can quickly catch up to Gold stocks.
.
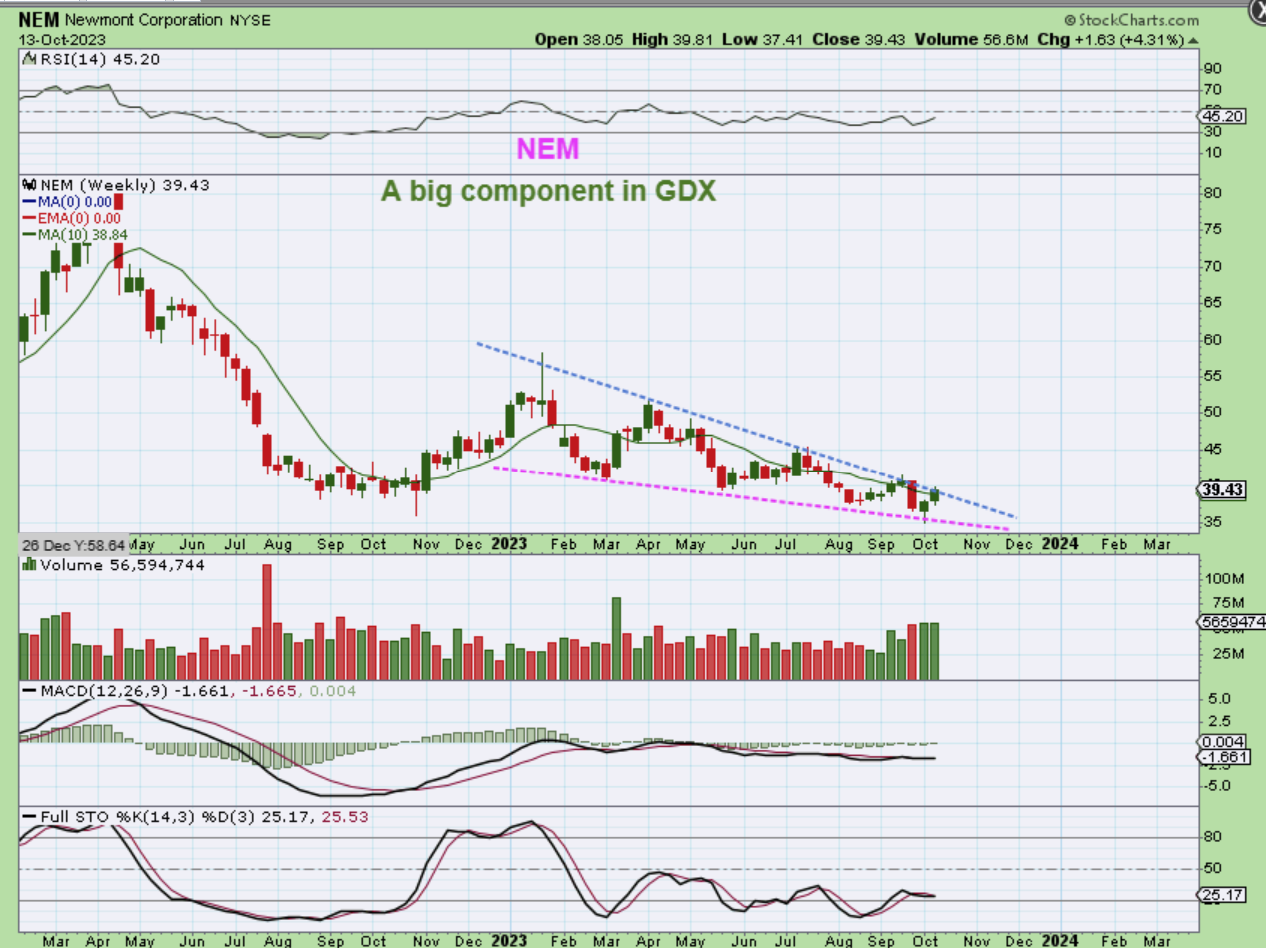
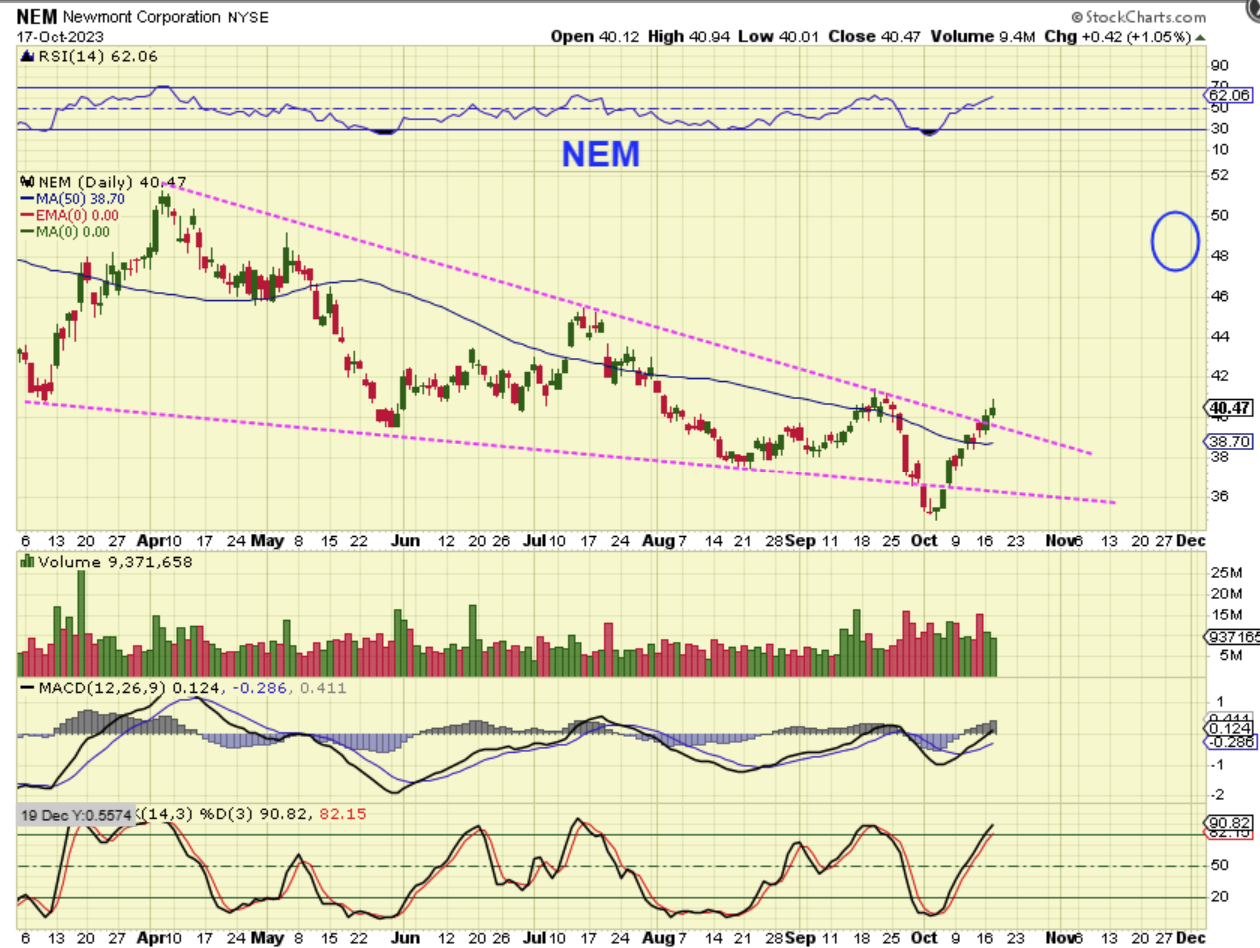
THE GDX is leading the way, because it already broke out. In the weekend report I mentioned that GDX was bullish and that NEM, which is a major component of GDX, looked ready to break out.
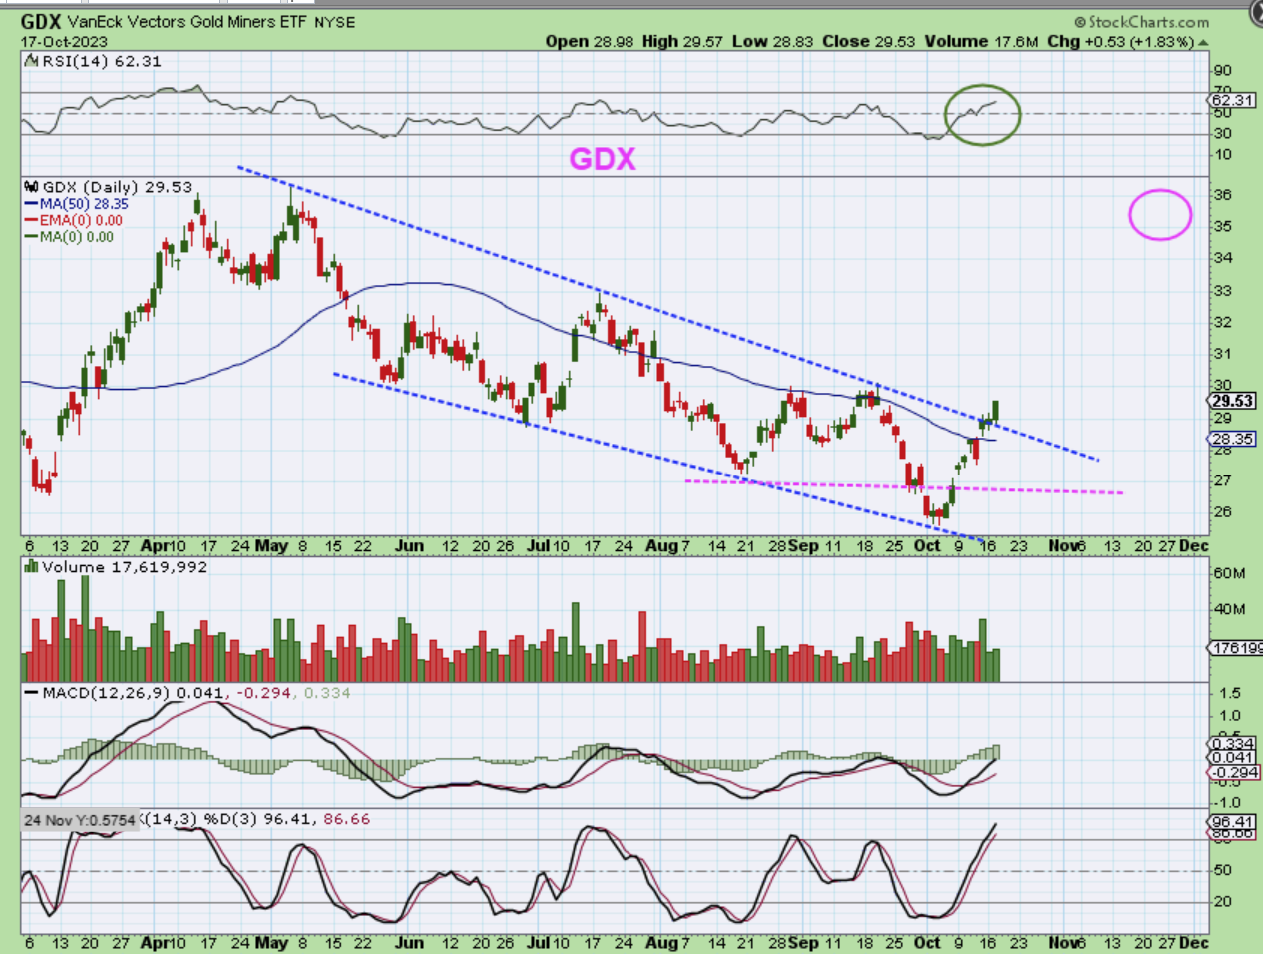
.
Yesterday I mentioned again that The GDX was bullish and that NEM, which is a major component of GDX, looked ready to break out.
.
REMINDER: IN THE WEEKEND REPORT I MENTIONED NEM AS ONE TO WATCH:
.
NEM WEEKLY -Newmont & Barrick are a big part of the GDX and to be honest, they are still at the lows and are just now starting to get going. We made Excellent gains on HMY, GFI, AU, etc, but now some of the other Miners look ready to go higher and push GDX up along with it. Newmont traded at $80 last year.
.
NEM broke out this week and with Gold breaking higher live this morning, I would expect even more follow through.
.
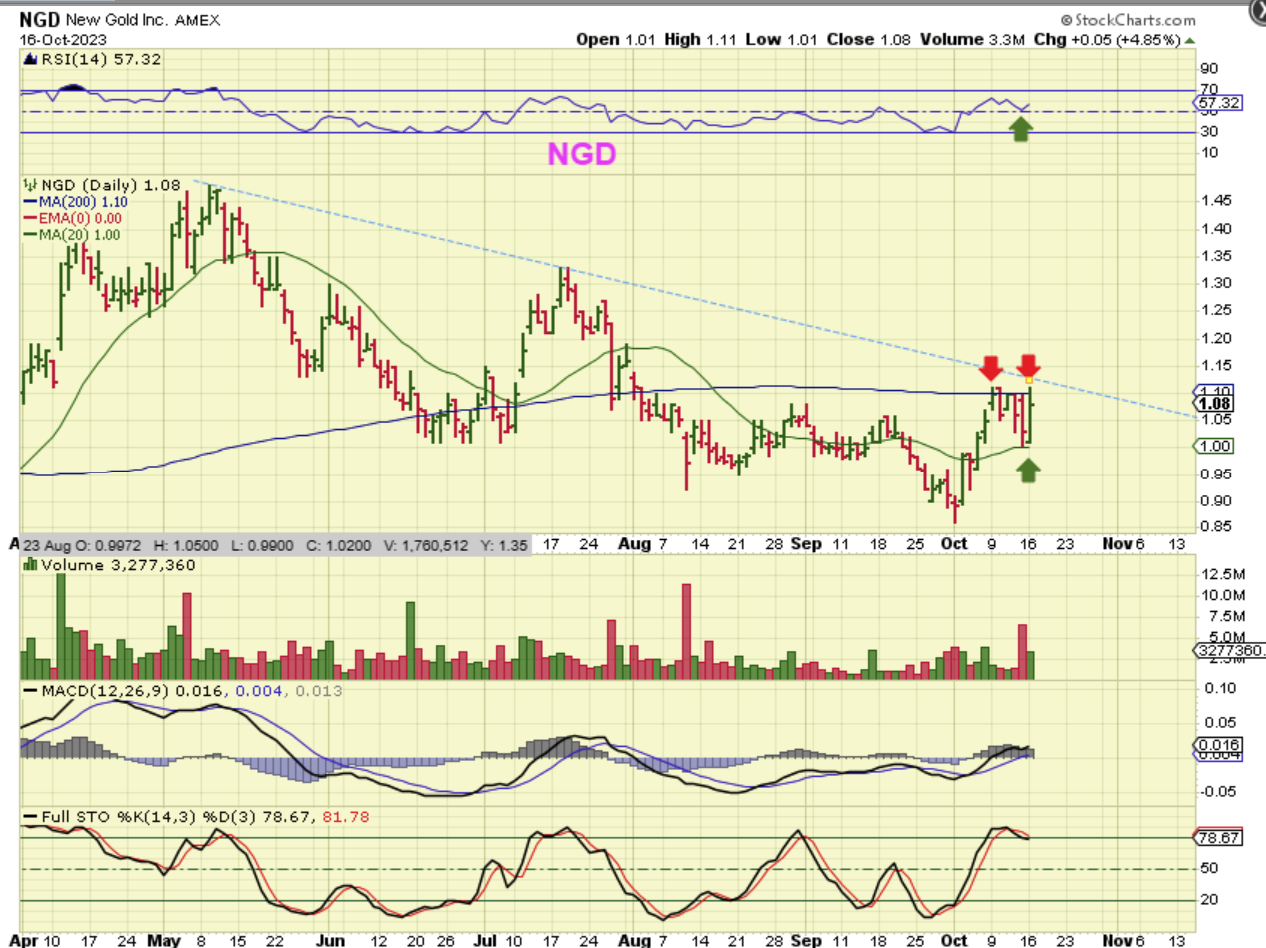
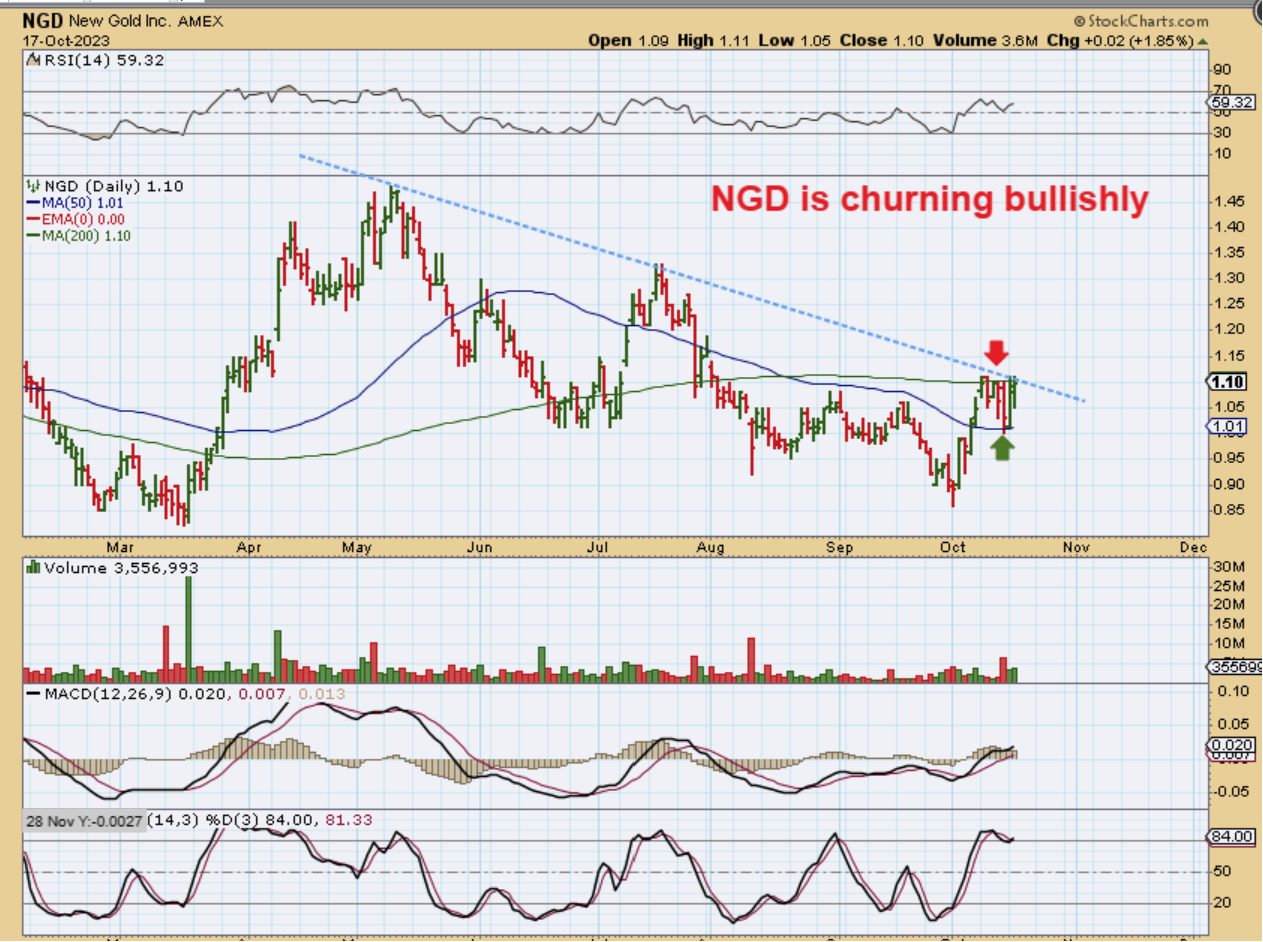
I mentioned that NGD was pushing on resistance too. Did it break out?
.
NGD did not break out, but with Gold breaking out this morning, we may see NGD break out too. This may be one to watch today.
.
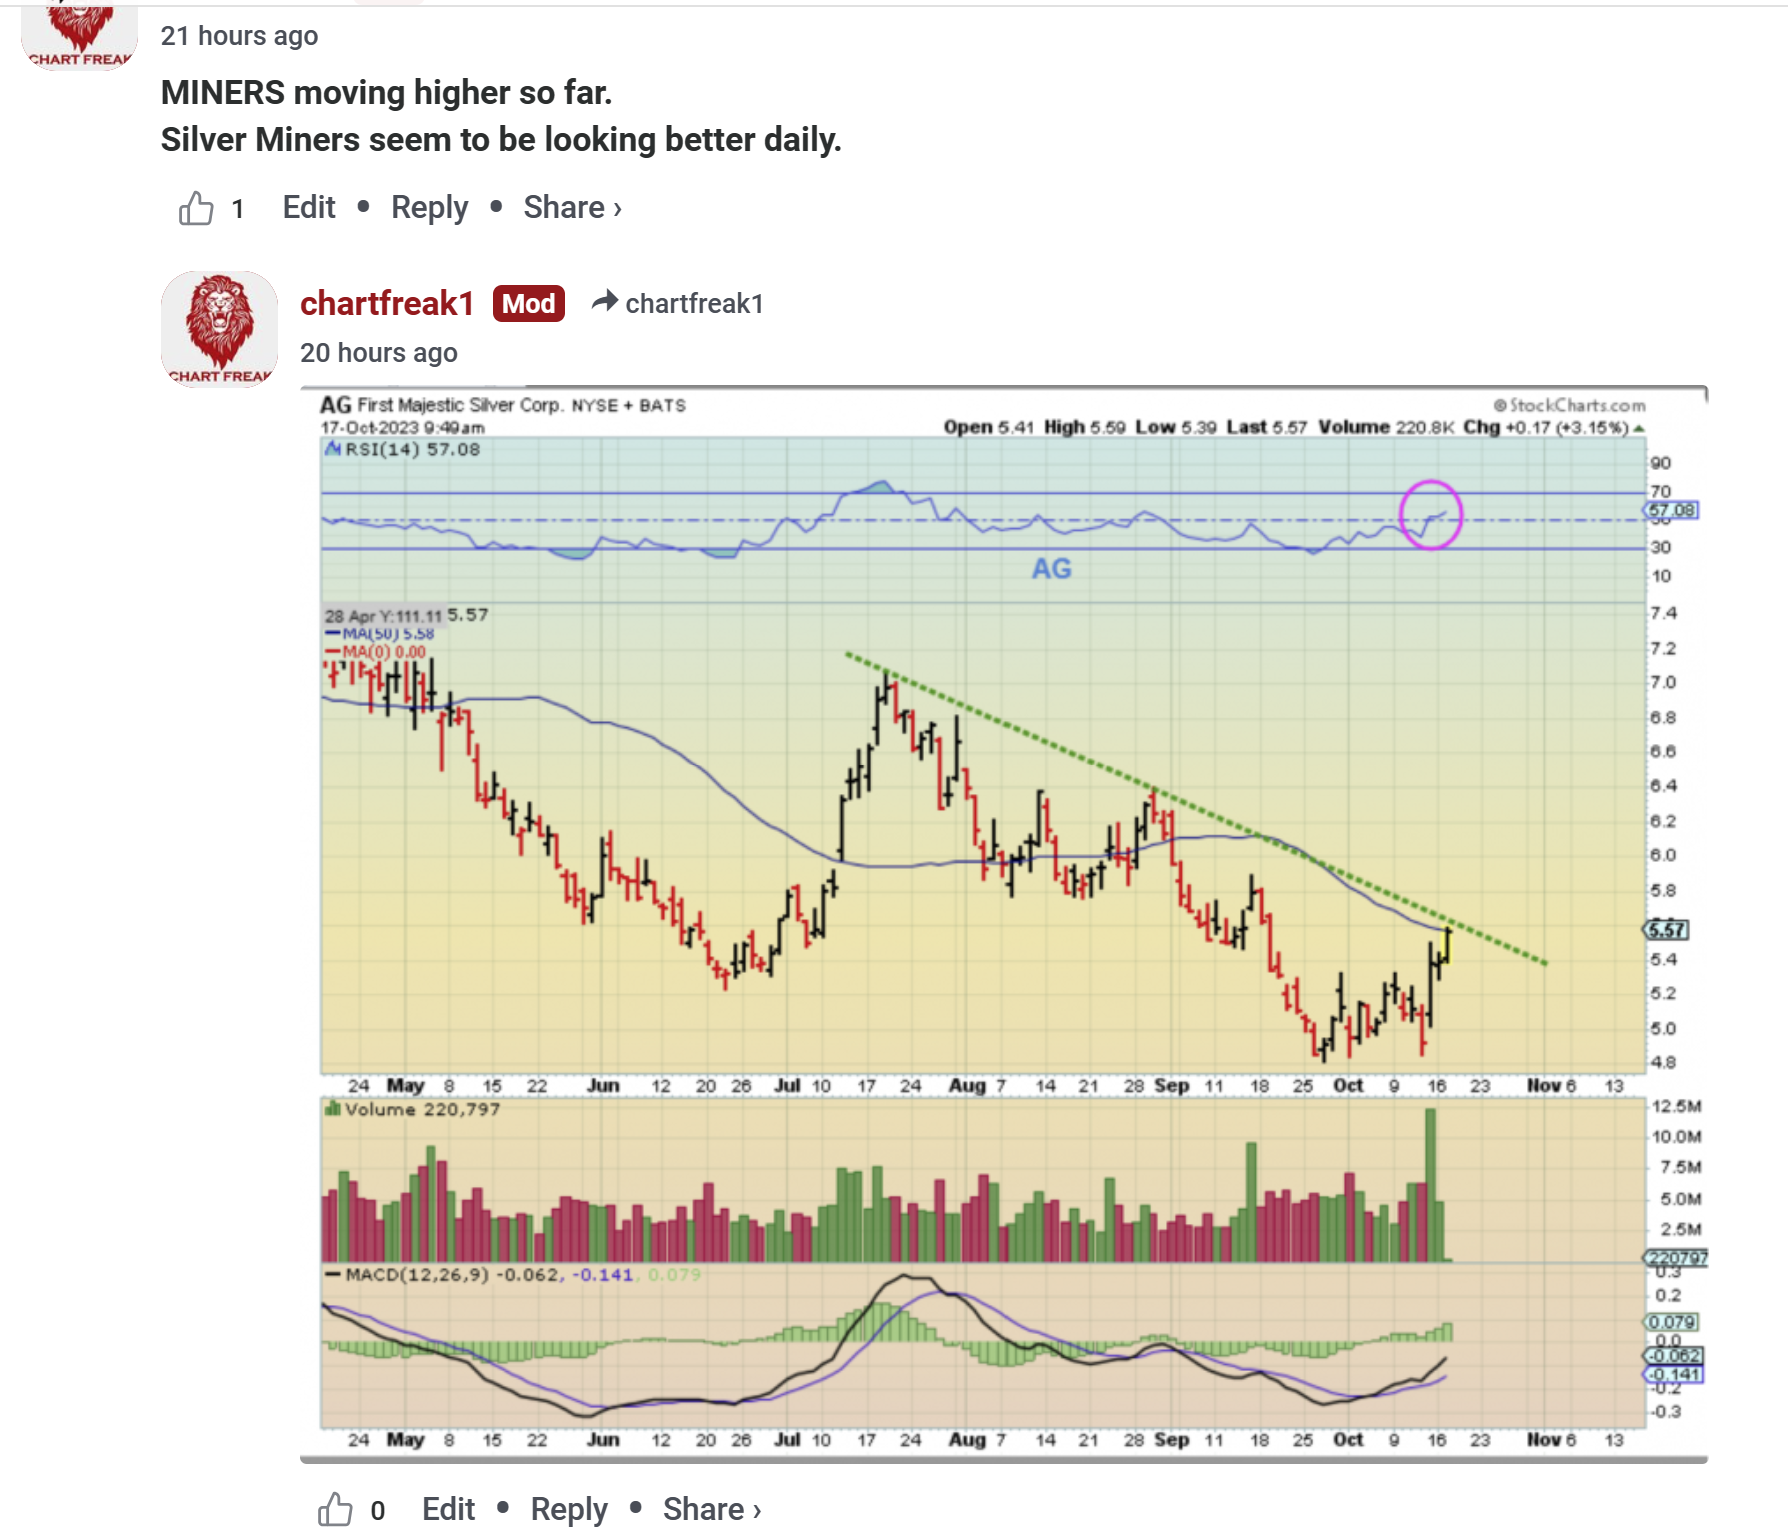
I have been pointing out AG as a Silver stock that I like as a ‘lagger’. I am thinking that pretty soon, these will no longer be laggers and that they’ll play catch up, so I pointed out the possibility of a breakout yesterday right after the open using this chart.
AG was at the 50sma & a downtrend line…
.
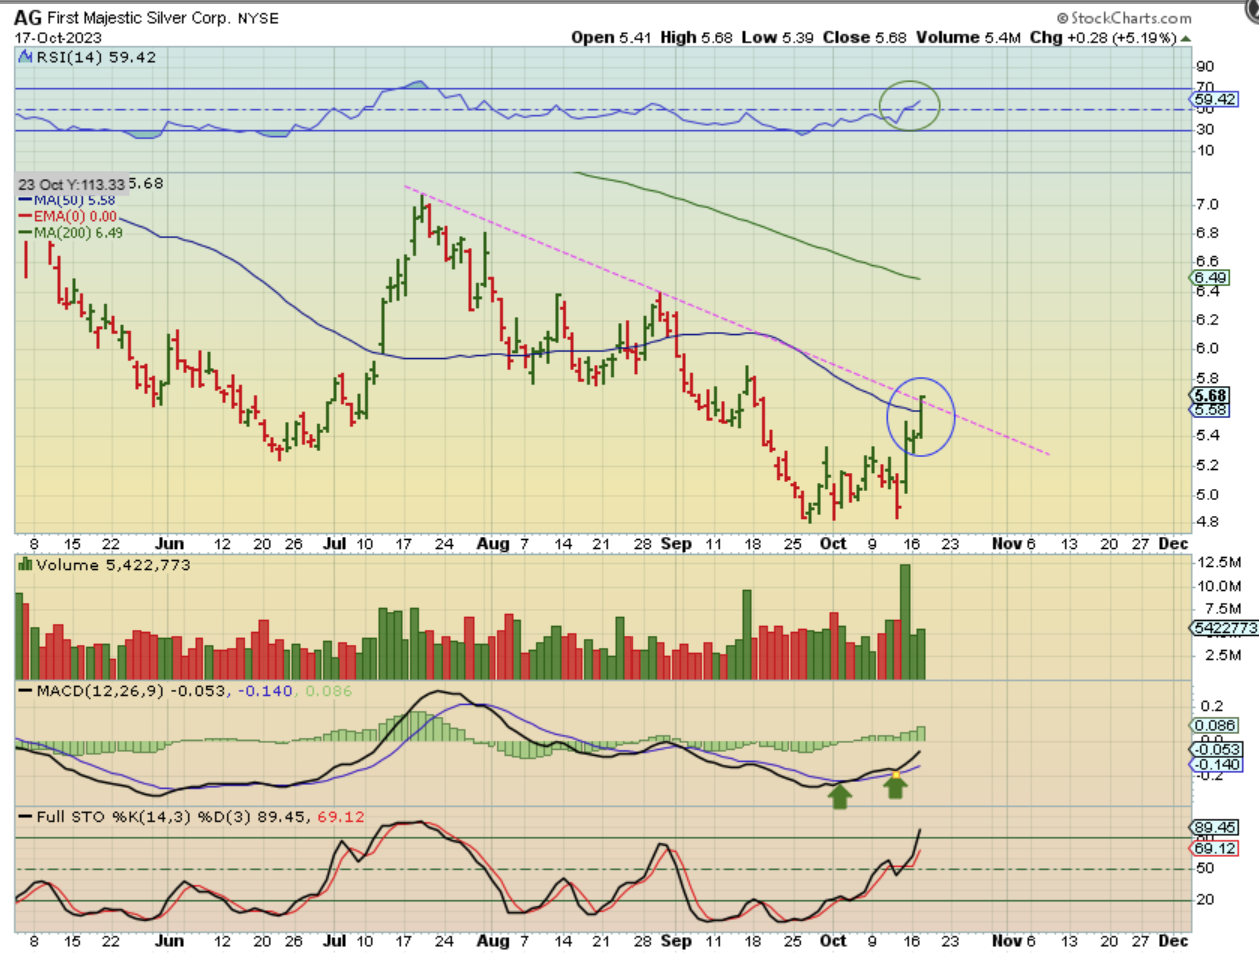
AG broke out yesterday.
.
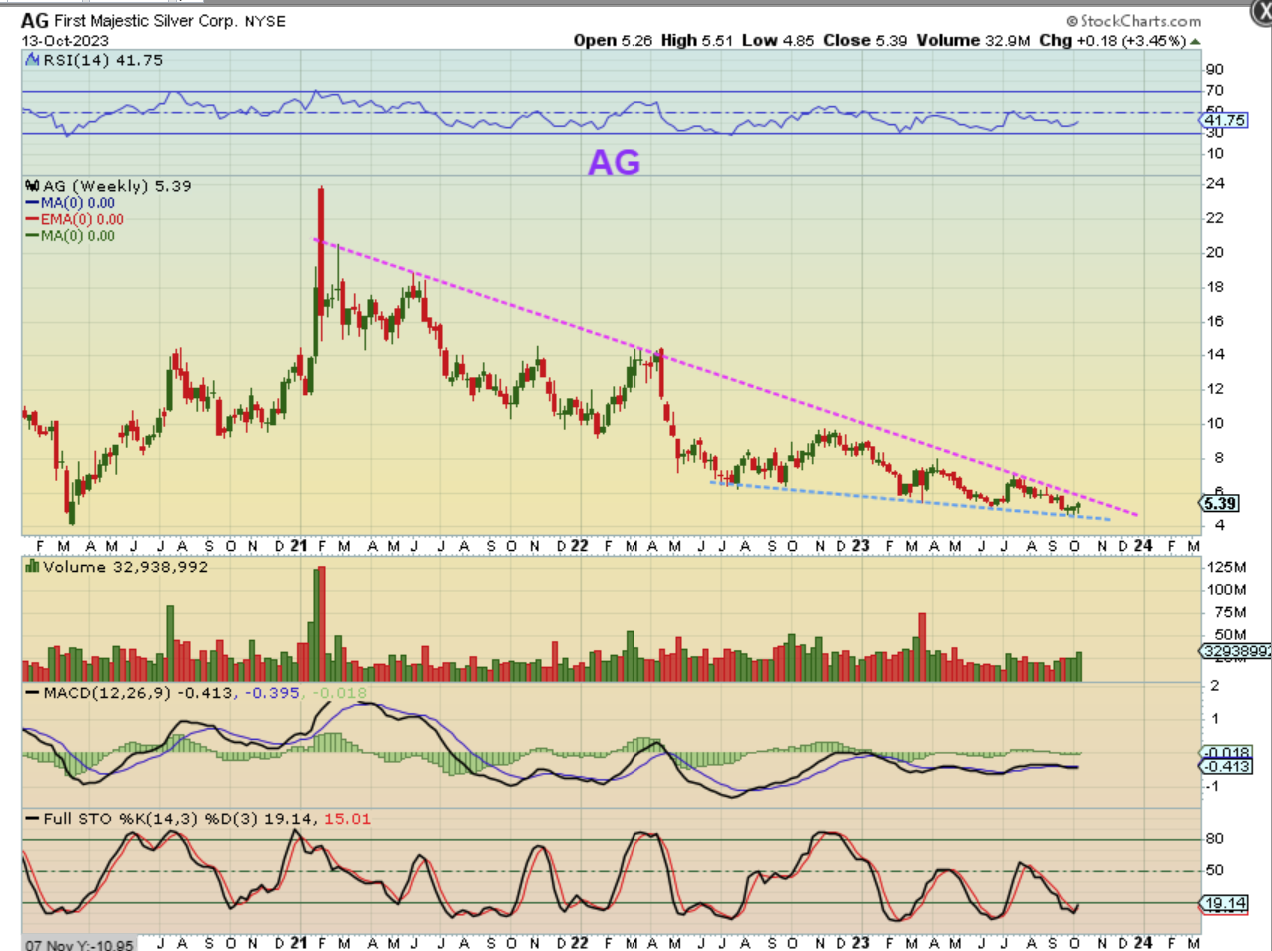
I had also pointed out this bullish wedge in the weekend report, which breaks out over $6. I said…
.
Here we see that AG is forming the same wedge. I know that these should be much higher already, but after seeing CDE & HL put in 14% for no apparent reason, I’m beginning to think that the rest may follow.
.
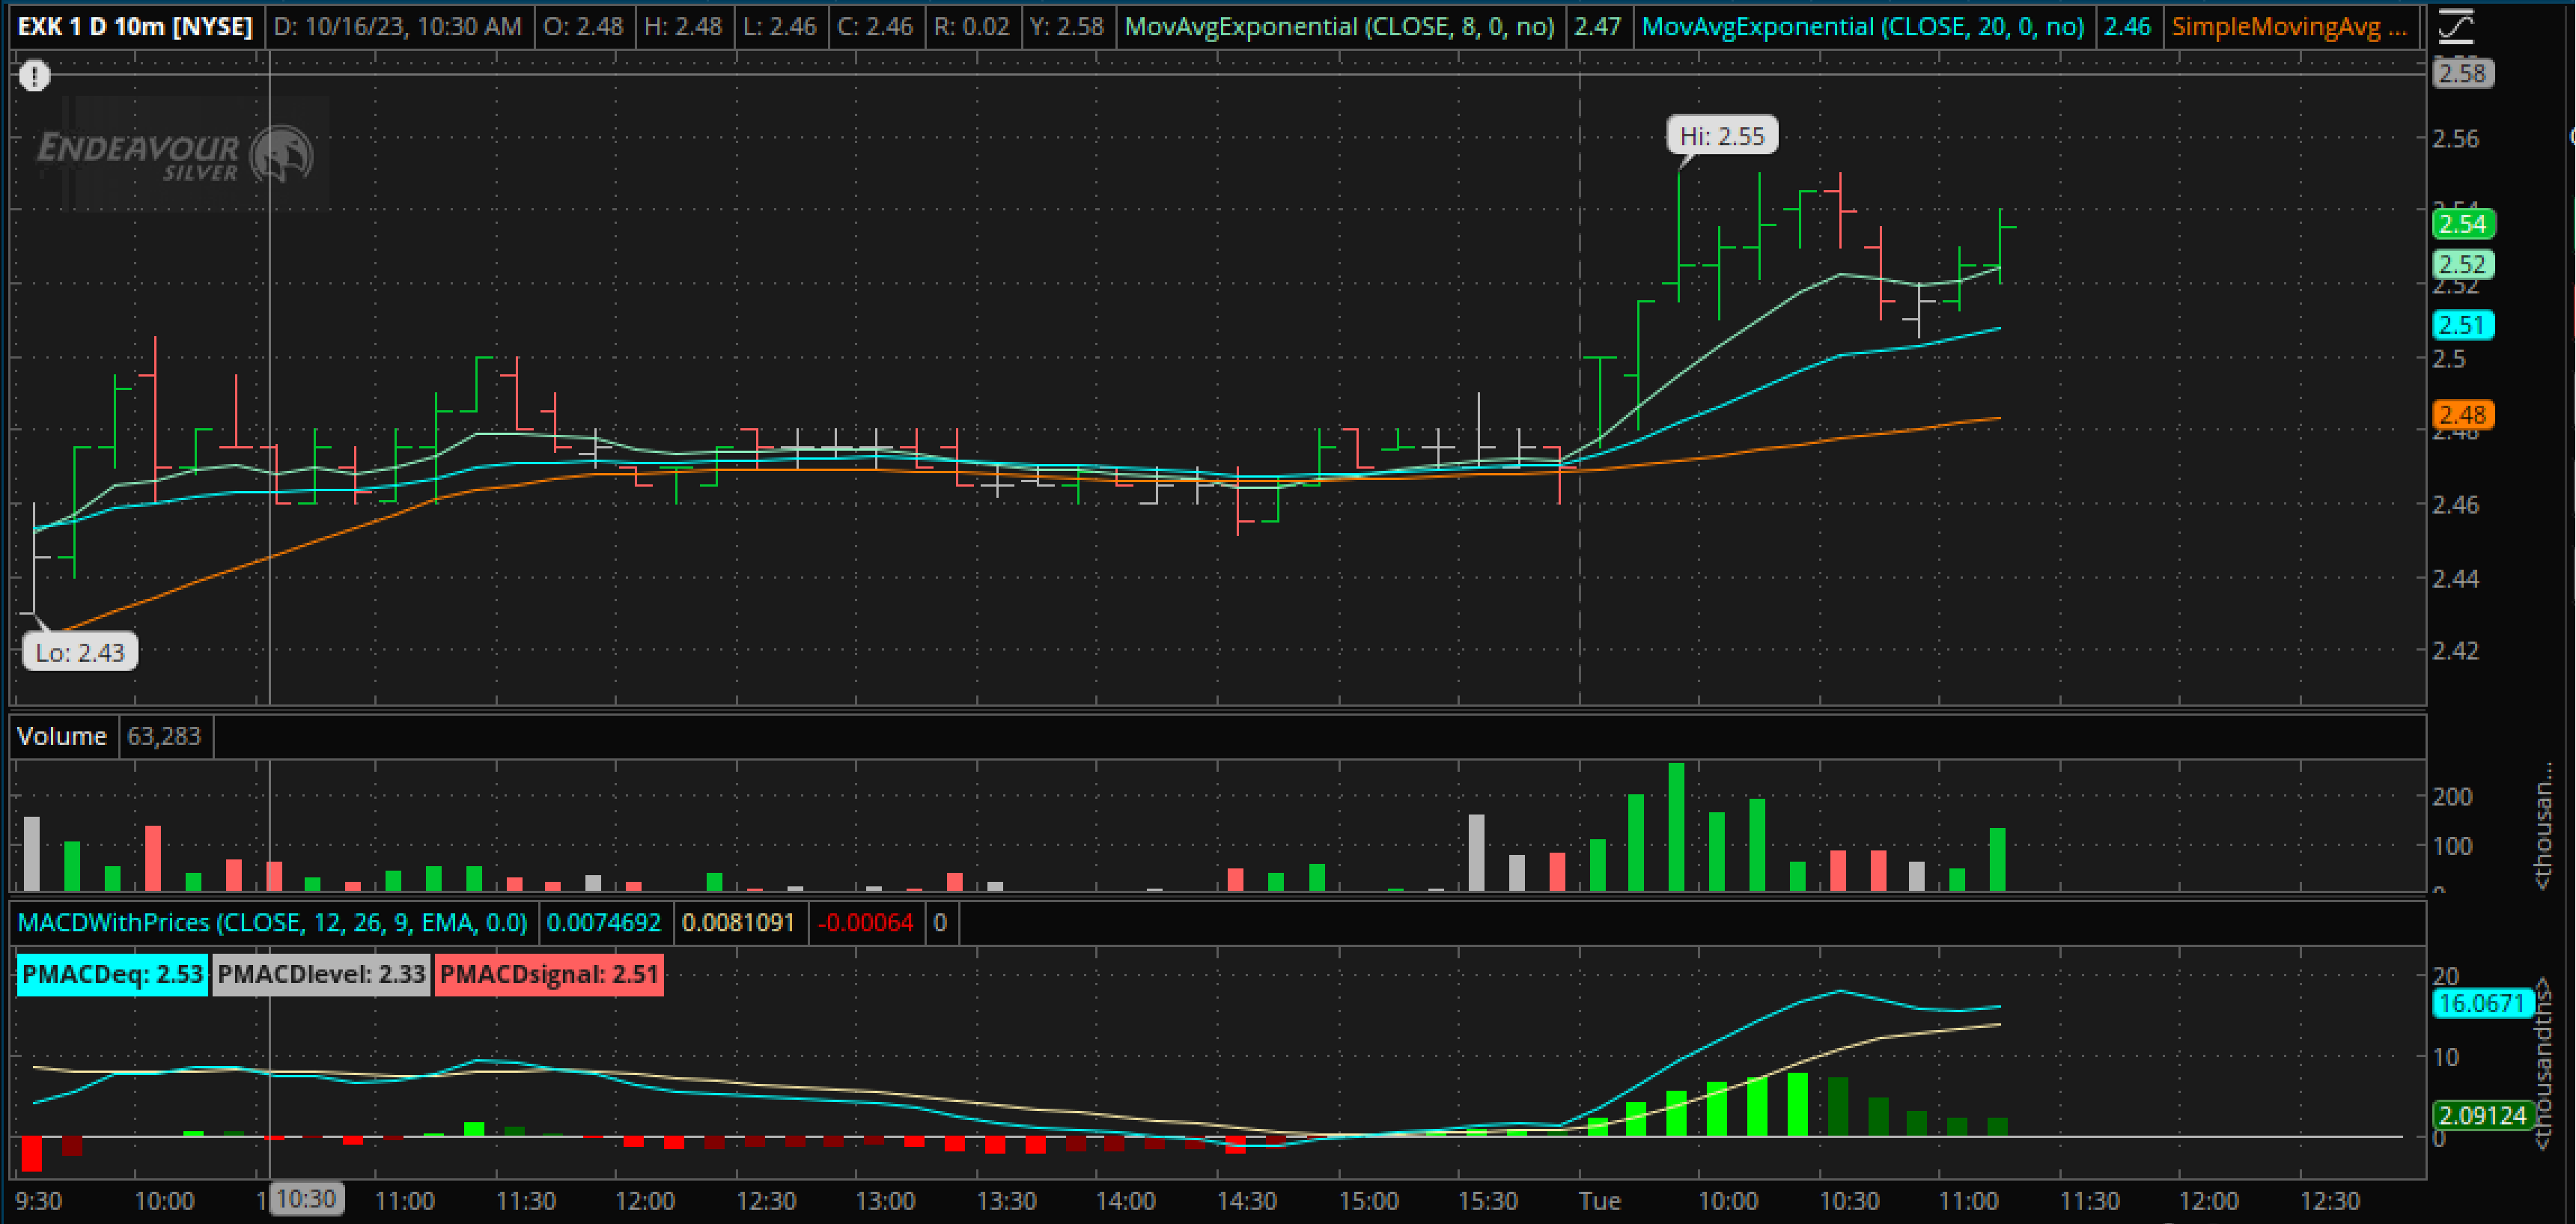
EXK INTRADAY – Yesterday in the commenting area, I was showing the ‘midday swoon’ that we often see. These pull back to an intraday support and then find buyers. Knowing this can help people to see that the sell down midday is not a reason to sell.
.
PROGRESS REPORT:
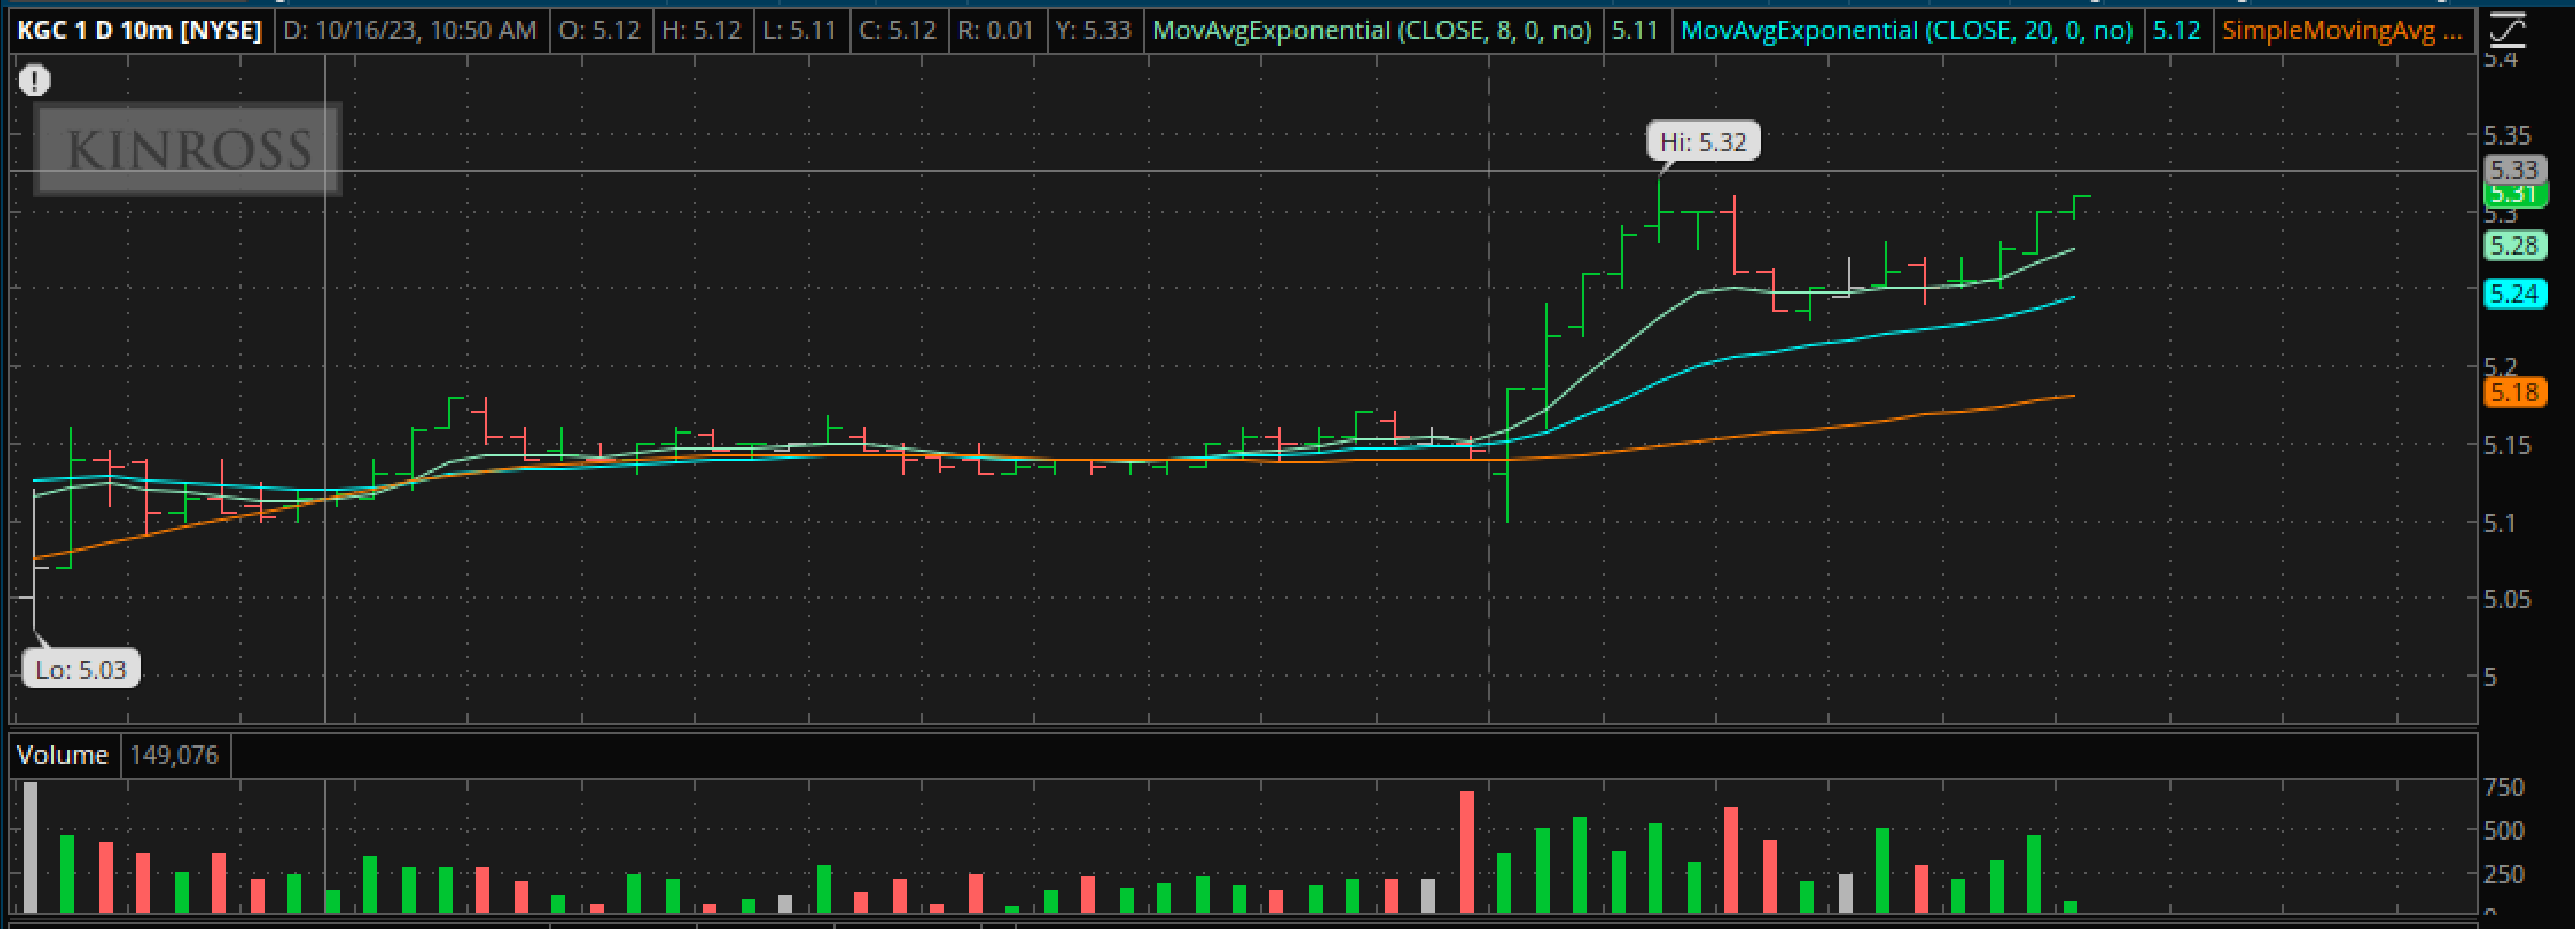
After HMY, GFI, AU ran higher, KGC was also mentioned as a ‘shakeout’ buy in early October as it moved above the 10sma. Here we saw some follow through…
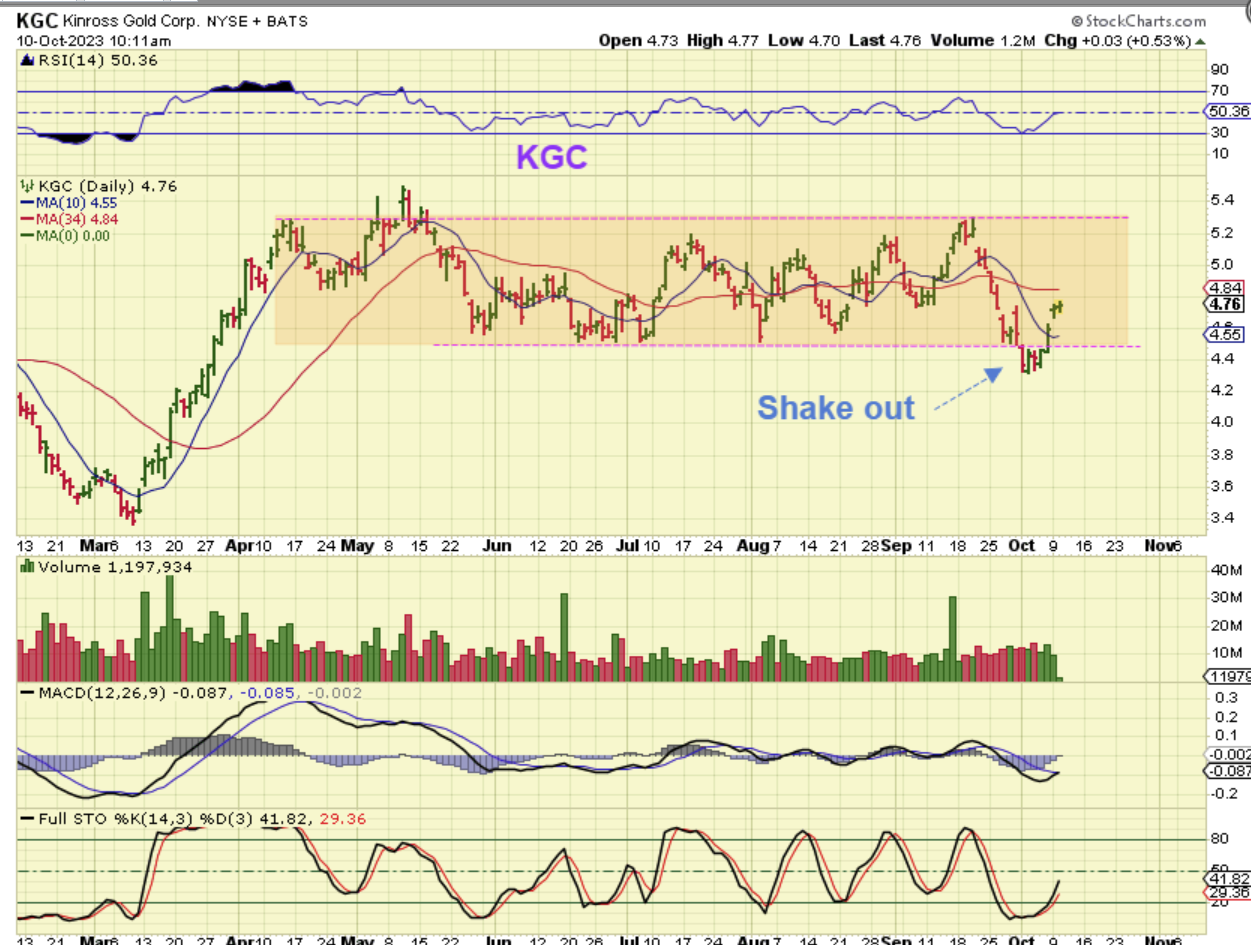
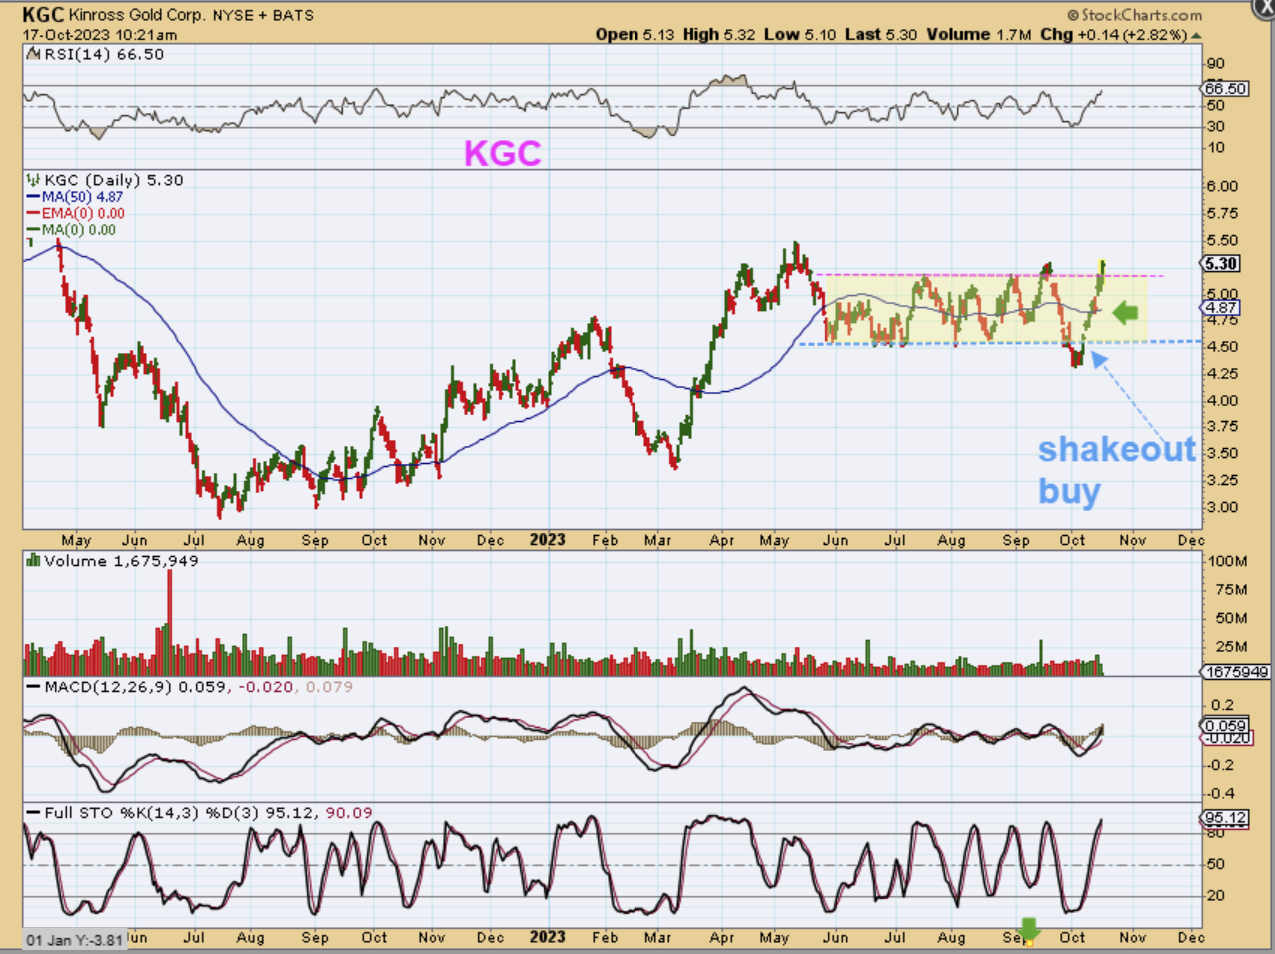
KGC then broke above the 50sma as a bullish entry, especially when it back-tested it on that same day. You can see that I had been highlighting the consolidation area too…
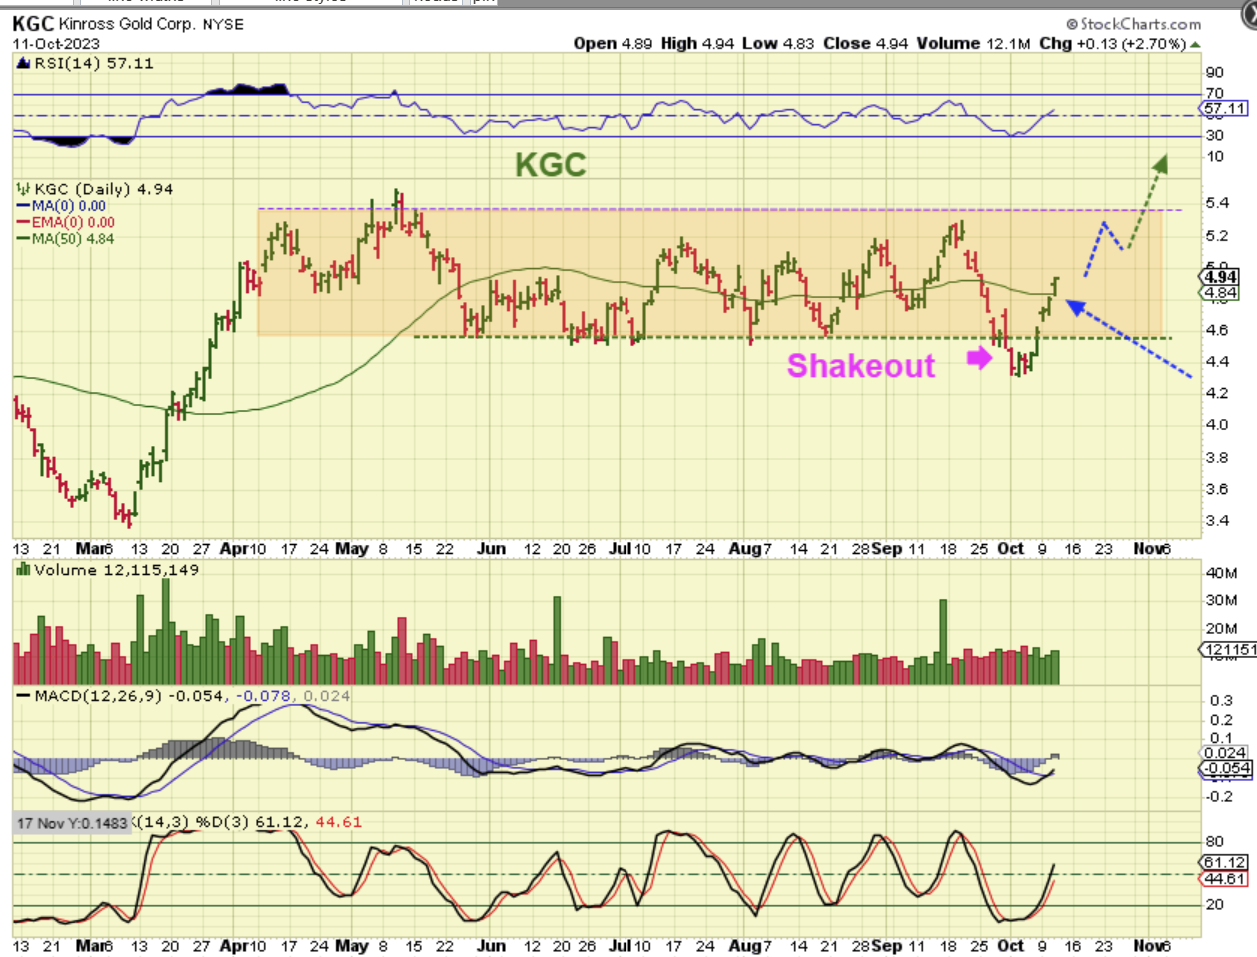
KGC was now breaking out of that consolidation area yesterday, so I posted tis in the comments area as a progress report. When a stock consolidates sideways for months, it forms a ‘Box Pattern’ and a breakout can produce a nice run over time. I would not sell KGC if you bought it at any of the prior points, because this break out may signal a ‘buy’ to technical traders too.
.
We have been seeing some very nice progress and very nice gains in the precious metals sector, since the ICL Buy week over a week ago. There have not been many pullbacks that would allow those on the sidelines in, and today it looks like that game continues after a slight pause earlier this week. This morning (well, so far as of 6:30 am) we have Gold and Silver breaking out above their overhead resistance points. Your basket of Miners should be making nice gains, and if it is still a bit too small, you may want to grab a couple of Silver stocks that are still relatively close to the lows. They look to be attracting buyers now too and since we are only on day 8 of the very first daily cycle, this could have months to run. Months? Yes. It won’t be straight up all of the time, it may get quite choppy at times, but we should see 2 or 3 daily cycles higher and each could take a month, so we are talking about a rally into the end of the year as a possibility. Got to be in it- to win it! Enjoy your Wednesday trading!
.

