
OCTOBER 15th – WEEKEND REPORT
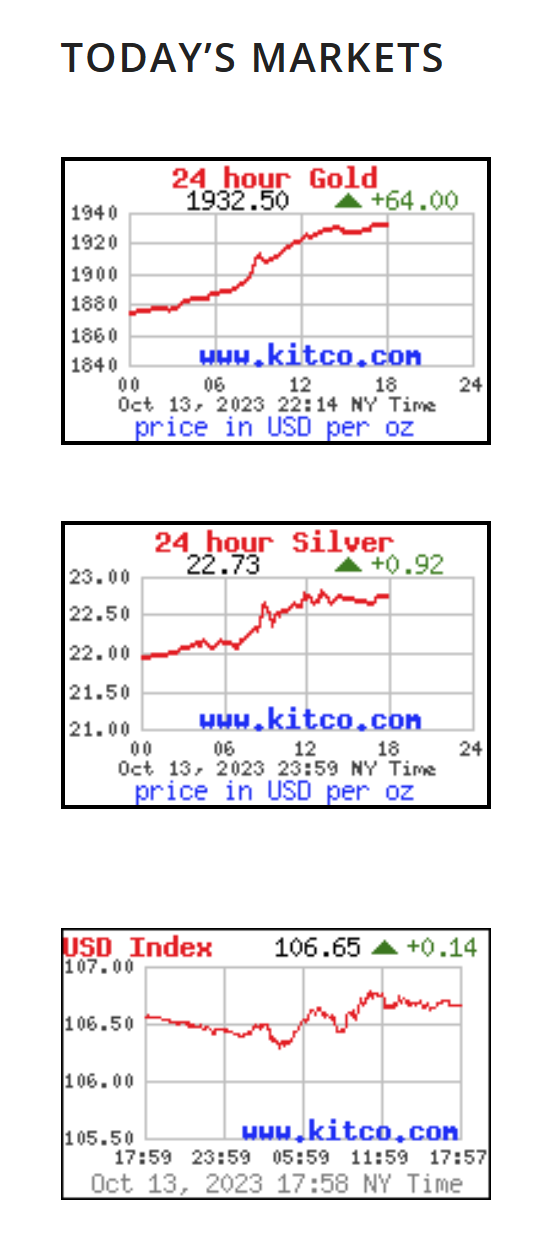
LET’s START WITH A BEAUTIFUL CHART! Please take note of the $USD too.
ENOUGH SAID…for now 🙂
.
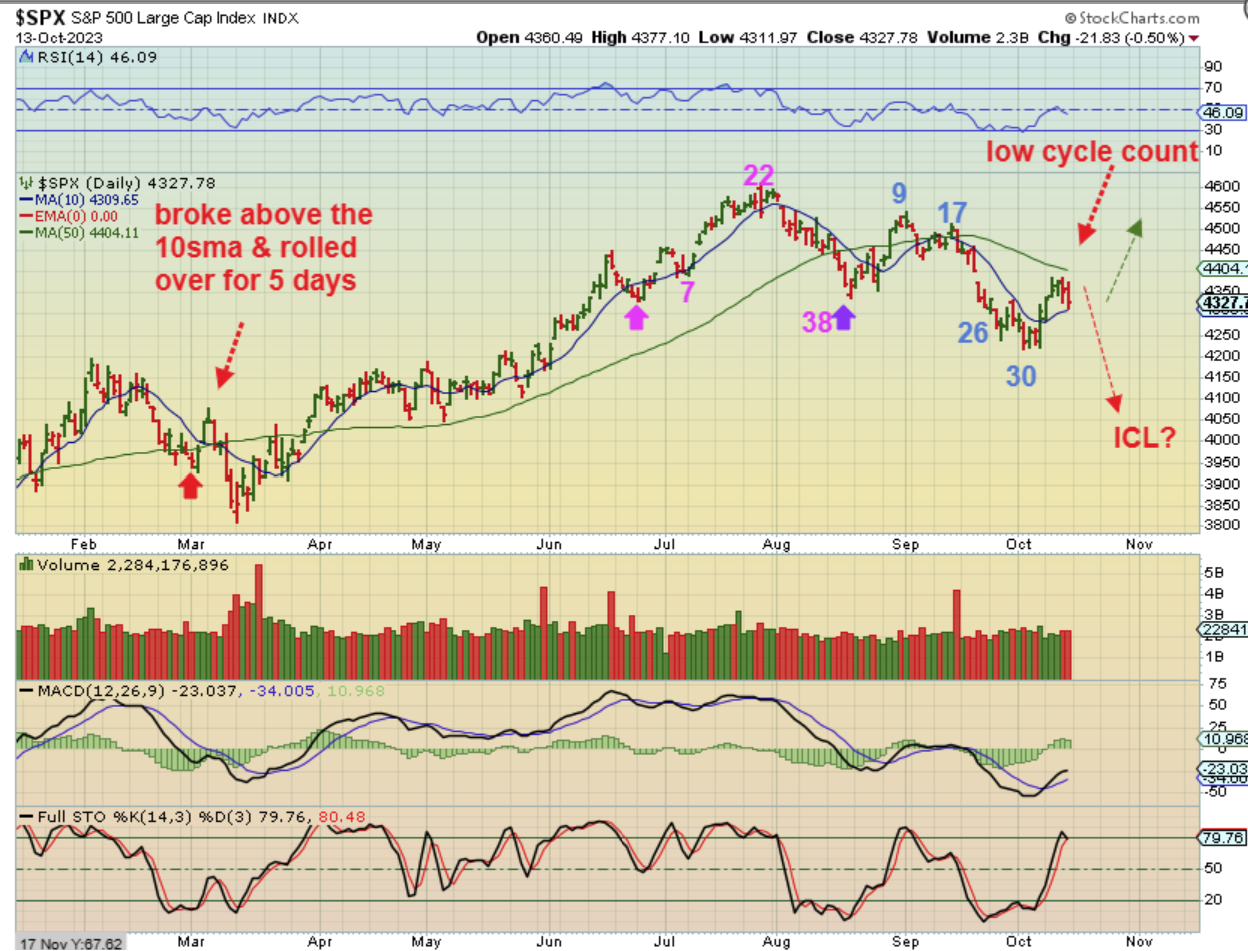
SPX DAILY – I have been mentioning that the lows are in place, however, the cycle count was rather low at day 30 so I have been cautious in the back of my mind (lately they often they run closer to 40-50 days). I also pointed out a false move in March where price rallied above the 10sma and then dropped for 5 days to a new low. That might happen here, so I said to raise stops to the 10sma, and now we are there. You also could have sold Friday to avoid risking a possible gap down Monday. We’ll see what Monday brings next.
..
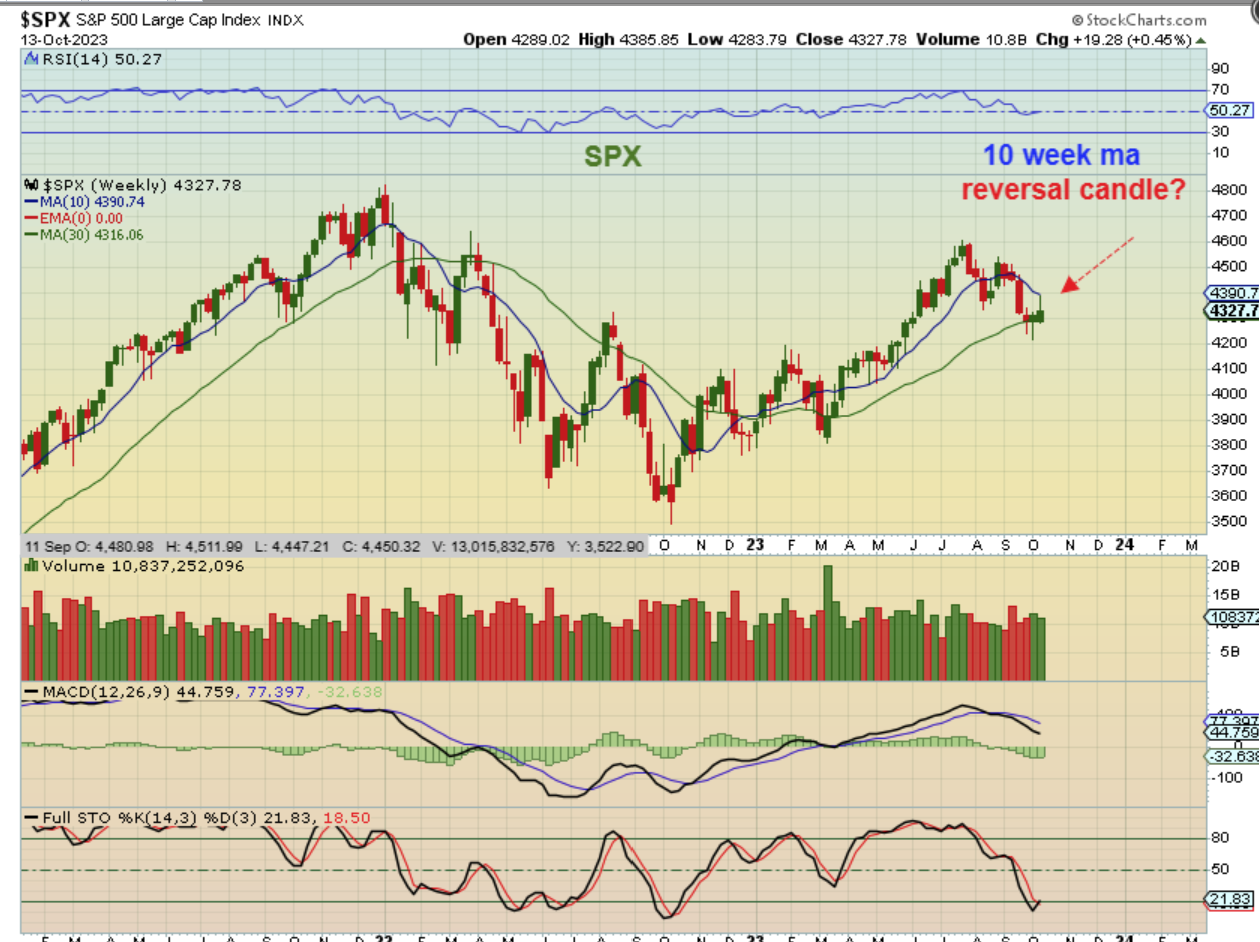
THE SPX WEEKLY has a reversal candle right after tagging the 10 week ma, but it also sits at the 30 week ma and that was also prior support, so we are on the edge. The markets are due for an ICL, they are oversold too, so that may be in place.
.
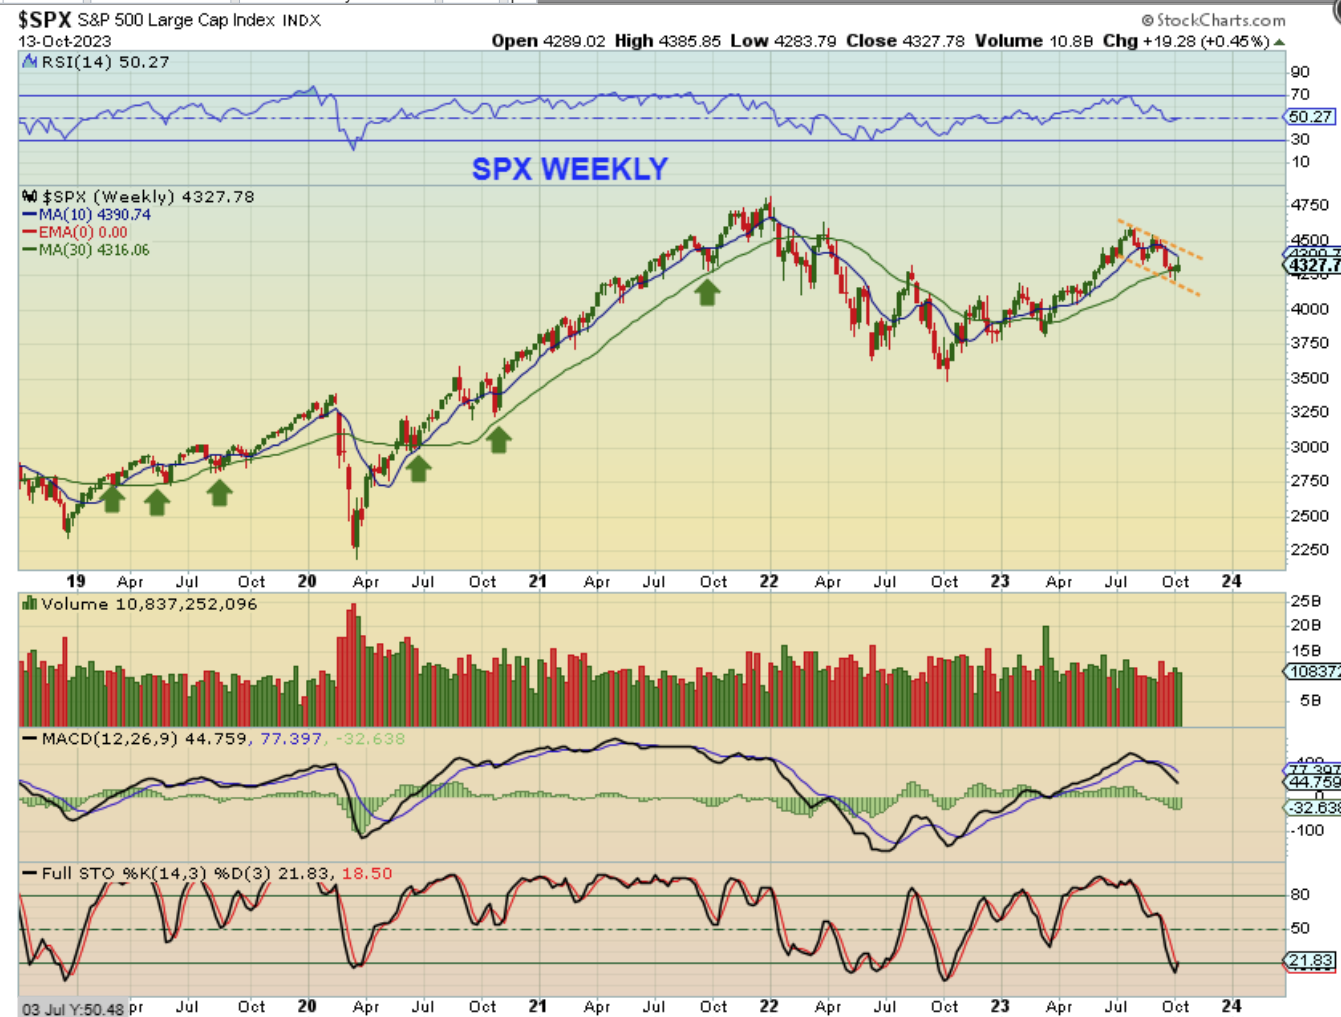
SPX WEEKLY – A drop from here may land on the lower trend line again, but so far it does look like an A-B-C drop into an ICL.
.
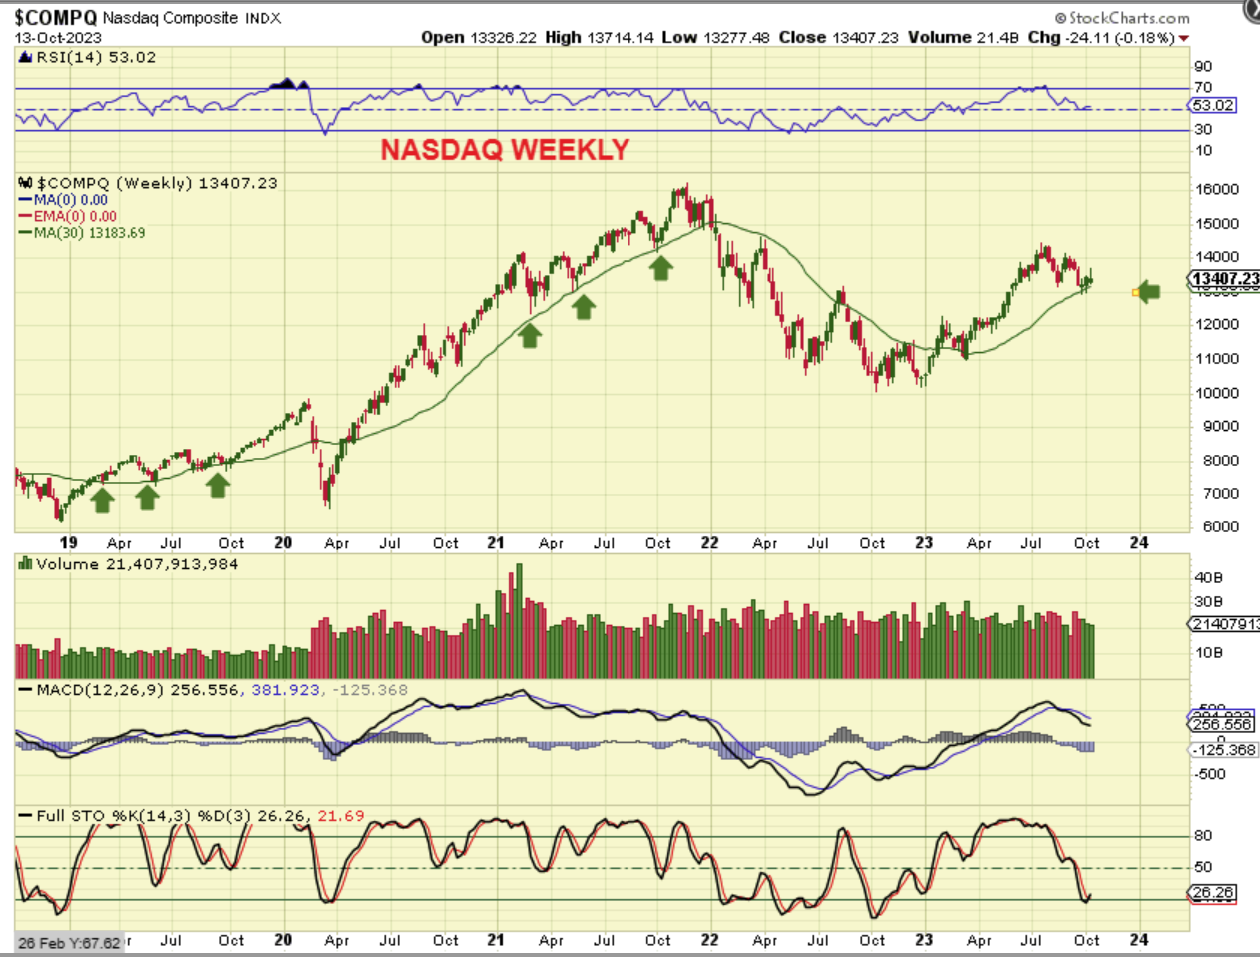
THE NASDAQ WEEKLY has the same characteristics. It looks like an ICL has formed with a choppy low.
.
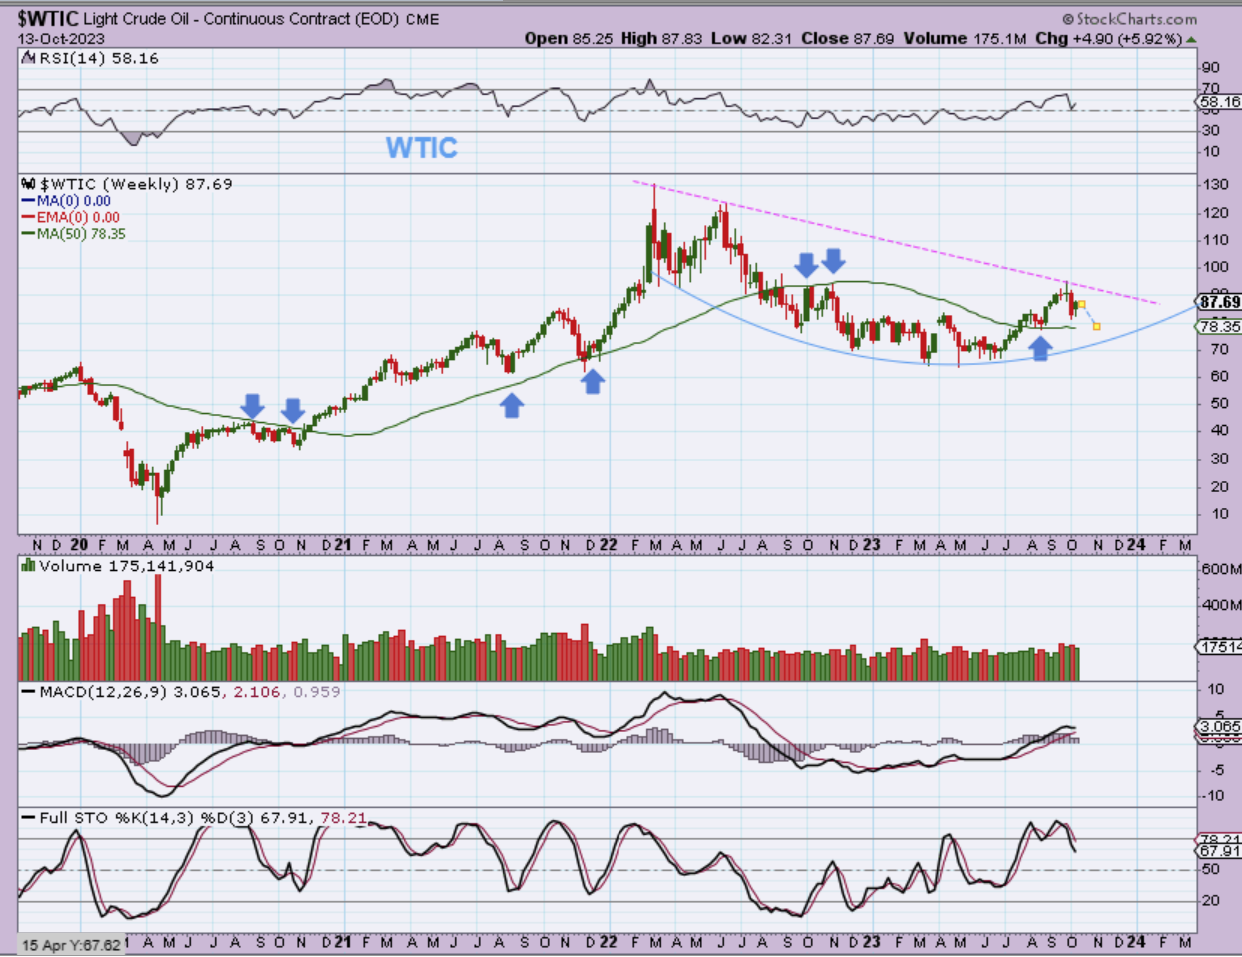
WTIC WEEKLY – I still expect 1 one leg down on Oil, to drop into an ICL. As Oil started to sell off, the war in Israel did cause the selling to pause for now, and Oil stocks actually look like they bottomed first. When Oil drops again for the next leg lower, maybe to the green 50 week ma, Oil stocks may just put in a higher low or consolidate sideways.
.
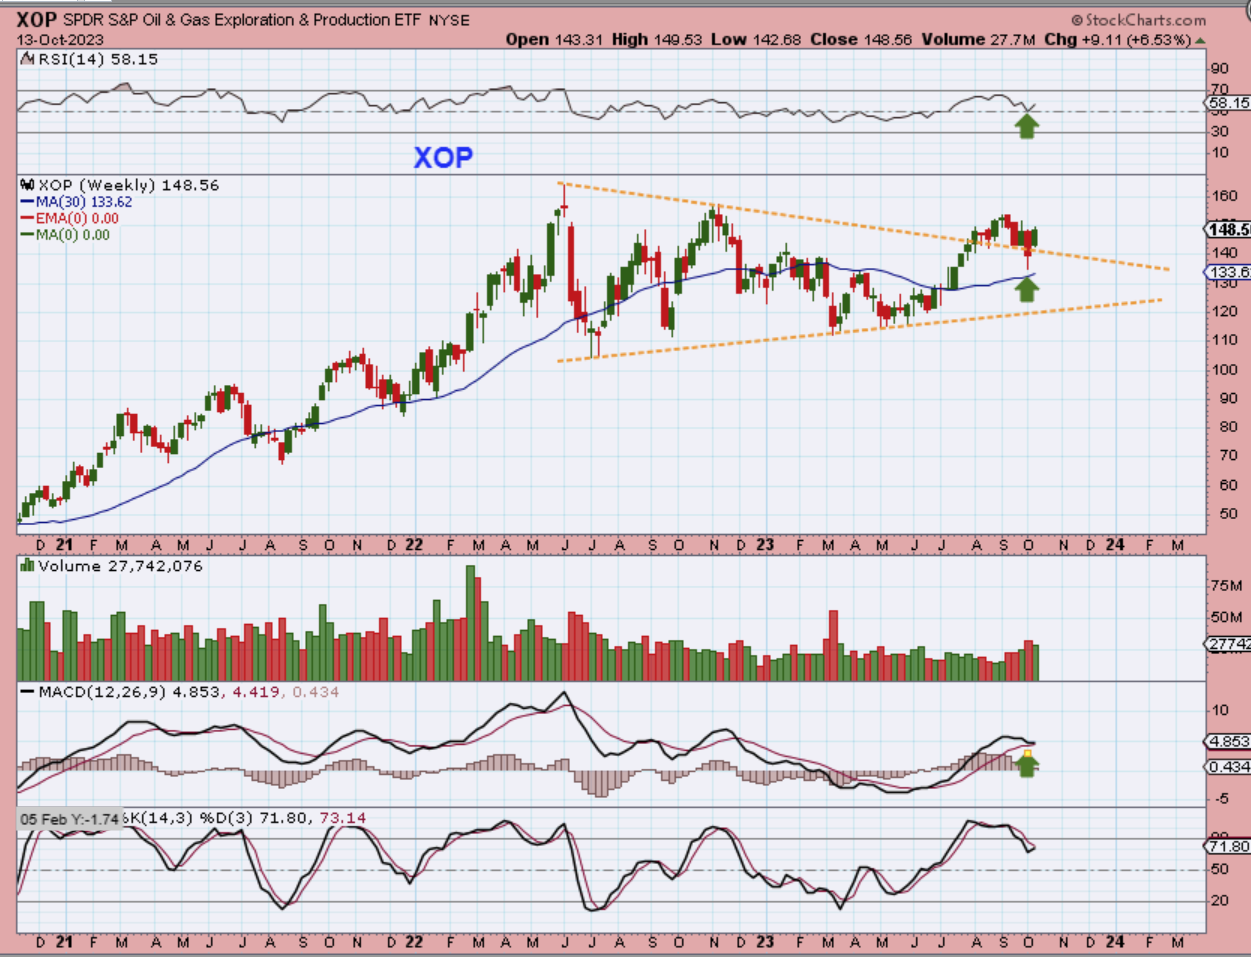
XOP WEEKLY: So like I said, Oil stocks actually look like they bottomed first and a little early, a bit above that 30 week ma. Oil stocks may just continue a bit higher now and then When Oil drops again for the next leg lower they could back test the triangle with a higher low or consolidate sideways.
.
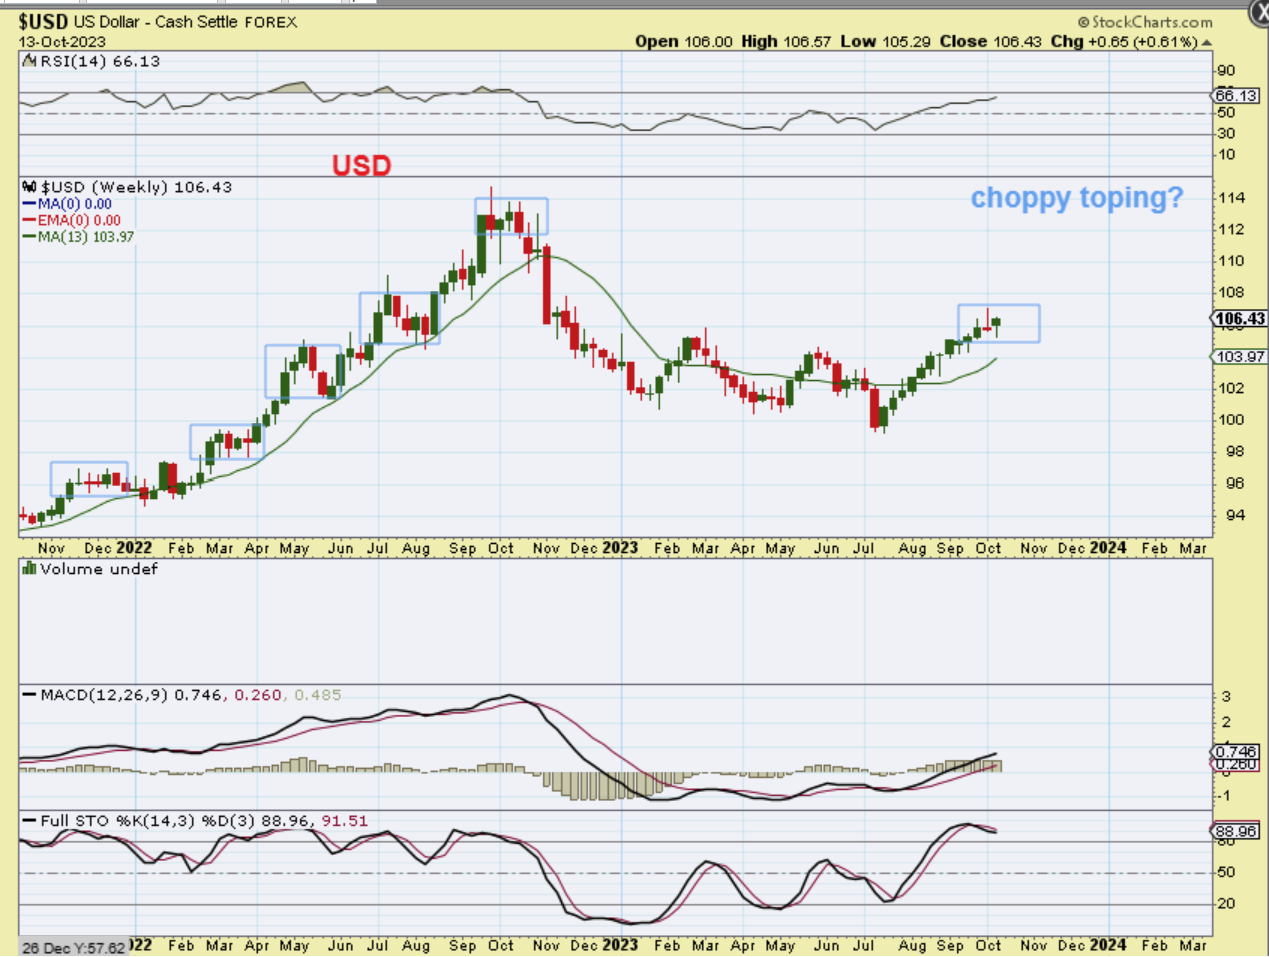
USD WEEKLY – Sorry for the typo that I just noticed on the chart. It should be that the USD may be putting n a choppy top. We saw that big USD reversal on Thursday and it was up a little on Friday. As you saw in the very first chart of this report, the USD was up Friday, But Gold & Silver burst higher anyway.
.
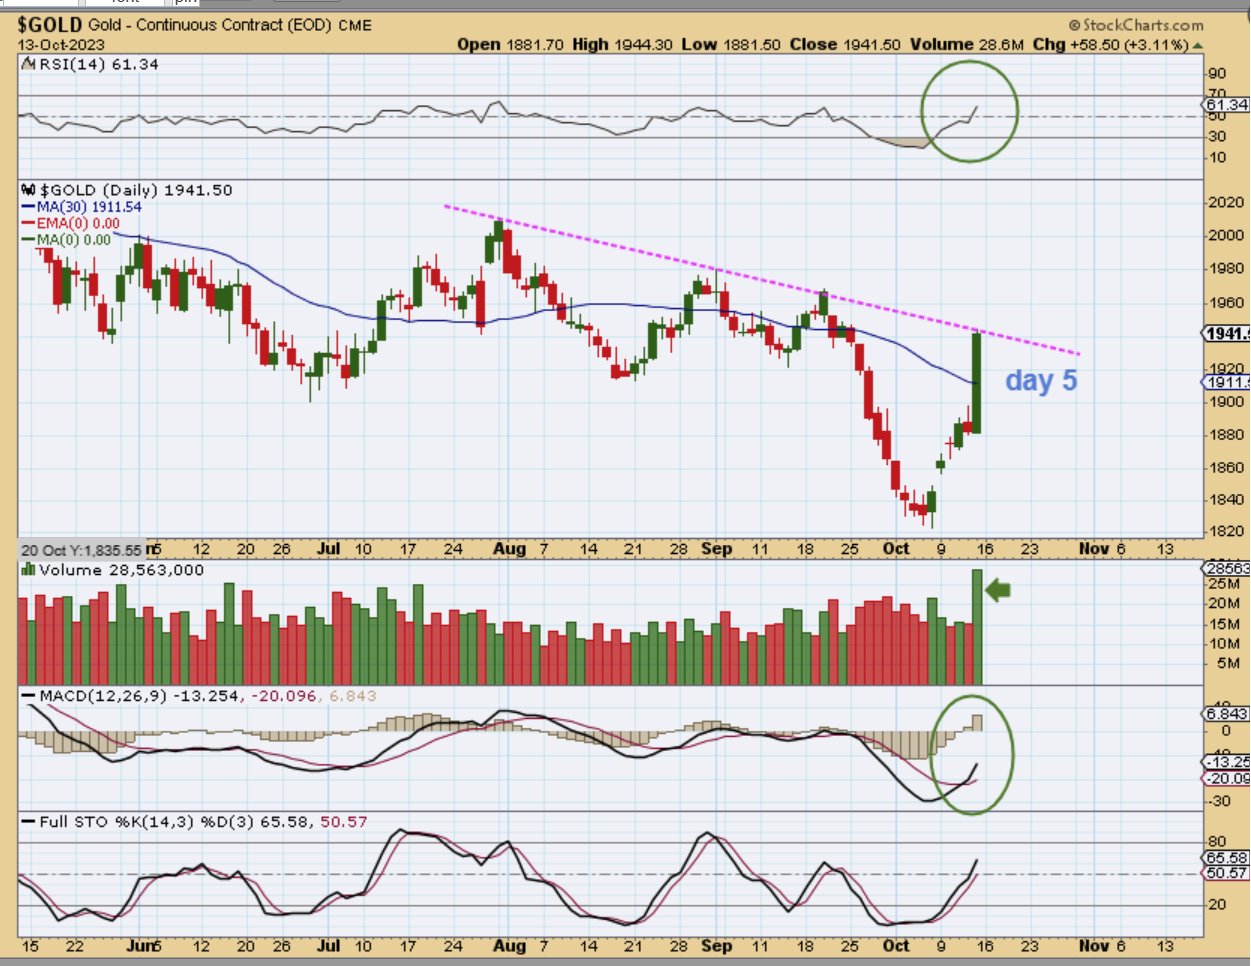
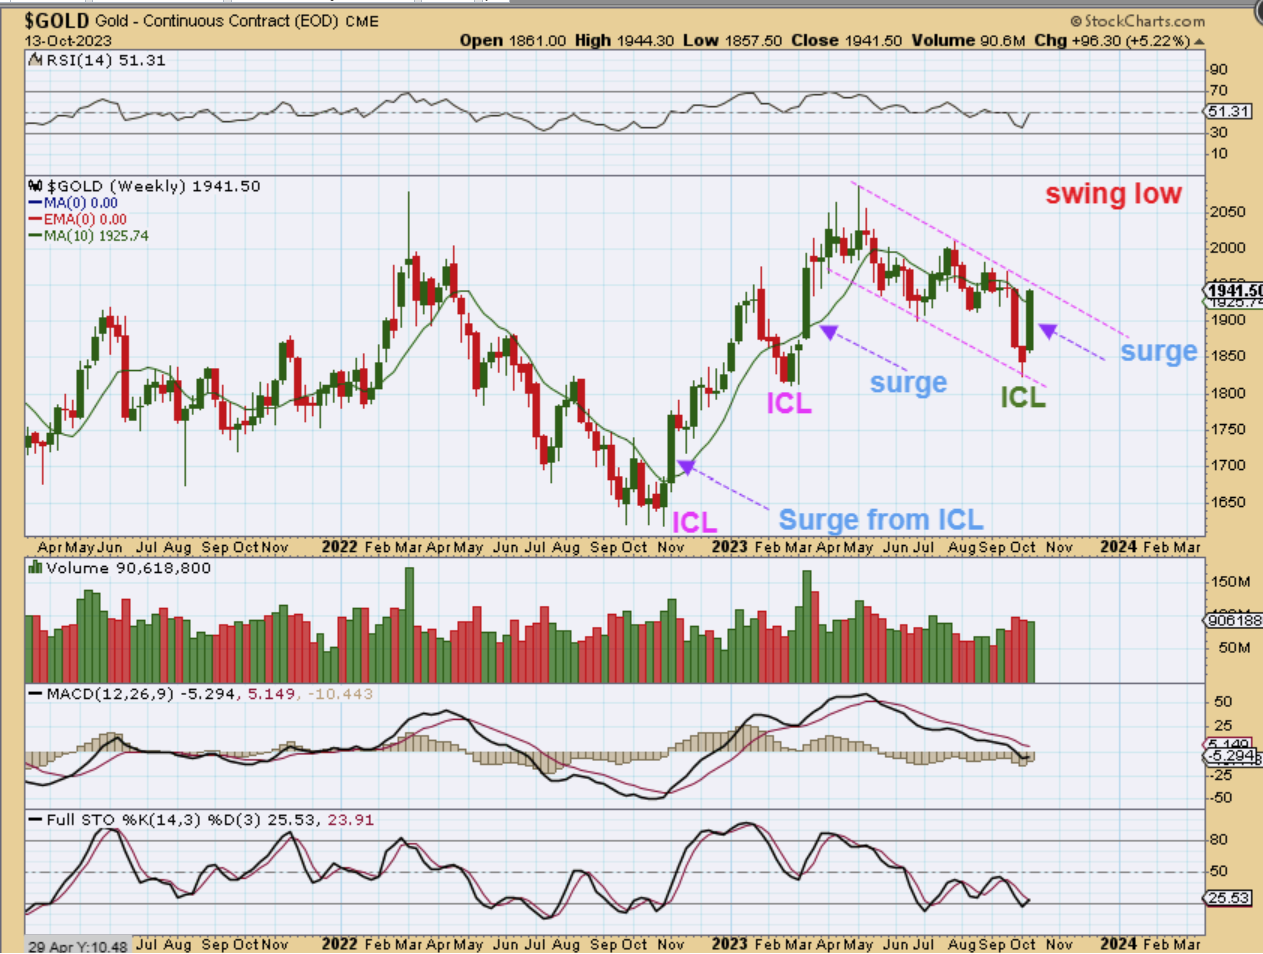
GOLD DAILY – Gold surged over $60 on Friday, which was only day 5 of our ICL. This has a long way to go, but with such a big surge, the question is, “Does it need to pause next or can it keep going?” Well, to be honest, it could do either. It may pause on Monday, but I do think that it WILL continue during higher next week, so let me show you an example similar to this set up.
.
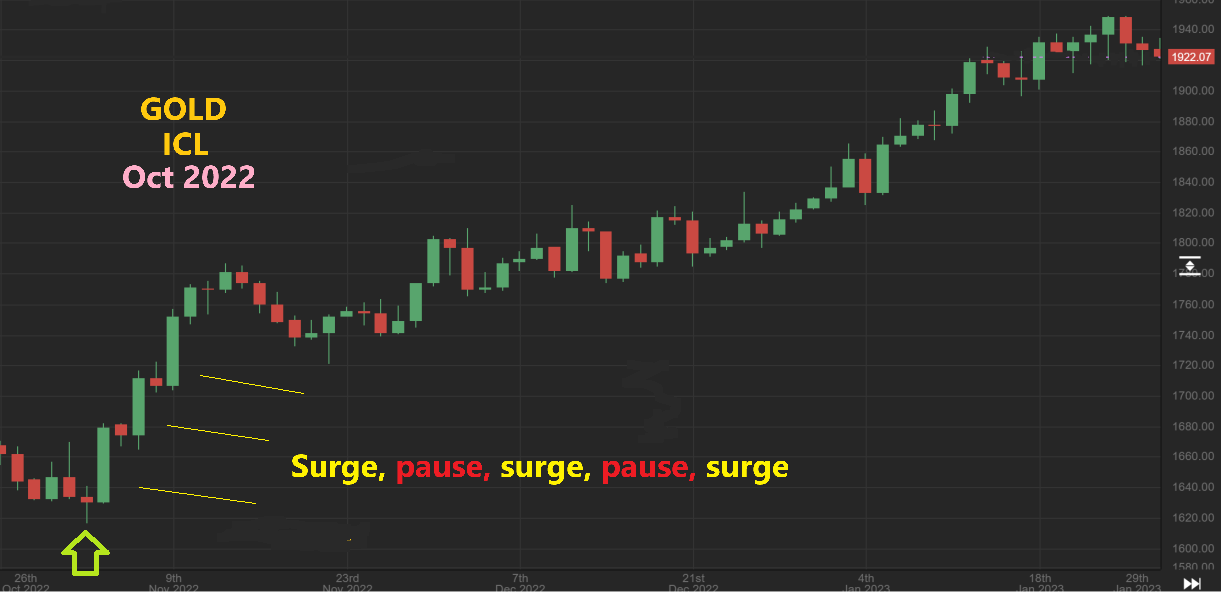
GOLD DAILY 2022 Rally – Last October we had our ICL too, and Gold did surge out of that low. Notice that it surged on 1 day, paused the next, surged again, paused again, etc. Well because right now we are only on day 5, we have a long way to go and I think that we could see this kind of price action again, we’ll just have to wait and see.
.
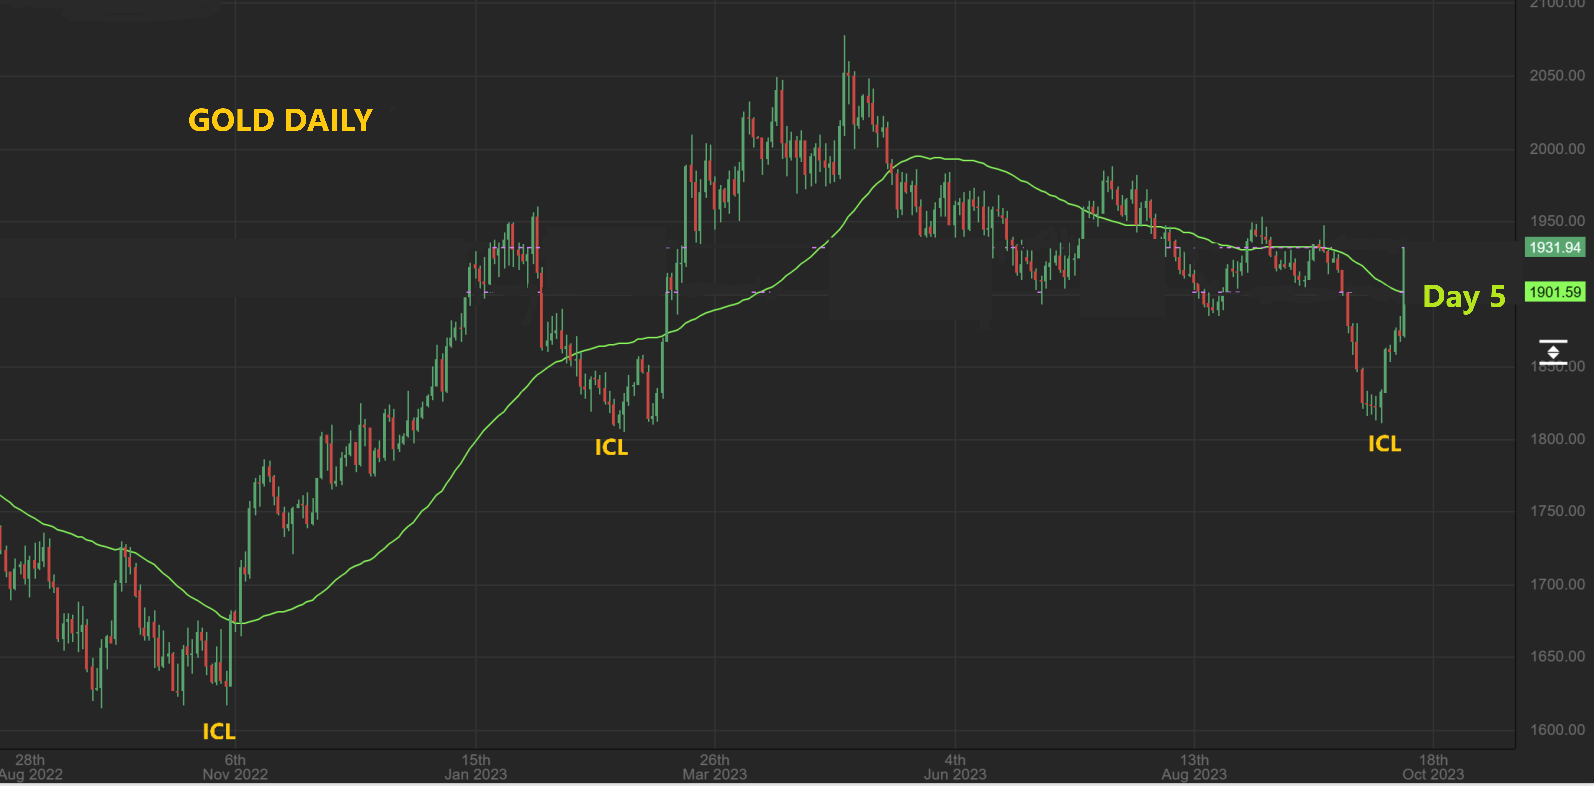
GOLD DAILY AND THE LAST 2 ICLs – The ICL of last March can be seen in the middle of this chart too, and it rallied, paused, rallied, and continued higher out of the lows too. So in this first daily cycle…
.
So in this first daily cycle… I am thinking that Gold will in one way or another, work its way back up to former highs again.
.
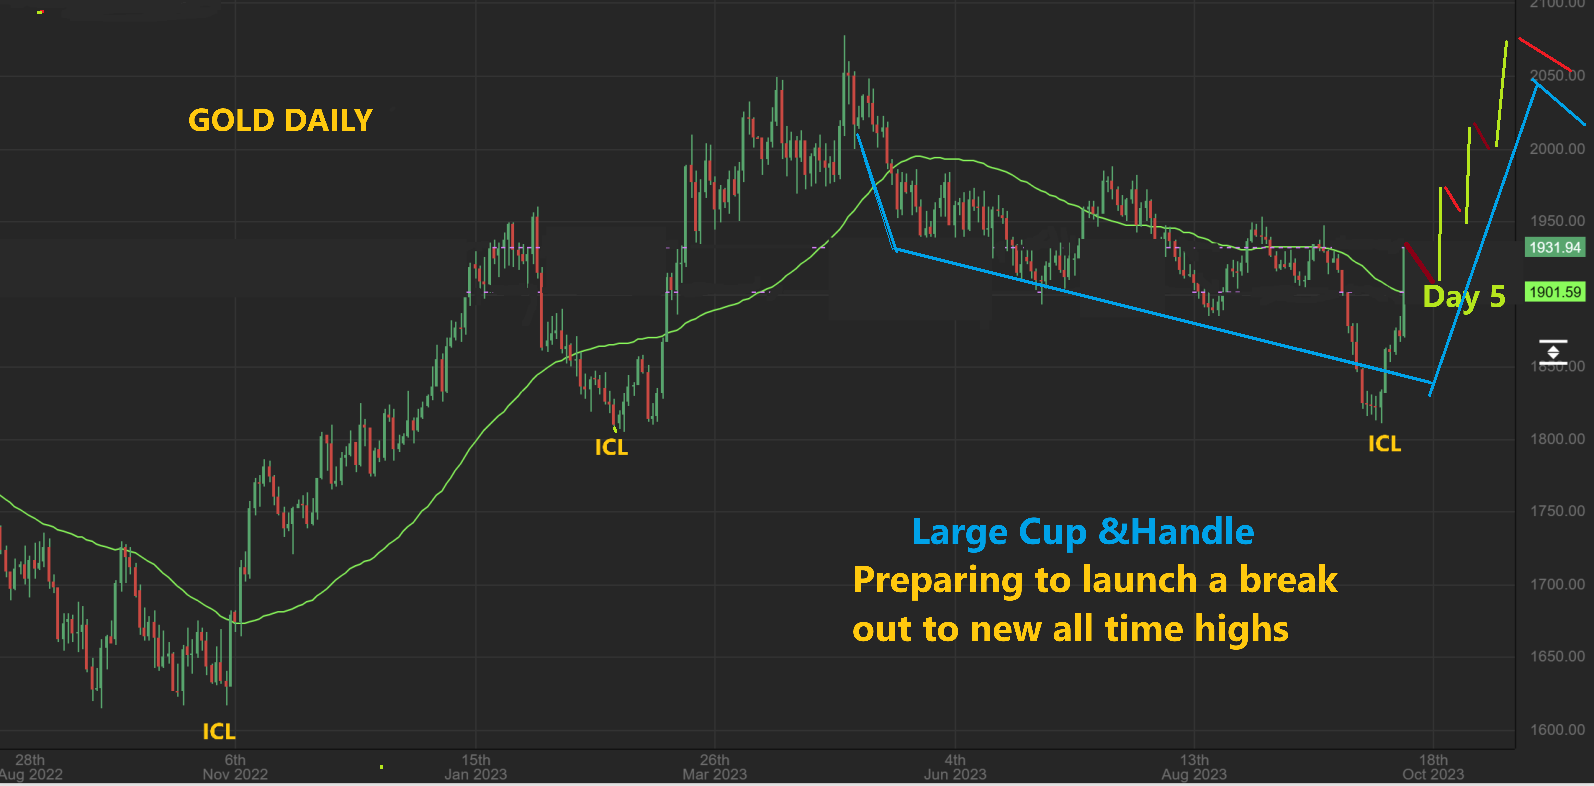
Even if it pulls back to the 50sma next week as shown here, it could gradually form a cup-like pattern something like I have drawn here and break out during daily cycle number 2. This is just a guess, but it fits the current set up with an ICL in place.
GOLD WEEKLY– Gold was up almost $100 last week and that gives us a solid swing low that follows that reversal candle that I pointed out in last weekends report. The last 2 ICLs also had an initial surge and then continued higher.
.
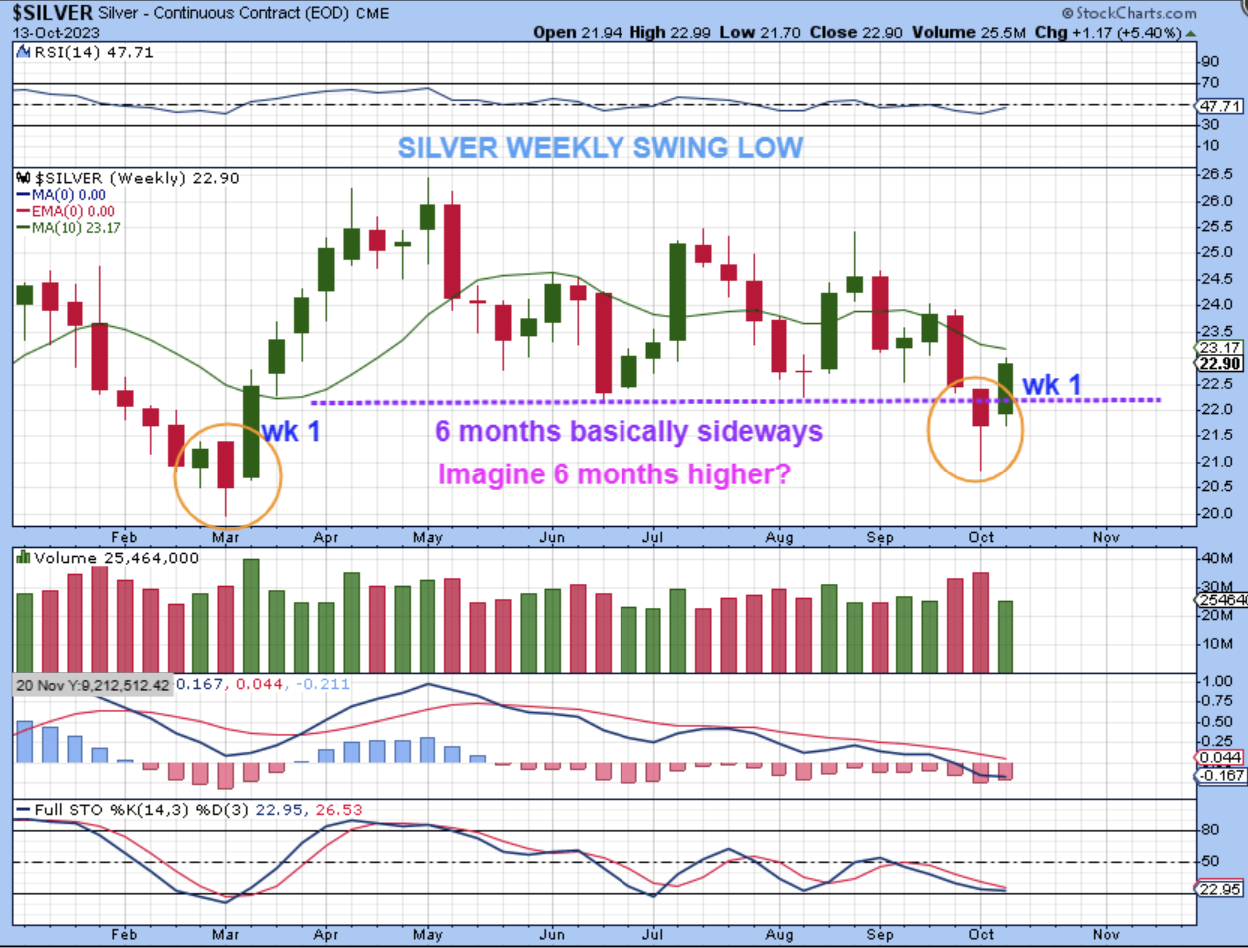
SILVER WEEKLY – In technical analysis, when we see a long consolidation that follows a run higher, that consolidation actually can build lots of energy for the next run higher. We have seen Silver churning sideways for almost 6 months, so if this does break out and launch upward, it may be a very strong rally and the lagging Silver Miners should play catch up very quickly. ACTUALLY…
.
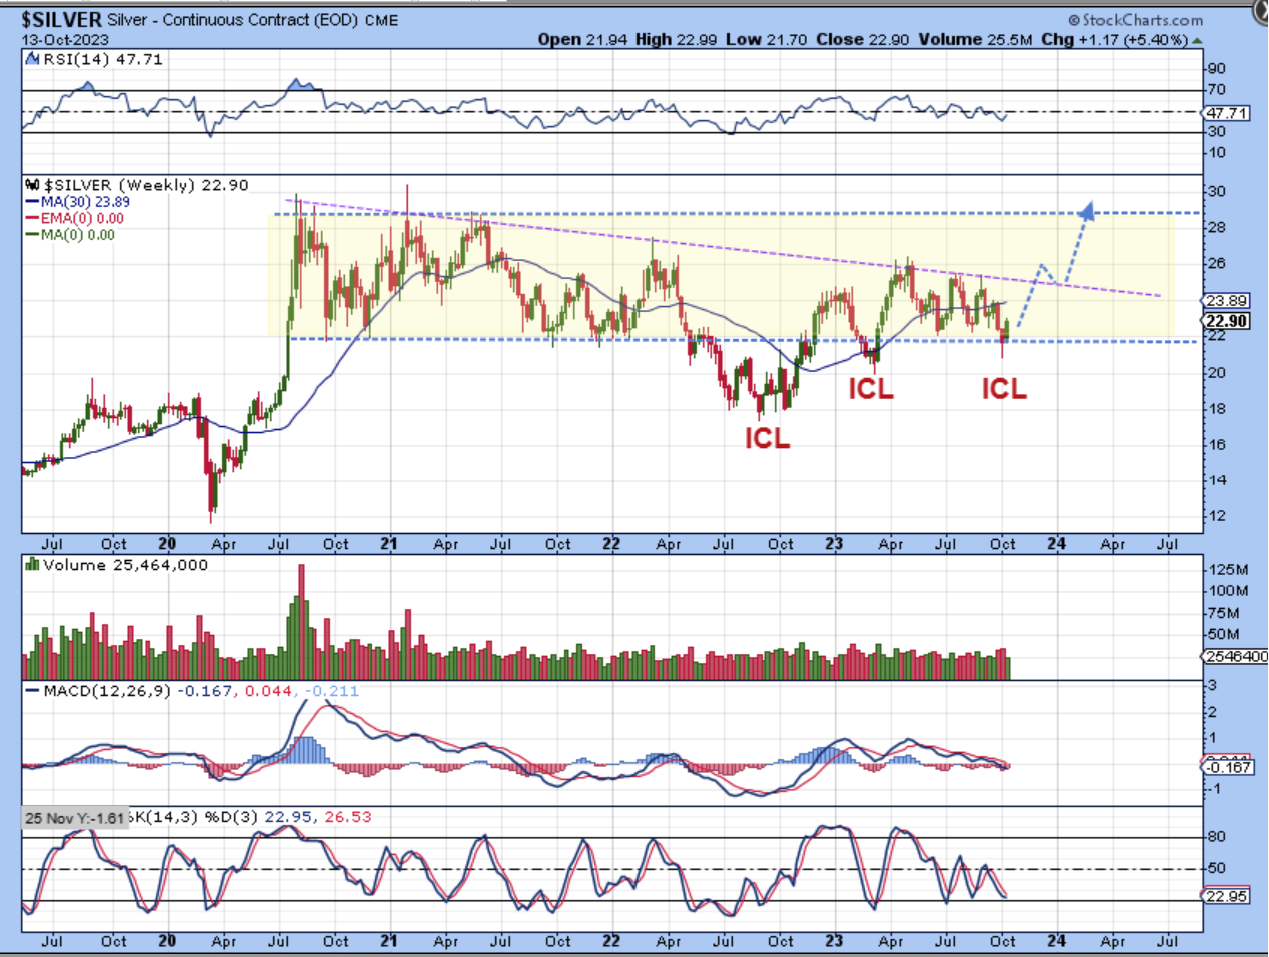
ACTUALLY, that consolidation that I just pointed out is only a small part of a MUCH LARGER consolidation. We’ve been waiting for a long time to see Silver really put on a show, and a break above that purple downtrend line could be the start of the fireworks that we are all hoping for. Again, Silver stocks are still near the lows, but a couple of them started to burst upward on Friday, so I’m going to watch silver Miners everyday!
.
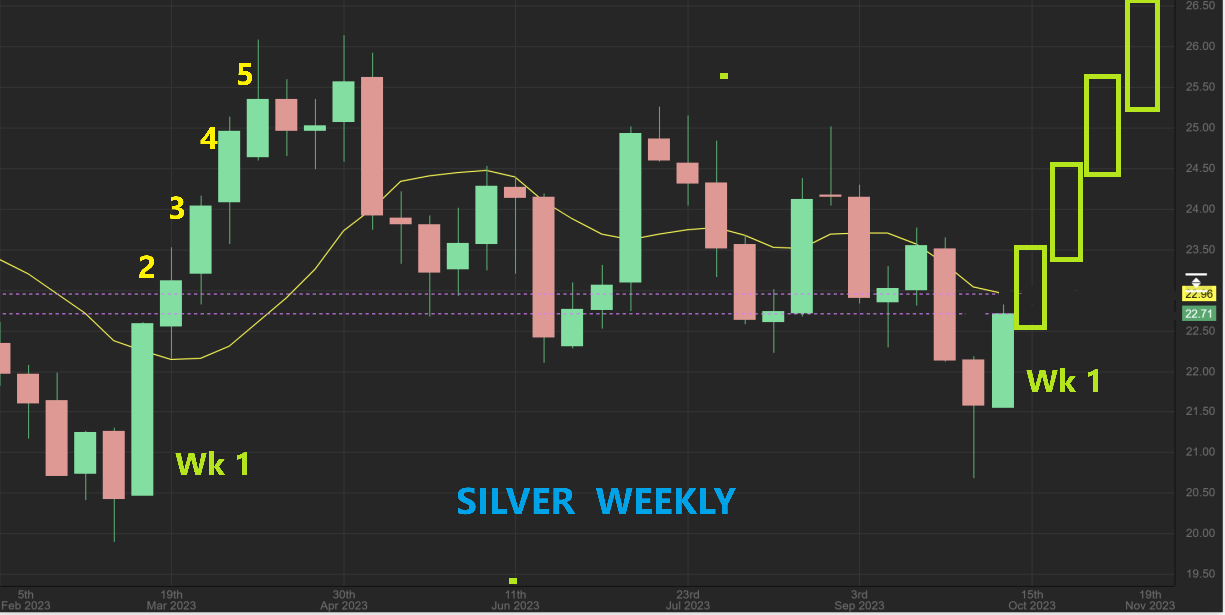
SILVER WEEKLY– Lets dream big and be prepared to buy Silver Miners if this set up does launch higher.
.
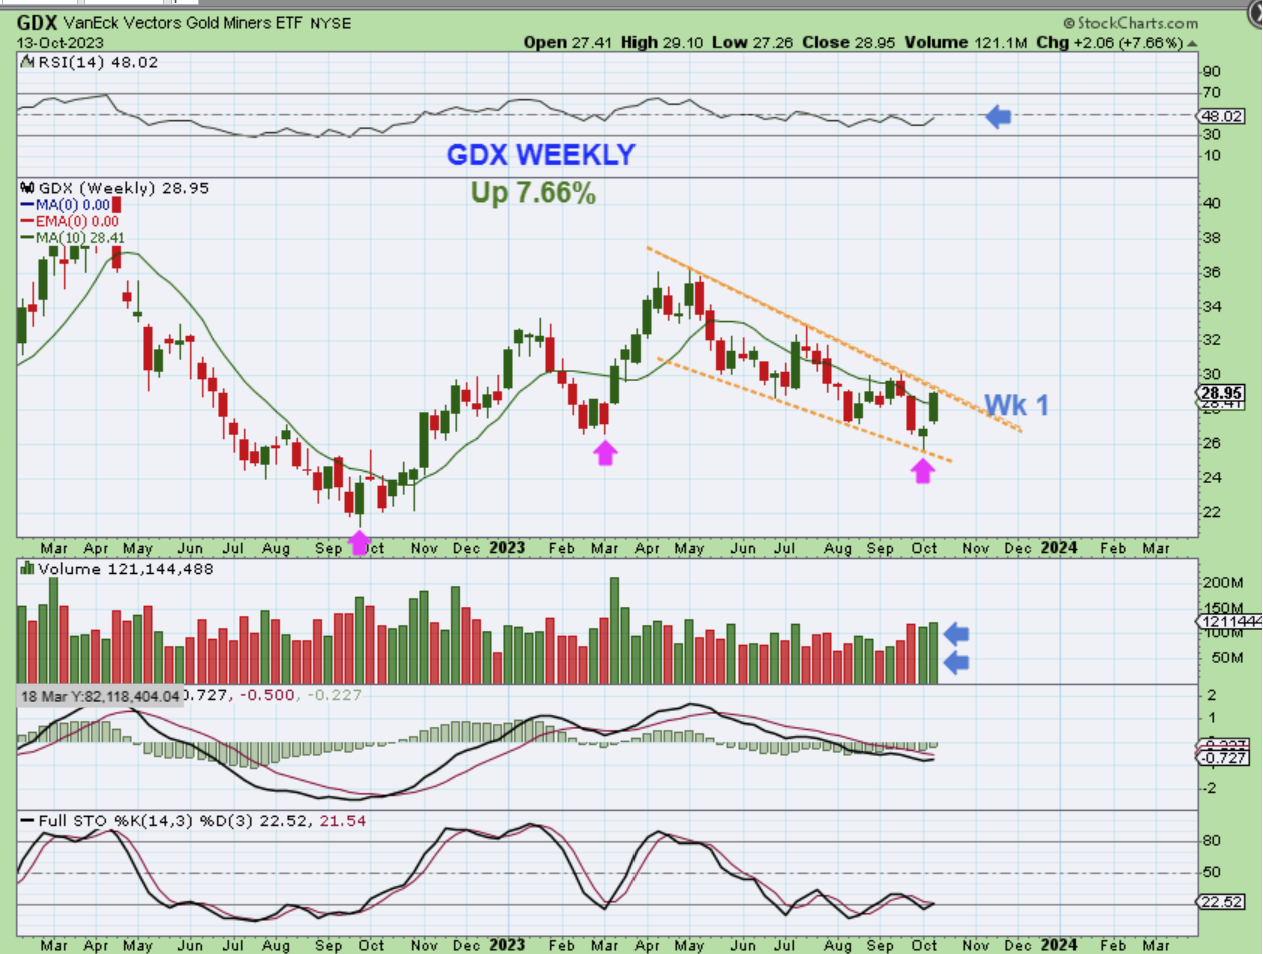
GDX WEEKLY– The GDX had a ‘good’ week, but this really can run a lot higher. Do you see where I have drawn the Bullish Descending Wedge? We are so early in this Intermediate Cycle that Miners should breakout and rally higher from here. Let me show you something else encouraging about this sector.
.
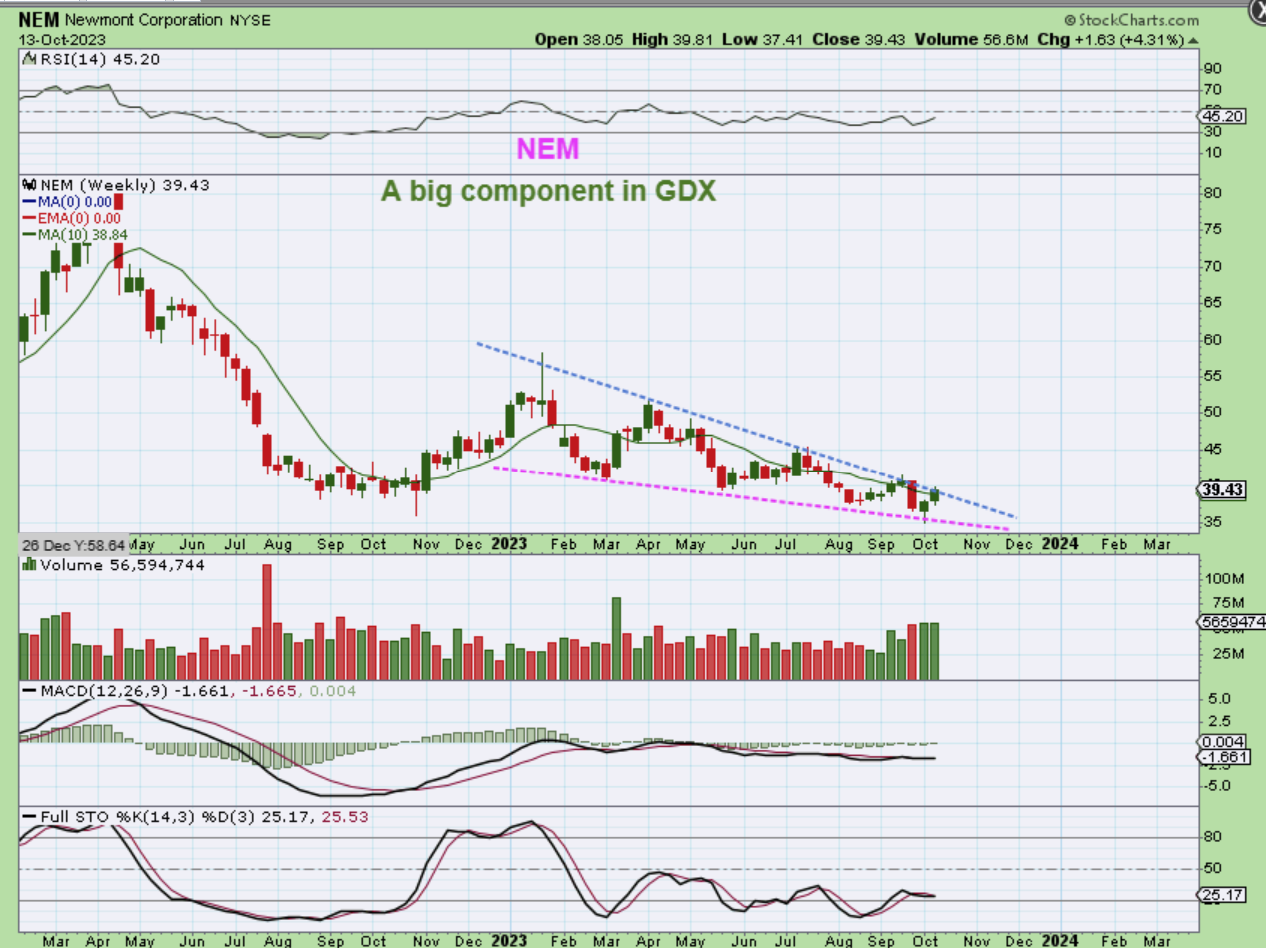
NEM WEEKLY -Newmont & Barrick are a big part of the GDX and to be honest, they are still at the lows and are just now starting to get going. We made Excellent gains on HMY, GFI, AU, etc, but now some of the other Miners look ready to go higher and push GDX up along with it. Newmont traded at $80 last year.
.
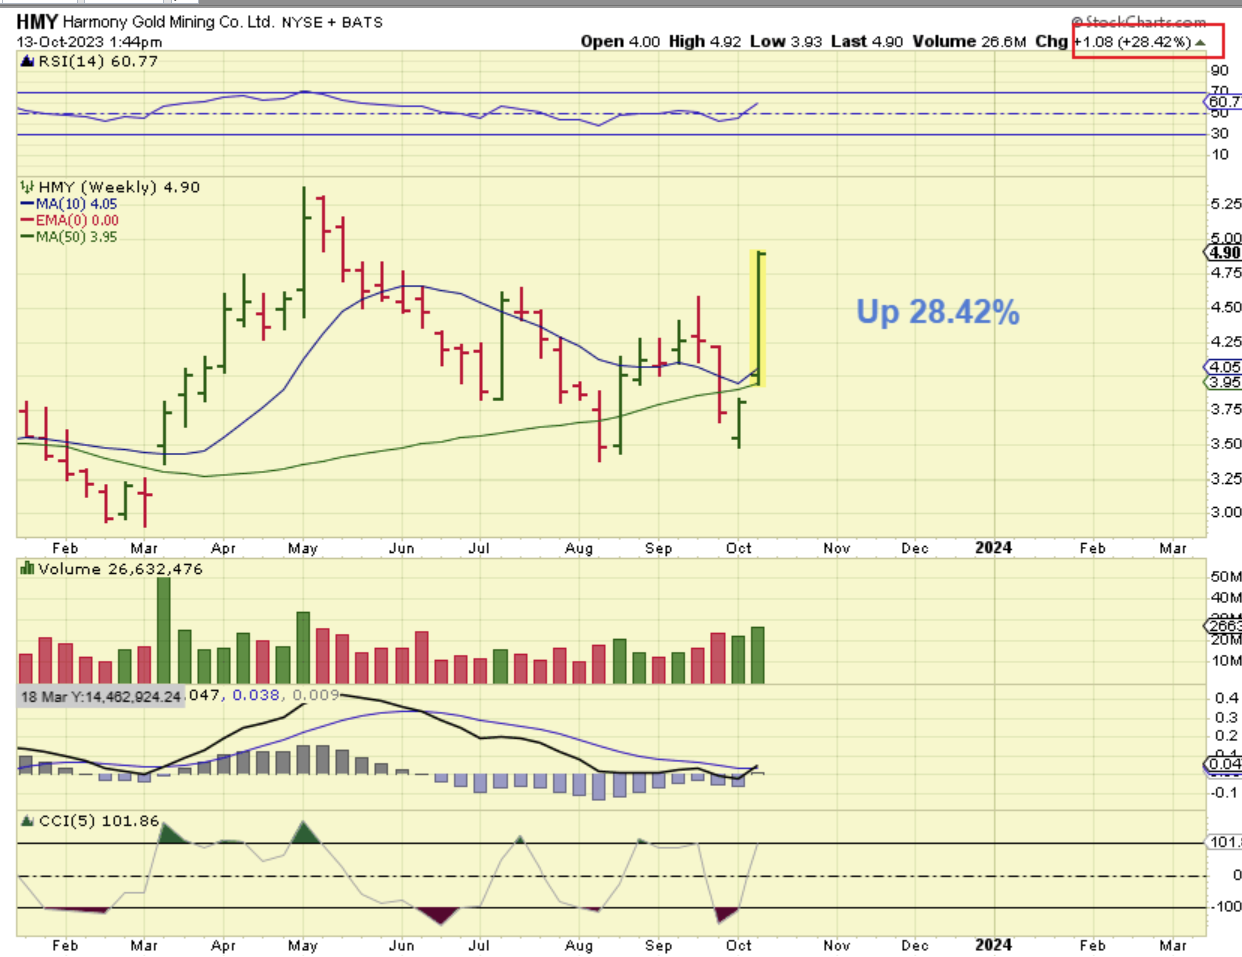
HMY WEEKLY– Our S.African miners have done amazing gapping higher day after day. HMY was up almost 30% this week alone!
..
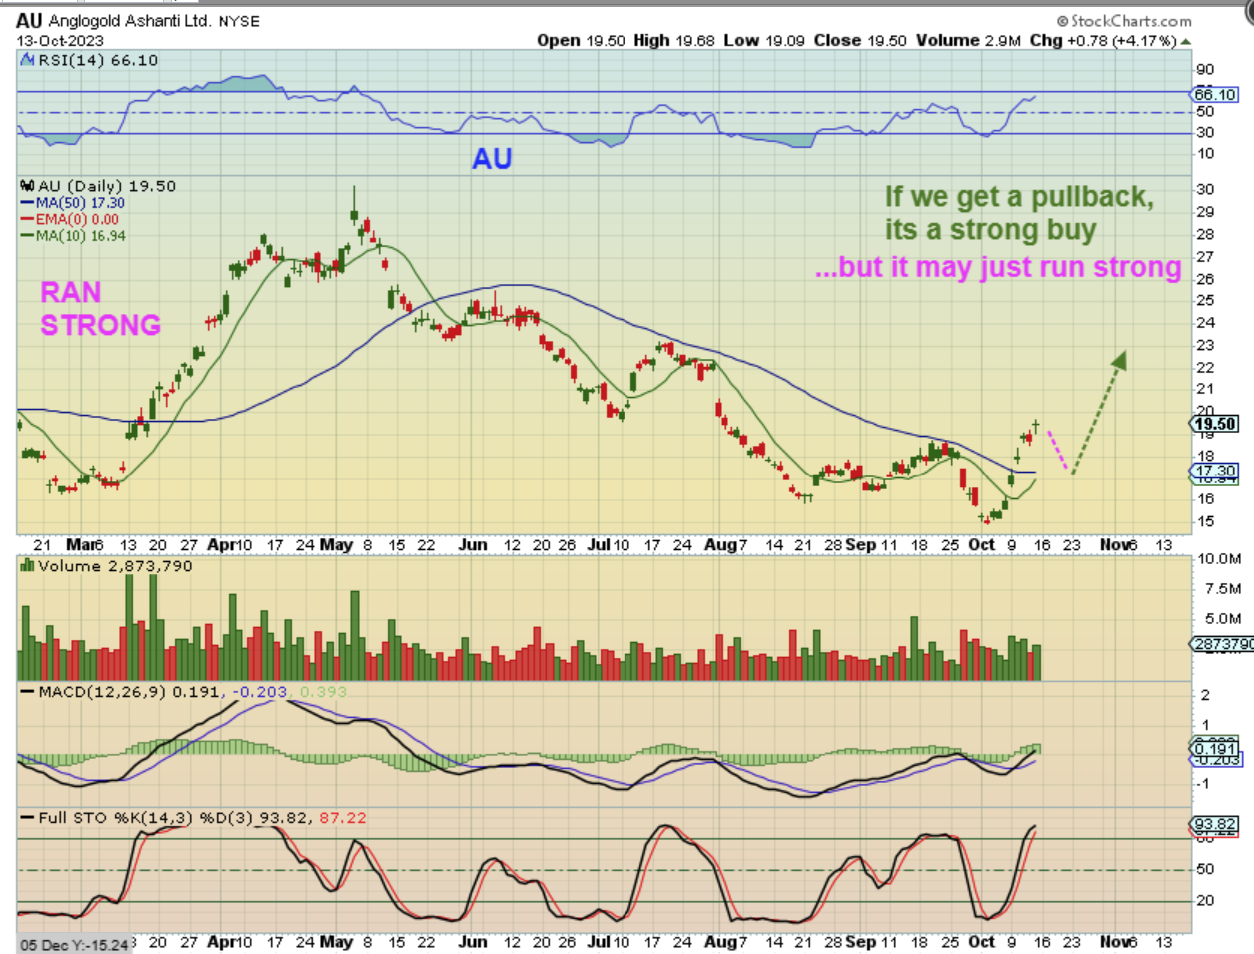
AU DAILY RALLY – Take a look at the March rally. It was almost straight up day after day. Now we also have gaps higher daily again, so this tells me that they may not need to fill. This can also just keep running higher again. if it does drop to the 50sma and fill 2 of these gaps, that is a Major Buy Opportunity.
.
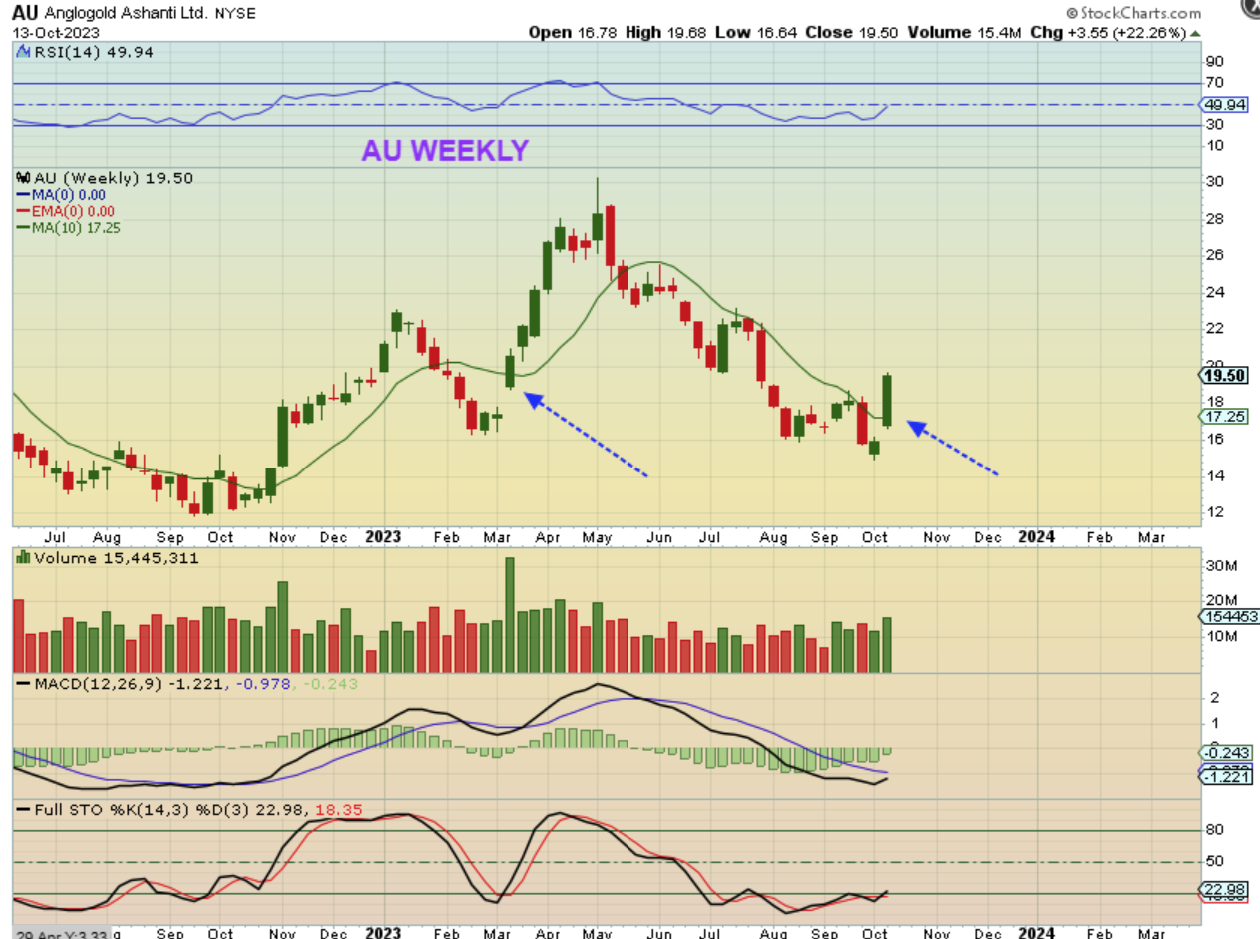
AU WEEKLY– And Anglogold Ashanti was up 22% this week alone too. In March, it never paused on a weekly basis.
Silver Miners have been lagging, but on Friday that started to change. These are still at the lows, so they may be ready to put in some solid gains. Let’s take a look…
.
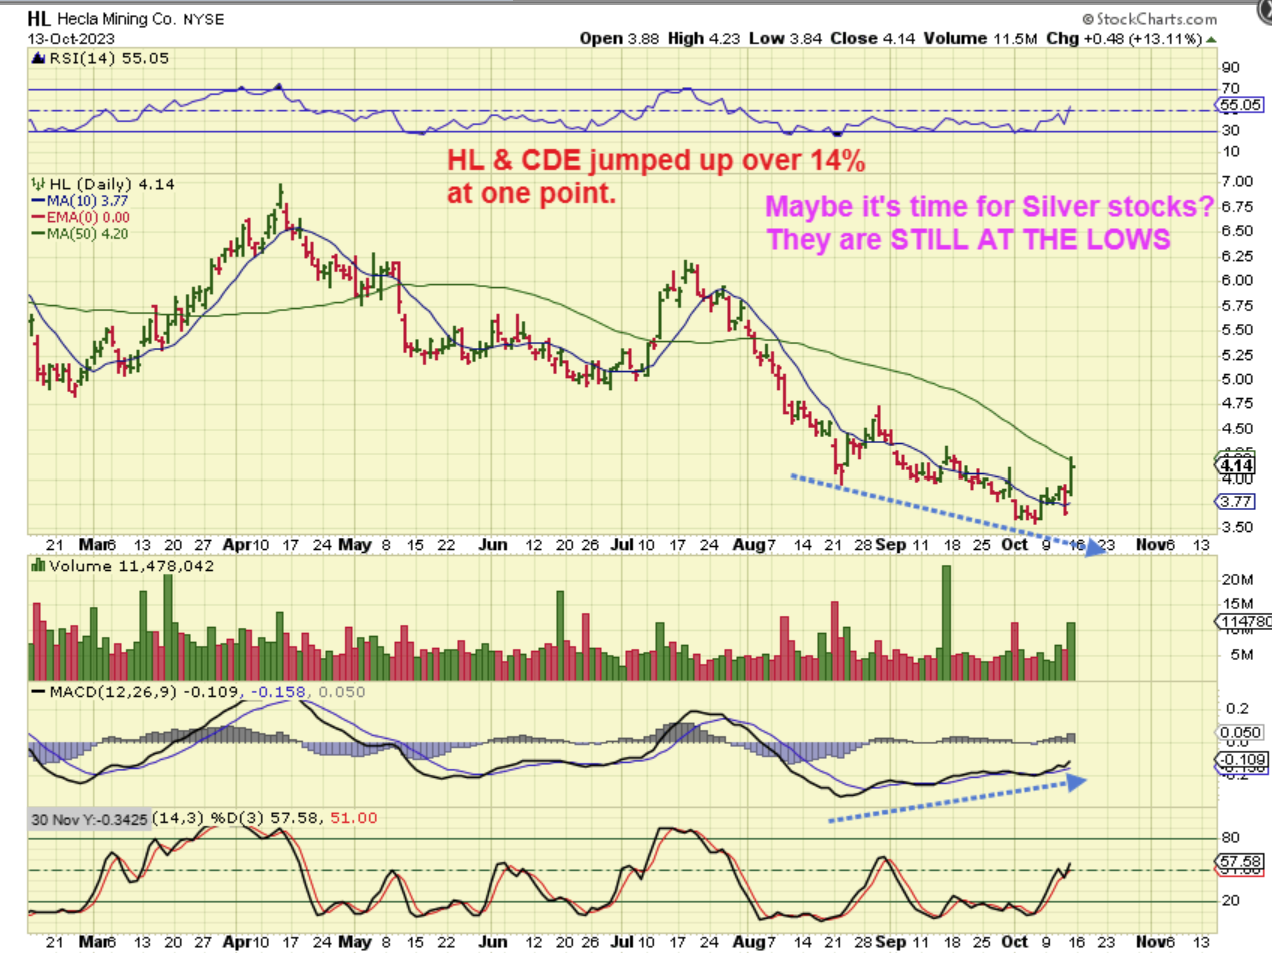
HL was still right at the lows and suddenly surged 14% on Friday. Volume came in nicely and this may be ready to break out above the 50sma and run. I saw no news released on HL Friday that would have caused this. Let me show you something else…
.
Let me show you something else. Many Silver stocks are still at the lows, but they are forming those bullish descending wedges. As soon as they break- Boom!
.
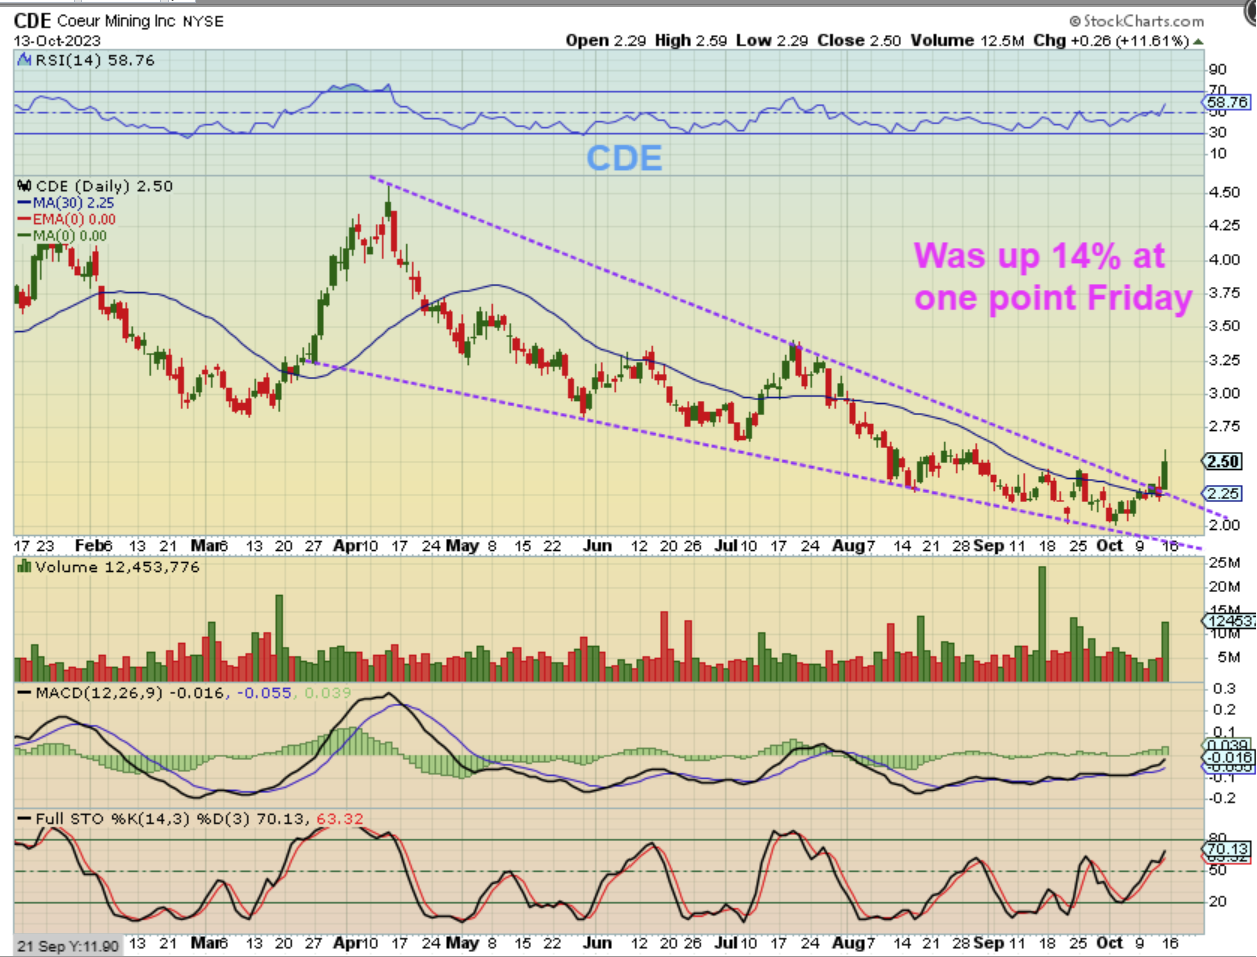
CDE burst higher by 14% at one point Friday as it broke above the downtrend line. I saw no news on CDE Friday.
.
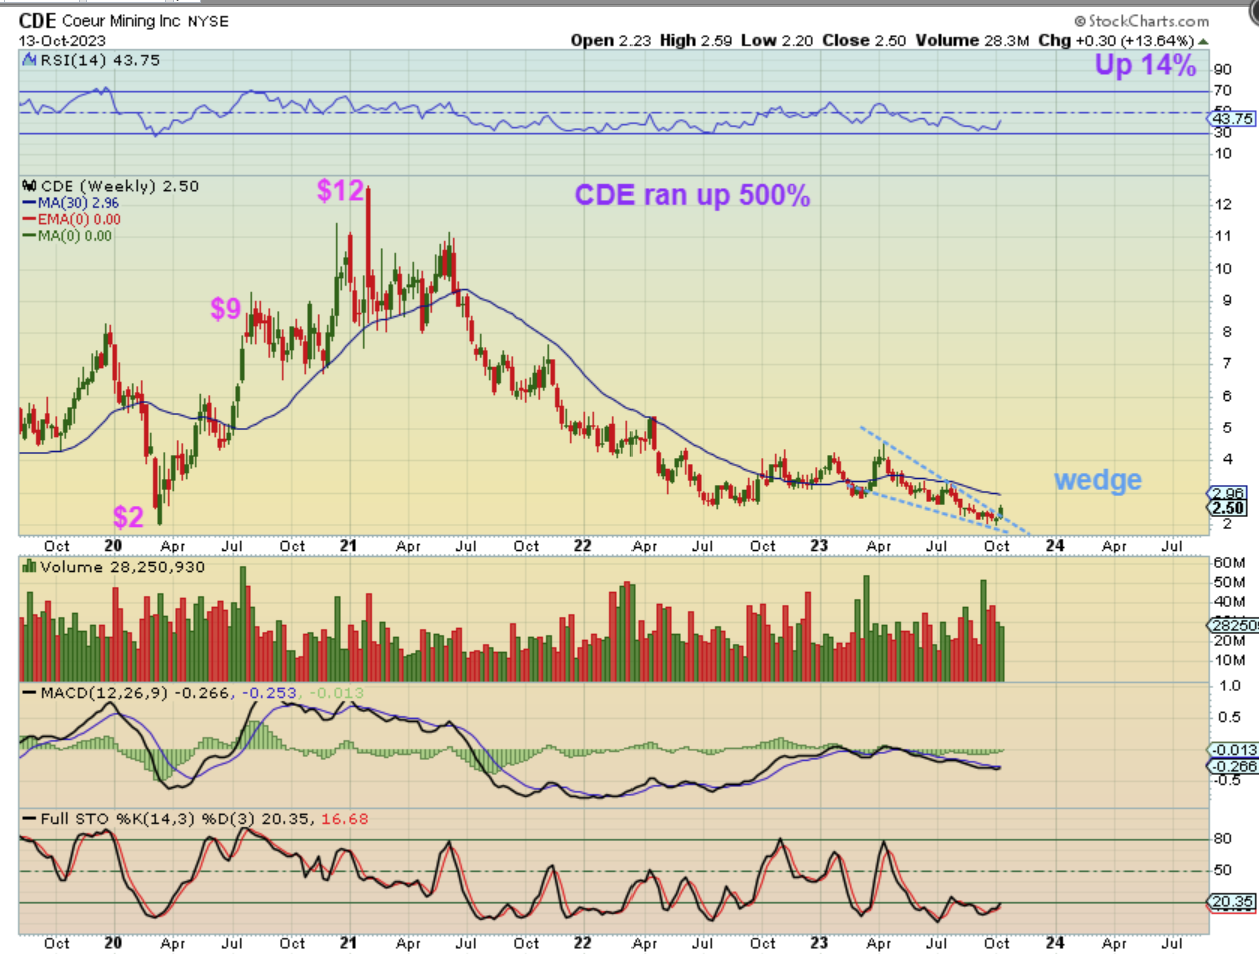
CDE WEEKLY popped Friday and it hardly shows on the big picture chart, because it has plenty more space to run higher. What we do see here is that along with plenty more upside, in 2020 CDE ran up from $2 to $12 (500%). CDE is in the $2 area again.
.
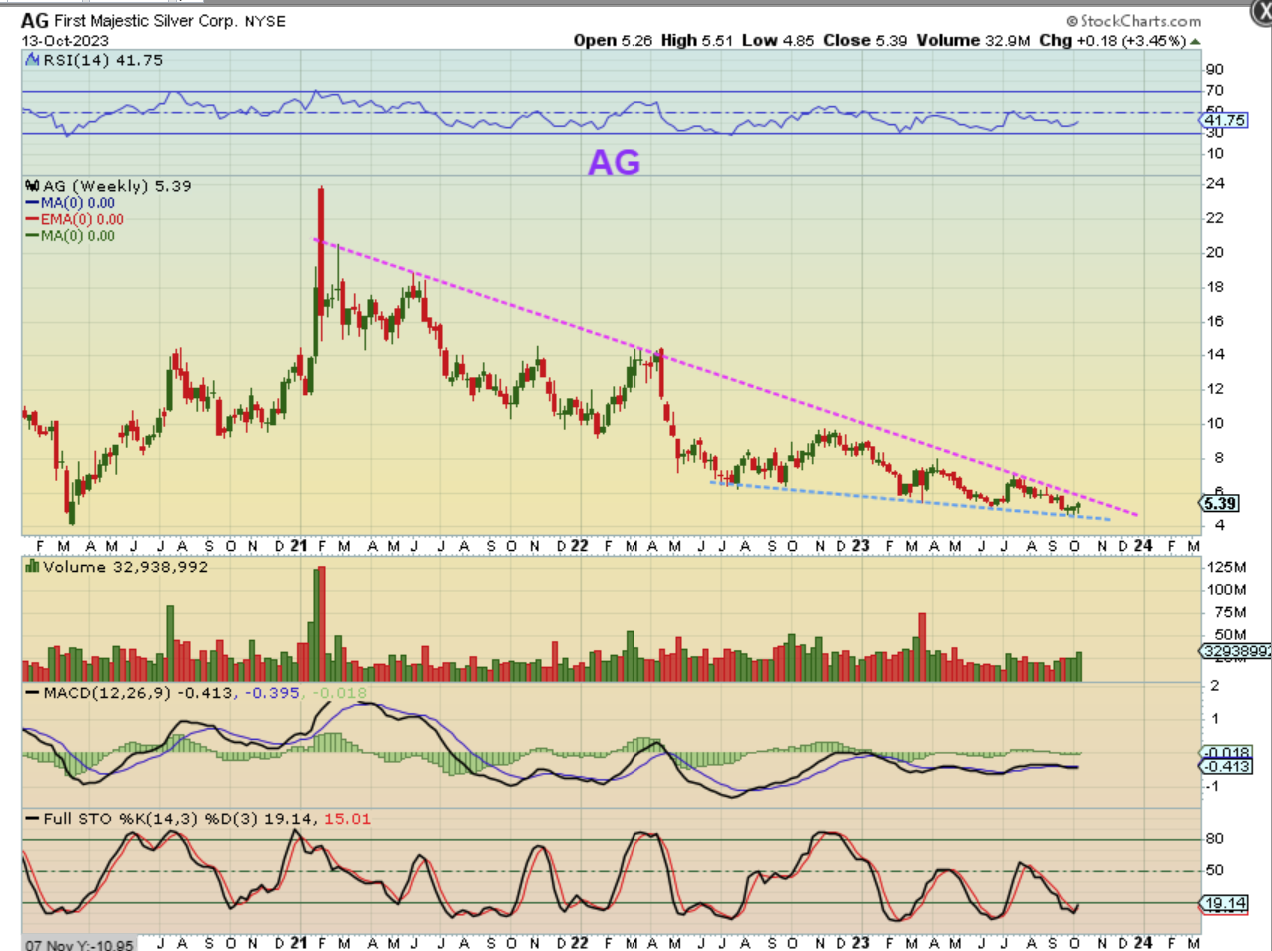
AG – So I’ll be watching other Silver Miners next week too. AG, FSM, EXK, etc are still near the lows and may be able to put in some gains with a breakout and run too.
.
Here we see that AG is forming the same wedge. I know that these should be much higher already, but after seeing CDE & HL put in 14% for no apparent reason, I’m beginning to think that the rest may follow.
.
The General Markets dipped lower Friday and need to be watched, just in case they want to make one lower low. On the weekly chart, they appear to have support and an ICL, but we use stops and will see how it plays out. It was an exceptional end to the week last week for Precious Metals! After a powerful $60 day on Friday, we shouldn’t be surprised if we see Gold ‘pause’ or dip lower on Monday, but some Miners may ignore that and continue higher while others pause too. It is only day 5 for Gold, so we will be able to add to positions on any dips.
.
I hope that you all enjoy your Sunday, and I also hope for some continuing follow through next week! The set up is a Bullish one. 🙂
.

