Weekend Report – The Golden Plunge
.
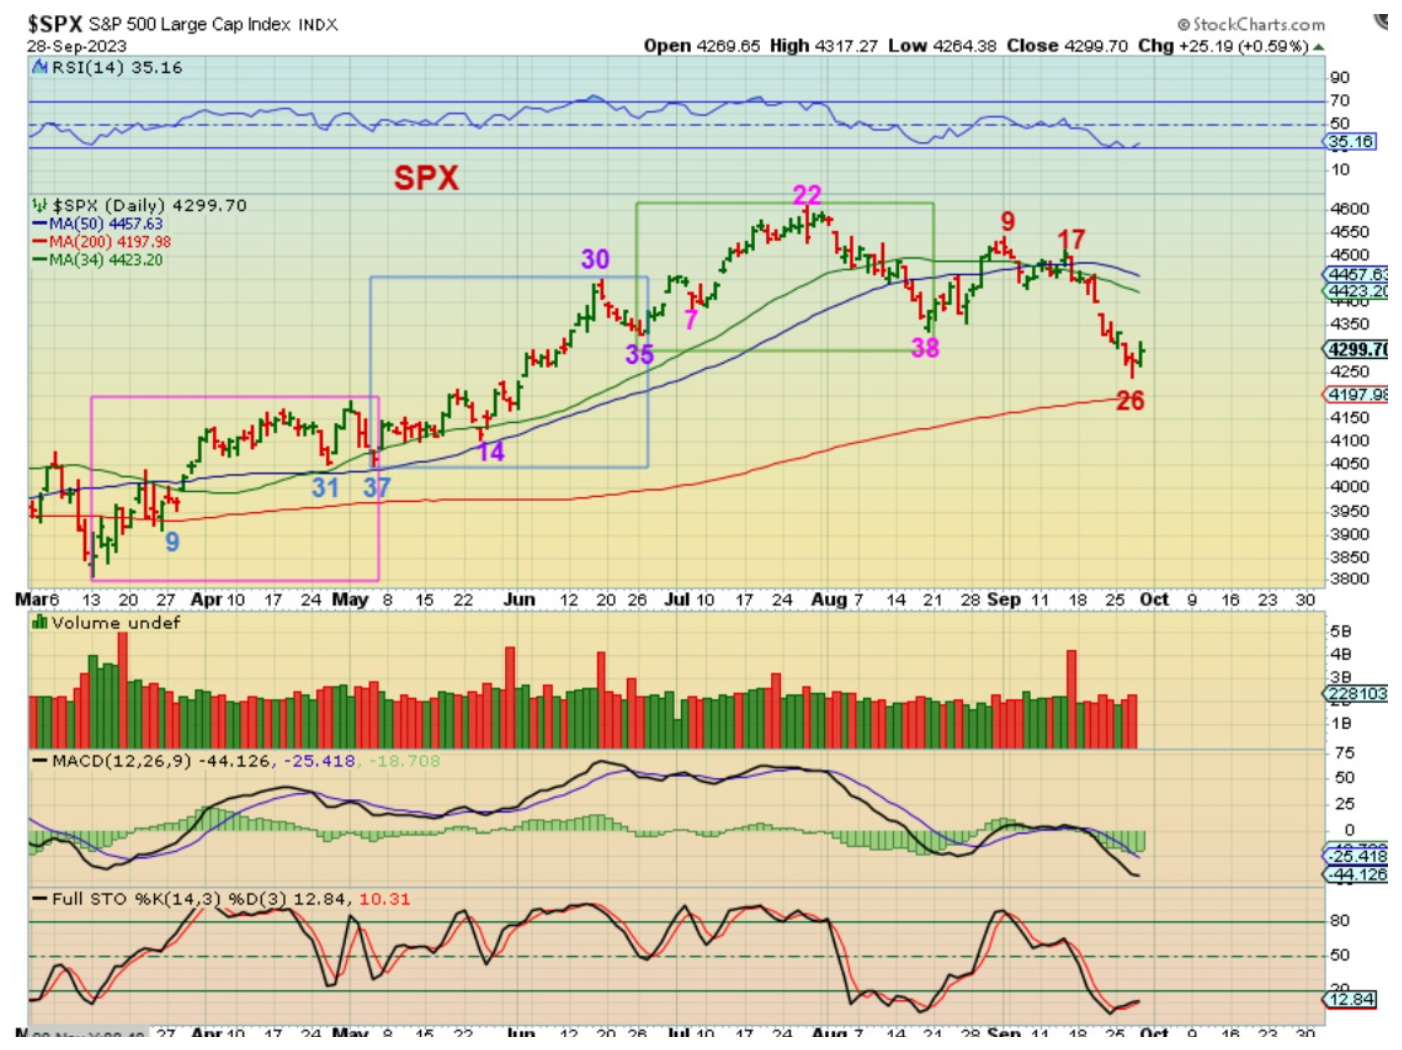
On Friday I showed the cycle counts for The SPX. We were seeing a day 26 low with a reversal on day 27 creating a swing low on Thursday. I felt and still feel that it is a bit too early for a dcl, so…
.
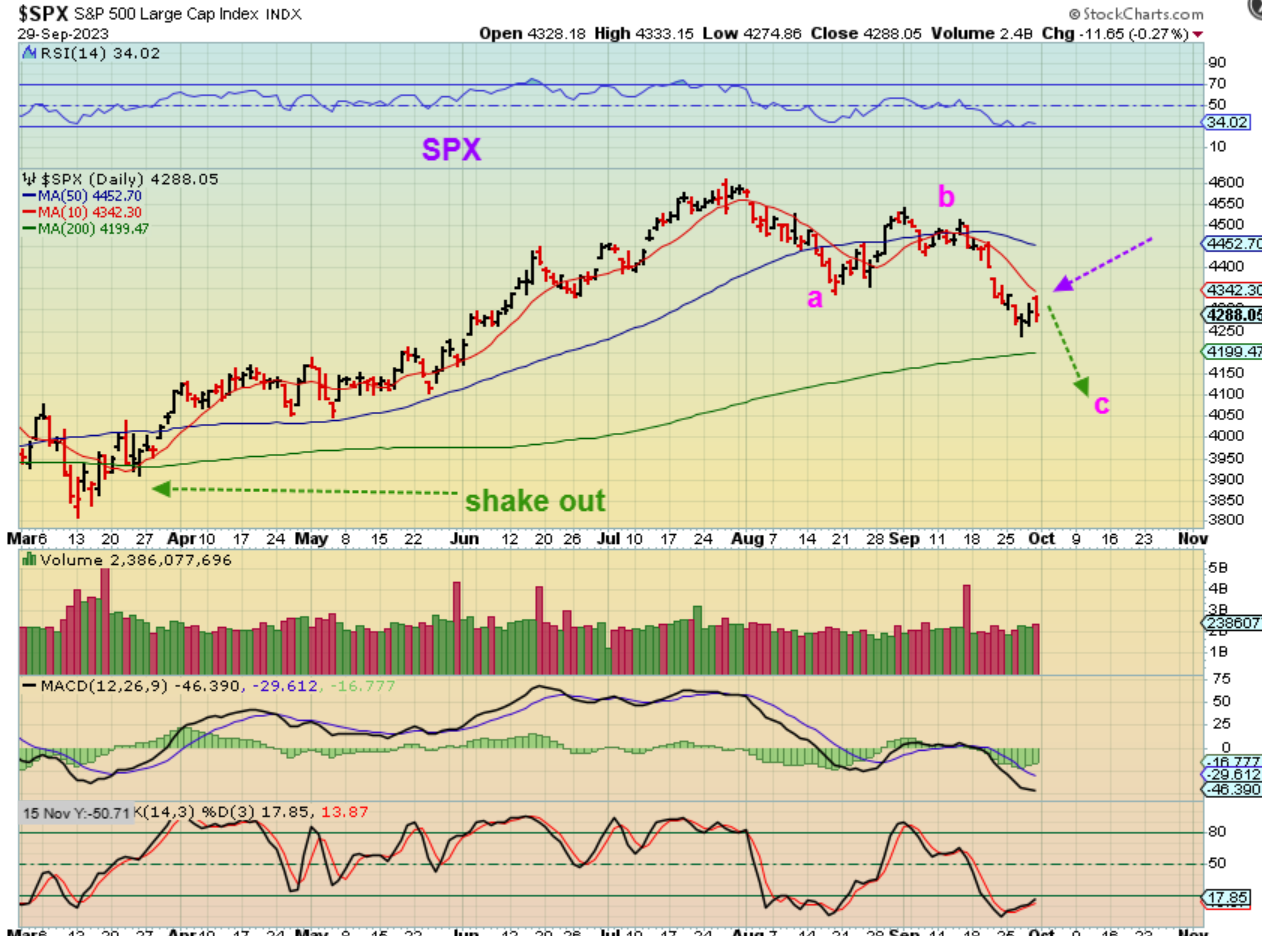
SPX – At this point we had a run higher on Friday morning and things were looking good, but it ran up to the 10 sma and then price was rejected. It sold off into the close and even though we may see price bounce around, I still think that the ICL is ahead.
.
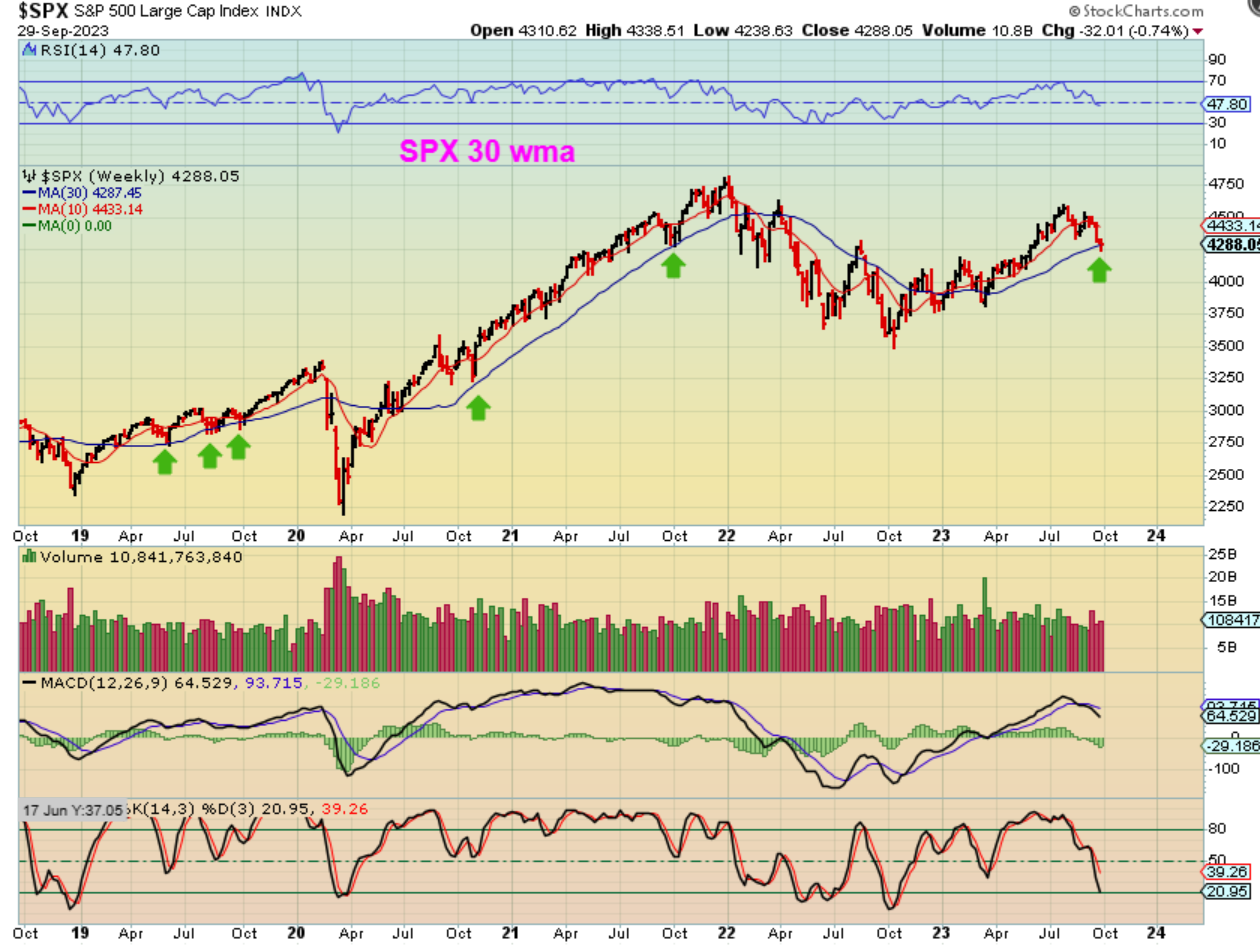
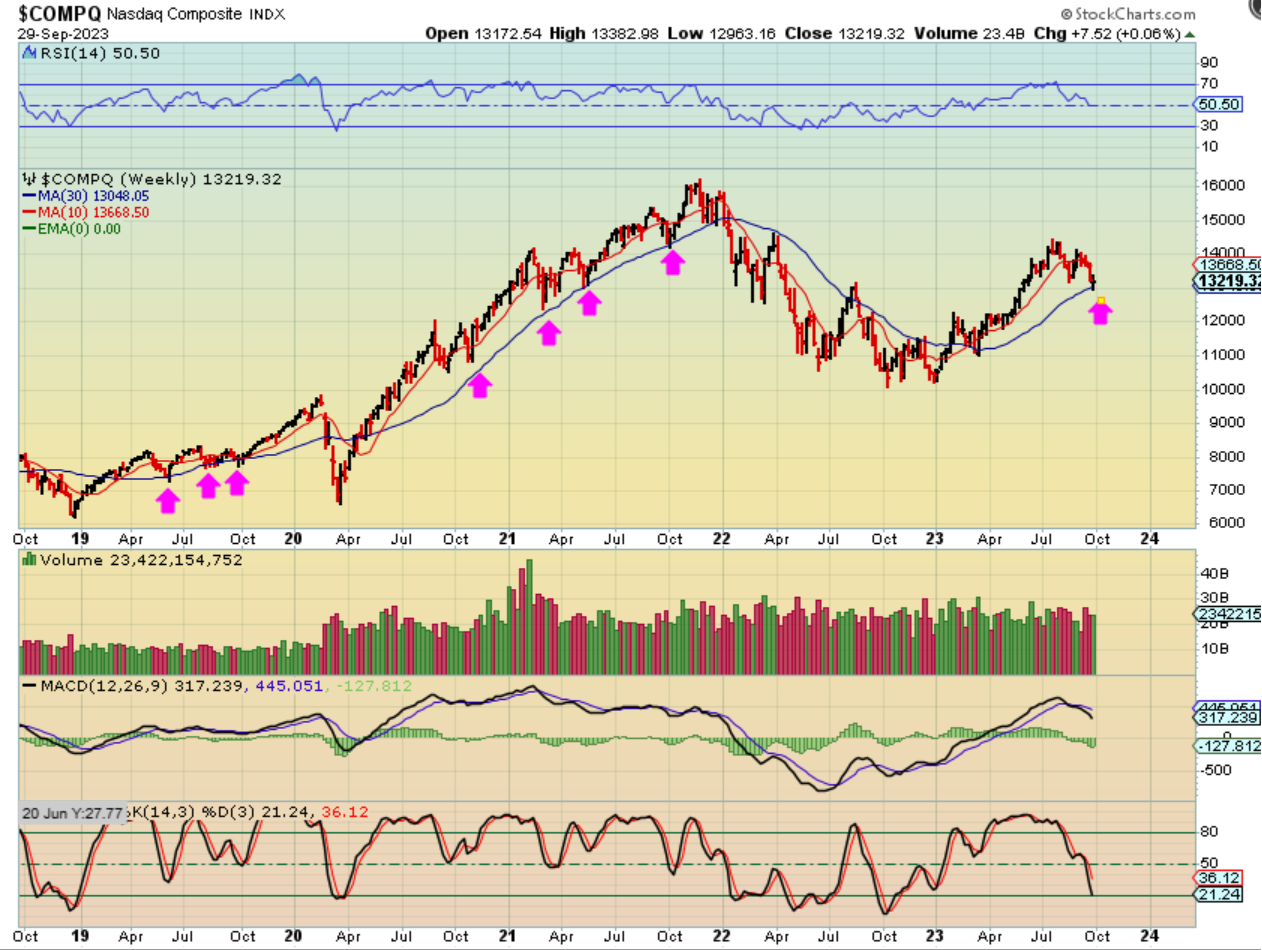
When we get to The SPX Weekly, it is kind of interesting. In past bull runs, the blue 30 week ma was often support during pullbacks, and here we see that price is already there. It is the same for the next chart of the Nasdaq, so…
.
NASDAQ:
It is the same for the chart of the Nasdaq, so that raises questions that will need to be answered over time and they are:
1. Do the markets just chop around up here for a bit and stay in this area as we add days to the daily cycle?
2. Does this break down further than prior pullbacks, and if so, does that indicate more weakness?
3. Is it really possible that we bottom in this area with an early Daily Cycle Count for our ICL?
..
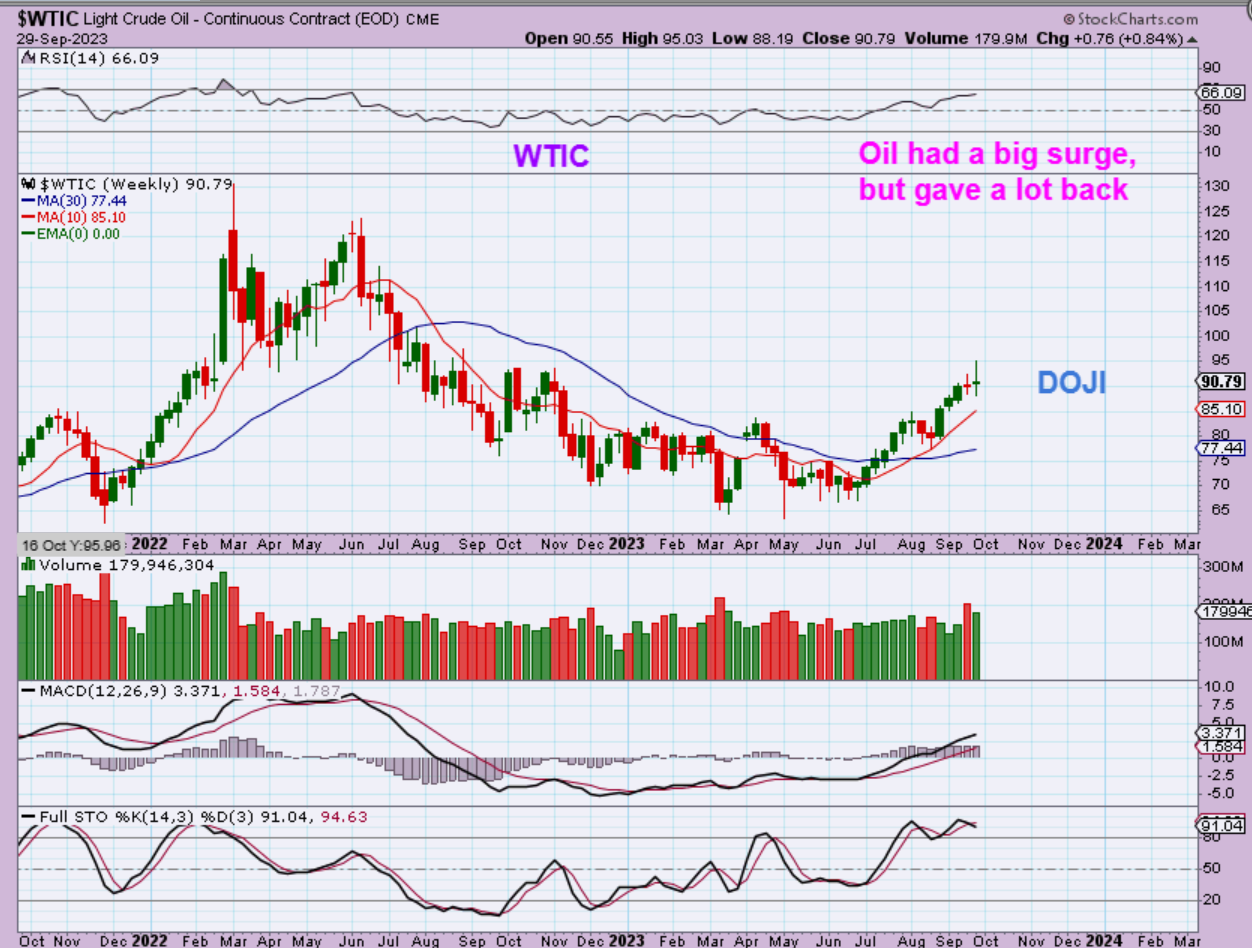
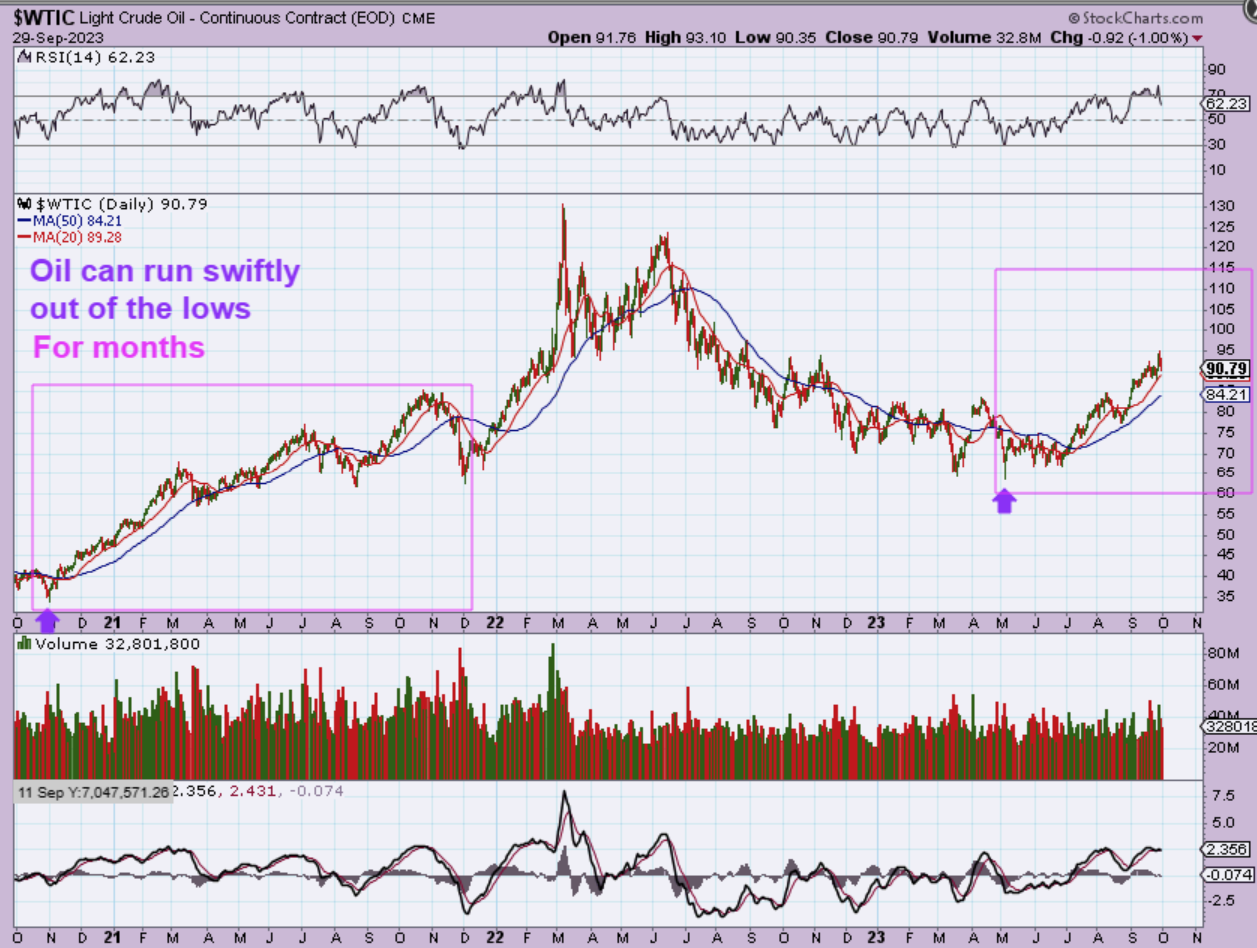
WTIC – You may recall that Oil shot up 4% on Wednesday, but it gave back 2% Thursday and 1% Friday, so Oil remains bullish, but it did give us a weekly doji candle of indecision. So with that indecision, what does that daily chart show?
.
WTIC DAILY: The daily shows a simple dip so far. Since Oils daily cycles can be 45-50+ days long, it is possible that this is just a pause and will chop higher as seen here. I will say this though, at times Oils price can be manipulated and it could just get choppy in an attempt to hold the price down. Right now though, the run out of the lows looks steady and real, so let me show you something…
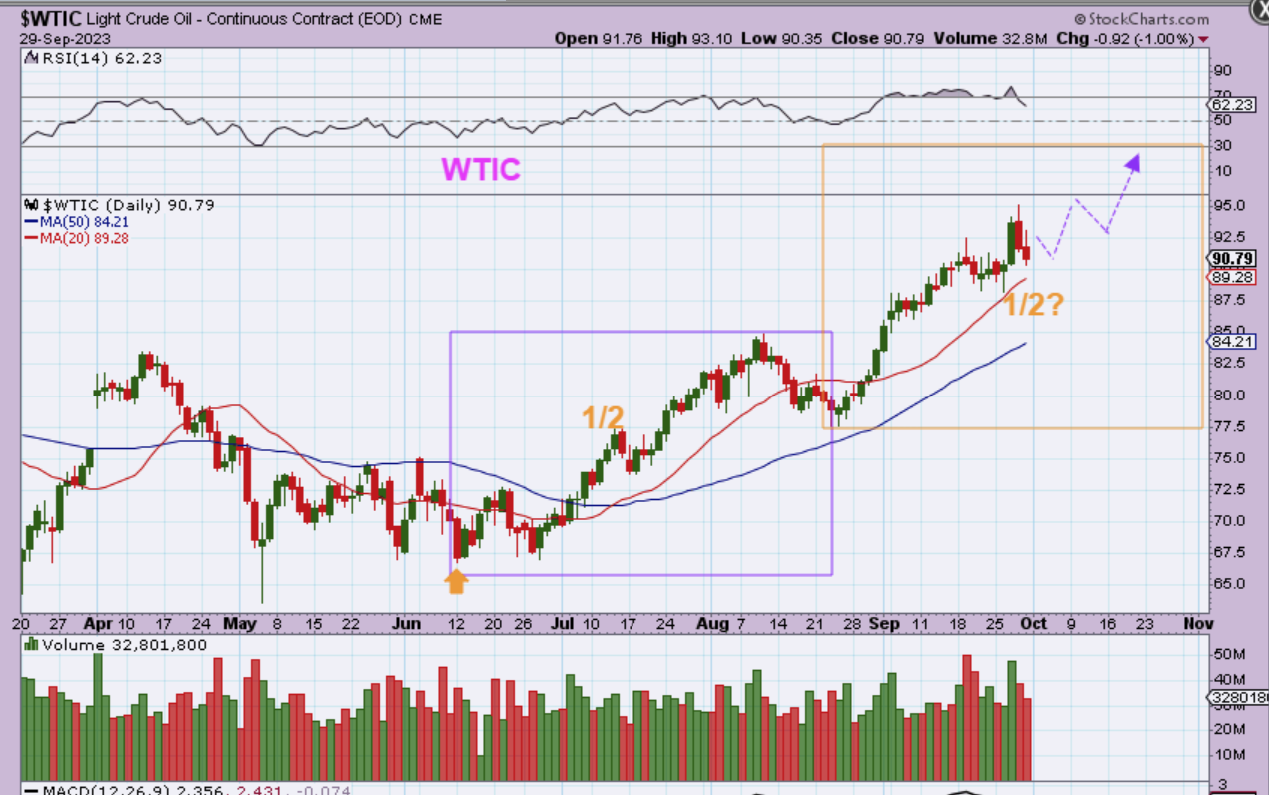
.
WTIC DAILY: Take a look at the run in 2021. It really didn’t pull back very much even when it got choppy. When I compare that run to the current run, this one could continue higher toward prior highs, so I would just use a stop and let it ride if you are long oil.
.
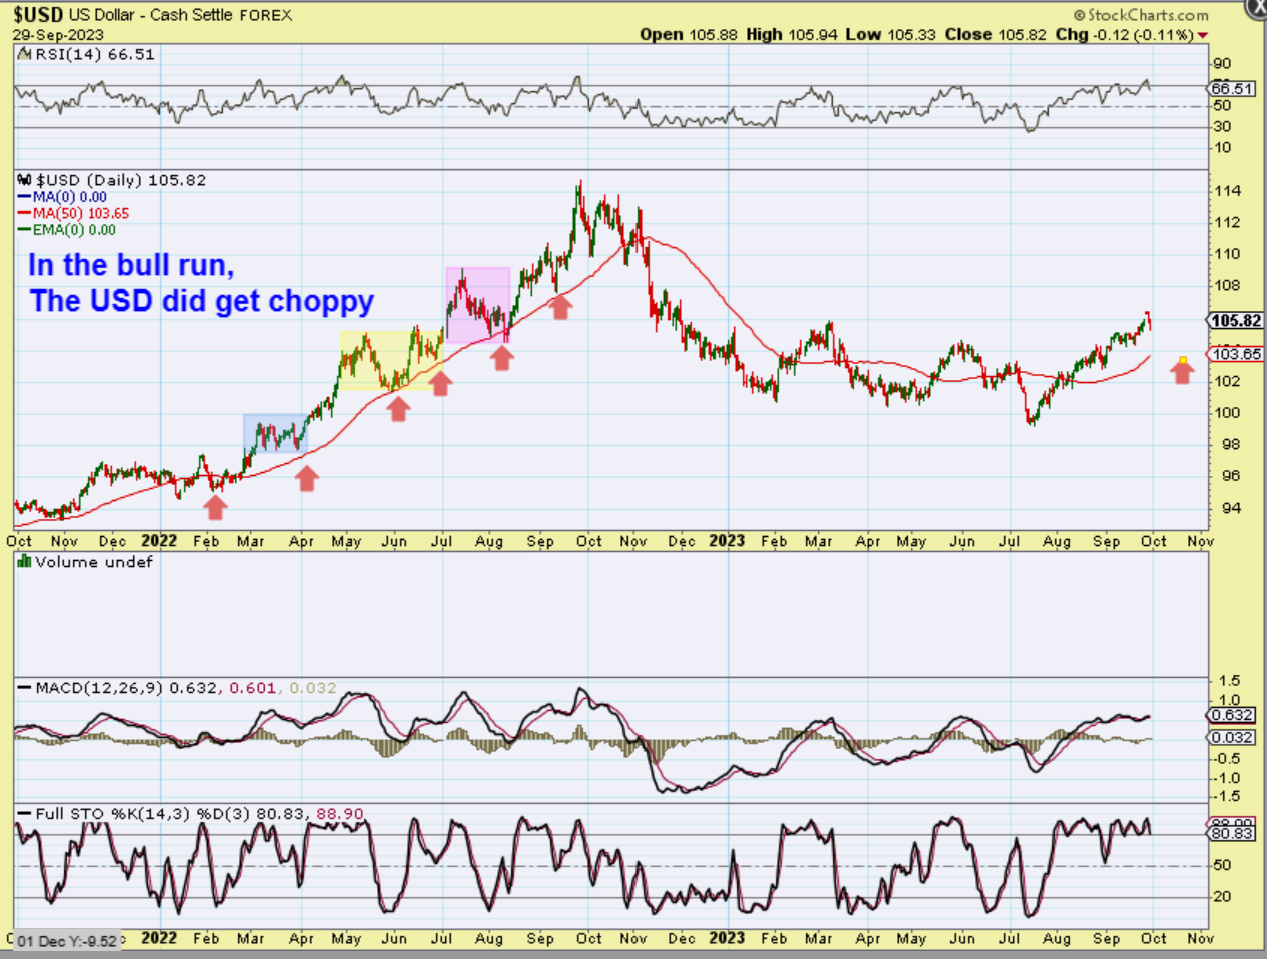
Here I am pointing out the prior bull run for The USD. It had very strong runs higher too, but they all did eventually get choppy and drop back down to the 50sma for weeks when a DCL comes due. We see the USD starting to dip lower now, and a dcl should be coming due. The USD could chop and drop for weeks here too.
.
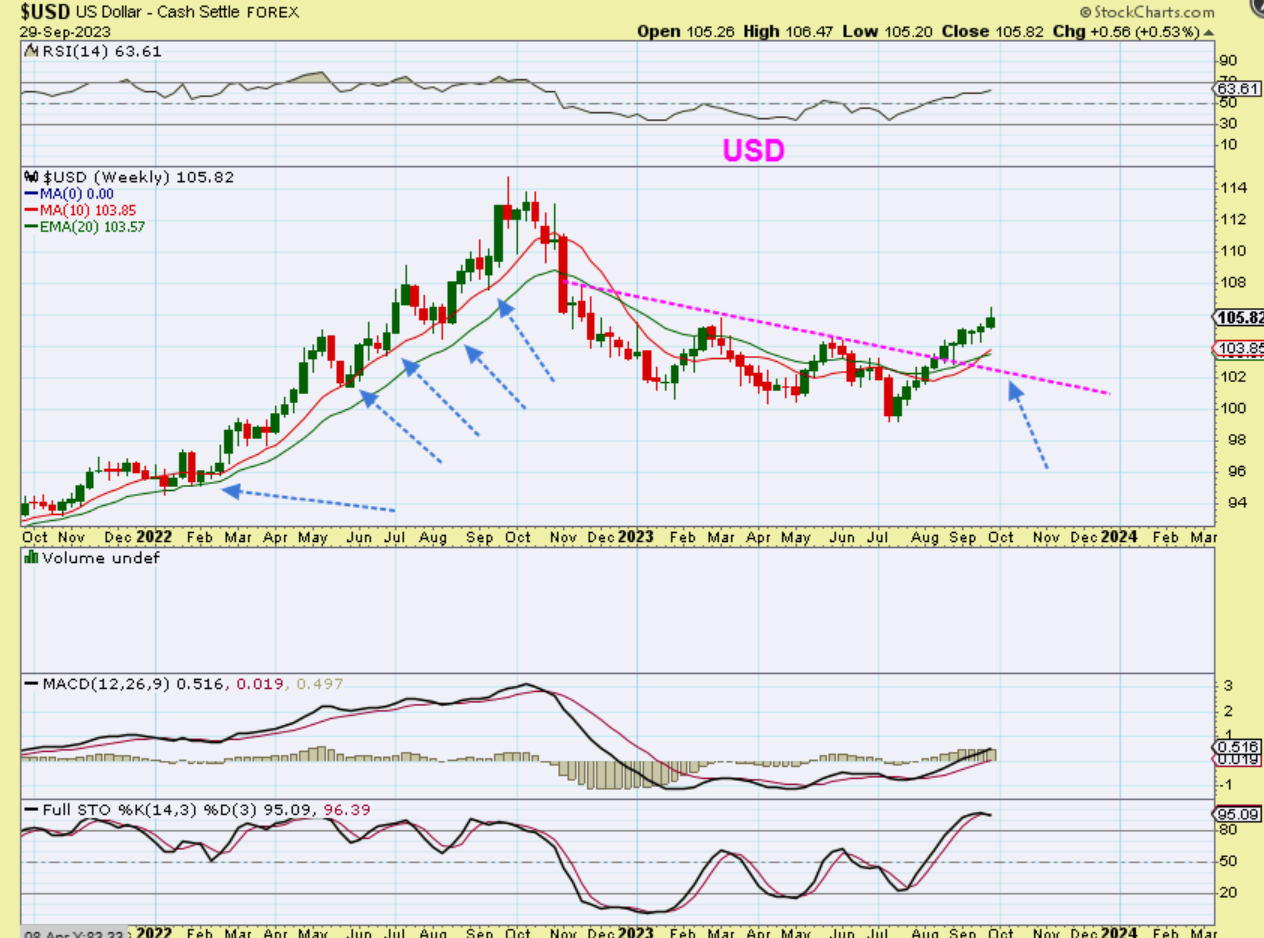
THE USD WEEKLY is now showing a reversal candle after 11 straight weeks higher. We should be seeing a pullback, and we need Gold, Silver, and the Miners to reverse and rally. I’d like to see that as soon as this week.
.
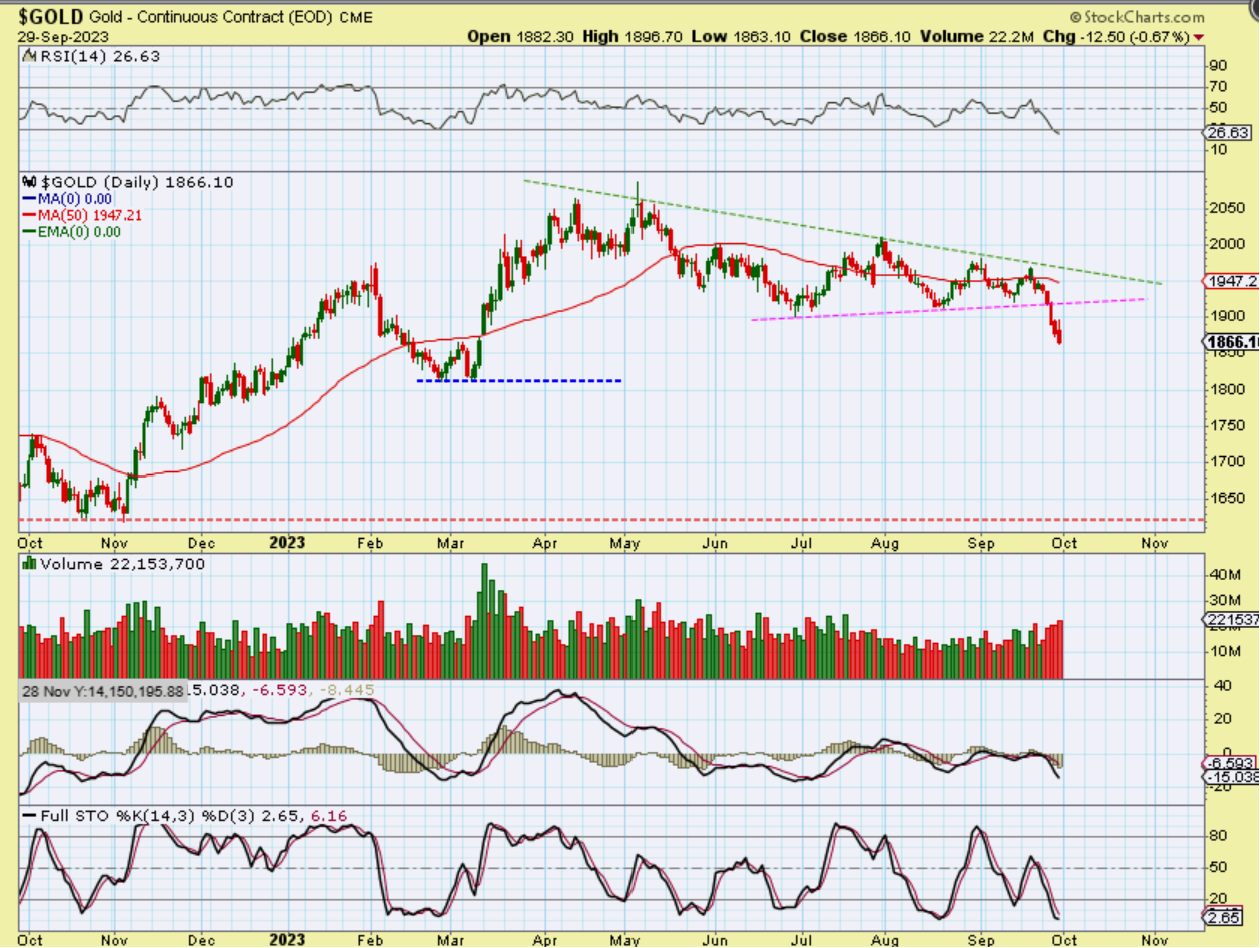
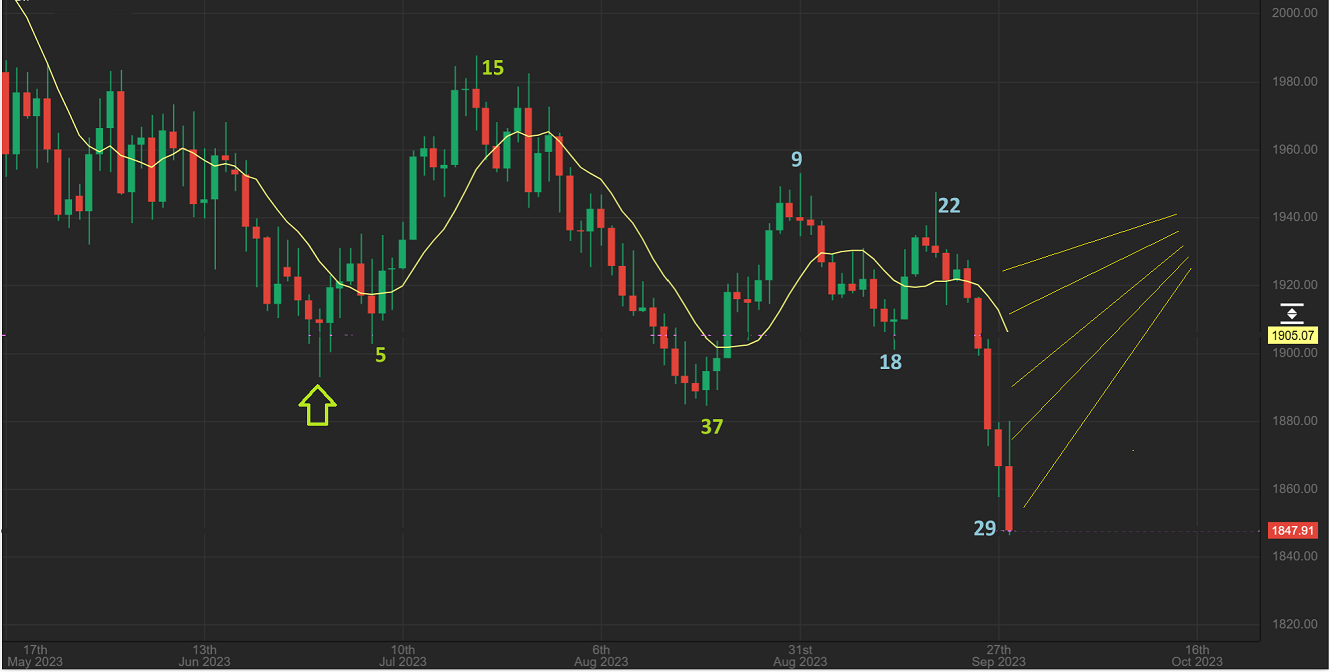
GOLD broke down and it would appear that any ‘stops’ in the $1900 area have now been run. We are within the timing for a dcl and a sharp rally back would give us a shake out. I’ll zoom in and point out cycle count on the next chart.
.
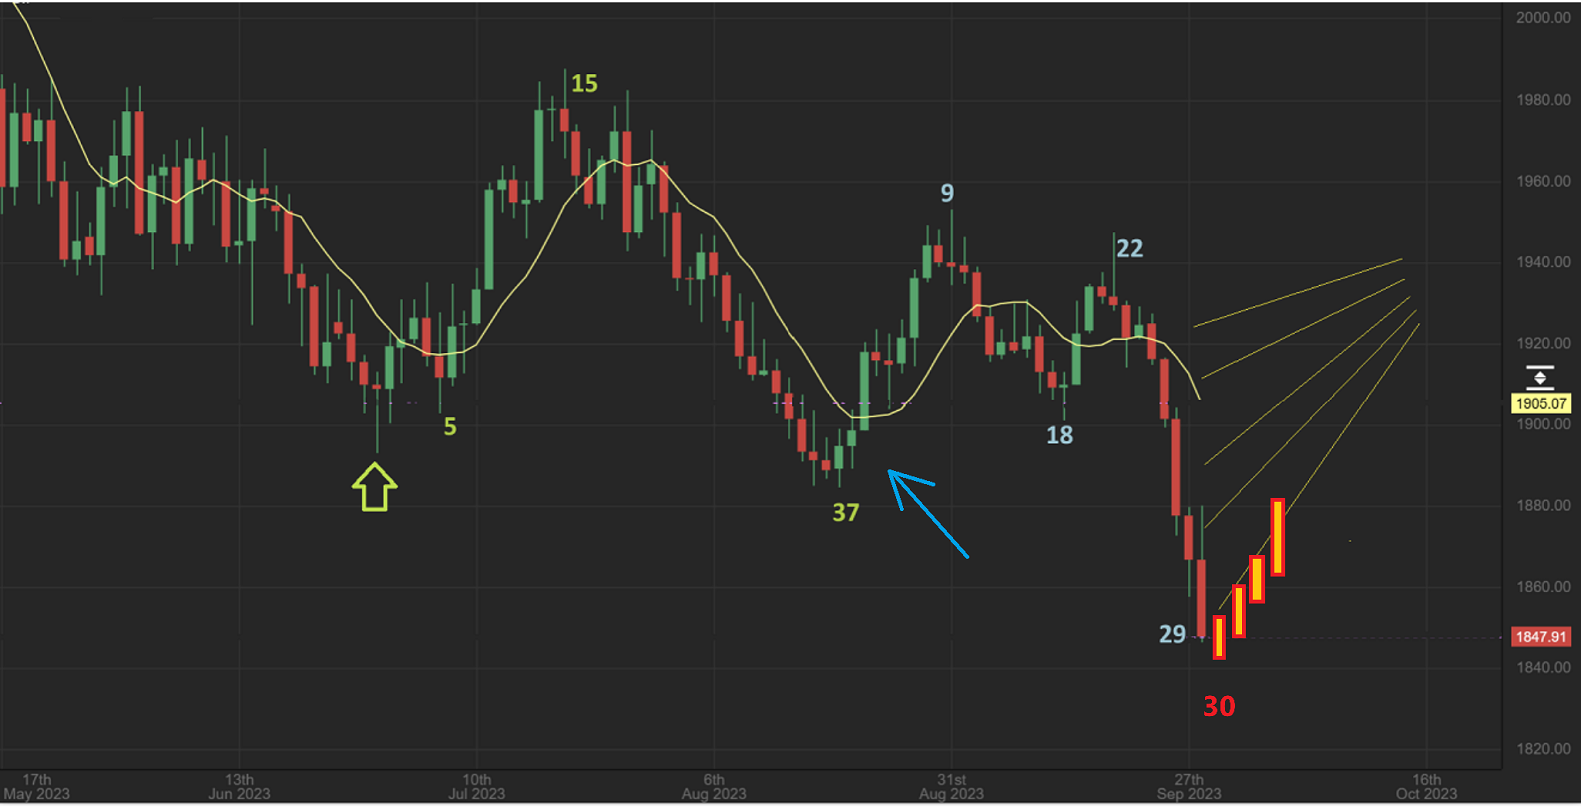
GOLD – So the last daily cycle was a little bit long with 37 days, the next one could be a little short to even that out. We often see roughly 32, so I would say that a bottom could form at any day this week. We’d love to see a swing low form something similar to what I have drawn on my next chart…
.
We’d love to see a swing low form something similar to what I have drawn here. It would involve a slightly lower low for day 30 (Monday) and then price starts to rise as the USD falls. This would be the perfect scenario, but we could honestly see Gold drop to day 32 or more too, so we’ll have to see how this plays out. I AM NOT BUYING YET, BECAUSE THE SELLING IS STILL IN A WATERFALL ACCELERATION.
.
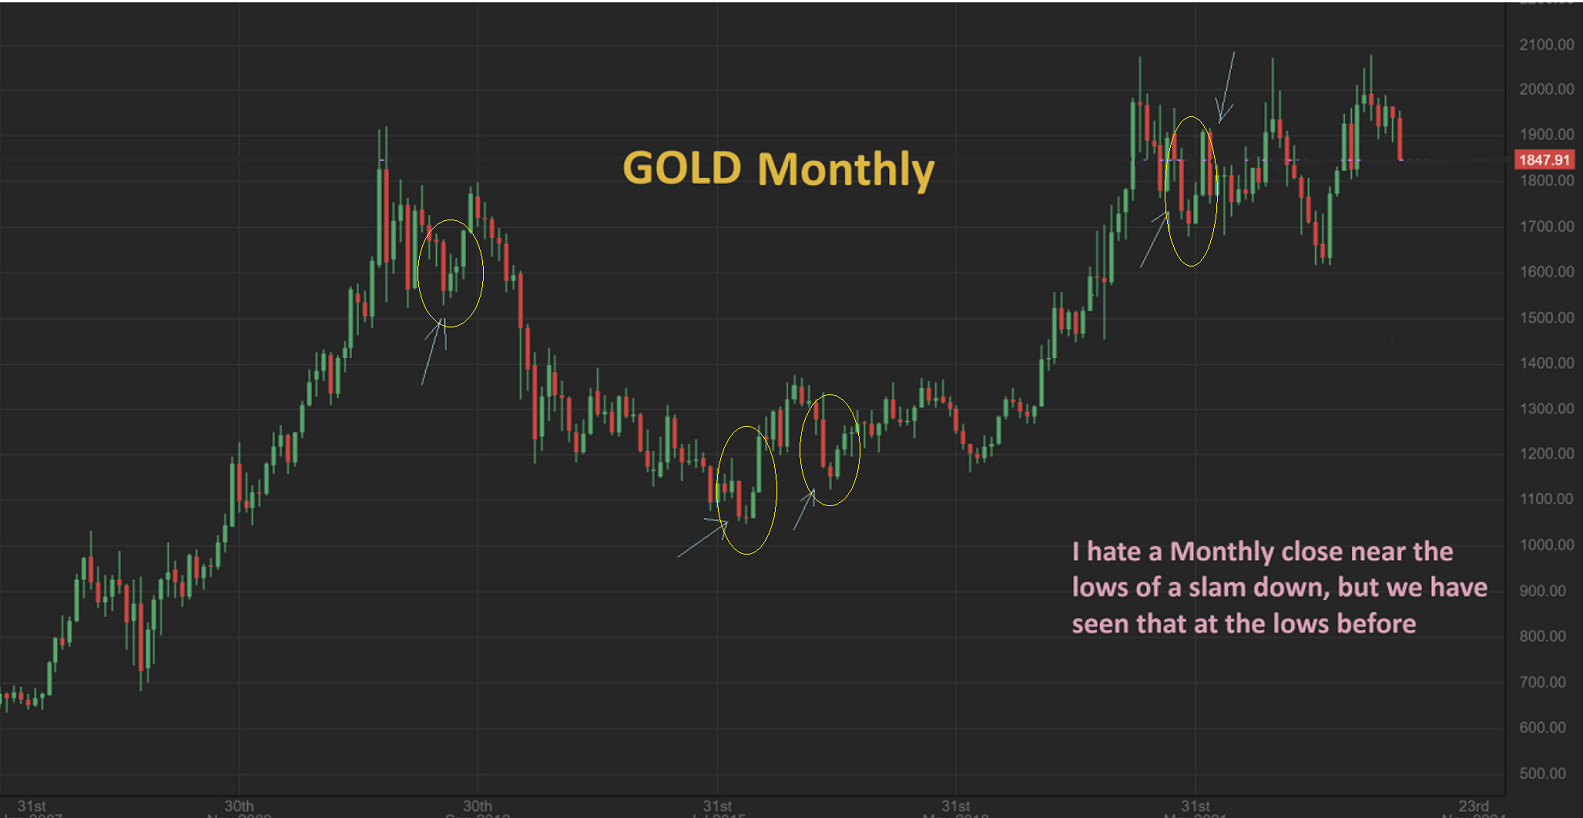
September ended last week, so when we look at the Monthly chart of GOLD we see a sharp drop. A big red candle. This is unfortunate, because Gold was holding up very well with that 11 week straight up rally in the USD. It was only this week that Gold suddenly gave us this large red candle. Honestly, this is ugly, but a quick reversal higher would help.
I have placed blue arrows on this chart to give a few examples of a big ugly drop that reversed quickly, so it can happen. The ones I circled were DCLs or ICLs too. and we are due for a dcl too.
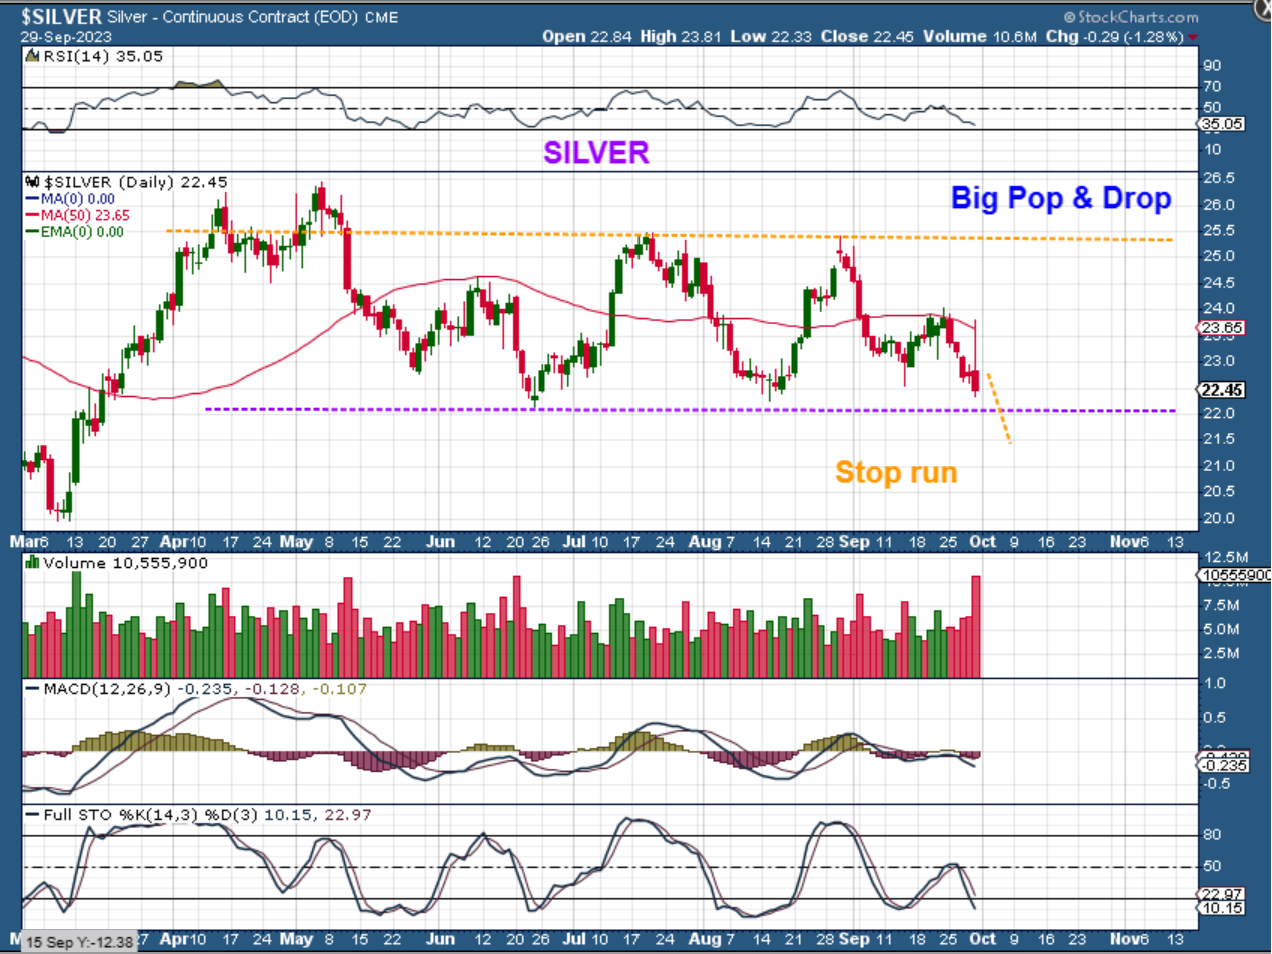
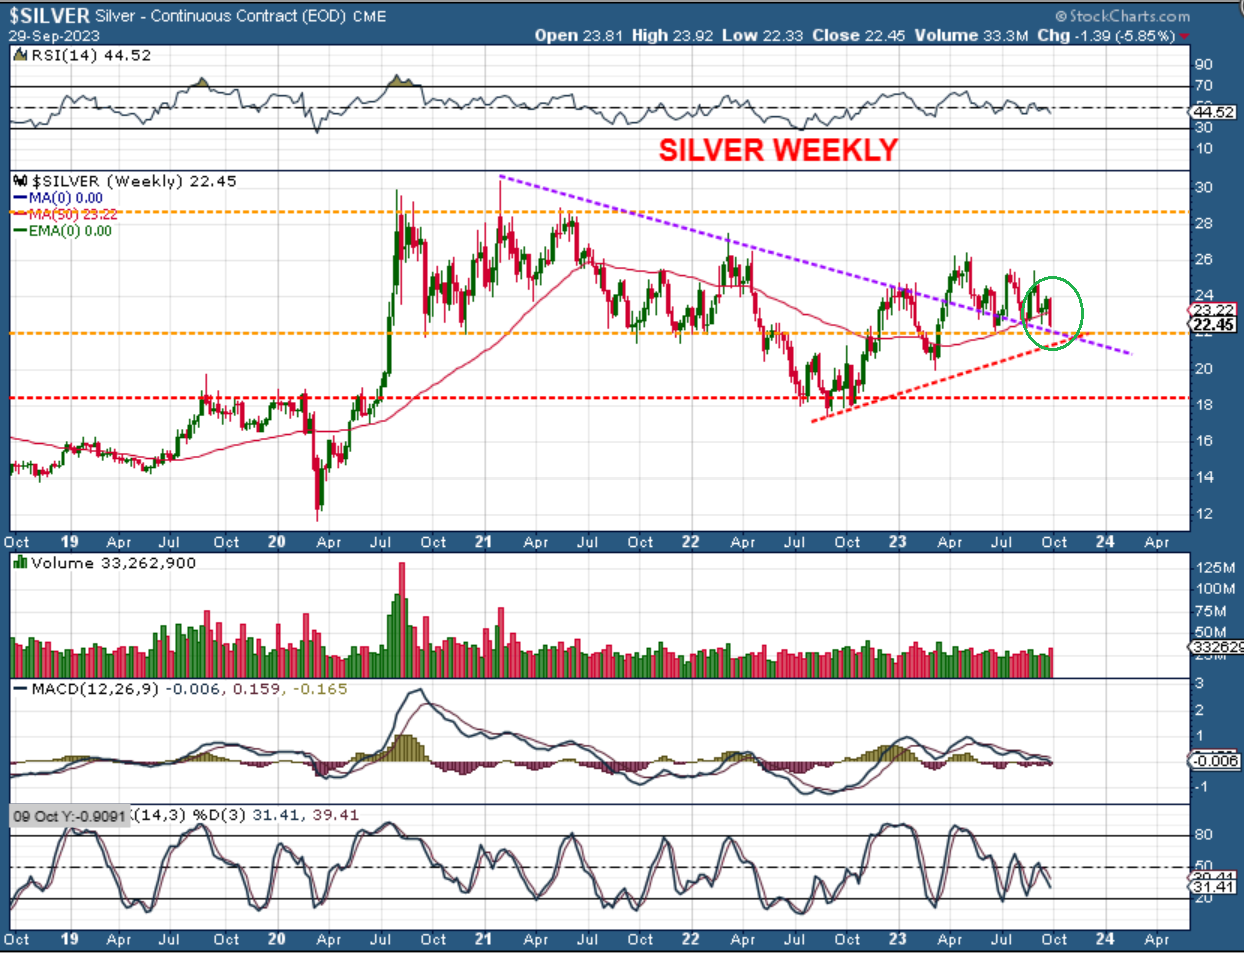
SILVER surged in a BIG way on Friday, only to sell off and give it all back. That was ugly too, but that could be a gravestone doji . I have actually already been calling for a possible shake out or ‘stop run’, so that would happen next week and hopefully be followed by a reversal higher.
.
The Big Picture for SILVER: We have many trend lines below price, let’s see if they can act as support. The red and purple ones seem to converge at roughly $21.50-$22.
.
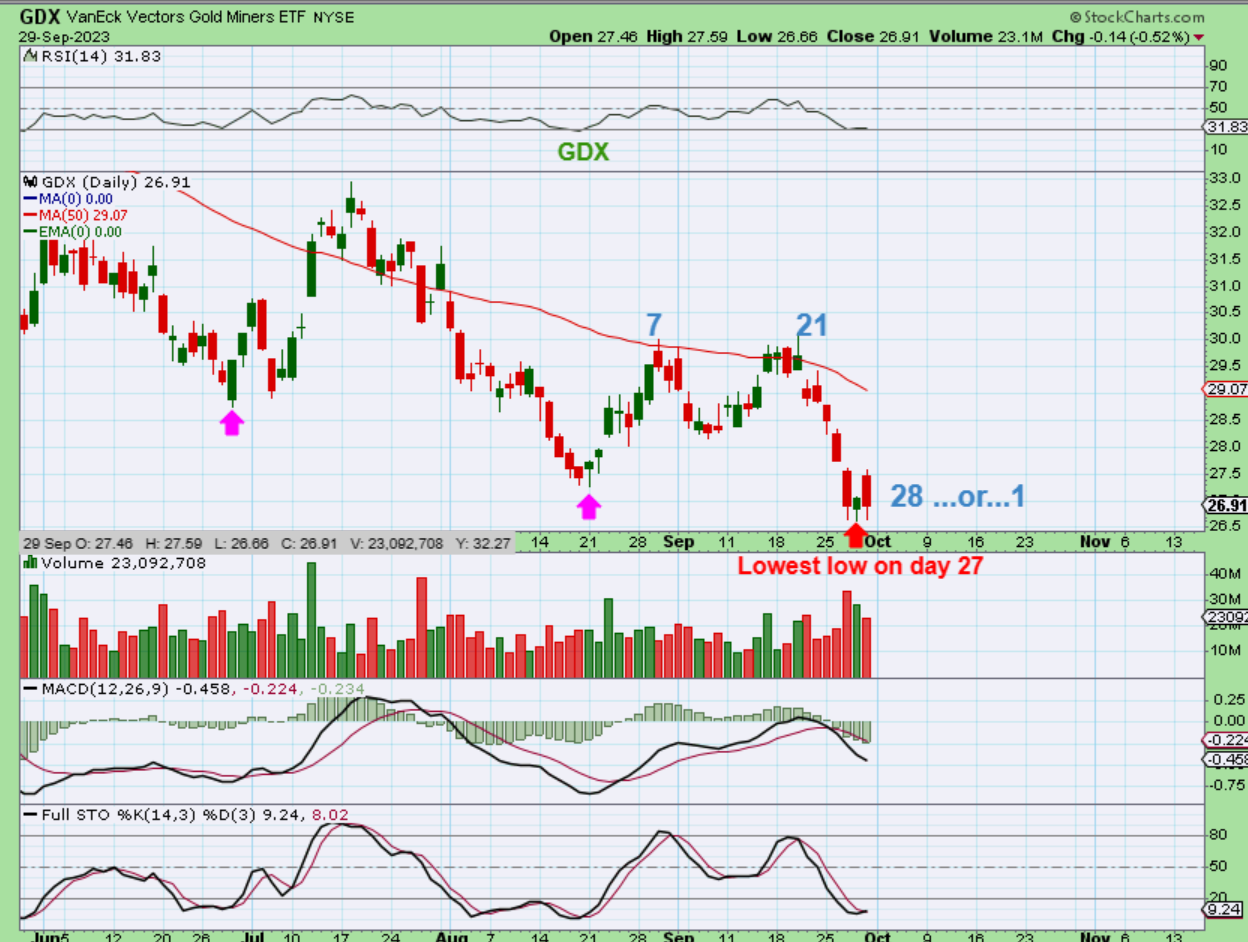
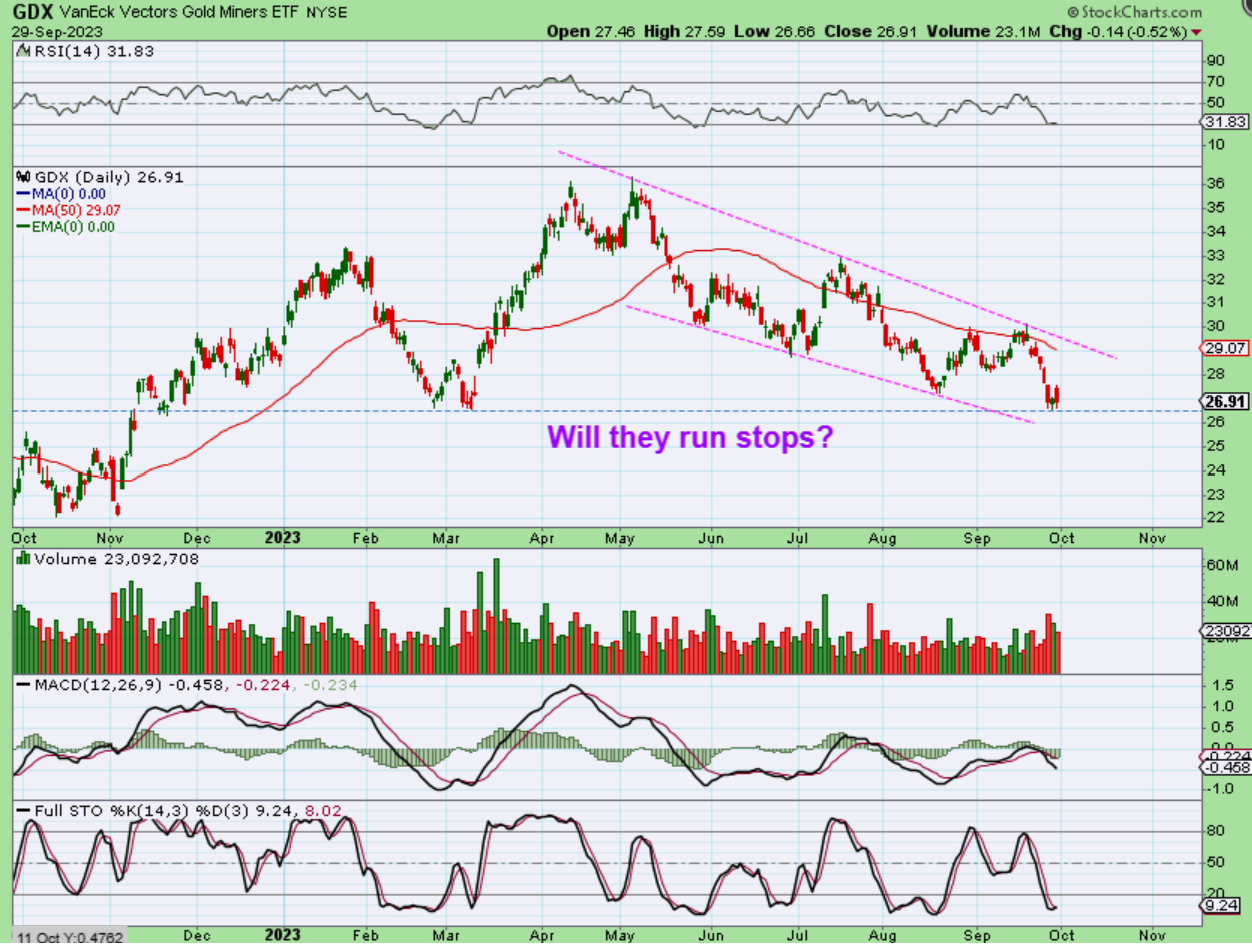
REMINDER: GOLD SOLD OFF IN AN UGLY WATERFALL ALL 5 DAYS LAST WEEK. DID GDX? I did expect a drop into a dcl, so I said that we could expect selling last week into maybe Tuesday of this week, but with Gold looking like this? GDX should have been taken to the slaughterhouse.
.
GDX is dropping into a rather normal looking dcl or ICL. We do have a swing low with a day 27 low, but it is not confirmed, and so it can drop further if Gold does. So…
.
GDX dropping to that lower trend line would run the stops on the March lows, so we’ll see if that happens or not. We do have more time for this to drop if it wants to. There is good divergence on the MACD, but it is best to let this selling in the sector play out.
.
We are seeing that the General Markets are trying to bounce, but the timing seems to be too early for a dcl or ICL. If the Markets do break out higher and a low starts to be confirmed, that will be in the daily reports. The Precious Metals, however, seem to be in the capitulation phase of a drop into an ICL. They are near day 30 and since the last daily cycle did run a bit long, this capitulation phase may find exhaustion this week. We could see a swing low form, shorts may start to cover, and a rally higher would unfold. Along with this is chart of the USD that pointed out that it does get choppy and drop each time a dcl comes due. That could help to reverse Gold.
.
Below I want to just mention a couple of other related things. I hope that all had a great weekend, and thanks for patiently waiting for this weekend report. I was with friends and traveling a lot, but I’m back home now and looking forward to seeing how things play out, this late in the Precious Metals daily cycle.
It looks like we have a big week ahead of us! 🙂
.
~ALEX
.
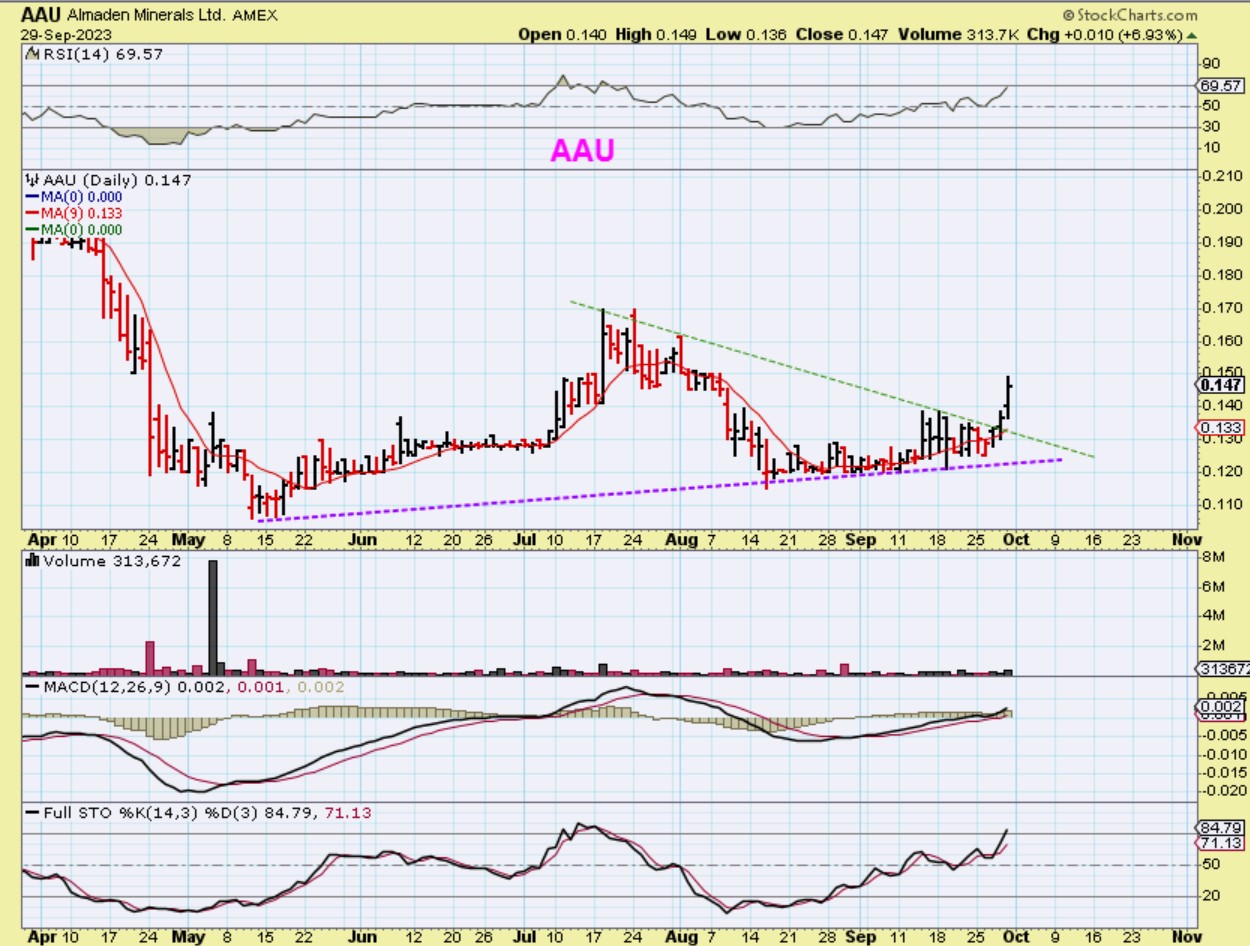
AAU – It is hard to believe that we are seeing this in what a 12 cent Miner, when Gold ws cascading down, but maybe it is something positive to behold.
.
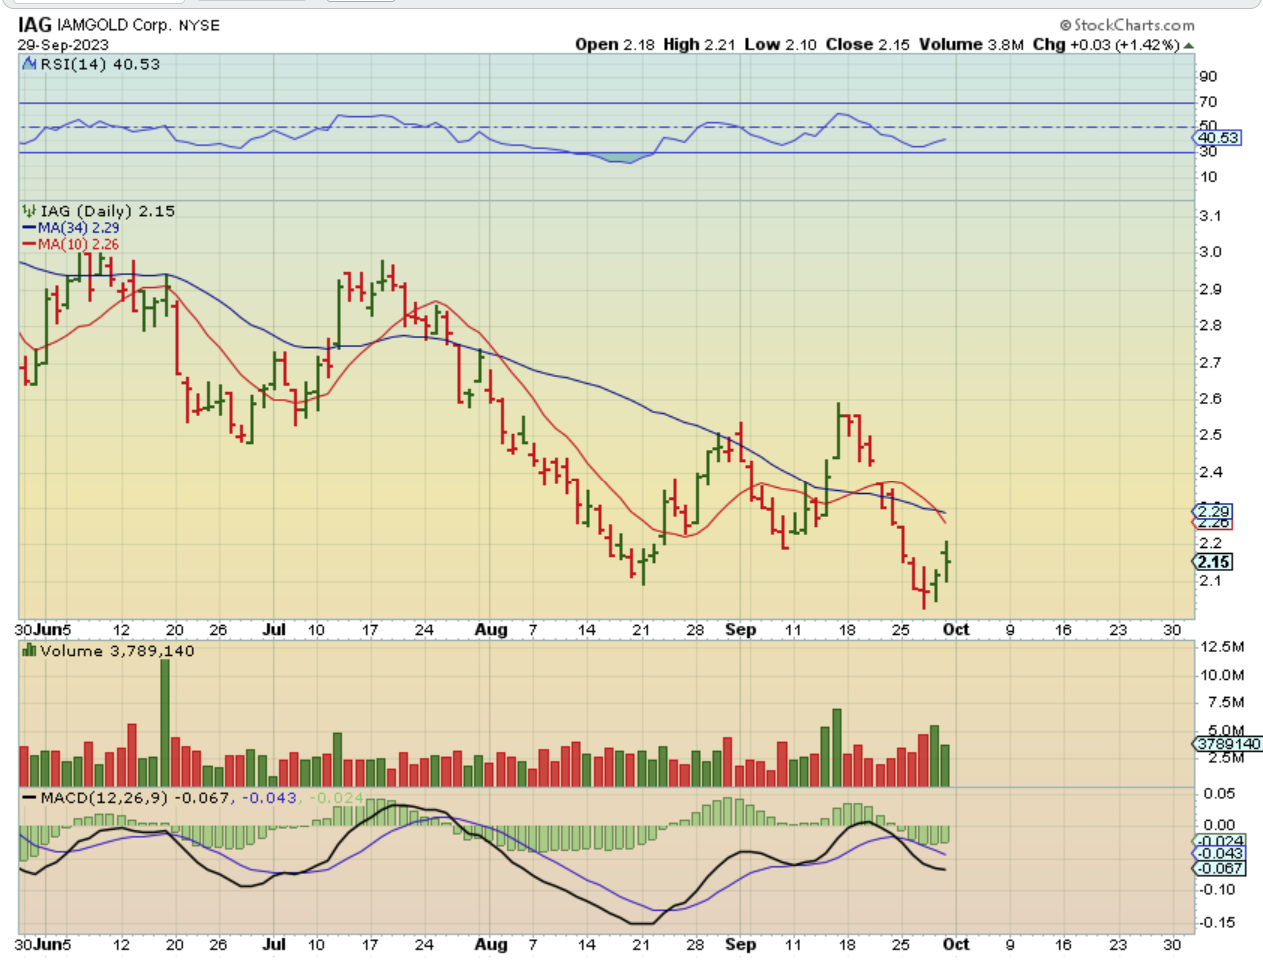
IAG – Gold was slammed down big time all last week, all 5 days, so you really would expect all miners to be getting killed too. IAG has good looking divergence and it only made slightly new lows. On top of that, it bounced Thursday & Friday when Gold continued to crash. These are likely signs that a bottom is near.
.
SIDENOTE: Buy the dips…
.
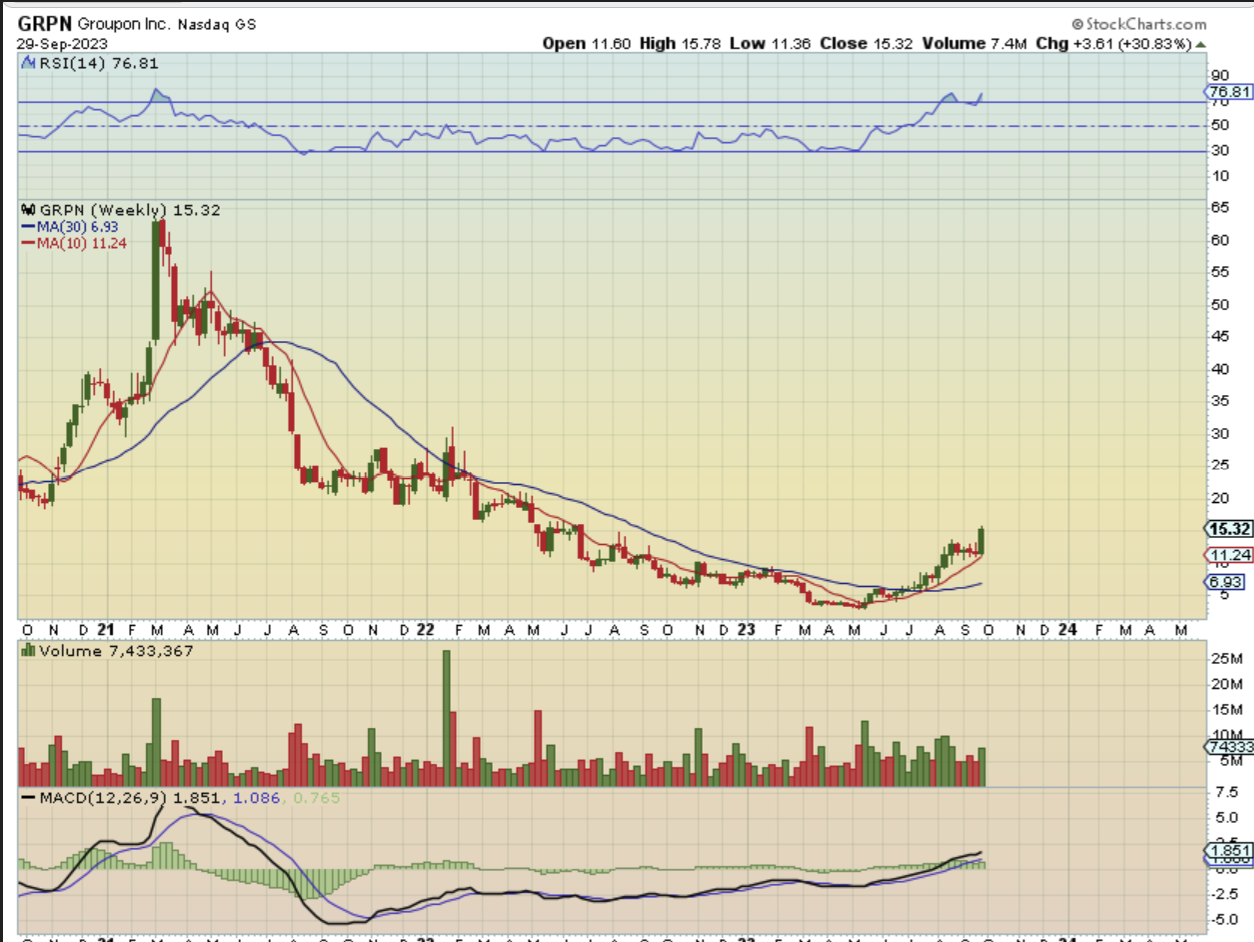
GRPN DAILY– I’ve been discussing the bullishness of GRPN, so I just wanted to show that after that recent cup shaped consolidation that I have been pointing out, it broke out on BIG Volume and was up 14% on Friday. Buy a dip to support. Also…
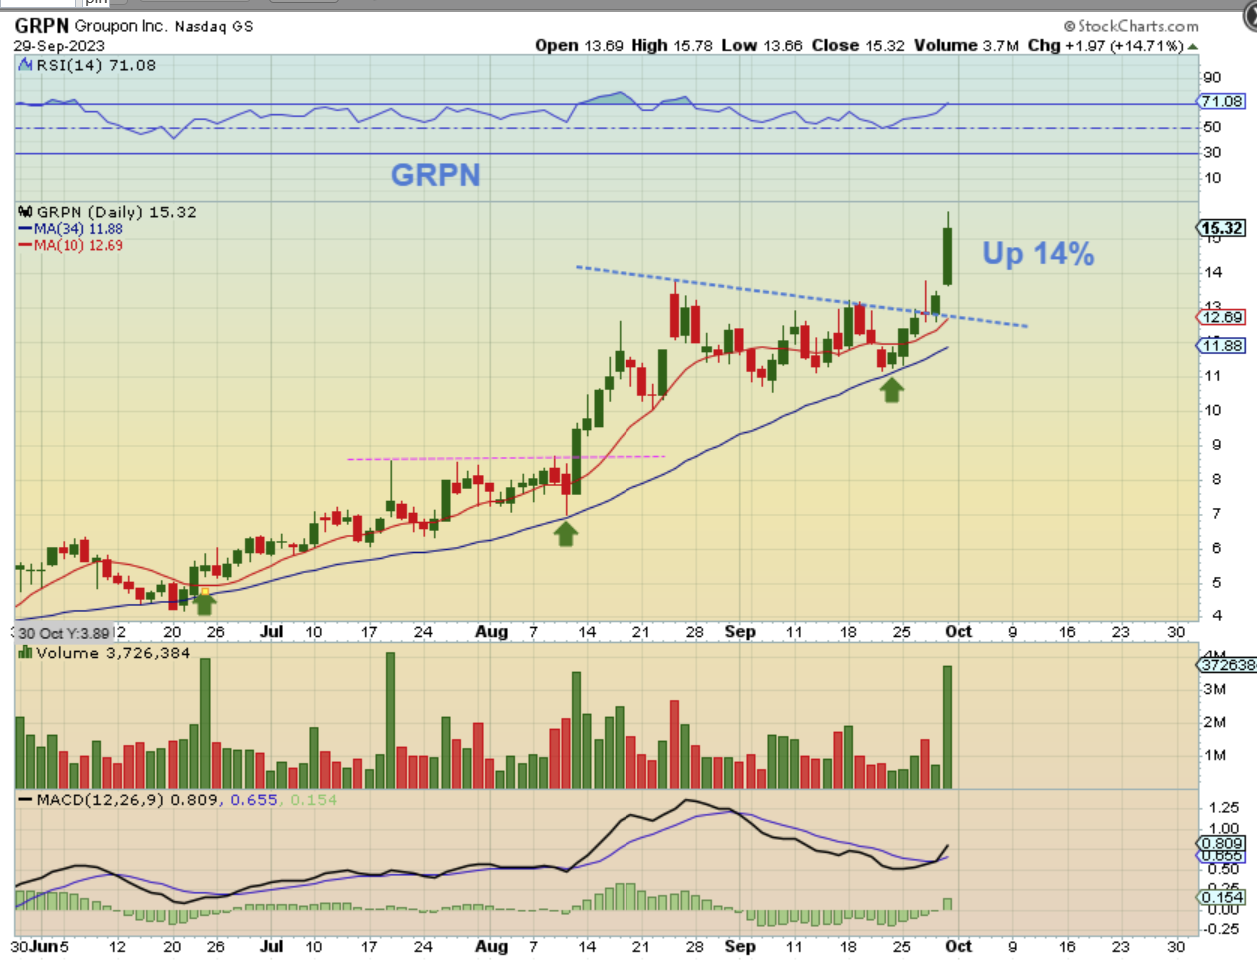
.
GRPN WEEKLY– That caused the weekly chart to run up 31% for the week, and that was during bad market conditions. If this continues over time, the potential gains that it offers are big, as seen on this chart with a former price of above $60. It will be choppy, it will rise and fall, but over time it may be a nice bull run.