
September 16th Weekend Report
I just want to start off this Weekend report with the good news that the Precious Metals Sector really seems to be showing a bullish character, and that was after the CPI and PPI Data was released and the USD remained strong. We do have a Fed Week next week, but this set up is bullish heading into the FOMC Meeting, and I take that as encouraging. Lets review our past week…
.
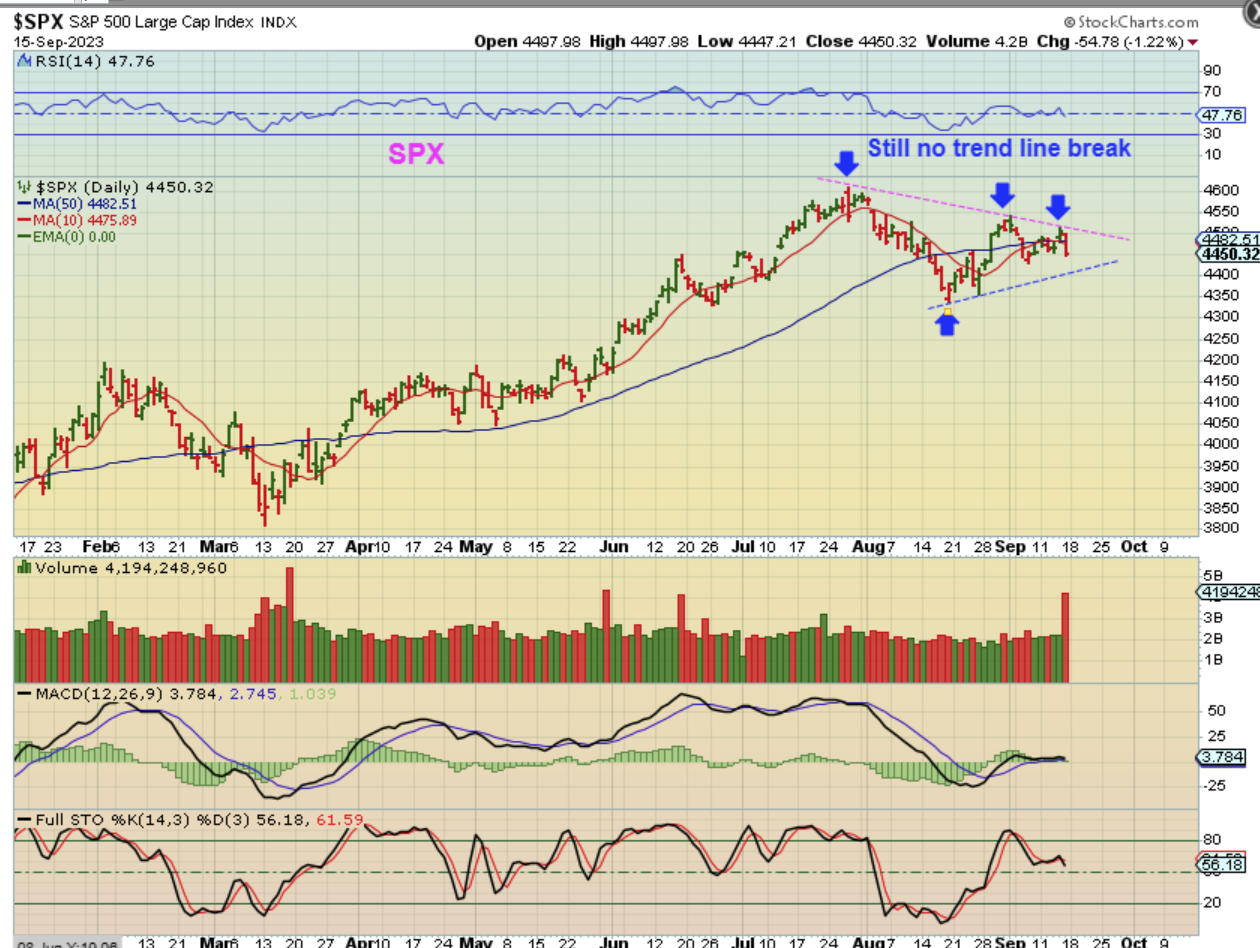
SPX DAILY – We were looking for a close above the 50sma and a downtrend break to confirm that an ICL is in place with our last dcl. Friday the General Markets dropped, so we may still have more chop inside of this triangle formation, or we may have more downside into the real ICL.
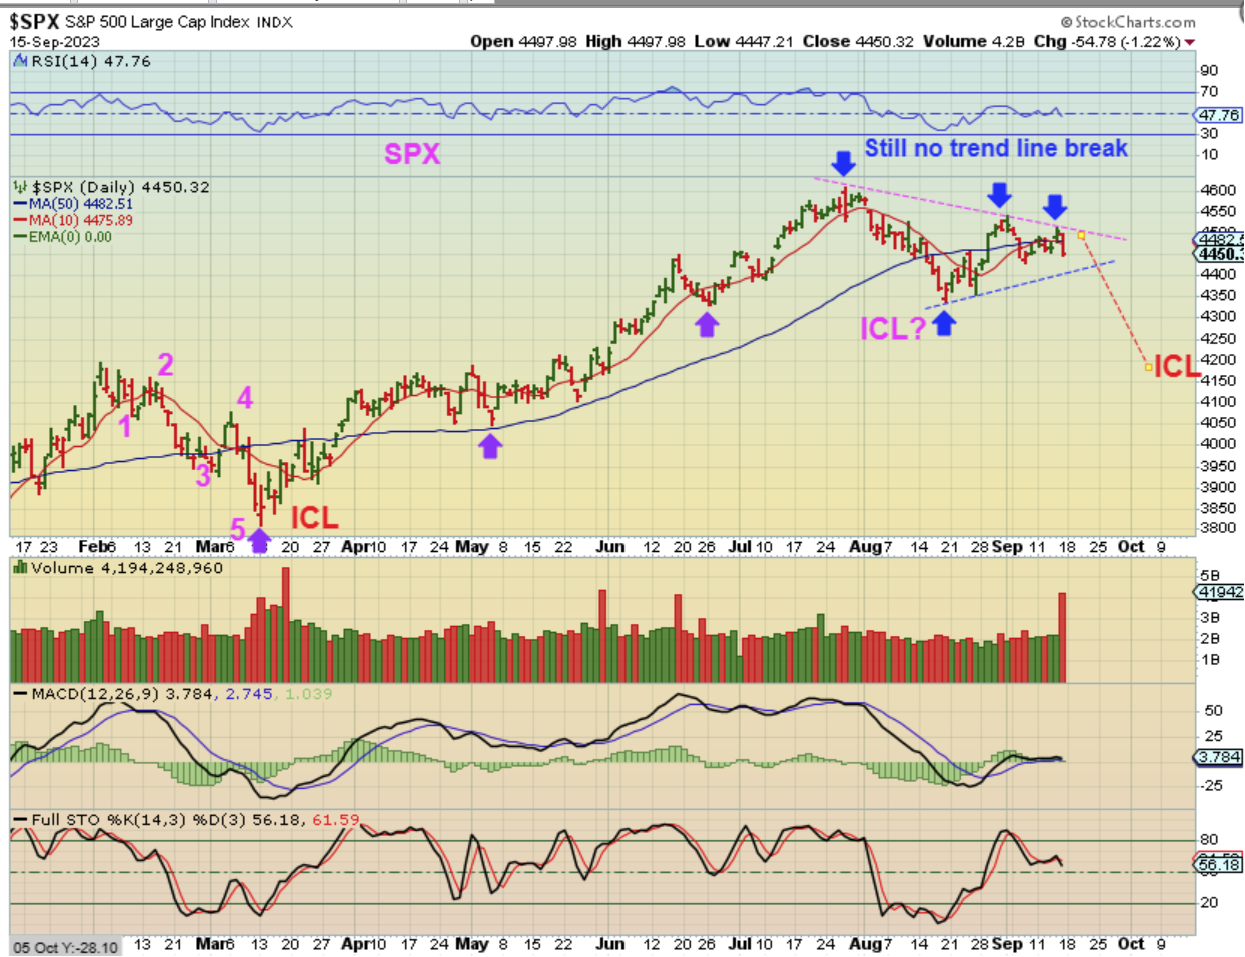
SPX DAILY – At this point we have day 10 peak at the 2nd arrow, and that is a L.T. daily cycle so far. A break down from here would indicate that this is a L.T. final daily cycle dropping down into an ICL. I do look for the A-B-C drop into an ICL (sometimes we see 5 waves clearly too, like we saw in Feb & March, so…
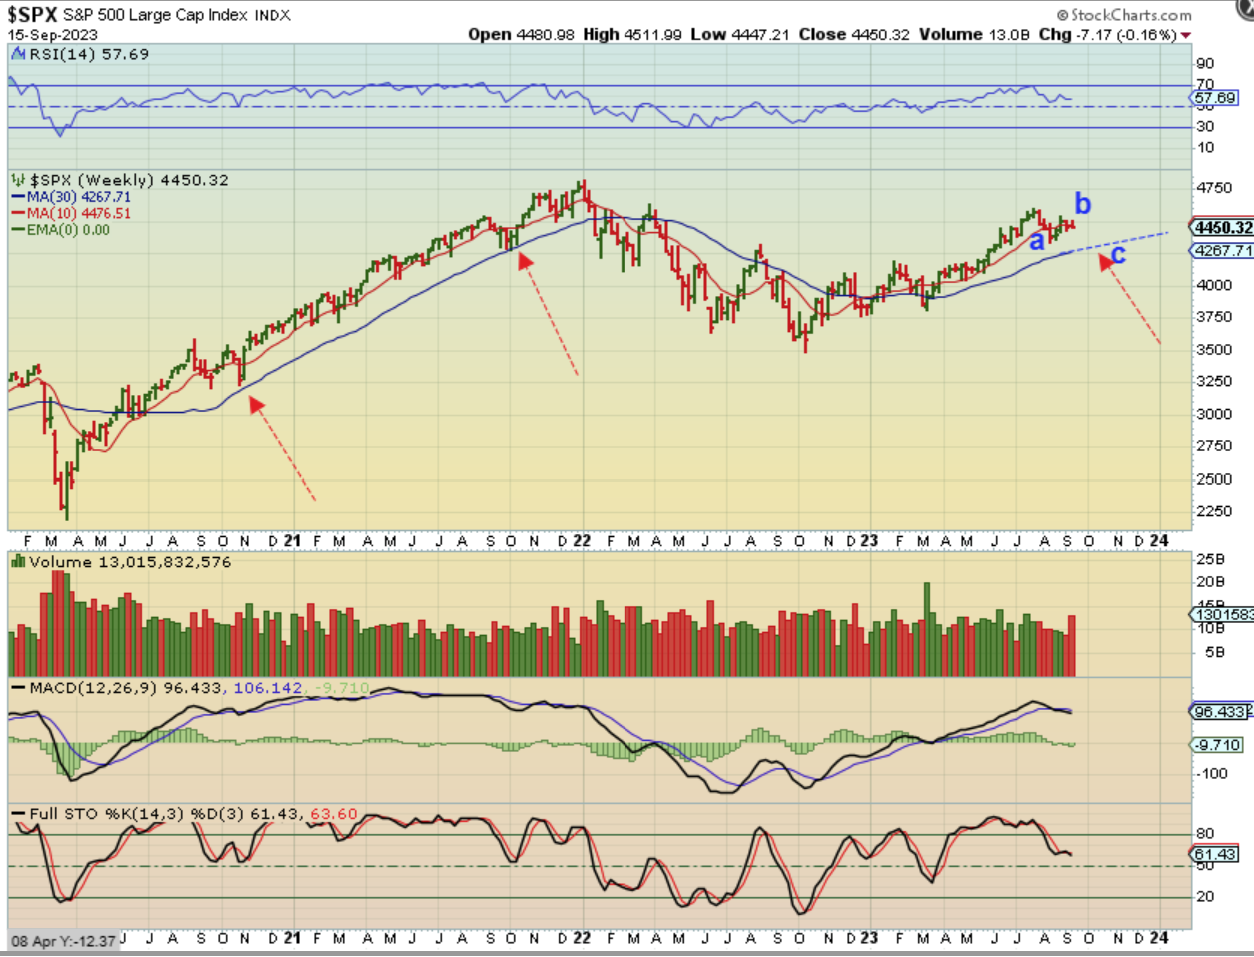
SPX WEEKLY – On the weekly an a-b-c drop could lead us to the 30 week ma, and that is still normal price action in a bull market.
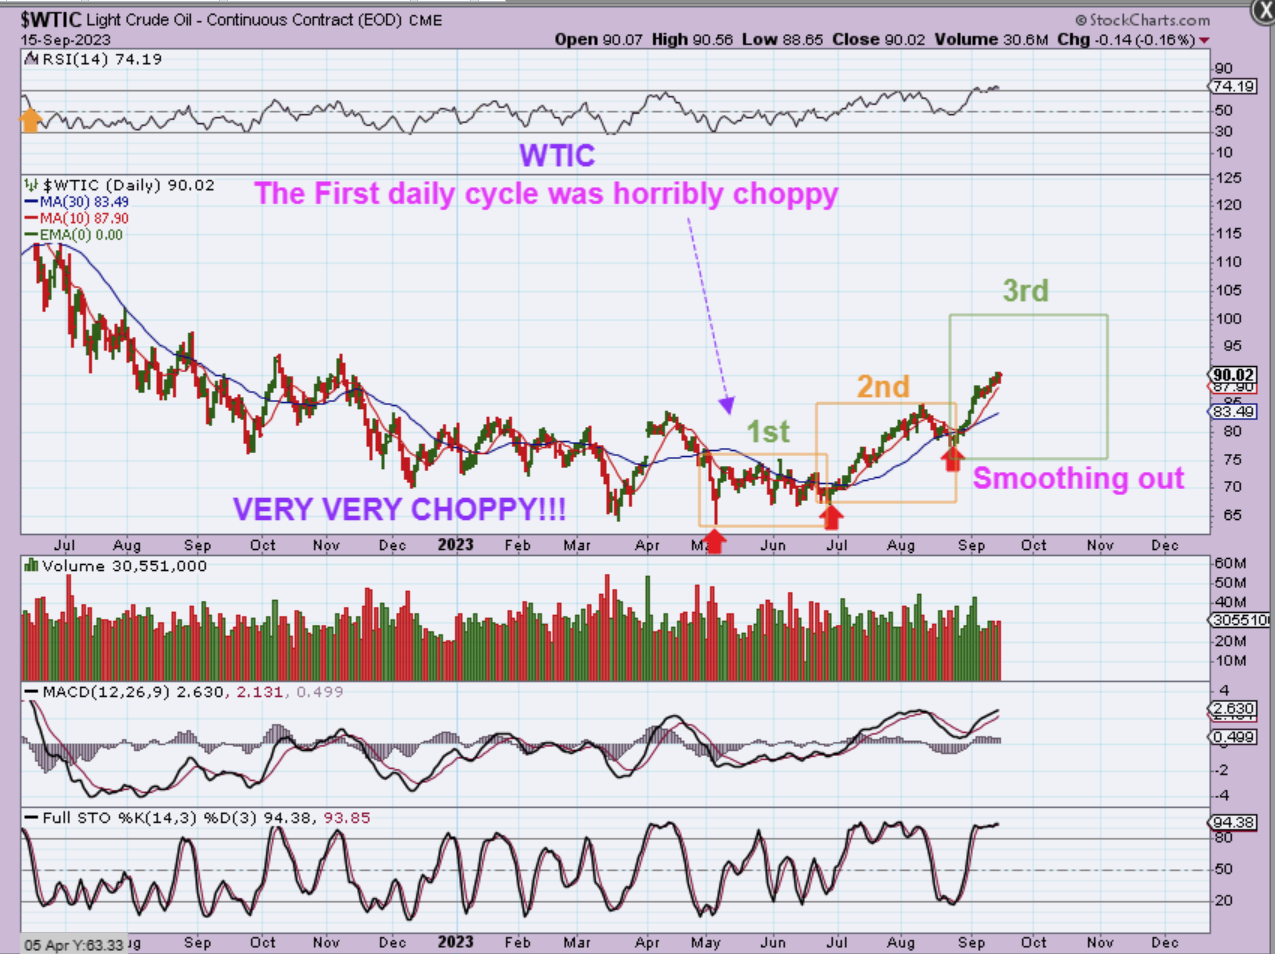
WTIC WEEKLY – Oil has been bullish and continued to run higher this week by gaining almost 3%. This looks clearly bullish with the recent run higher out of the lows, but I want to show you something about Oils bottoming process that can act as a great lesson.
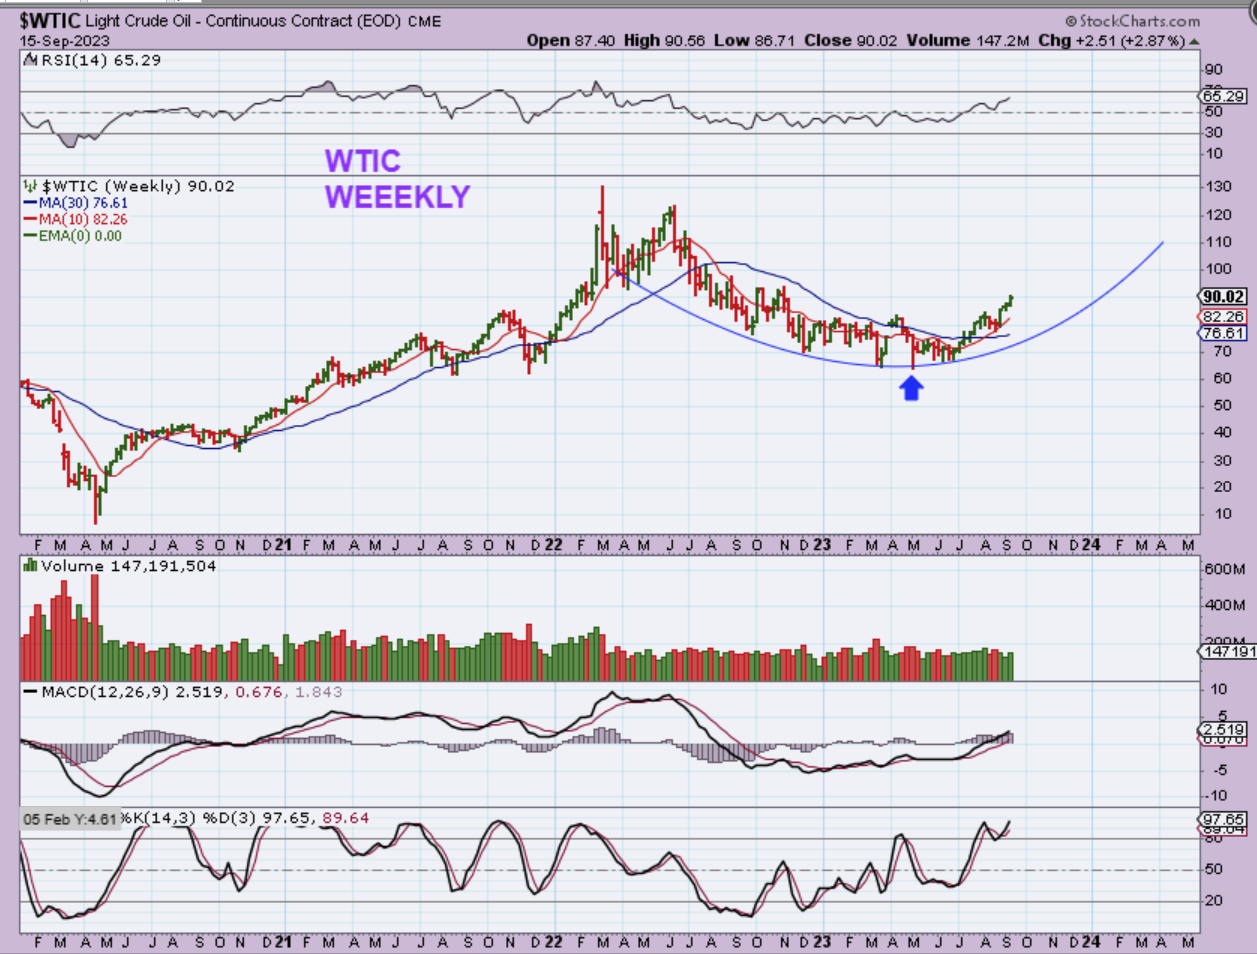
WTIC DAILY – Do you remember how HORRIBLY CHOPPY this bottoming process was? Daily cycle after daily cycle had false starts and Pop & Drops. It was bottoming. Now look at that First daily cycle. After the ICL Oil went completely sideways in a very choppy non money making move. It was Daily cycle #2 & #3 where the money is being made. THAT IS THE LESSON, and it may apply to Gold right now. So…
.
After the ICL
1. Oil went completely sideways in a very choppy non money making move.
2. The 2nd & 3rd daily cycle were nice gainers for Oil.
3. THAT IS THE LESSON, and it may apply to Gold right now. Even if the First daily cycle appears weak and choppy, and you hear people saying that “This will never run! This is weak and pathetic.”, just remember that sometimes the 2nd & 3rd daily cycle can be short covering that leads to a buying frenzy too. I have seen this kind of choppy low in the first daily cycle with Gold in the past too, I promise. A strong rally followed.
.
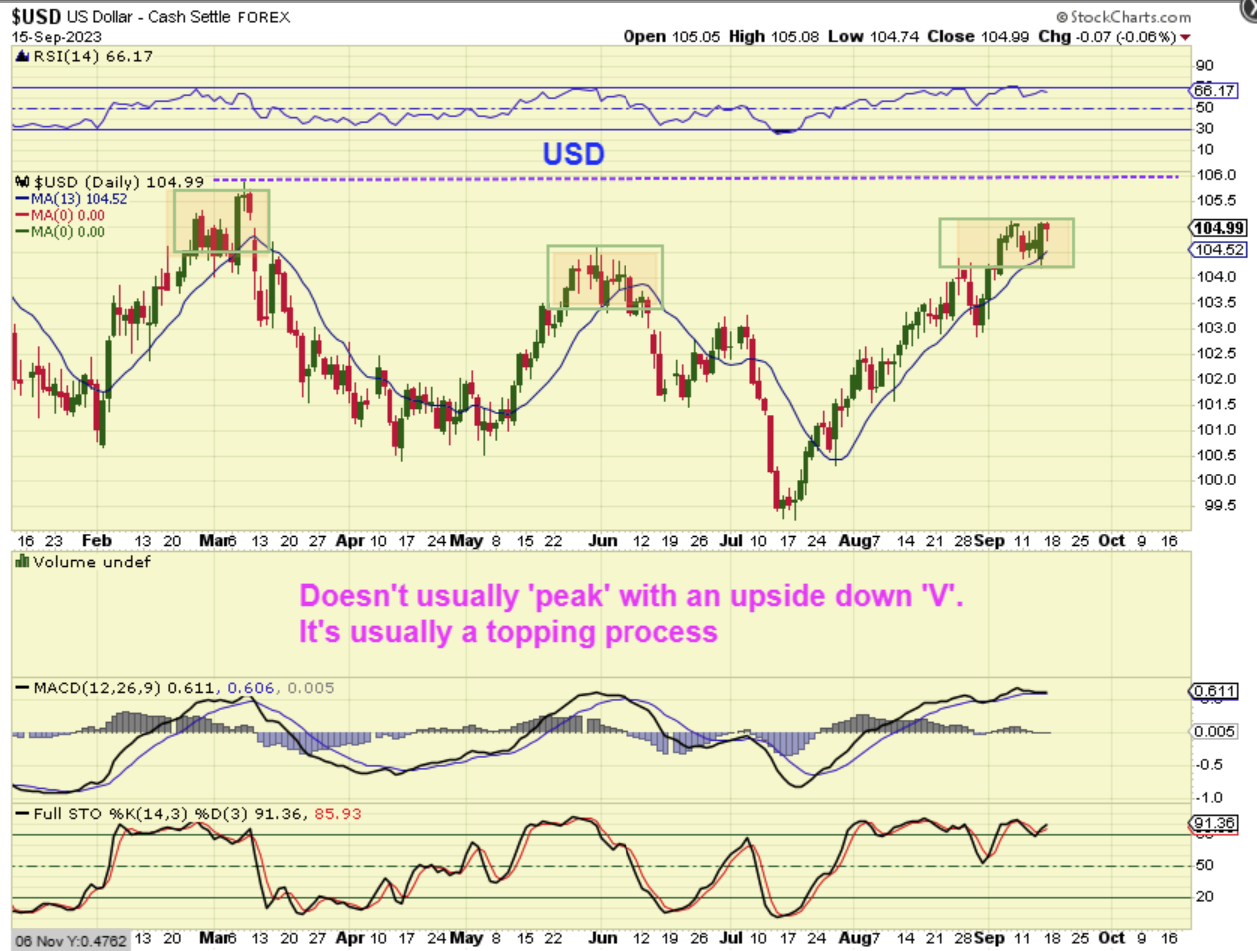
USD DAILY – On Thursday the USD surged higher and on Friday we may have a topping candle, but one thing that I want to point out here is for you to take a look at that strong Thursday candle. On that day, the Miners pushed higher too, as you’ll see on the next chart.
.
Notice that The Miners pushed higher pretty much all week, despite the strong USD. That is encouraging!
.
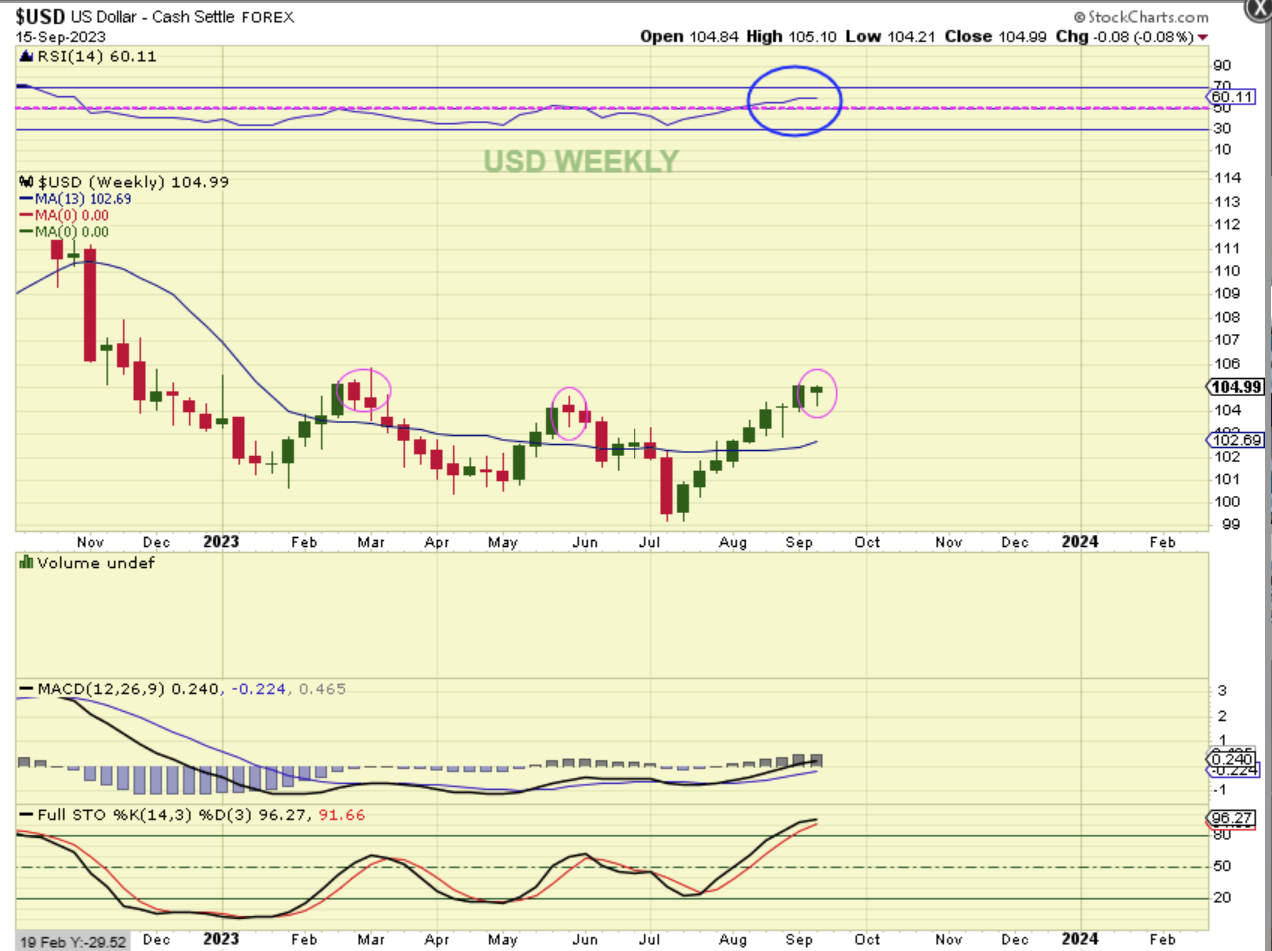
USD WEEKLY – The USD Weekly chart shows us just how strong the USD has been. Even in the last bull run I don’t see 9 weekly green candles in a row, and the RSI has now reached 60%, so it has been very strong. At this point, that might finally be a topping candle and that would mean that the USD may pull back on the week of the fomc mtg.
.
Noteworthy:
.
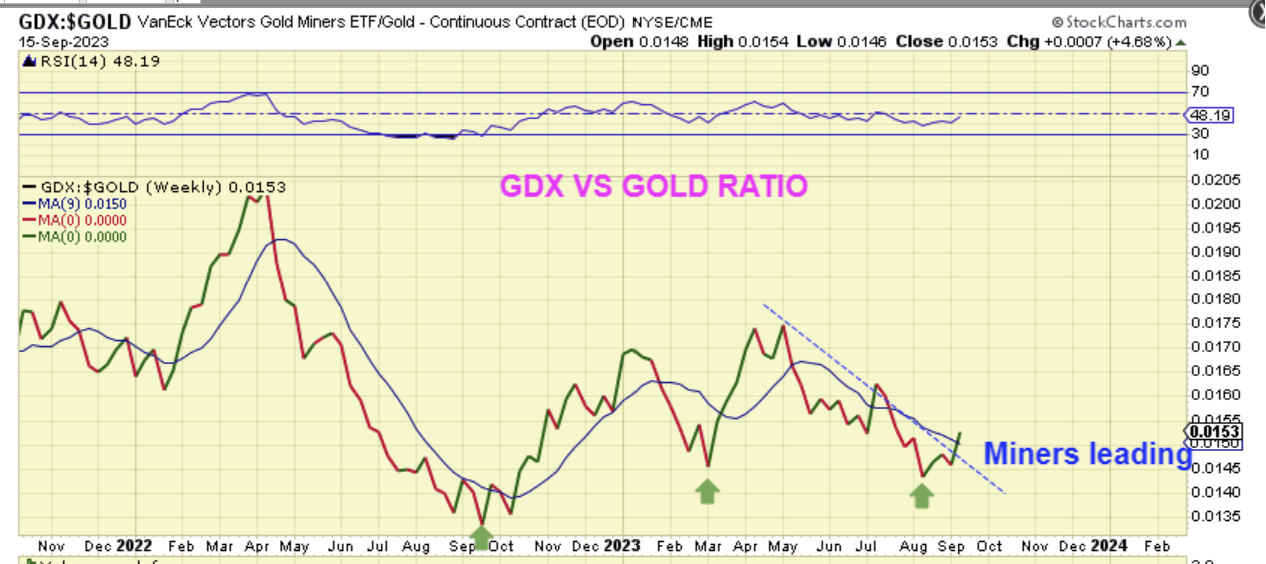
GDX / GOLD RATIO: When a bull run starts in the precious metals sector, you want to see Miners lead the way. That means you want to see the GDX/GOLD Ratio bottom and curl higher. This indicates that Miners are leading the way. We are seeing that change take place and we especially saw that this week when, as Gold and Silver sold off, the Miners did not.
.
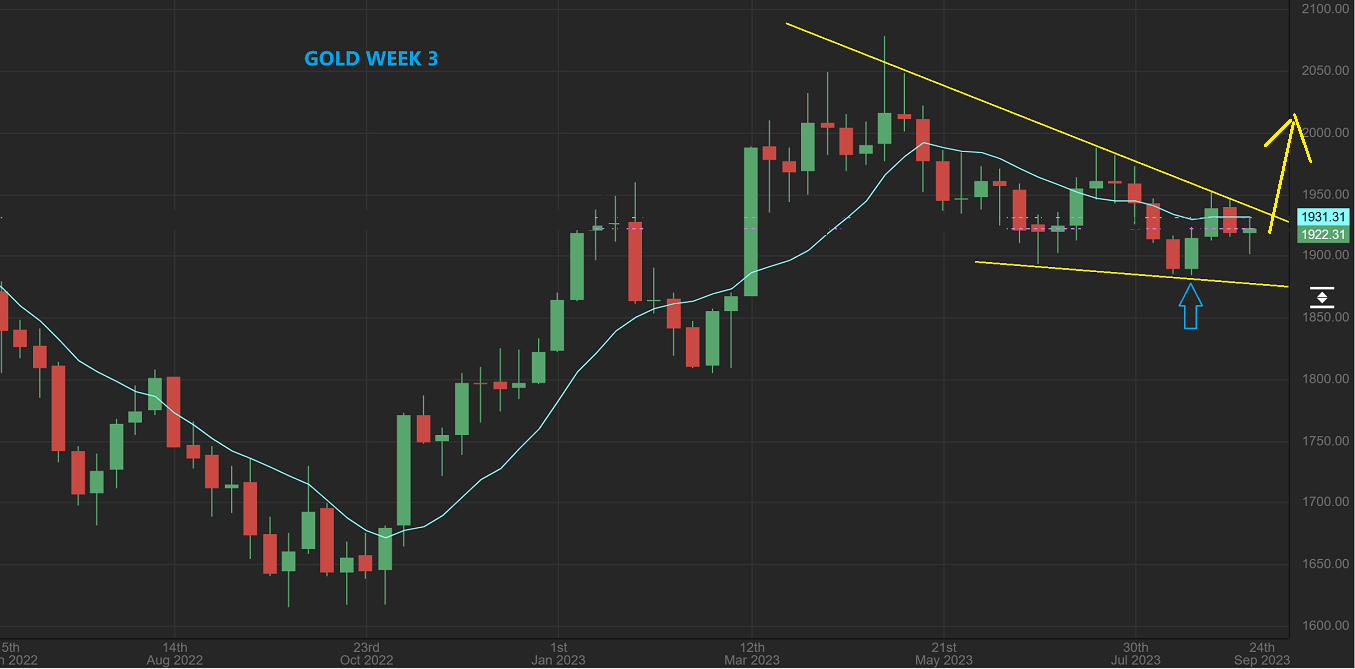
GOLD WEEKLY – So Gold sold off lower last week and then started to recover, which gives us a hammer candle. That may be a bullish hammer and it could prepare Gold for a breakout higher.
.
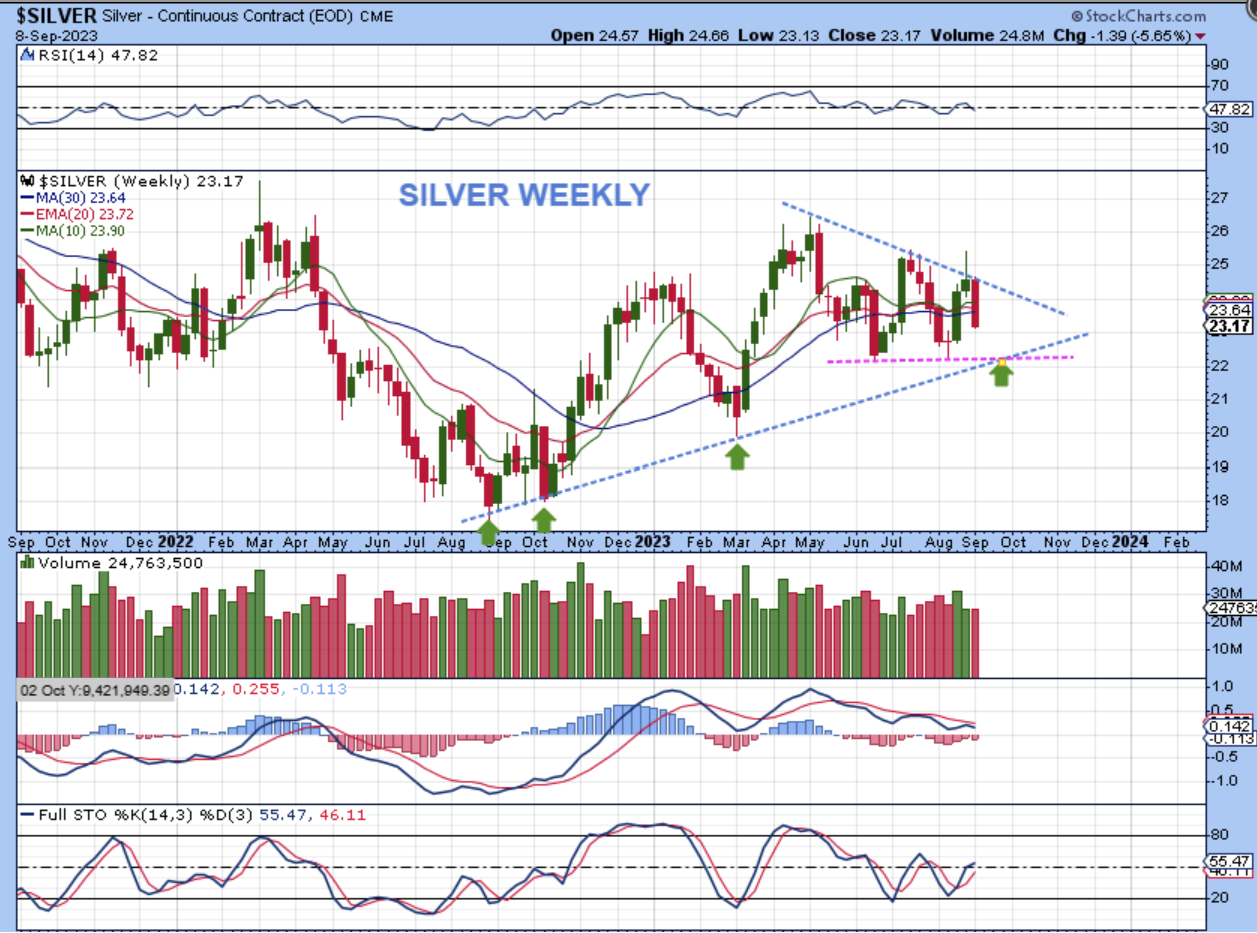
SILVER WEEKLY – This is interesting. On September 8 I noticed that Silver never sold off completely to the lower trend line, so I drew this. We would need to sell off quite a bit (almost to prior lows) to tag that line, but it was a possibility. I drew the green arrow there.
.
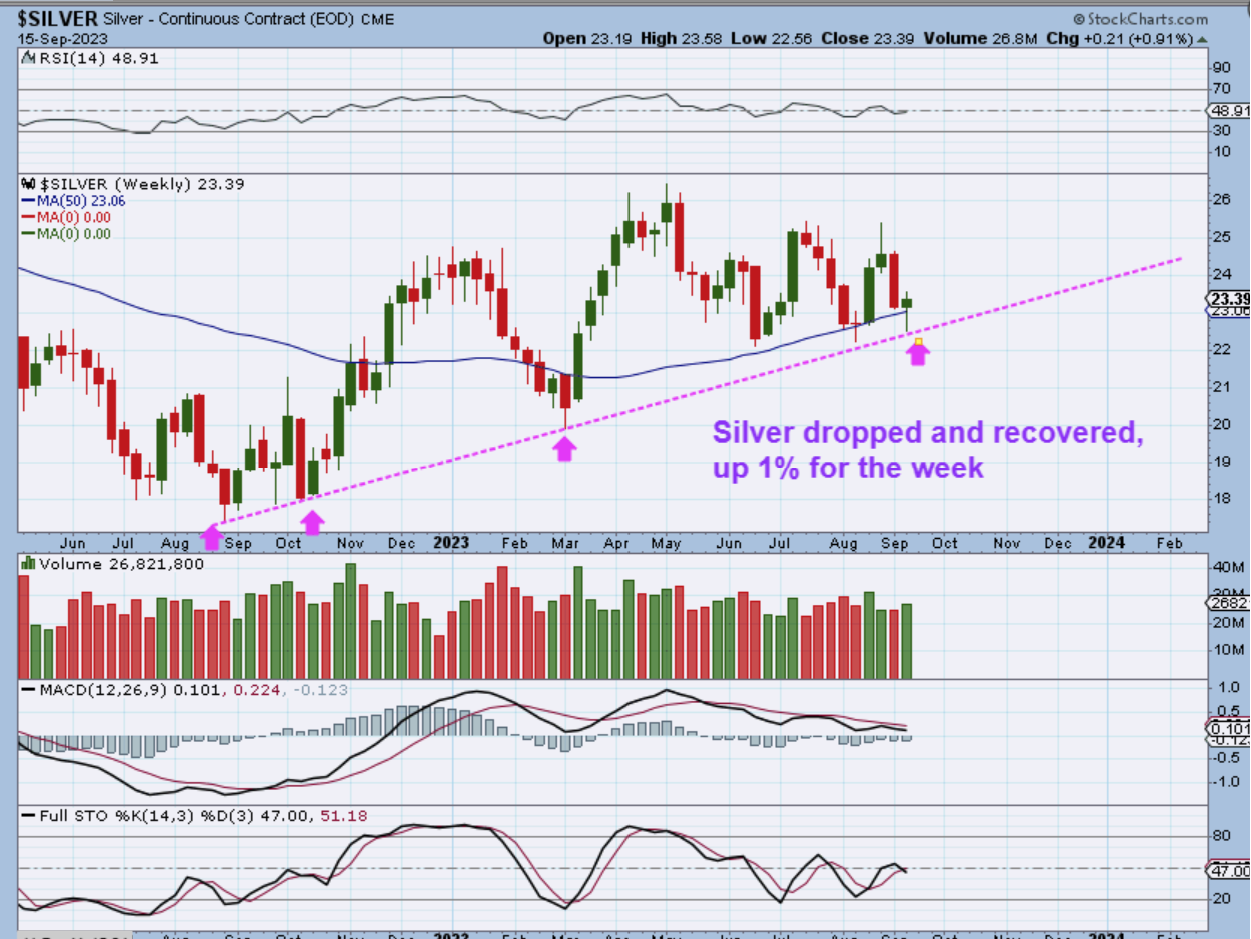
Wow. Silver sold off to that trendline and reversed higher, even recapturing the 50 week ma. This is a bullish reversal at the lows, so I am thinking that next week we will see Silver rally (FOMC MTG). Even better than this reversal was…
.
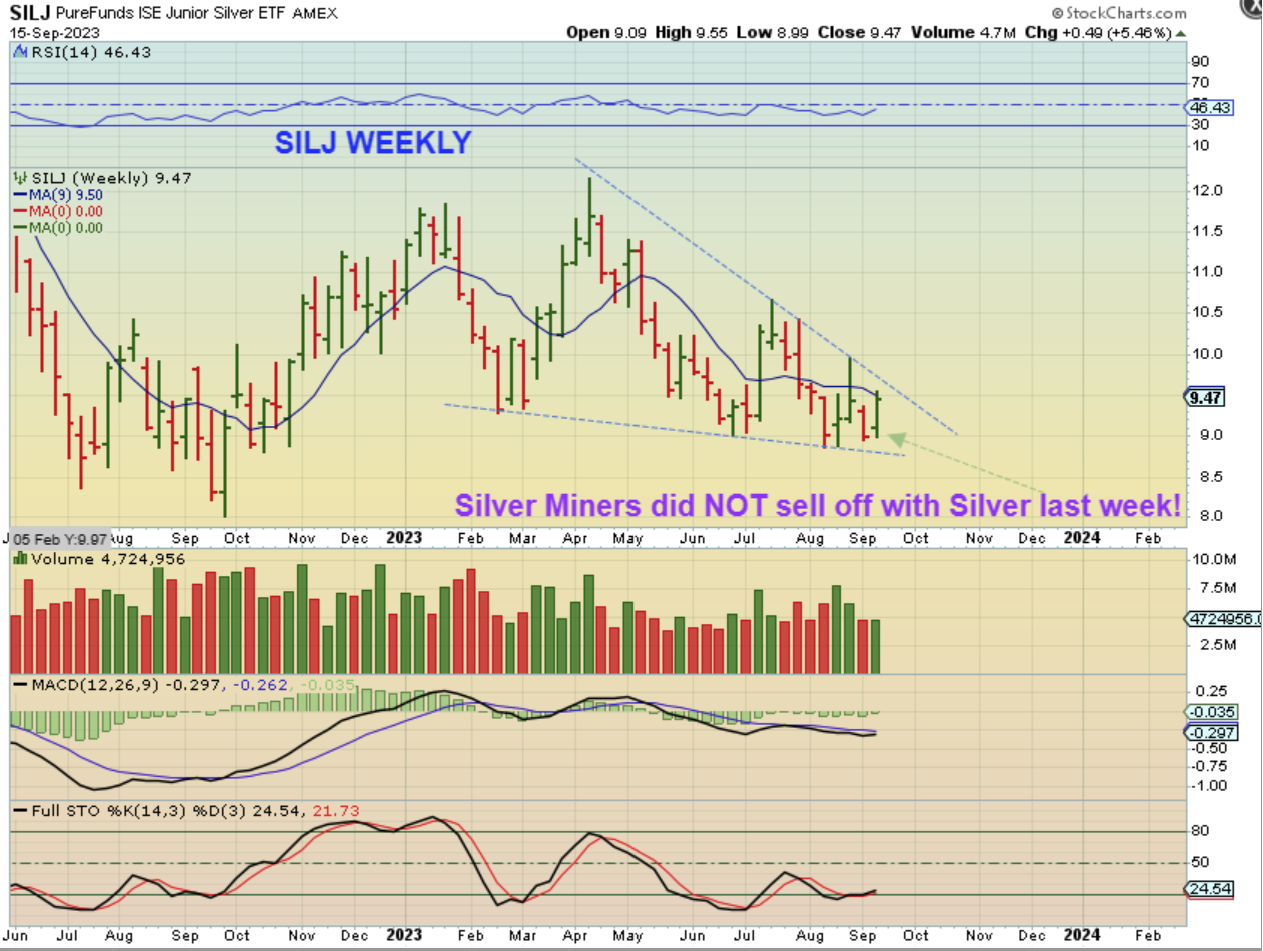
SILJ WEEKLY: Even better than that Silver sell off and reversal was that Silver stock never sold off. Silver was down BIG one day and Silver miners were green. SILJ was up 5.46% for the week. This is extremely bullish to me. The SILJ WEEKLY looks like it may breakout from a down trend next week.
.
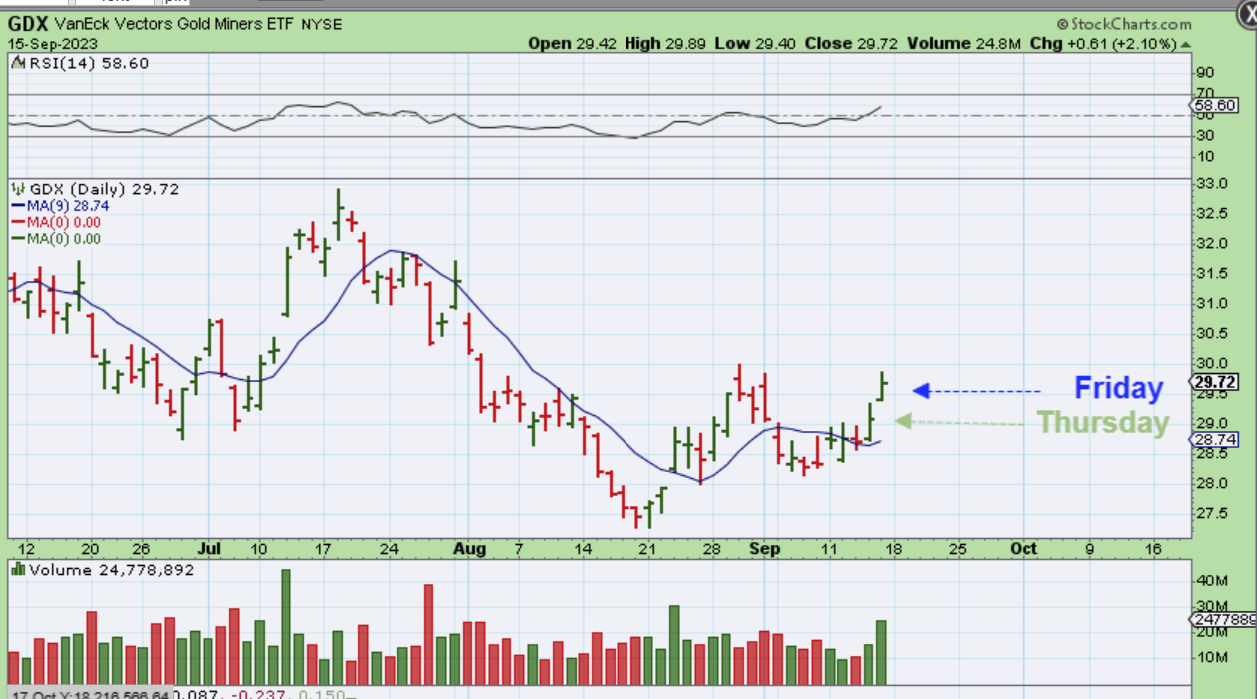
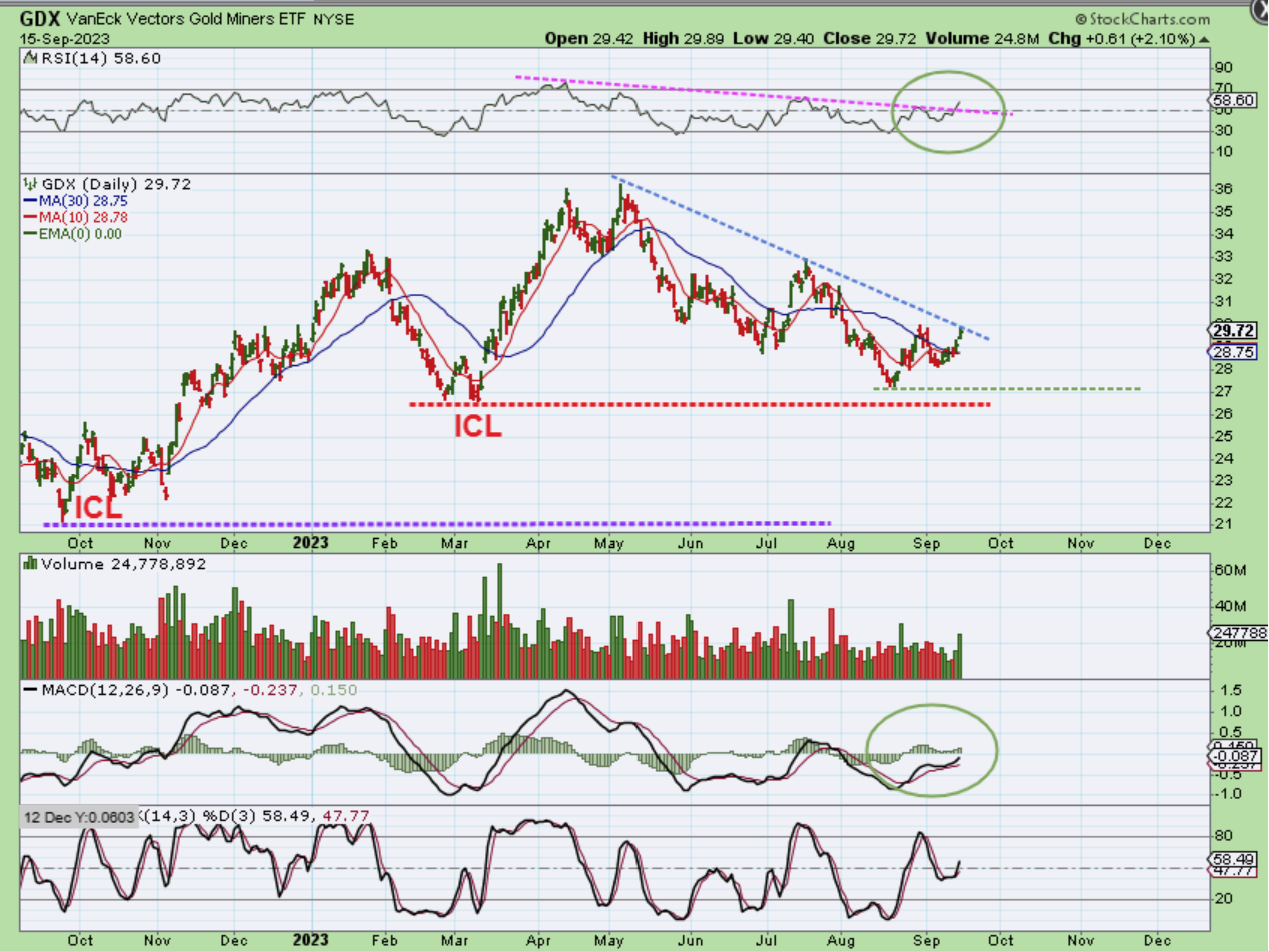
GDX DAILY – Take a look at our Miners (GDX ETF) on a week when Gold and Silver both sold off due to the CPI and PPI Numbers, along with the strong USD. The Miners actually ran higher and now the RSI broke a downtrend and the 50% line. This is bullishly aligned.
.
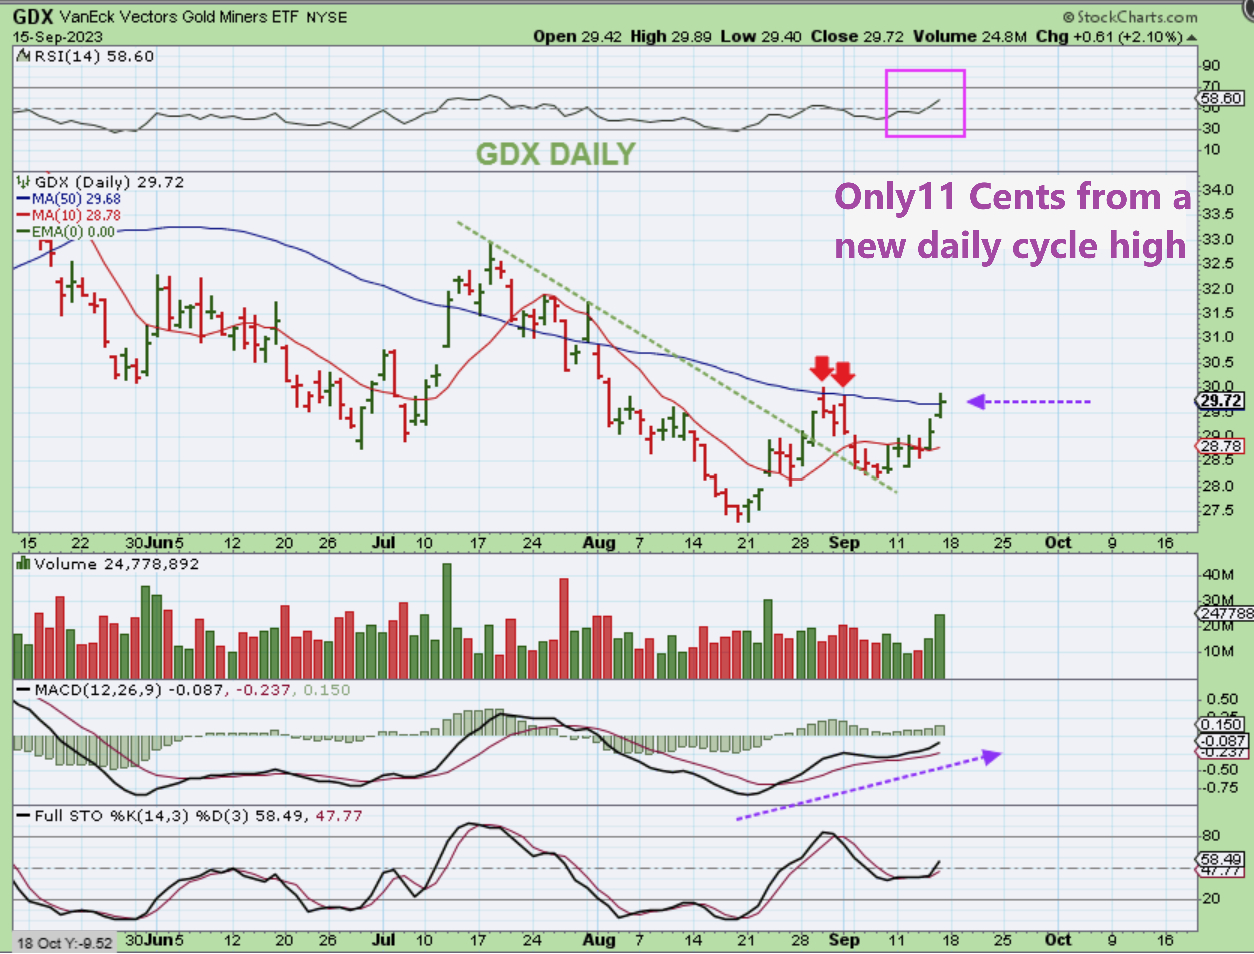
GDX DAILY – Zoom in and we see that Fridays high was only 11 cents away from likely making this a right translated daily cycle. We can look for that ‘peak’ to be broken next week (GDX above $30.00), as GDX moves above the 50sma.
.
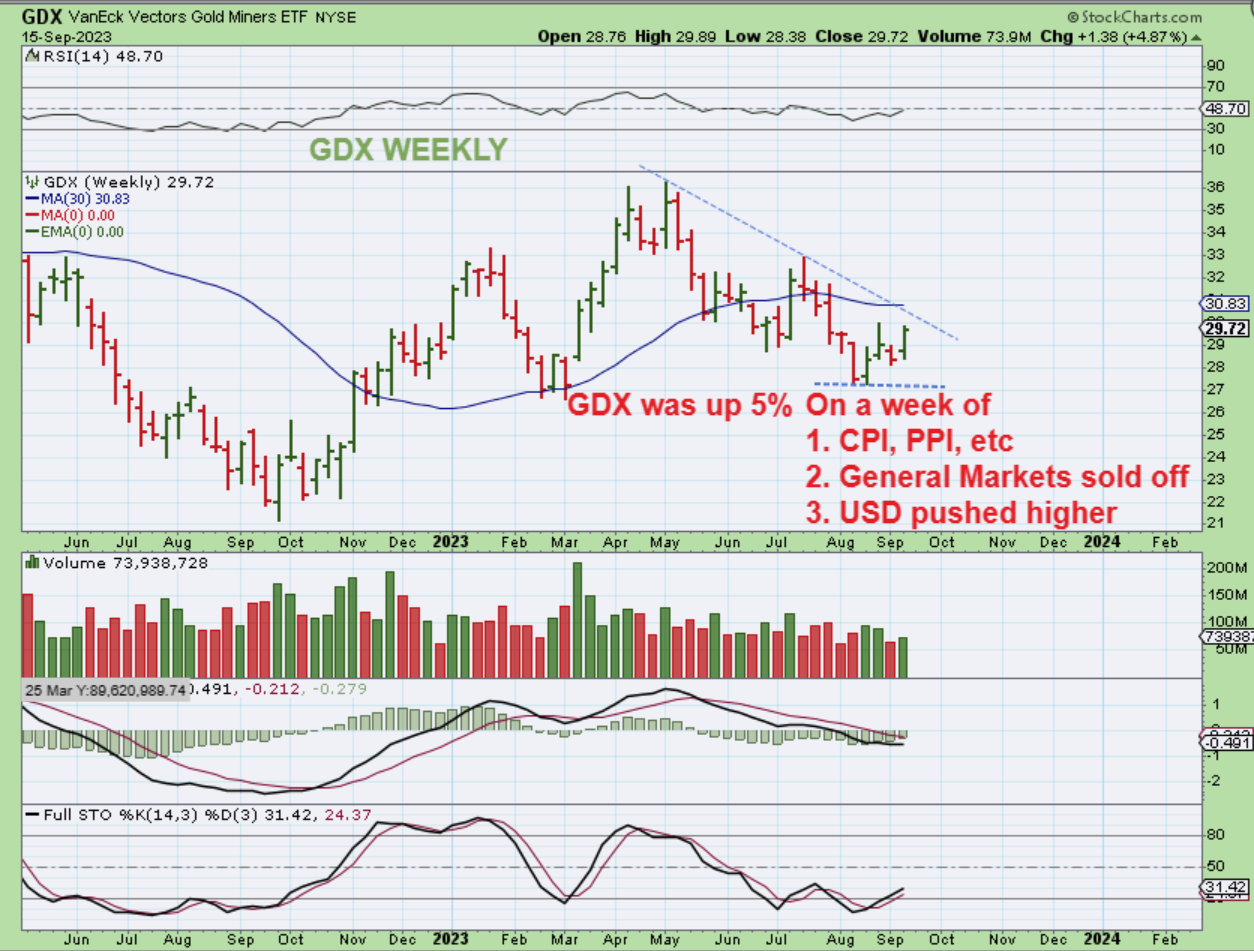
GDX WEEKLY – GDX was up almost 5% for the week, and this was on a week where the USD pushed higher and Gold & Silver sold off. Remember too that The General Markets lost the 50sma and sold off on Friday. GDX remained near the weeks highs. This is bullish price action.
.
Last week we saw the General Markets lose the 50sma …again. With that, we may be seeing the start of the next leg down in an a-b-c drop into an ICL, if we don’t already have that ICL in place. It really looks somewhat 50/50 or neutral though, since a bullish looking triangle is also forming. The FOMC Meeting may decide what happens next. It also seems that the FOMC Rate Hike Decision on Wednesday could drop the USD and cause the markets to rally. The USD has 9 weeks higher, so it would seem that it has to pull back sometime soon. Oil remains bullish. The USD may be topping after a 9 week straight rally out of the lows. If that is the case, and we have the FOMC Meeting next week, that may be the point when we see the USD turn lower. And Gold & Silver dropped and recovered, giving us bullish reversal hammer candles. Especially bullish was that Silver dropped down to that lower trend line and reversed strongly, yet Silver Miners never fell during that sell off last week. The Miners look good and GDX almost took out the daily cycle highs to make this a R.T. Daily Cycle. I am going to be expecting that next week, with a push above that 50sma and the $30 price point. I did purposely point out a choppy low in Oils first daily cycle, just in case the FOMC Meeting keeps Gold and Silver chopping for a bit longer. The Miners really did act impressively last week, even with a choppy Gold and Silver, so it looks like the Miners are now leading the way and I am really looking forward to next week, to see how things continue to unfold. It is starting to look very Bullish for the Miners! Enjoy your weekend everyone!
.

