September 9 Weekend Review
I think you’ll be a little surprised with the conclusion of this weekend report. 🙂
.
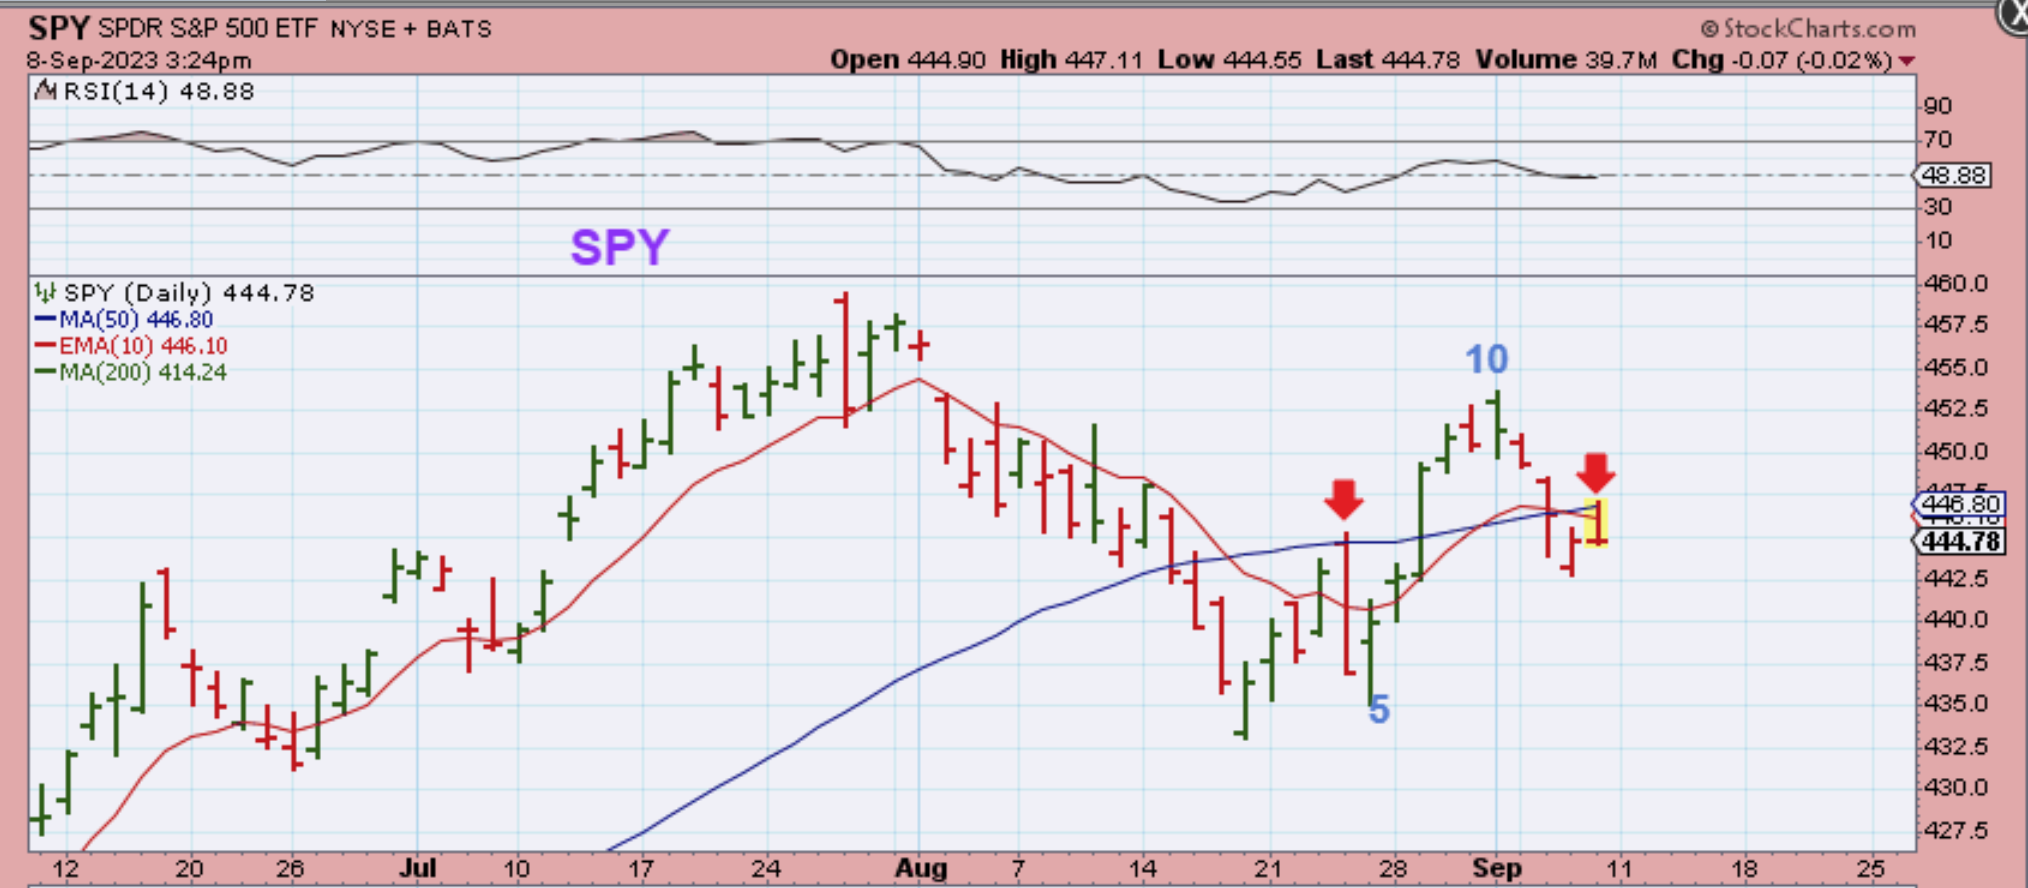
SPY DAILY – On a daily basis, the General Markets were unable to recover the 10 & 50sma by Friday. That could be a sign of weakness, so I’ll be interested in keeping an eye on that next week. If it can get back above the 50sma, it should continue higher. Does this mean anything for the weekly charts?
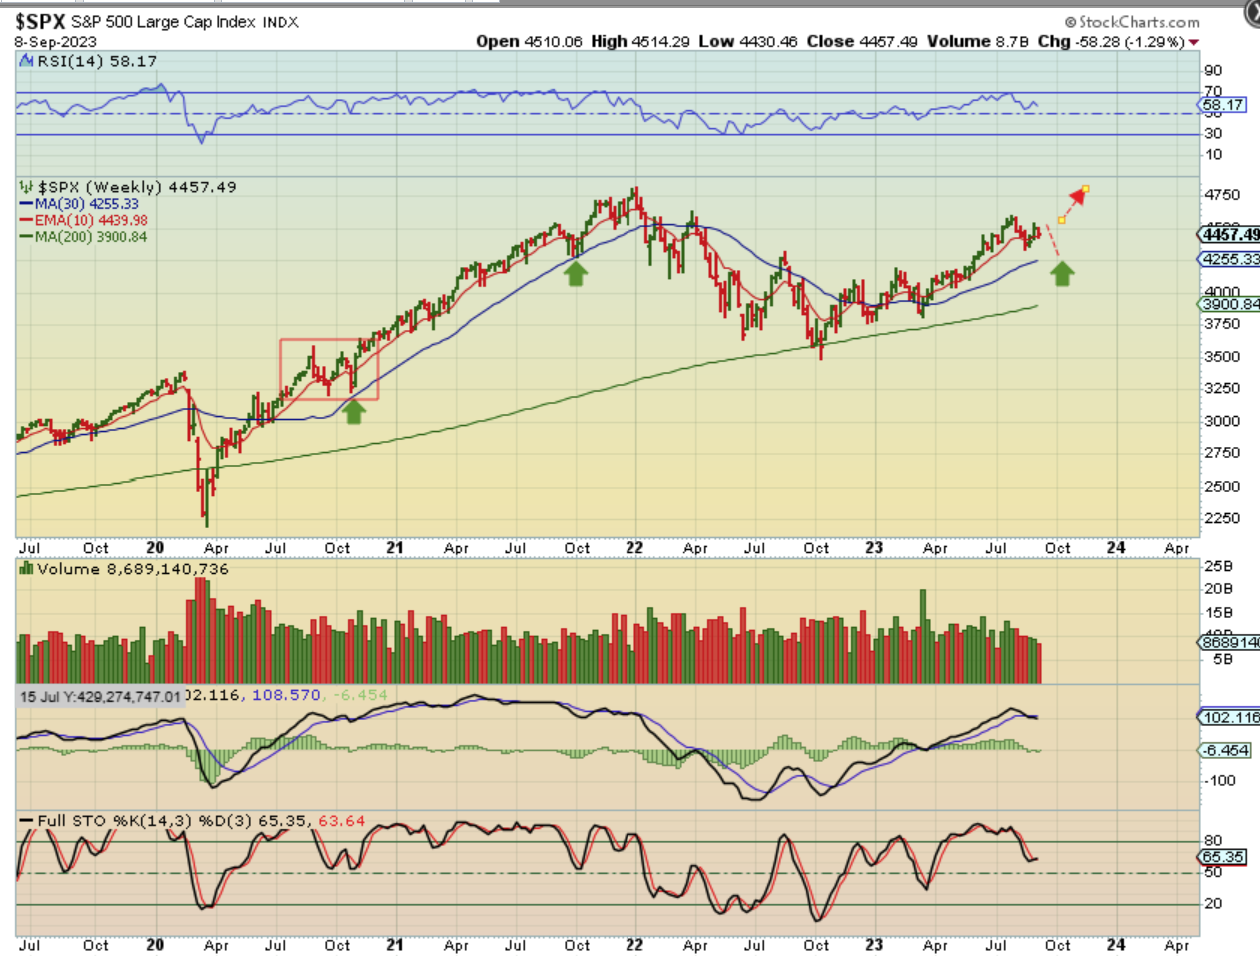
SPX WEEKLY #1 – On this chart, just look at the blue line ( 30 week ma). In the past, price occasionally bounced off of that for an ICL, so if the daily stays under the 50sma, we may see another drop down to that area. It could become an a-b-c down into an ICL on the blue line instead of the red. Next…
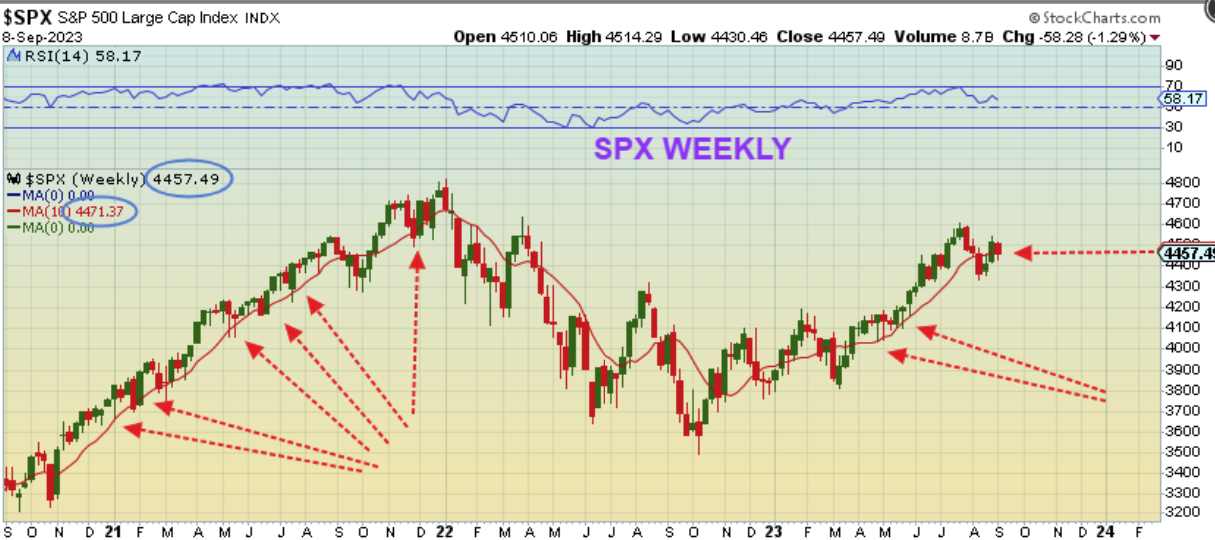
SPX WEEKLY #2 – Next we’ll focus on that Red line as the 10 week ma. Price has broken slightly below it 5 weeks ago and then quickly recovered it as a possible ICL too. Right now though, price closed slightly below that red line again, so we need a QUICK recovery above 4472 next week (or we may drop to that blue line mentioned above).
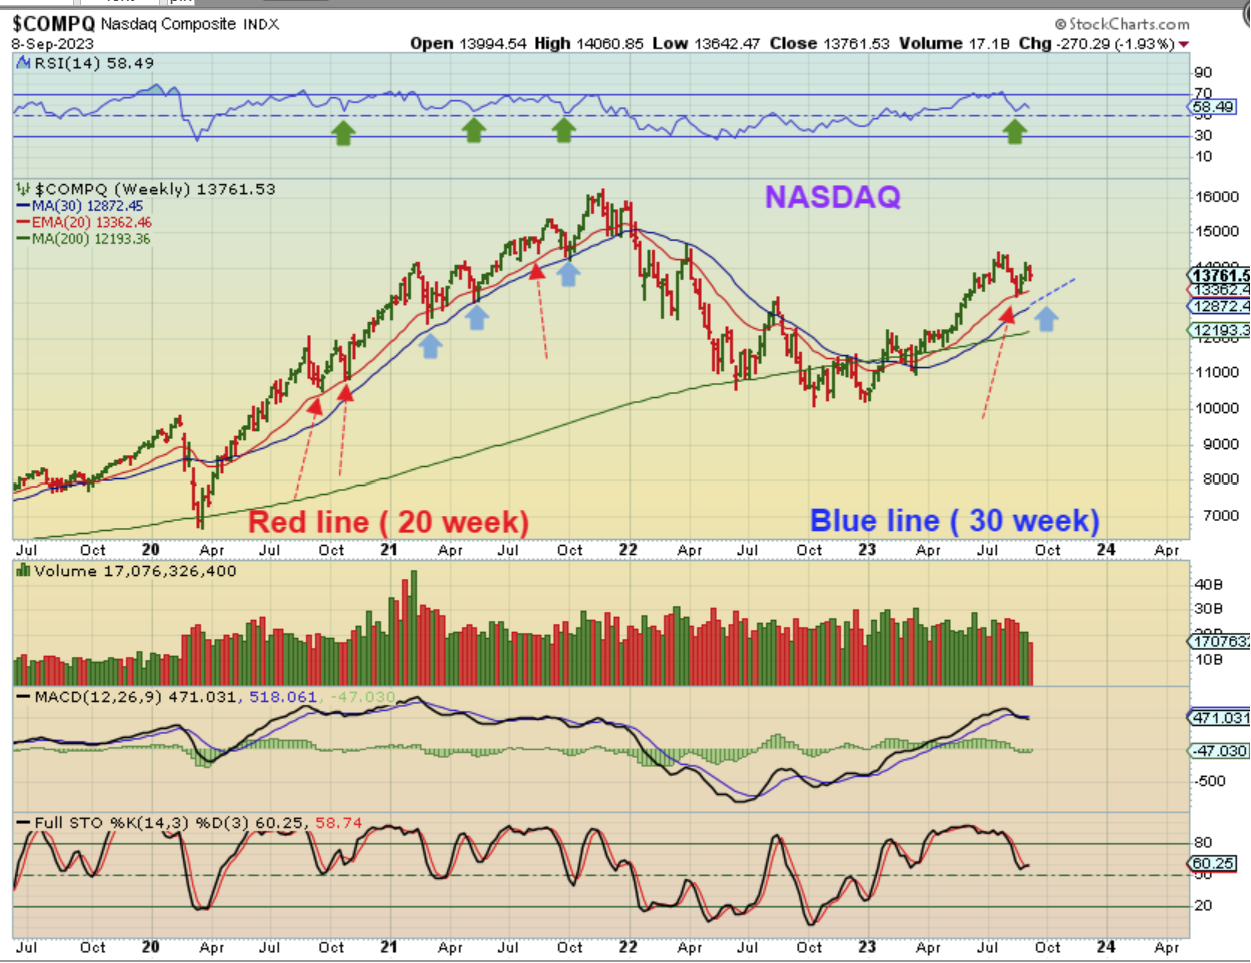
THE NASDAQ WEEKLY – With the Nasdaq, the red line is the 20 week ema and that along with the 30 week ma was support in the past. It also was support at the last low and price is still well above it, so the NASDAQ seems stronger (so far). This could still drop to the blue 30 week ma as an a-b-c down too, but at this point it bullishly held the 20 week ema and is still above it.
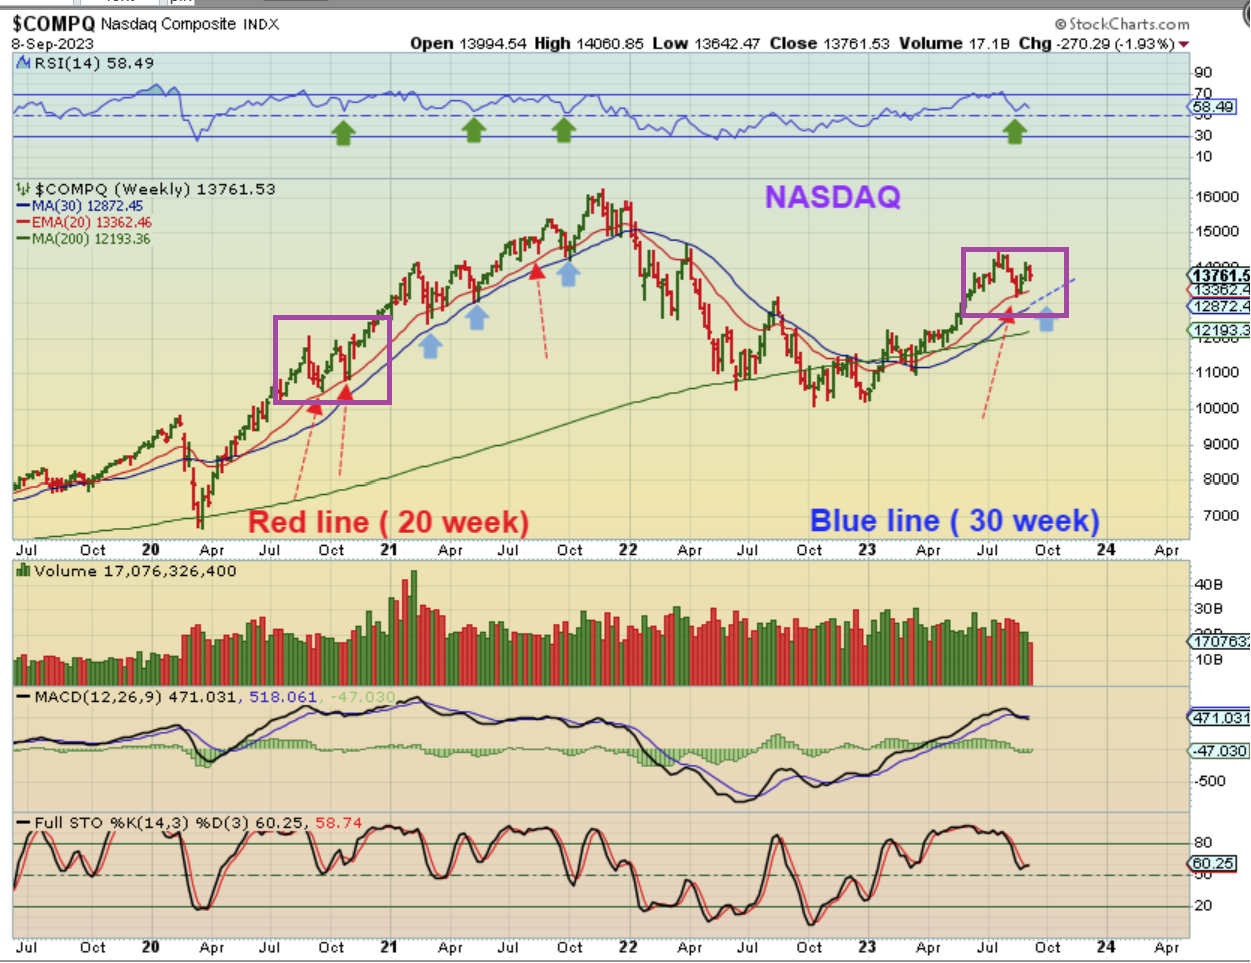
THE NASDAQ WEEKLY – If you look at the square on the left at July to Oct 2022, you see a double tap of the 20 ema. We may see that too, rather than a deeper drop to the blue line. I say this because MSFT, NVDA, GOOG, etc still look strong. In fact, GOOG and MCST closed up on Friday and near the highs.
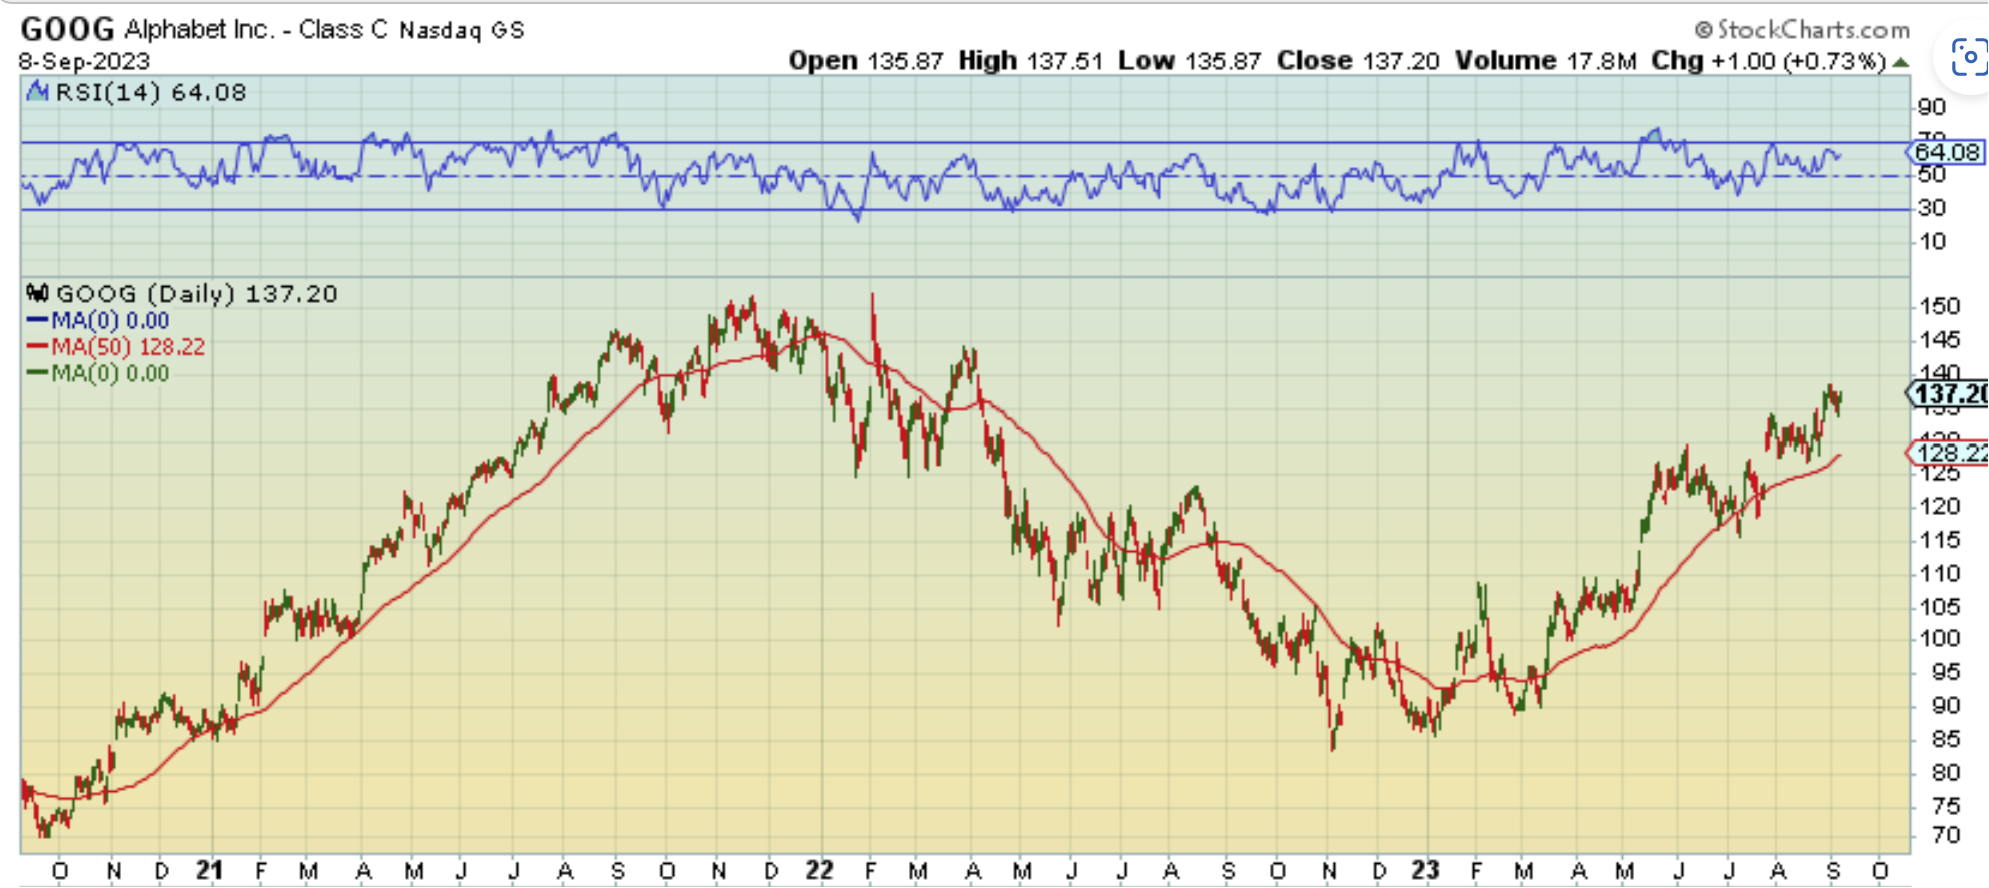
You can see that GOOG not only closed up $1.00 on Friday and near the recent highs, but it is at 1 year highs, so the Nasdaq doesn’t look all that weak yet. This may be the clue that the ICLs really are in place and last weeks dip is just a temporary dip.
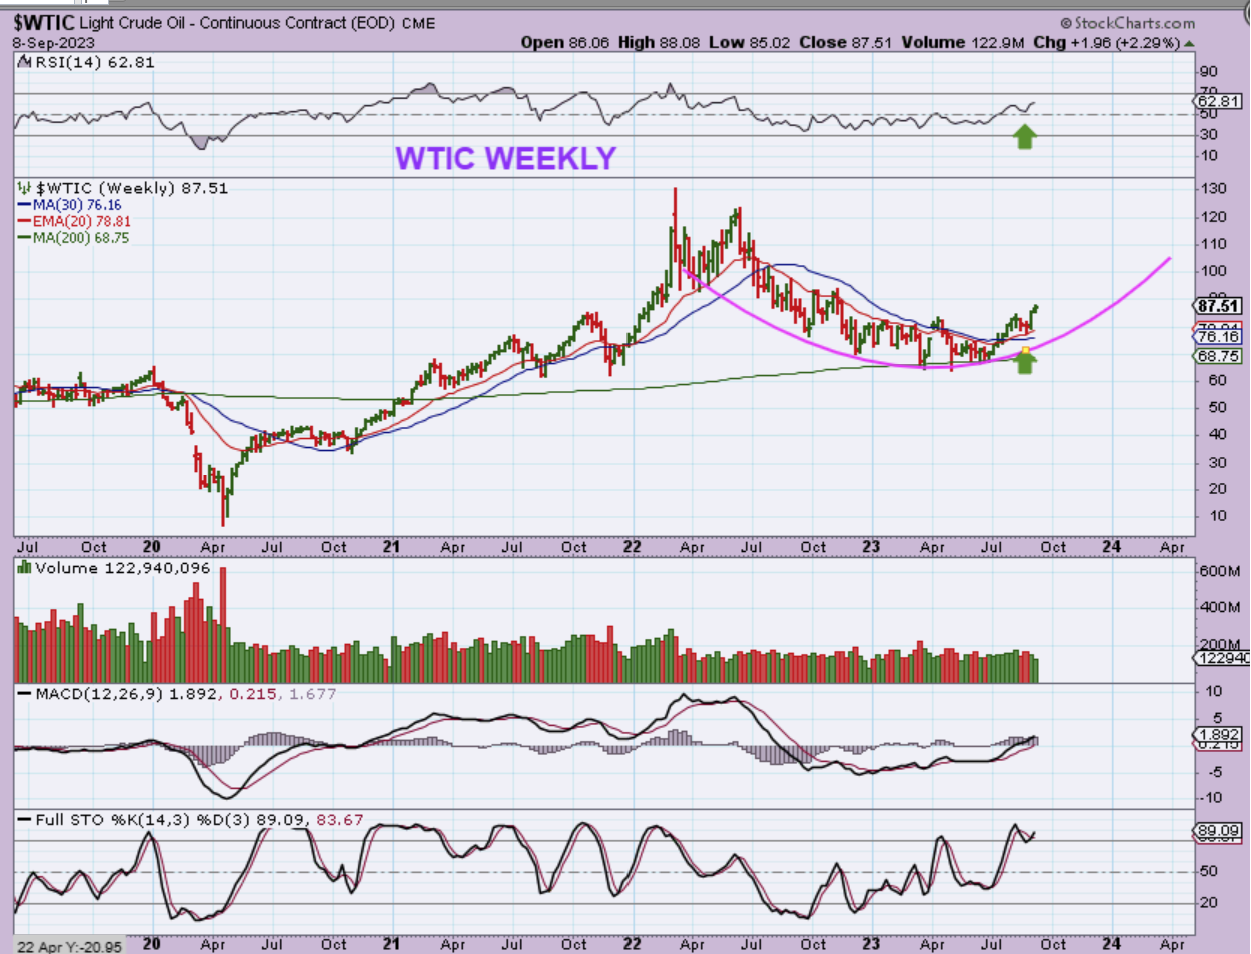
WTIC WEEKLY – Oil continues its’ bullish climb. This week did not change that, Oil looks like it wants to continue higher.
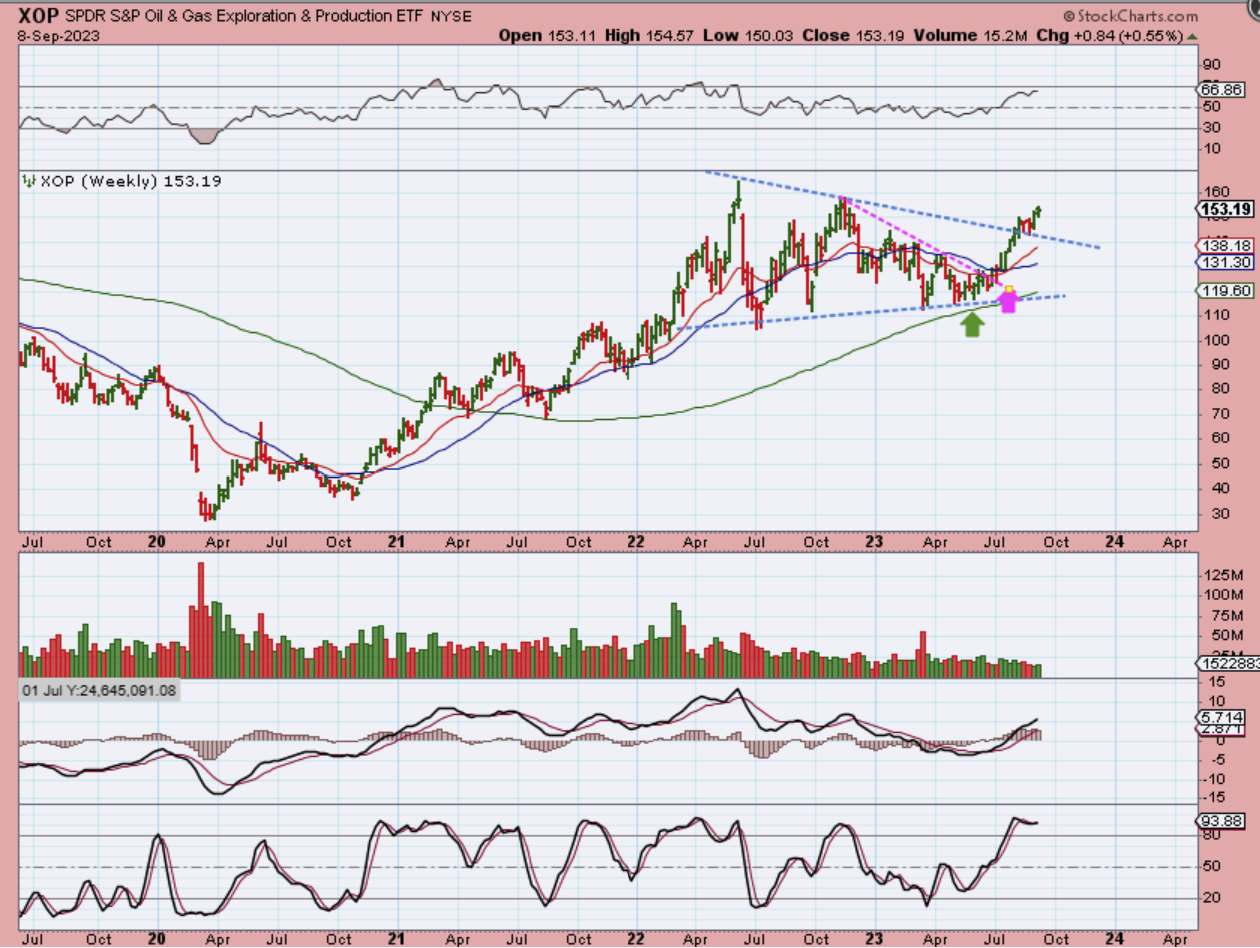
XOP WEEKLY – The Oil stocks were leading Oil out of the lows and they broke out, back tested that break out, and then continued higher. Oil stocks want to move higher too.
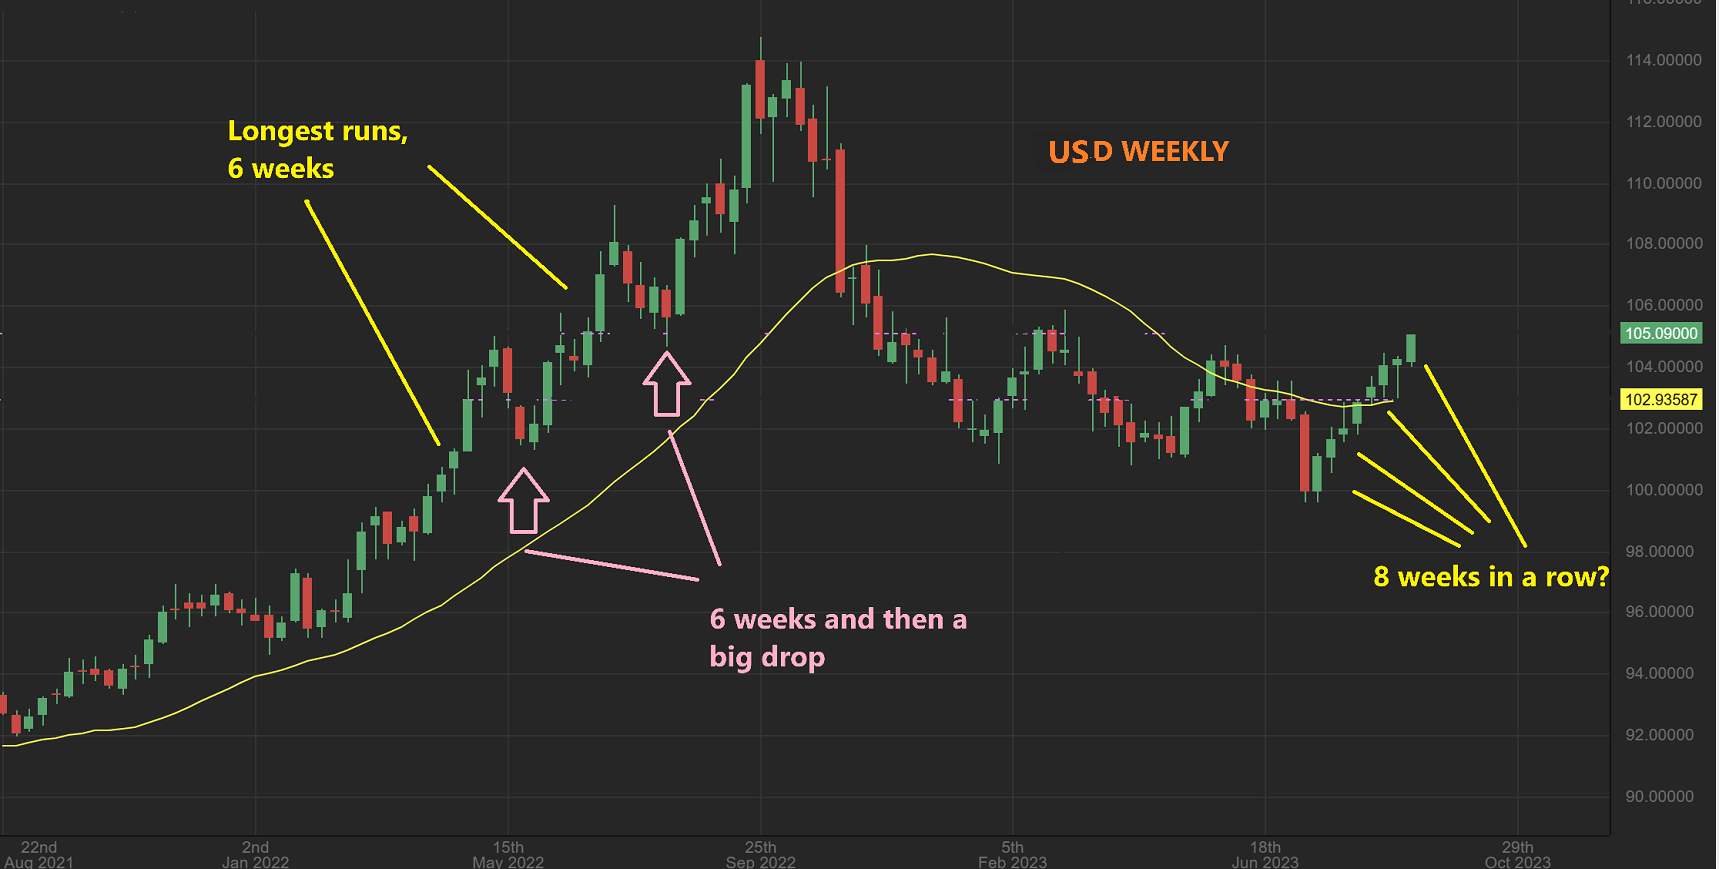
USD WEEKLY – I was looking at the last Bull Run in the USD. In that whole run I didn’t see 8 straight green weeks during that whole rally, but it did have 6 weeks higher. Well, after those 6 strong weeks of rally, it was followed by a good multi week dip (Pink arrows). So when this 8 week USD rally stalls, and it should be very soon, I would think that we should see at least a couple of weeks worth of a drop. That drop should allow Precious Metals to pop.
.
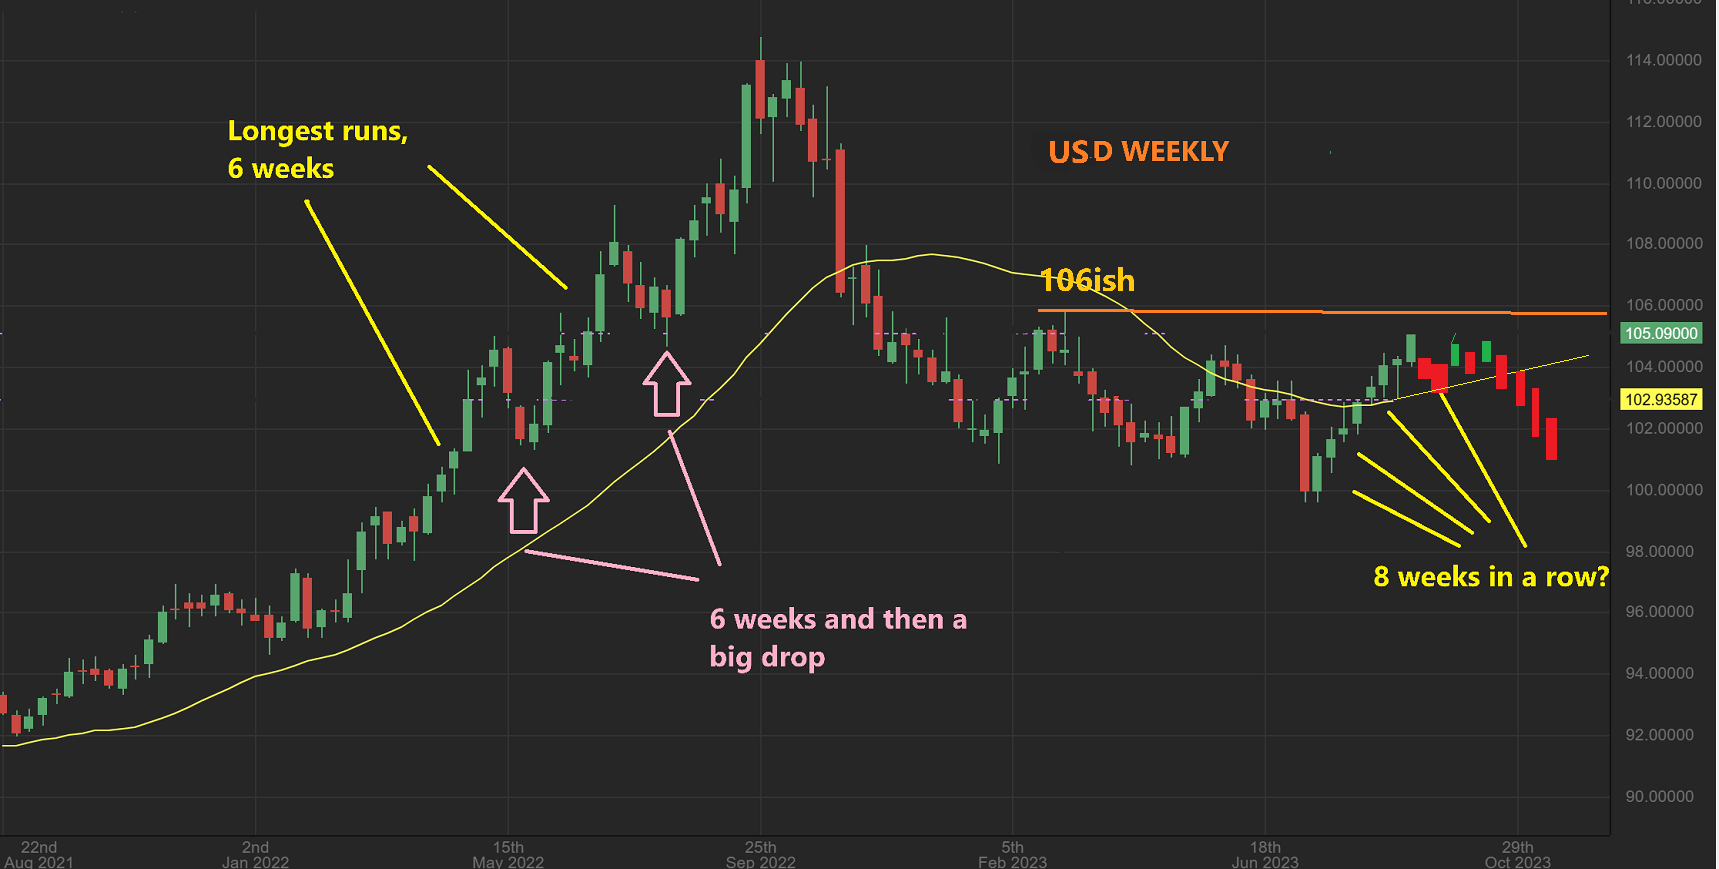
And of course, if we still see that 3 yr cycle low ahead of us as we head into 2024, it could chop and drop under that $1.06 area something like this. Gold would finally rally to the breakout area of all-time highs.
GOLD WEEKLY (Not Wekly 🙂 ) Gold is at the overhead trendline and dropped this week with that strong USD. Again, 8 straight weeks higher for the USD is a lot! If it can pull back like we saw after the 6 week rallies, then Gold could break out through this downtrend.
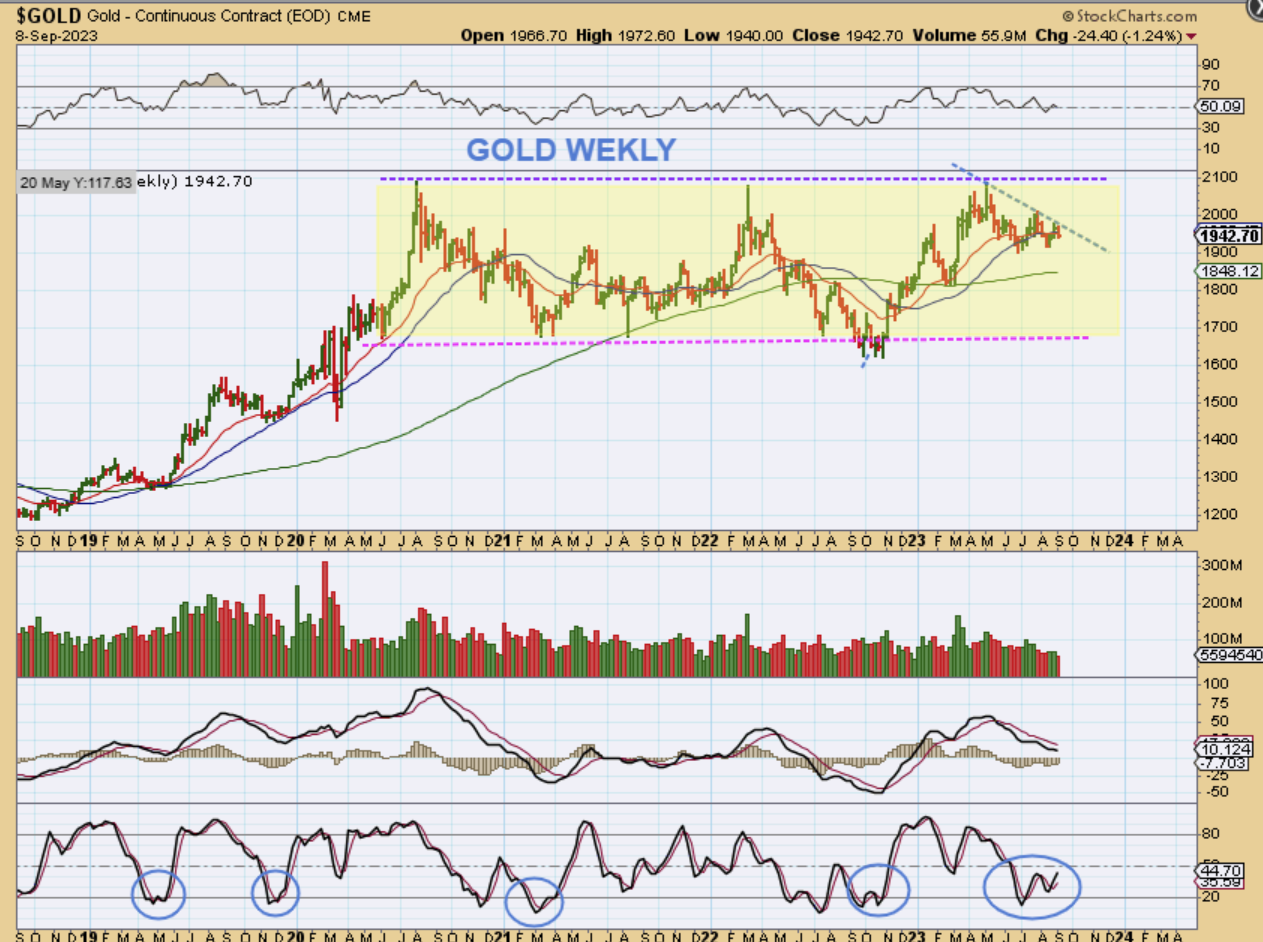
GOLD WEEKLY – Something else to think about is this:
1. Didn’t I just show you a chart of the USD with 8 straight weeks higher? Yes!
2. Do you see Gold here with 8 straight weeks lower? No, not at all!
In the last 3 weeks, we just had a 2 week run higher in Gold as the USD rose, and 1 week down. Before that Gold also ran higher with the USD rising, so this shows that the USD is not completely controlling Gold. So…
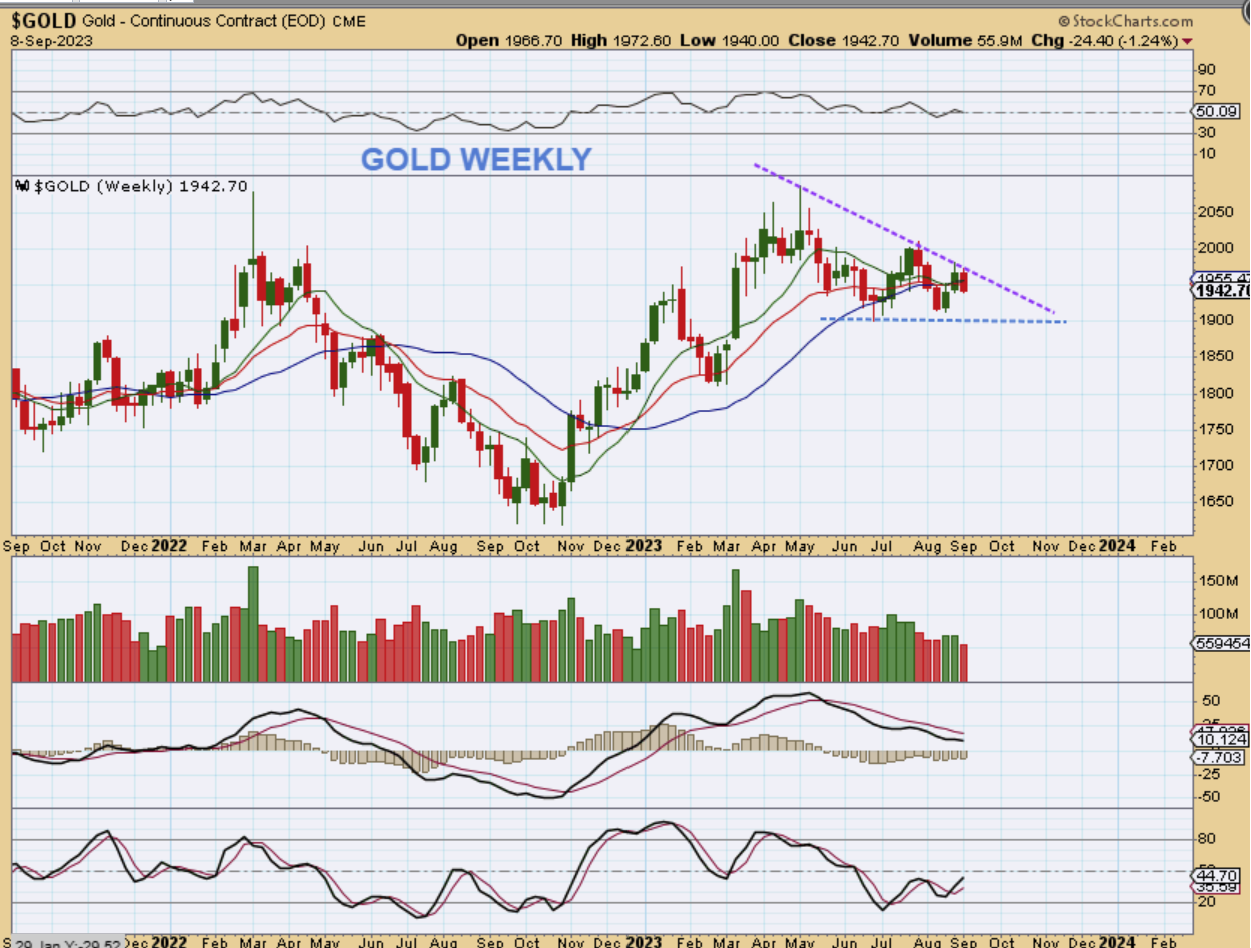
Conclusion: That ‘8 week straight up USD rally’ is not smashing Gold down, but it may be making it choppy. This really looks like a bullish wedge.
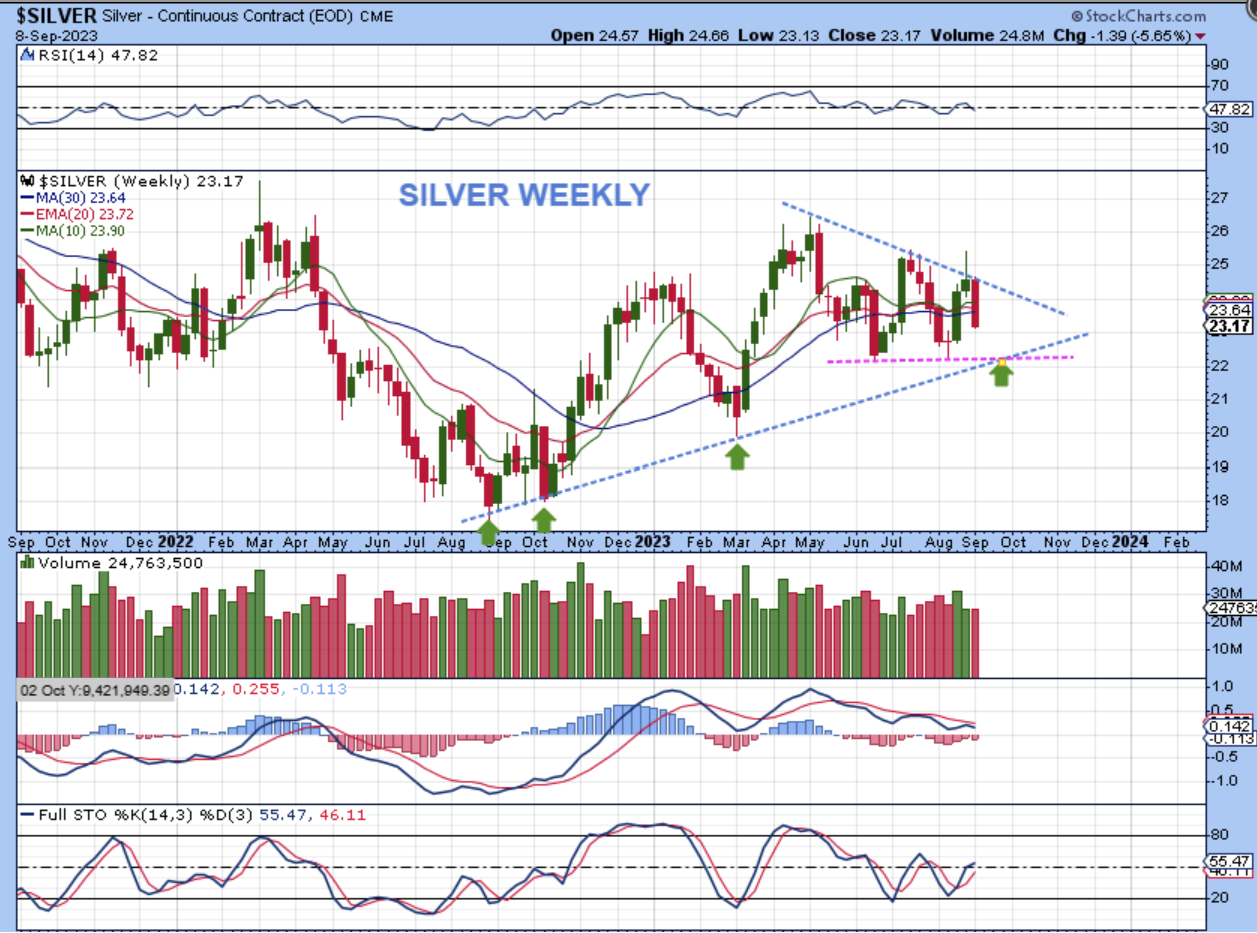
SILVER WEEKLY – Silver tried to break out and it gave us that topping candle 2 weeks ago. It then dropped 5% last week. It may need more time in this consolidation, but it may be helpful to also notice that…
– When Silver ran up to attempt that triangle breakout, that was also during ‘the 8 straight weeks of a USD rally’. Silver stocks did not follow Silvers strength, so that may have been a sign that Silver needed more time. It was a VERY convincing rally in Silver on the daily charts, but Silver Miners were not leading the way.
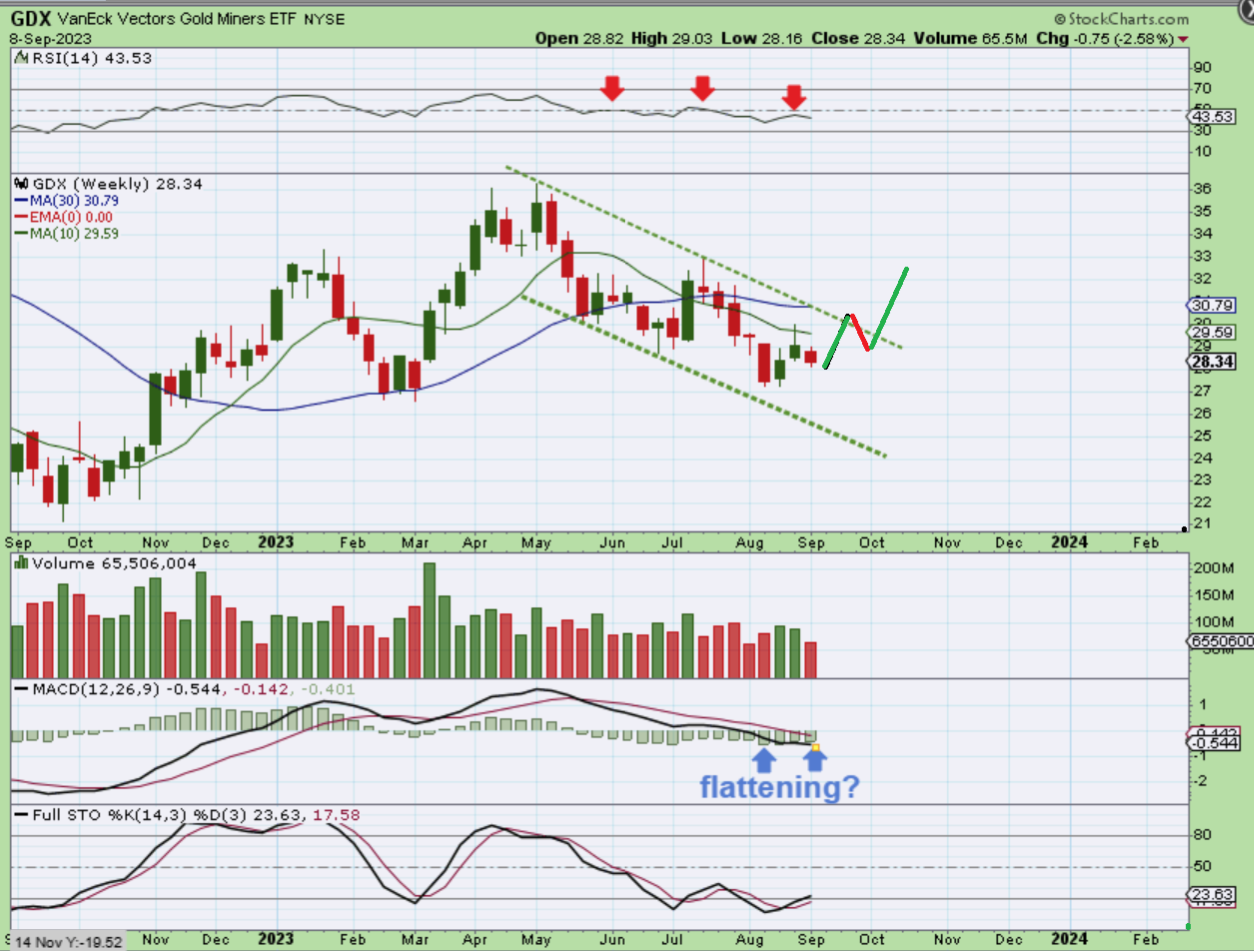
GDX WEEKLY – GDX also pushed higher for 2 weeks with that USD rally, but it was rejected at the 50sma on a daily chart and the 10 week ma on this weekly chart. If the USD starts to pull back
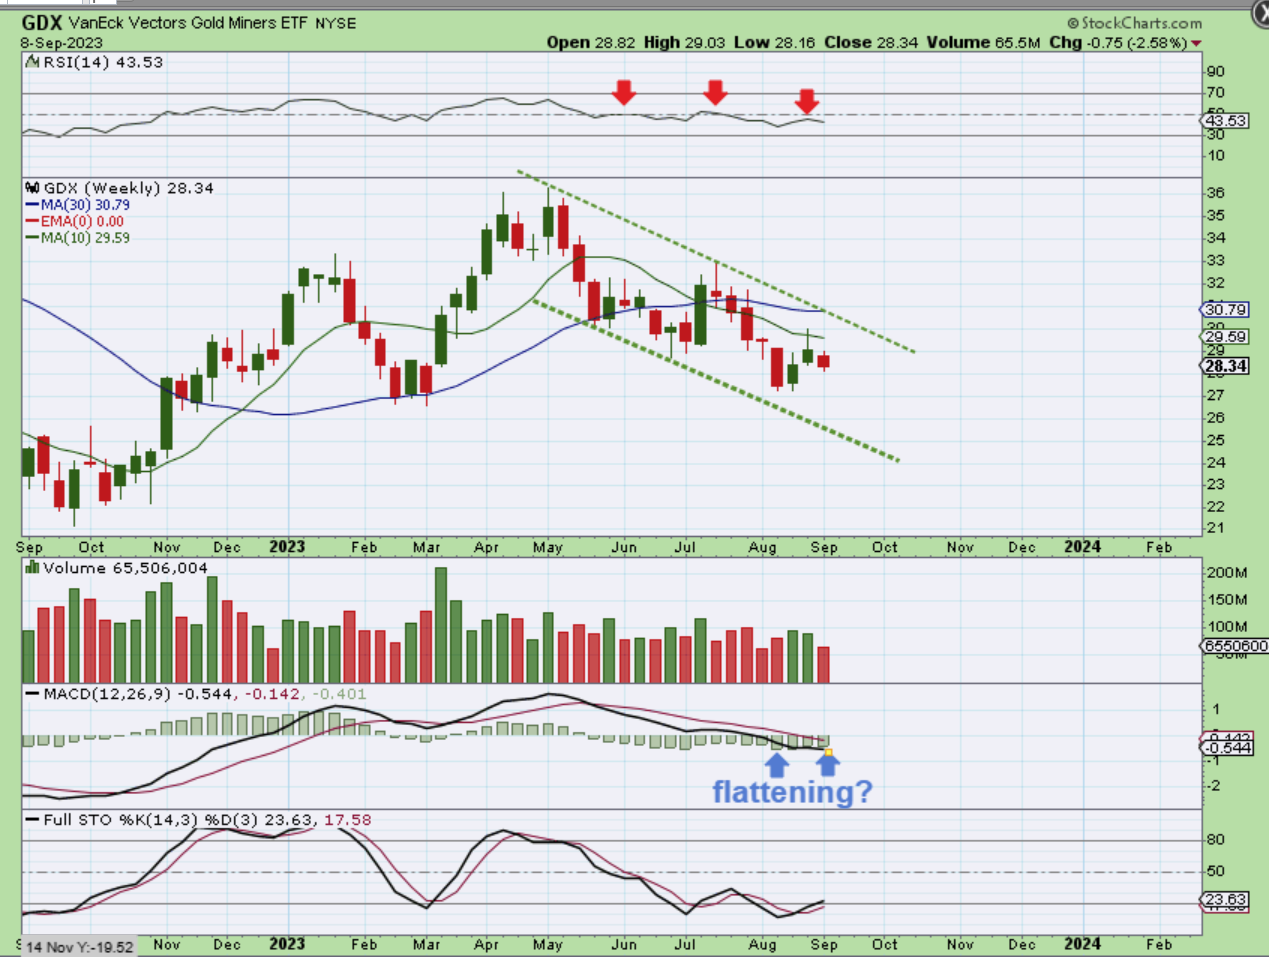
If the USD starts to pull back after 8 straight weeks up, we could see this and I think that many people would not believe it. Let me say this though, go back and look at Silvers 5.65% Drop. GDX is barley below the prior weeks lows. GDX lost 75 cents last week. It is possible that Miners will start to hold up and they could lead us higher as the USD drops.
.
It was a choppy week but I did find some interesting things in the set ups. We still have a lot of bullish possibility. I am honestly wondering if 8 straight weeks higher in the USD will end and start that drop lower. If & when it does, the General Markets should turn higher (MSFT, GOOG, NVDA, CRM, etc do not look bearish). Gold and Silver could reverse, and the Miners may finally kick it into gear to run higher.
.
Listen, I know that the day after day after day chop, with the Pop & drop action in the precious metals sector is tedious and irritating. I know readers are annoyed, and rightly so! Honestly, I am a little annoyed too, with Gold near all time highs and delaying that break out. Finally, I’m not trying to be one of those ‘Bullish Only’ kind of an analyst for the sector, because I am not that way. I just report what I see when I sit down and take a good look at, not only the ‘charts’, but the entire ‘Set ups’. Gold did not drop for 8 straight weeks and neither did Silver or the Miners. In fact, Silver rallied nicely for part of that time period. I think we are still seeing healthy consolidation in the Precious Metals and that could lead to a more sustained run higher. With the USD still under $1.06 and possibly about to roll lower, it may start to weaken and drop into that final leg lower- the 3 yr cycle low. That is not off the table yet.
.
And the fact that the USD rallied so strongly and Gold and Silver didn’t crash for 8 weeks says something too, right? So when viewing the entire set up – I cannot say that an 8 straight week rally has hurt this weekly set up at all. 🙂 Remember: Look at this chart. Gold is still only roughly $150 from all-time highs! That says a lot after such a strong Dollar rally to me.
.
Enjoy your weekend!
.
~ALEX
.
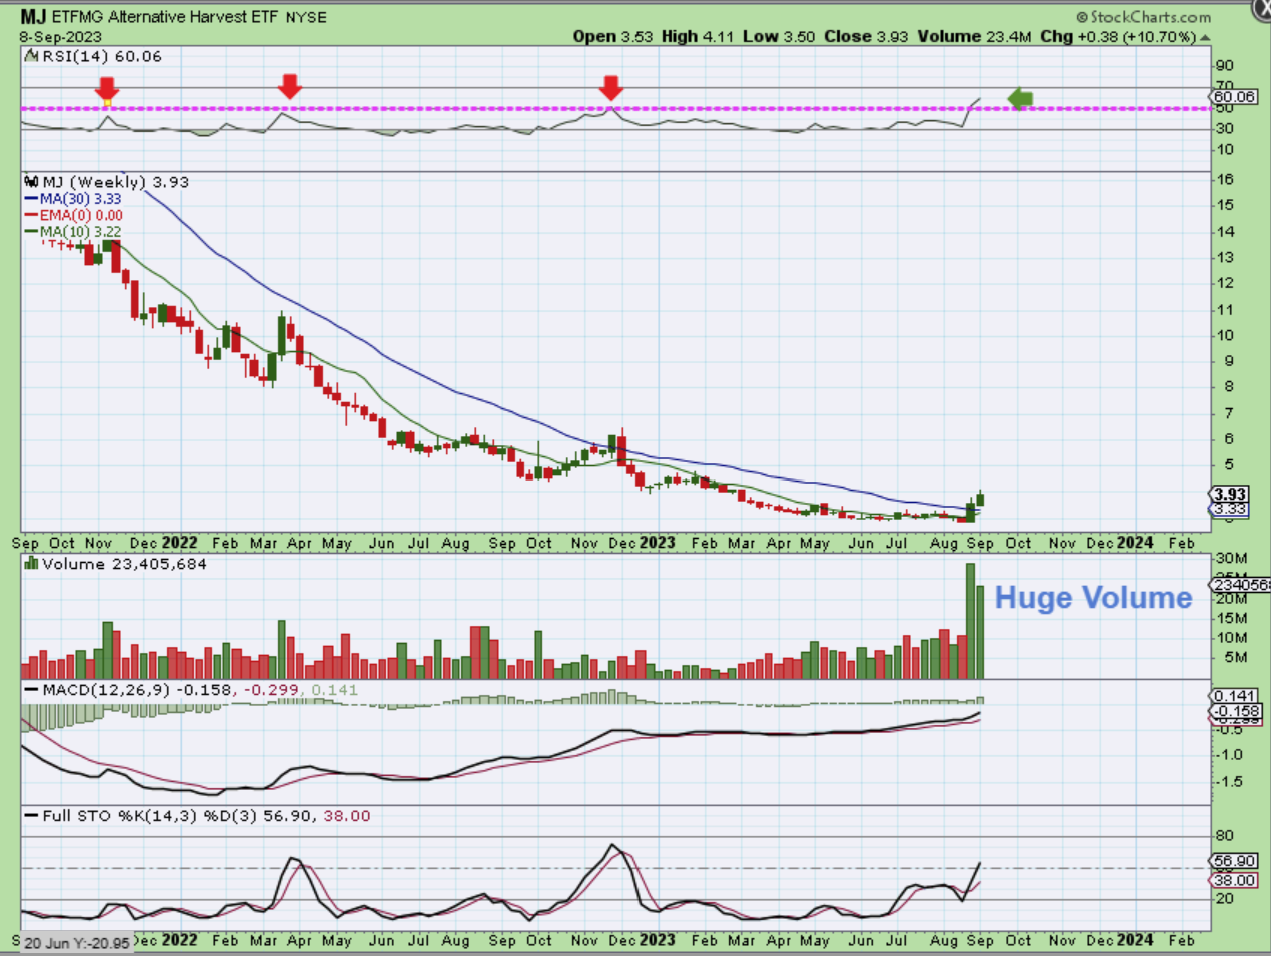
MJ WEEKLY (Changes) – I just wanted to point out the MJ Sector, because even though it has tried to bottom many times in the past, only to roll over again, I do see differences now. We may have our game-changer.
1. Look at that volume pouring in! It has been massive.
2. In just 2 weeks, The RSI is already in territory that it hasn’t been in for years.
3. That MACD Momentum is strong.
Some of the gains in CGC, TLRY, PLNHF, CRLBF, etc as they moved out of the lows are already very good. If you missed it, this means that when we finally get dips and consolidations, you can get in an enjoy the gains too. This is similar to MARA and RIOT at $3 and with a LOT of sideways chop and consolidating, they gradually ran to $20 in 6 months. 700% gains.