
Friday September 8th
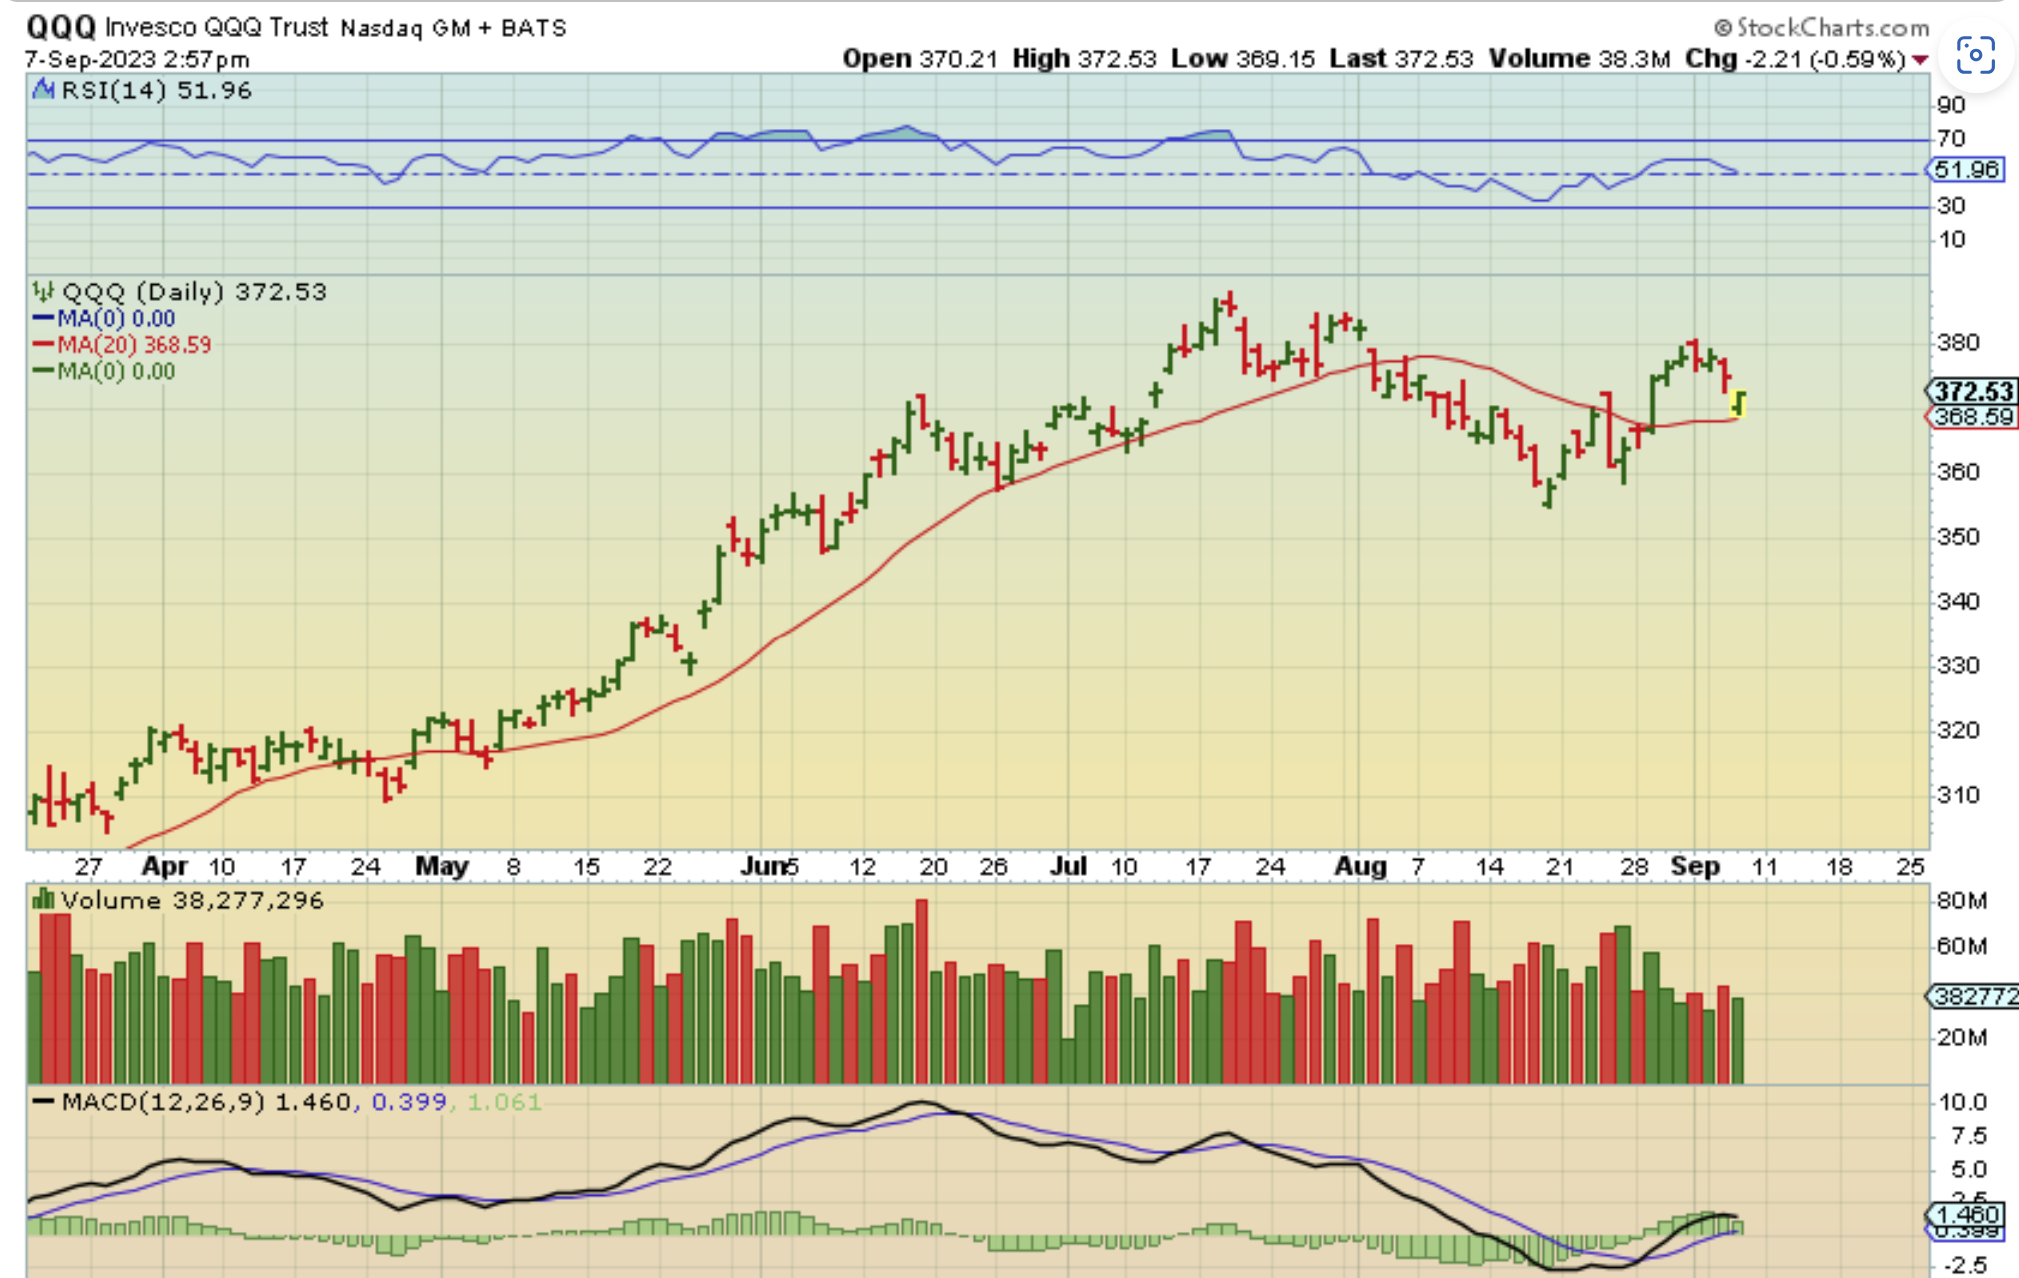
QQQ – I wanted to show that the Q’s dropped to the 20sma and reversed higher. This did however put price under the 10sma & 50sma, so price needs to recover sooner than later or the weakness may prevail. This dip on day 13 may be a 1/2 cycle low, but again, if it is it needs to recover soon. A break & close under this 20sma Friday is not healthy.
.
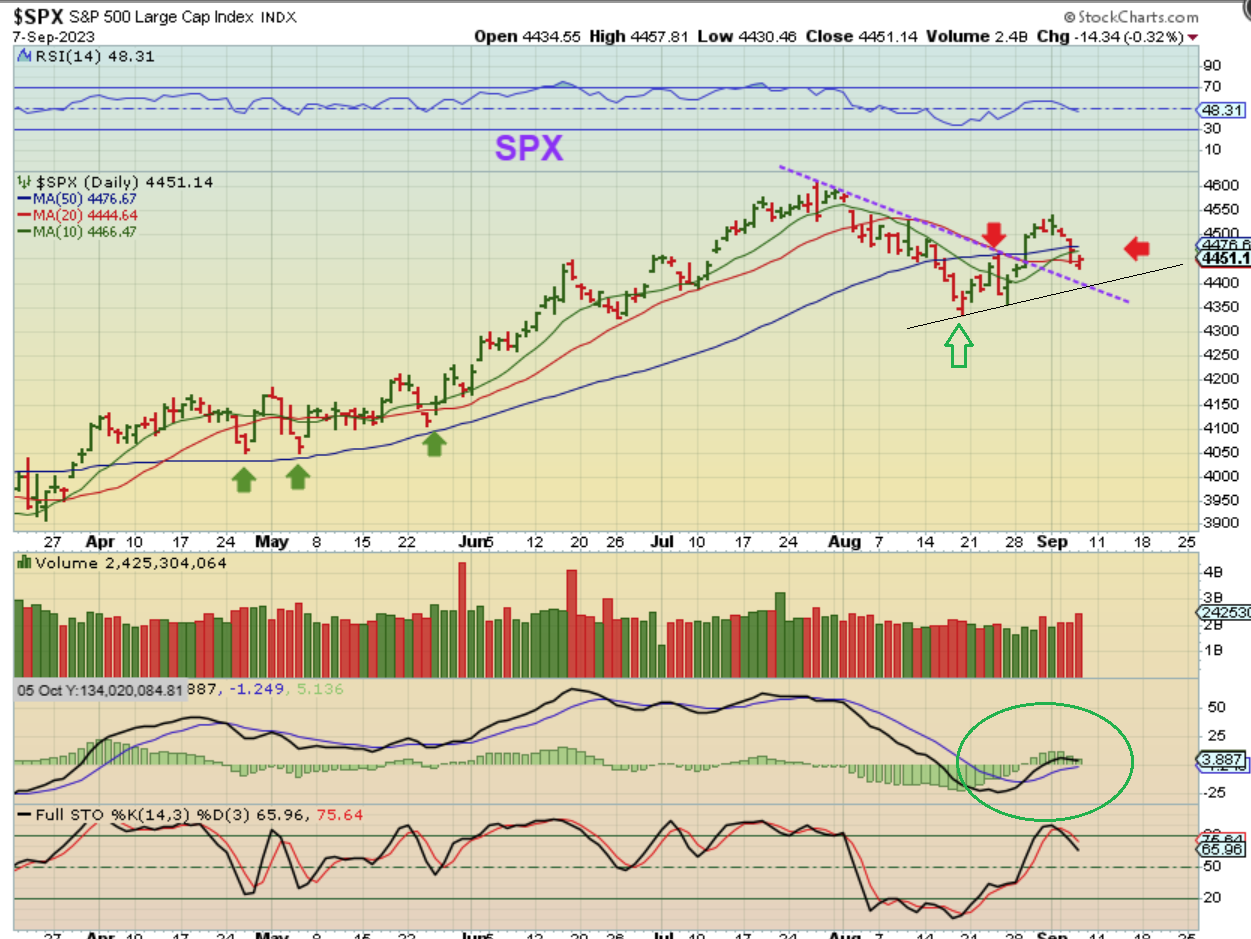
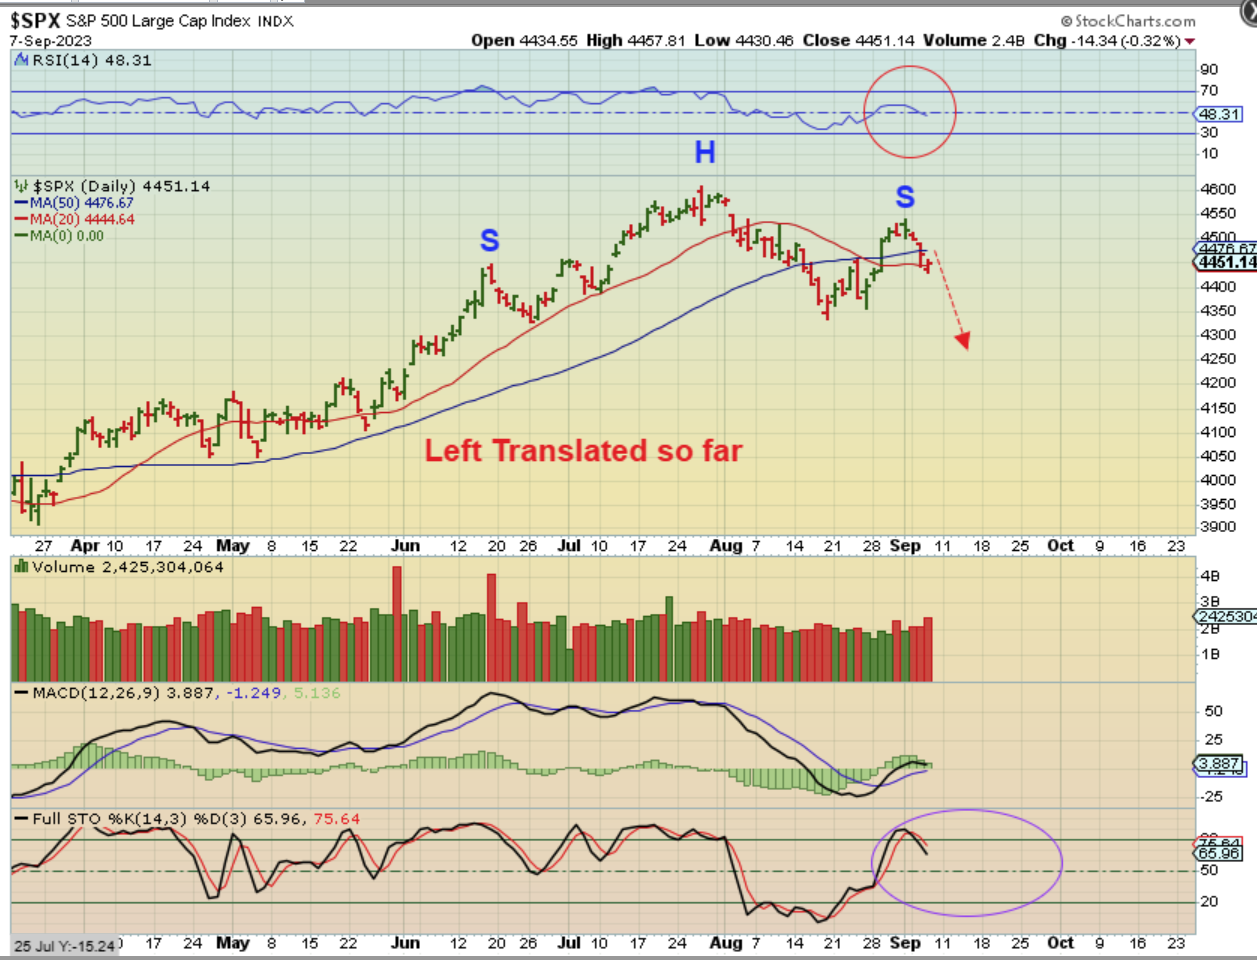
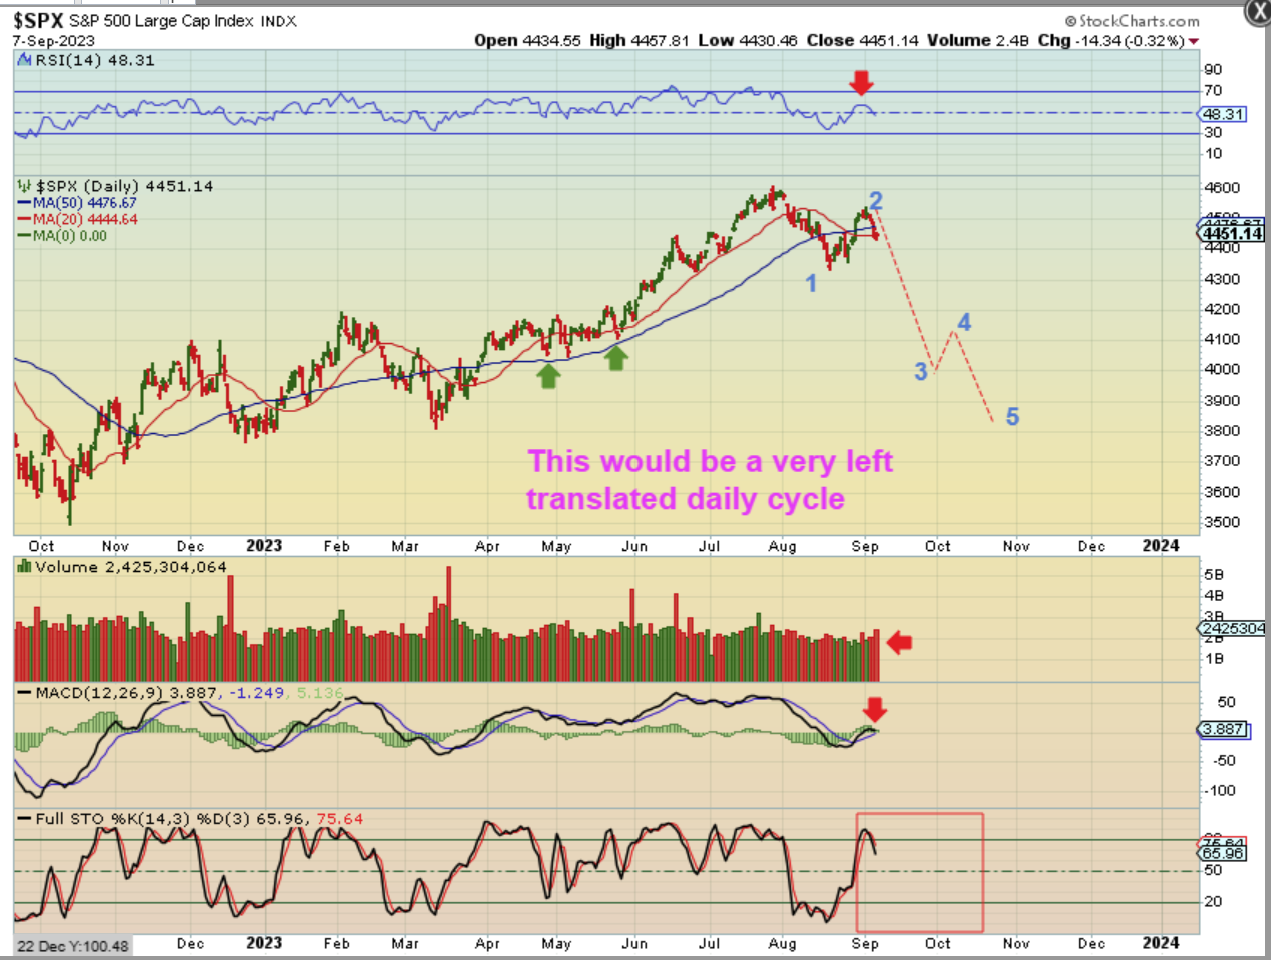
So while the NASDAQ may look ok, The SPX does look like it’s starting to get weak here. Price lost the 50 & 10sma and the RSI is slightly breaking down. Is this just a 1/2 cycle dip and an eventual back test of the trend line? Maybe, but …
..
Do you recall? When we were well above the 50sma, I said that I would raise my stops to the 50sma, so I am now out of Buy & Hold long positions and just trading set ups intraday. Different stocks also offer different set ups. If I owned a stock that is still above its’ 50sma, I may be in that trade with a stop at the 50. On this SPX Chart, Losing & closing below the 20sma on Friday may mean that this is setting up for one of those October Crashes?
\.
Time will tell, but price recovering the 50sma could be an opportunity to buy or add with a stop. Losing the 20sma may mean that we are going to selloff over the next few weeks. This would be a left translated daily cycle and has plenty of time to drop. I’ll discuss this more in the weekend report.
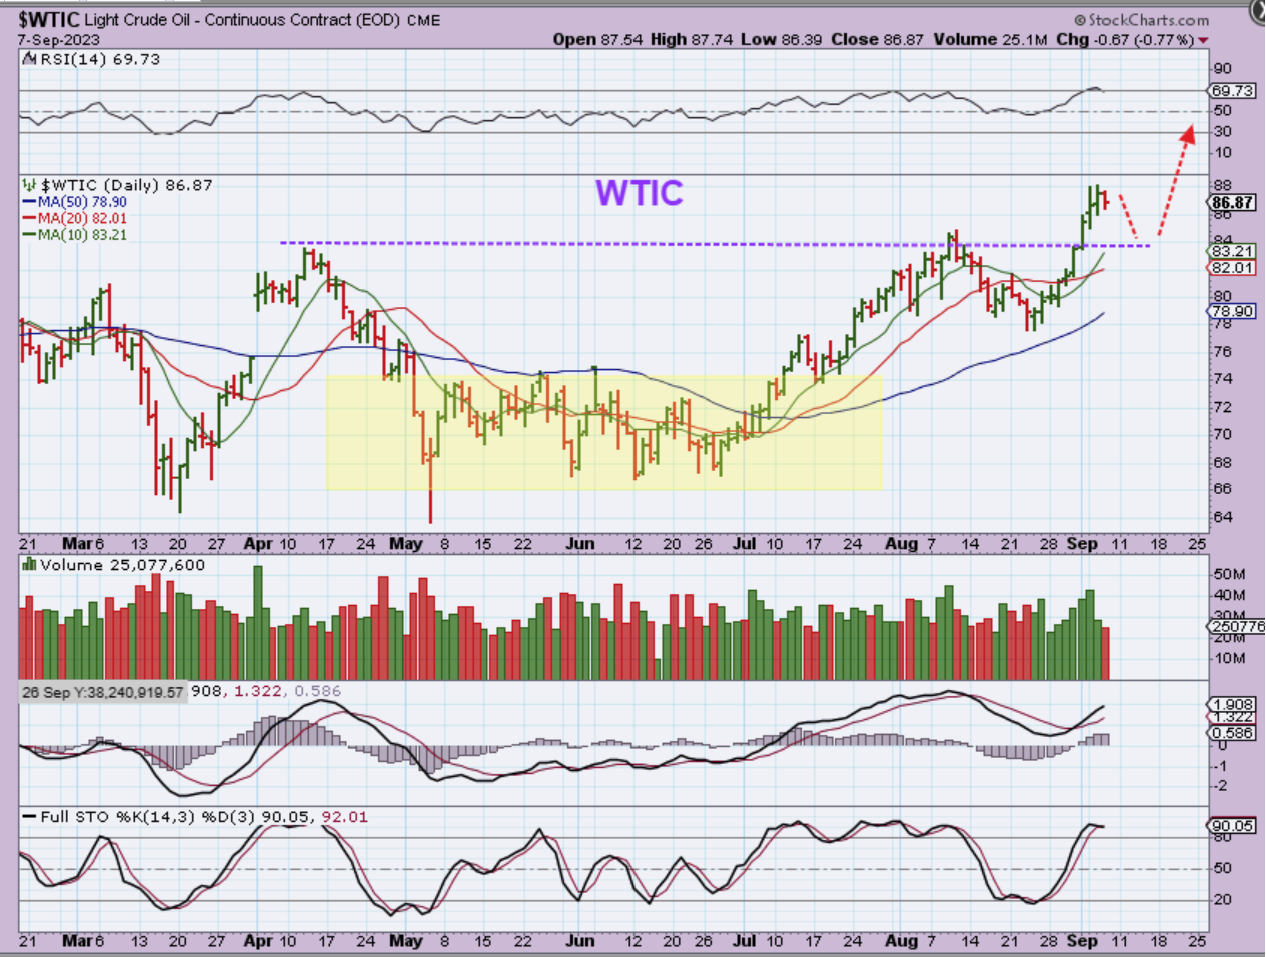
WTIC – It looks like Oil may finally be ready to take a break. It could just bull flag or chop sideways, because it was a strong run, but a dip back to the breakout and moving averages would offer a buying opportunity if it happens.
YESTERDAY I WROTE:
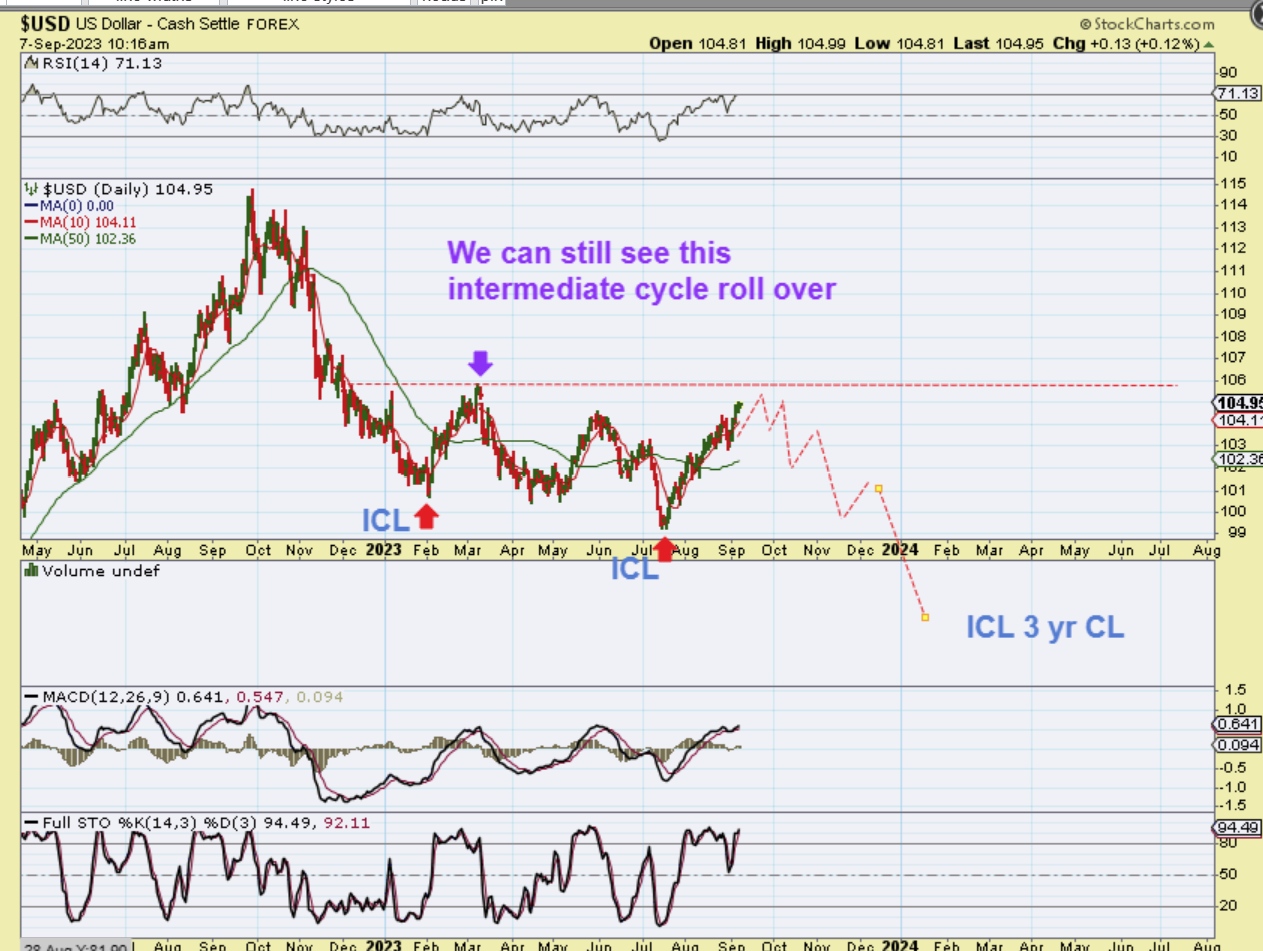
1. The USD looks to have crashed down into an ICL in February.
2. That crash was followed by a rally and then the drop into the May lows.
3. Next it seems that we saw a false rally that rolled over into a July ICL. It doesn’t seem that those Mays lows were an ICL, since the July lows were only 2 months later. So what I am saying is that until we get above that March high we would still have a lower intermediate high.
The USD could chop under $106 in this 2nd daily cycle and then drop in a 3rd & 4th daily cycle. SO FAR, GOLD & SILVER are trying to hold up until this rolls over.
.
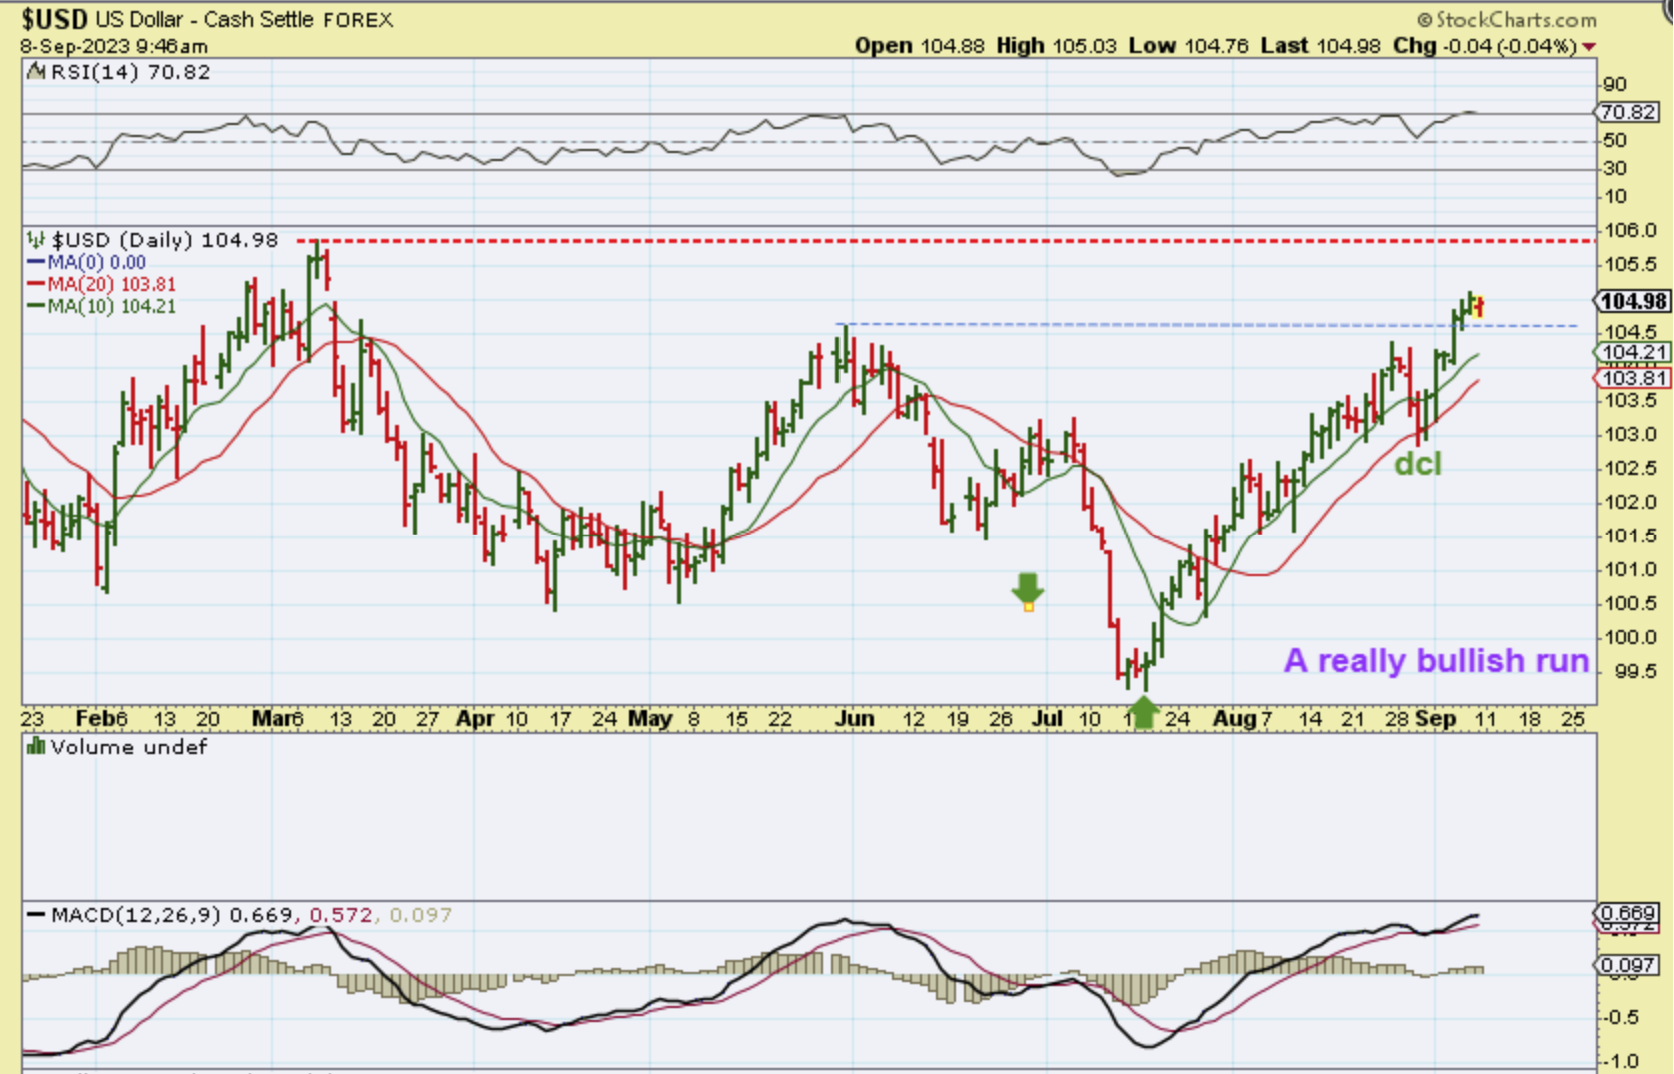
On Thursday The USD pushed a little higher, but it is pausing this morning. The timestamp on this chart says 9:46 am on September 8, but as I write it is 5:46 am September 8 and the USD is pausing.
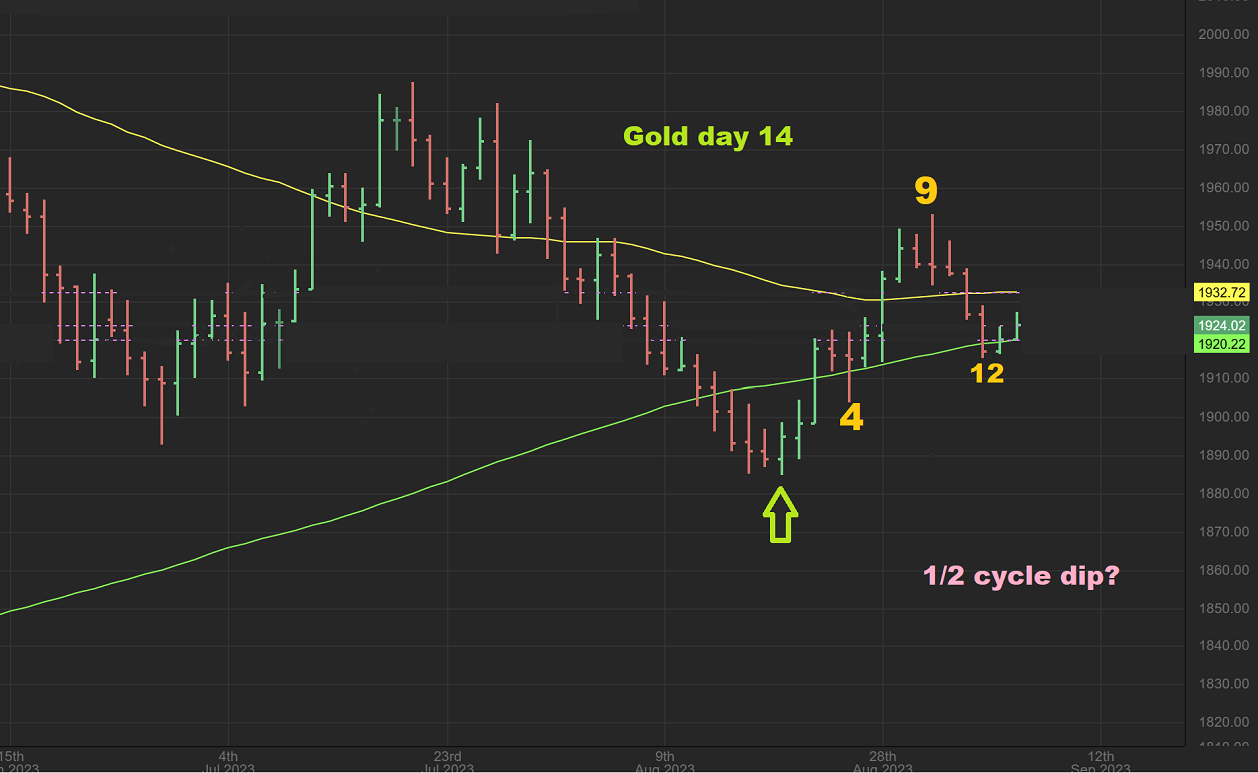
GOLD is on day 14 and is pushing higher this morning as he USD pauses. As seen with this live chart of Gold, it also seems to have regained that 200sma so far, so we’ll see if it can hold through Friday. This may be a 1/2 cycle dip. We do not have any significant data to be released today at 8:30 a.m.
,
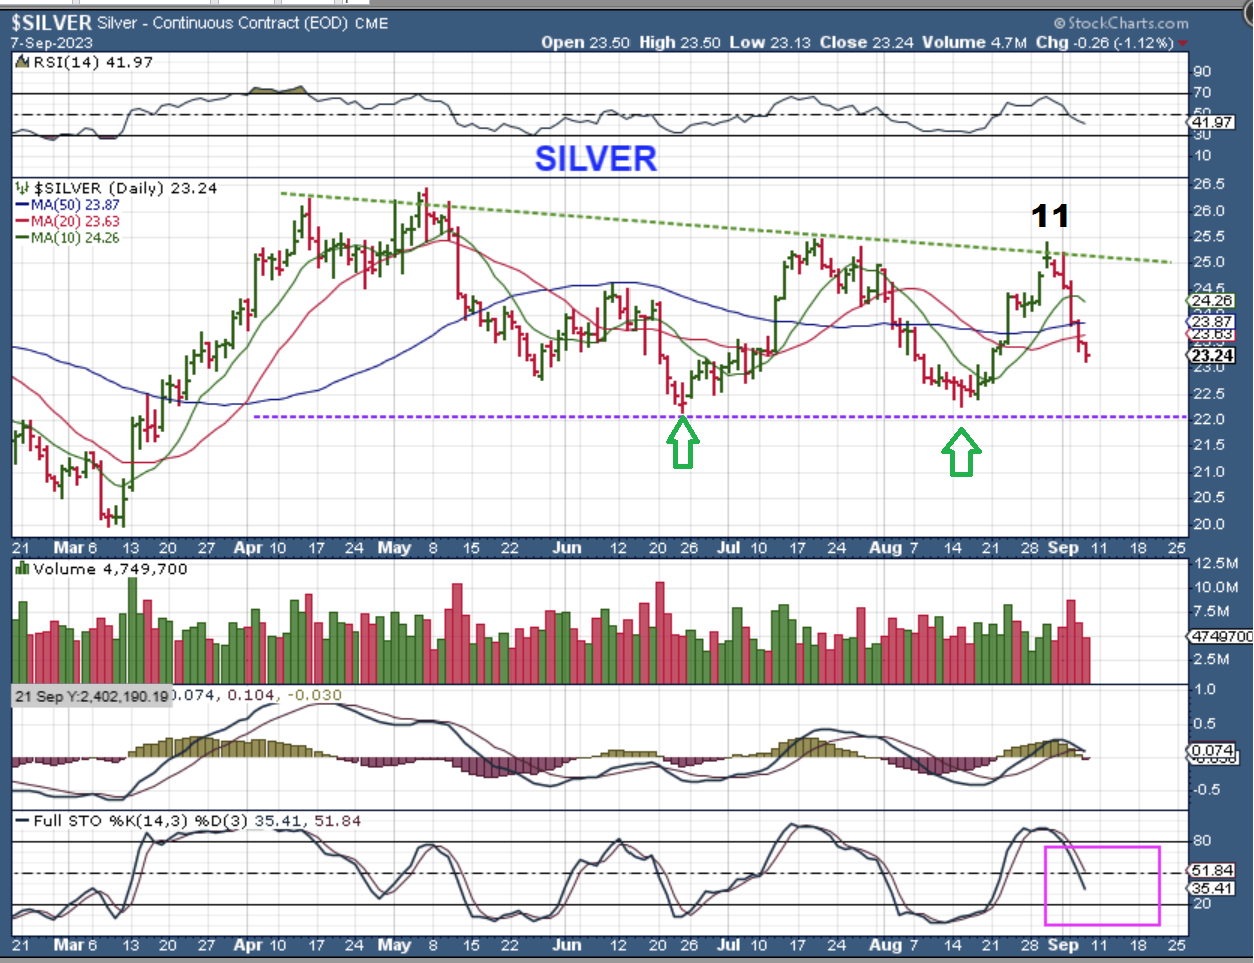
SILVER dropped a bit further yesterday and in yesterdays report I discussed this set up with the following chart…
,
Silver could retest those lows again. I am noticing this uptrend line that lands right where the price of the May & July lows would also be. So yes, we may see Silver return to the lows, and THEN we’ll see if the Silver miners start to perk up as Silver bounces back up to the top of this triangle.
.
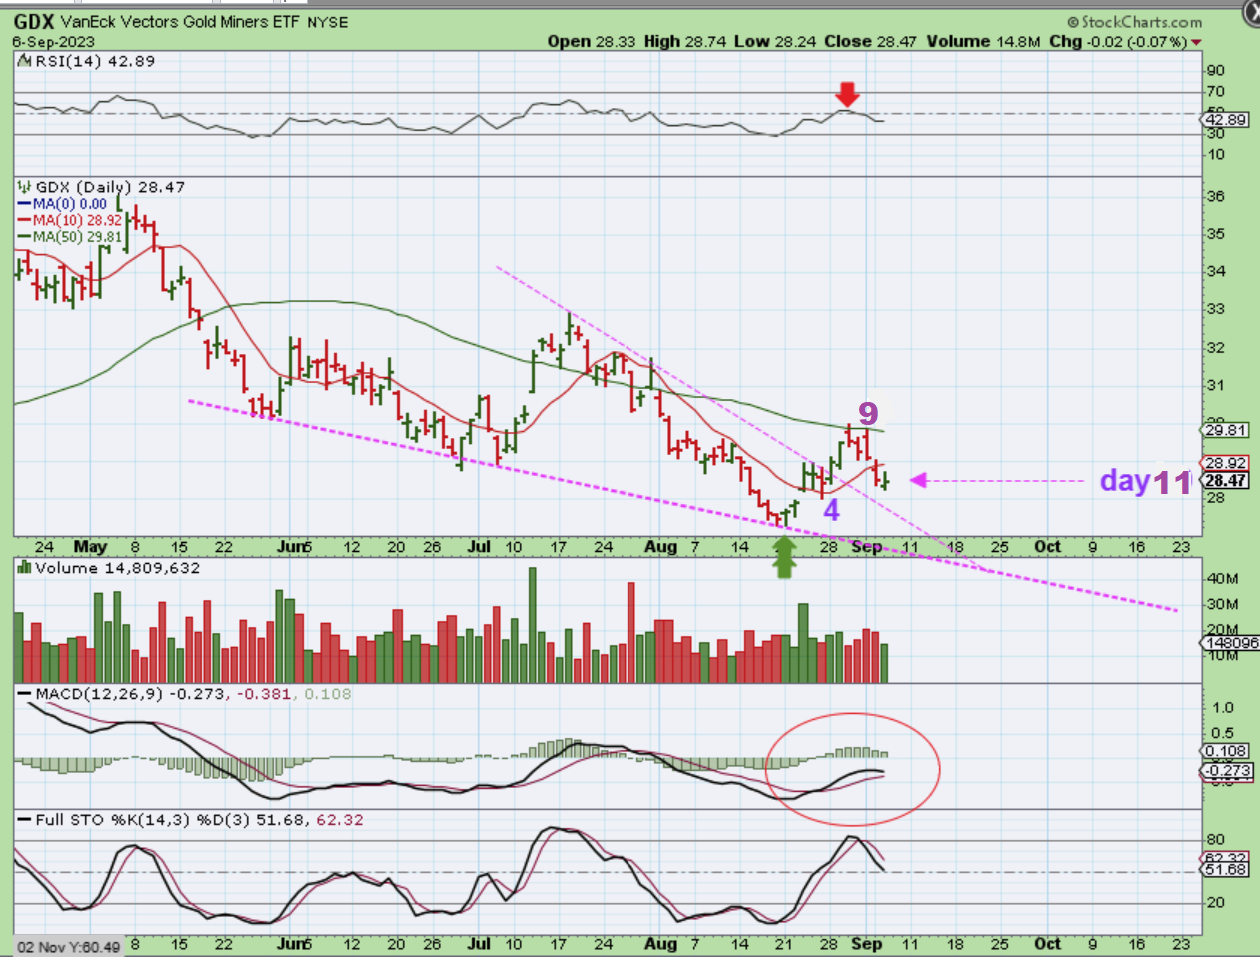
GDX was only down 19 cents by the close. Miners are choppy and have to be discussed as looking weak since being rejected at the 50sma twice. I see some Miners that look ok, but as mentioned, EXK, FSM, AG, and a few others actually broke the August lows. So…
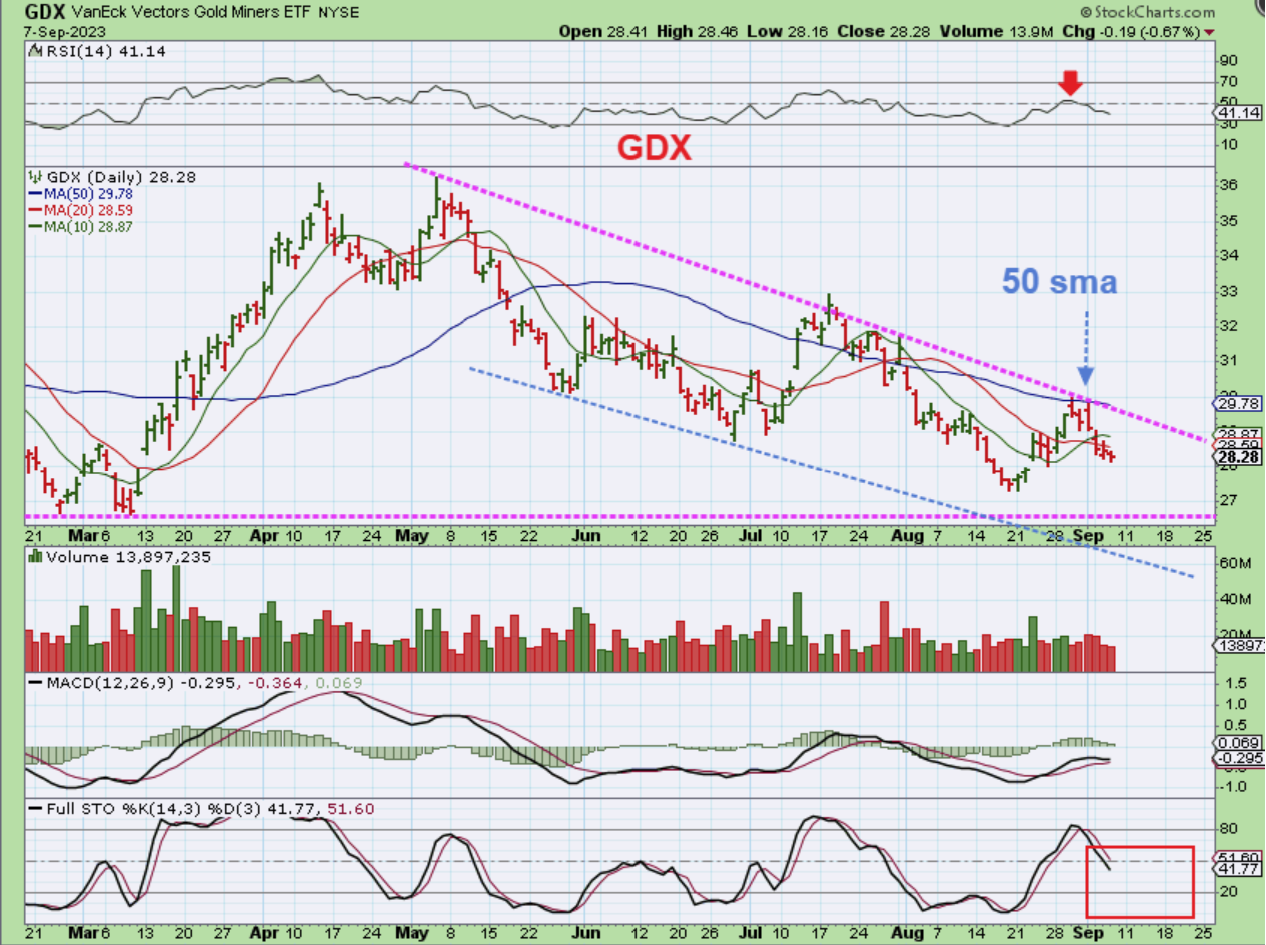
.
So when I look at the GDX stochastics & the lower trendline and I see that it has more room to drop. For those reasons, I am now cautious about how this may play out. In 2016, Gold and Silver actually bottomed 1 month before GDX did.
.
From yesterday:
If I were to just look at this chart of The GDX without thinking about the USD, I would say that it is still ok so far. The MACD is fine and it may just be back testing that wedge break, so it really needs more time, but I am cautious here.
.
It is becoming increasingly rare to find Miners that are still looking decent, but it may be a good idea to do so, since they may outperform when the sector runs higher.
.
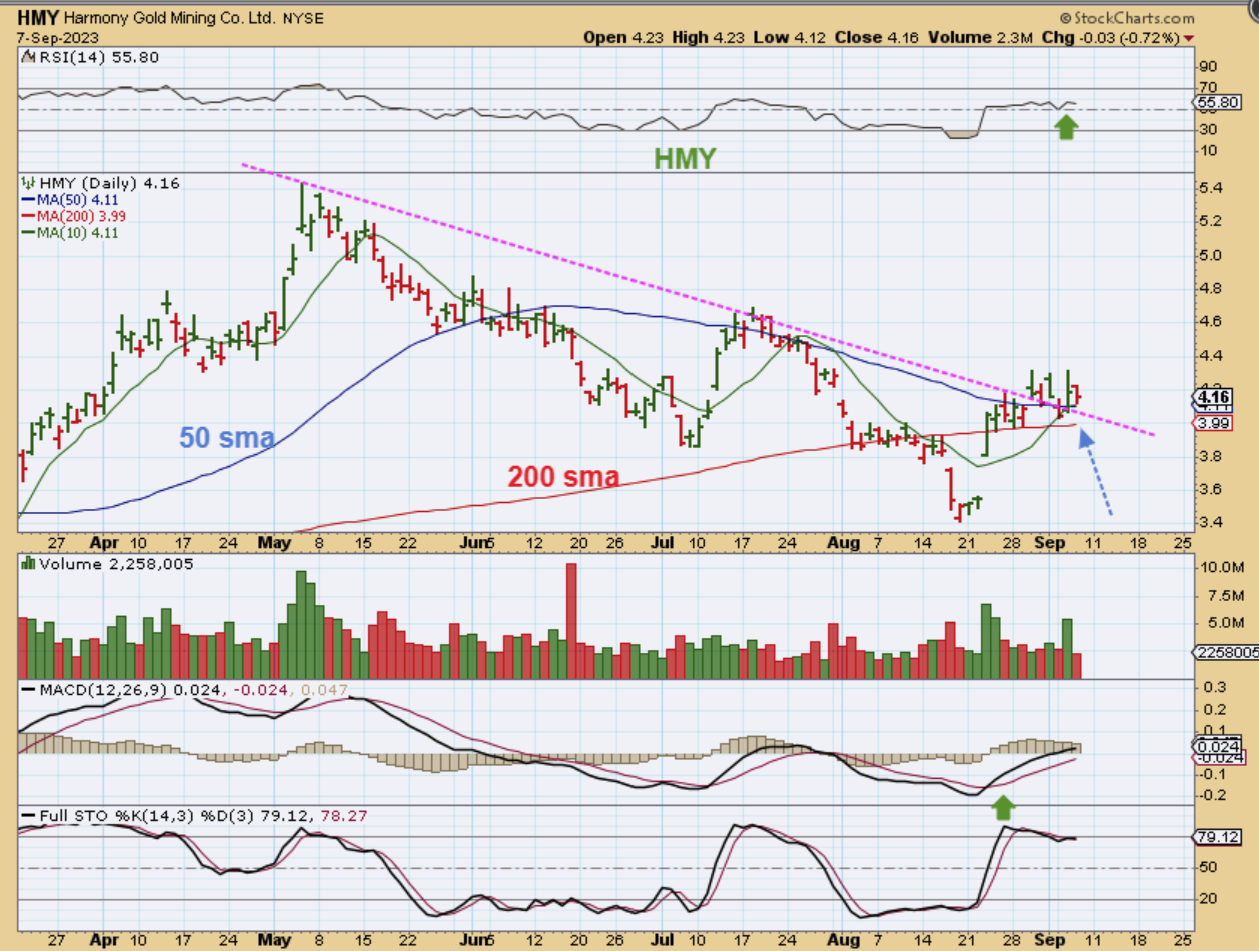
HMY actually remains above the 50 & 200sma, and those are pinched together.
.
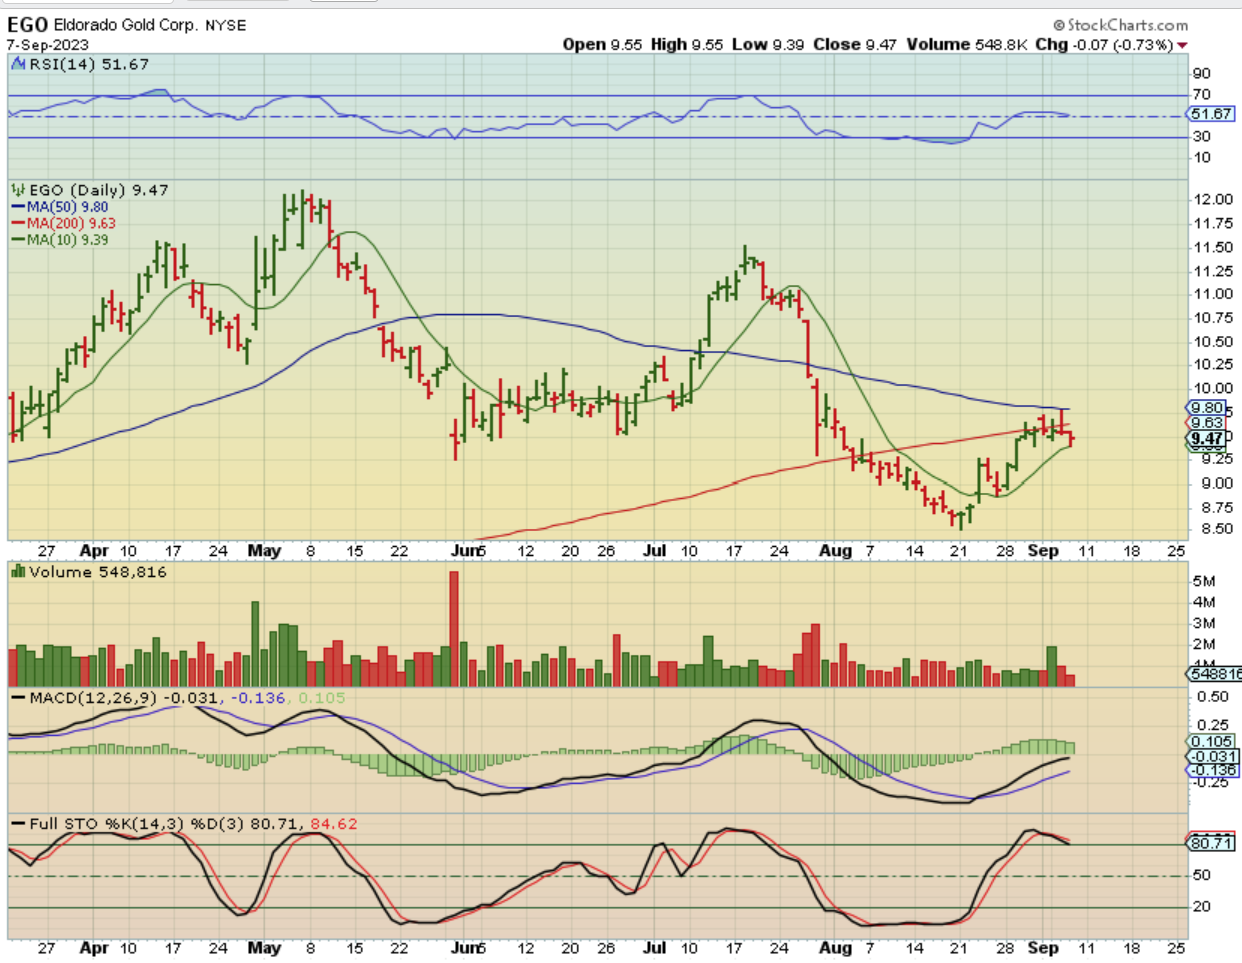
EGO was rejected at the 50 sma on Wednesday and is crawling above the 10sma and just under the 200sma. It held the 10sma yesterday, but that doesn’t make this ‘a strong miner’, just stronger than others for now.
.
Today is Friday and this was a shortened week of Trading with US Markets due to the holiday on Monday. So far, it was a 3 day week that consisted of choppiness, a ‘weak week’ in many sectors. Nothing is broken yet, but this weakness is often frustrating and concerning, especially if the General Markets continue to close under the 50sma. We’ll just have to wait and see if we can get a Friday bounce back or a Friday sell down.
.
As a warning again: A sell off in the General Markets today could have us closing below the 10, 20, & 50sma. That would be a warning sign to me and it could indicate that another wave of selling may follow. Was this just a ‘dead cat bounce’? If so, we could see a 5 wave drop or an A-B-C drop. We would have a very L.T. Daily cycle, so…
.
We would have a very L.T. Daily cycle, so it would have plenty of time to drop. The stochastics is overbought too. If we close under the 10, 20, & 50sma on Friday, you could start thinking about whether or not you want to go short next week. you could use SOXS, SQQQ, SPXS as leveraged short trades if you wanted. For now, Let’s see what Friday gives us.
.

