September 3rd Weekend Review – The Long Weekend
I want to release todays long report this morning, but I do not have time to proof read it first before I leave for the day. I have decided to go ahead and release it without proof reading, and hopefully if there are any typos or wrong words in a sentence, you can understand it ( For example, I often catch myself typing ‘but’ when I try to type ‘Buy’). So if I write: “When that gets above the 50sma, you could but it”, that means you could buy it 🙂 If you do have any questions, you can ask in the comment area and I’ll fix it when I get home. Thanks!!
.
NASDAQ WEEKLY – The NASDAQ remains bullish, reversing off of the 20 week ma and closing at the highs of the week 2 weeks later.
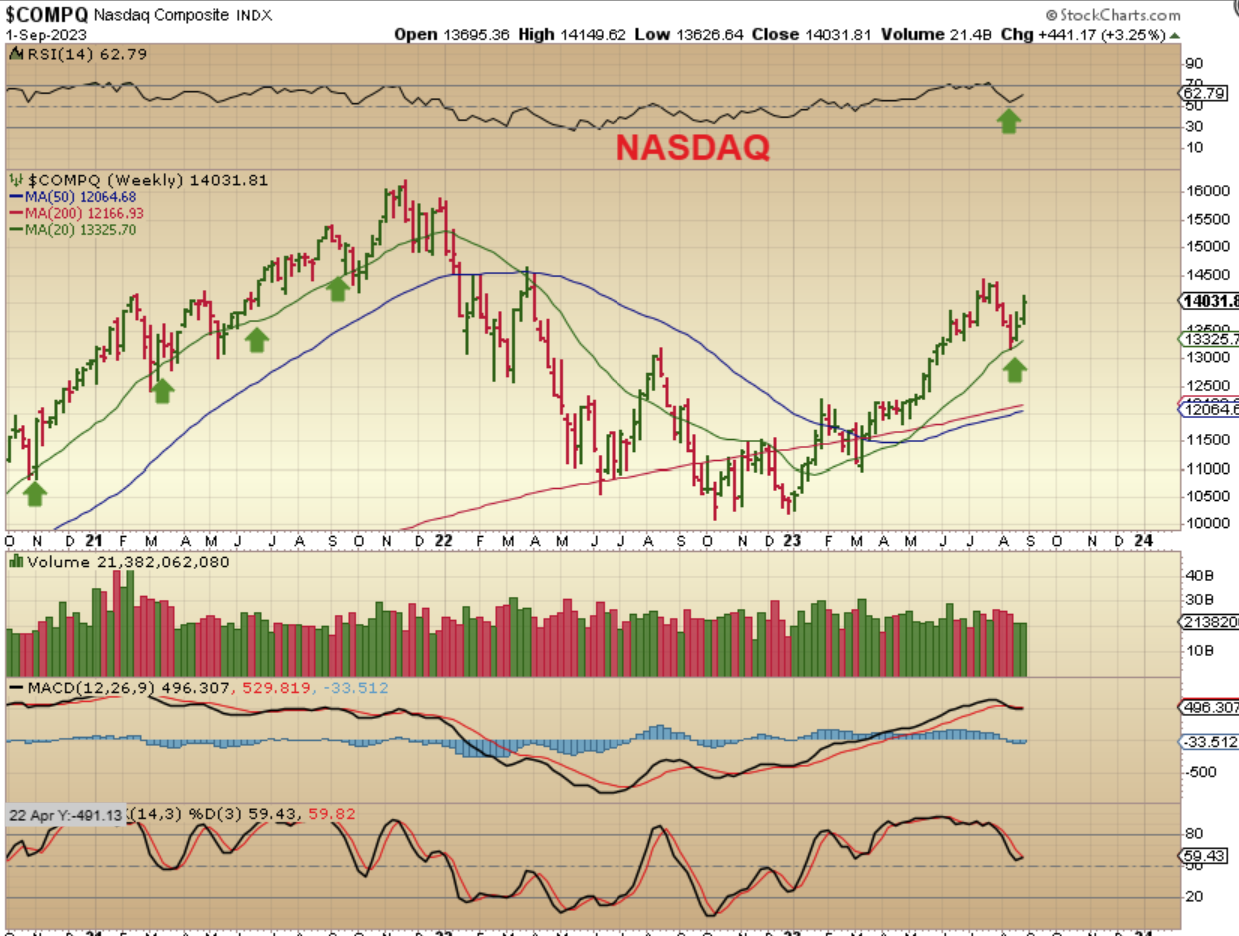
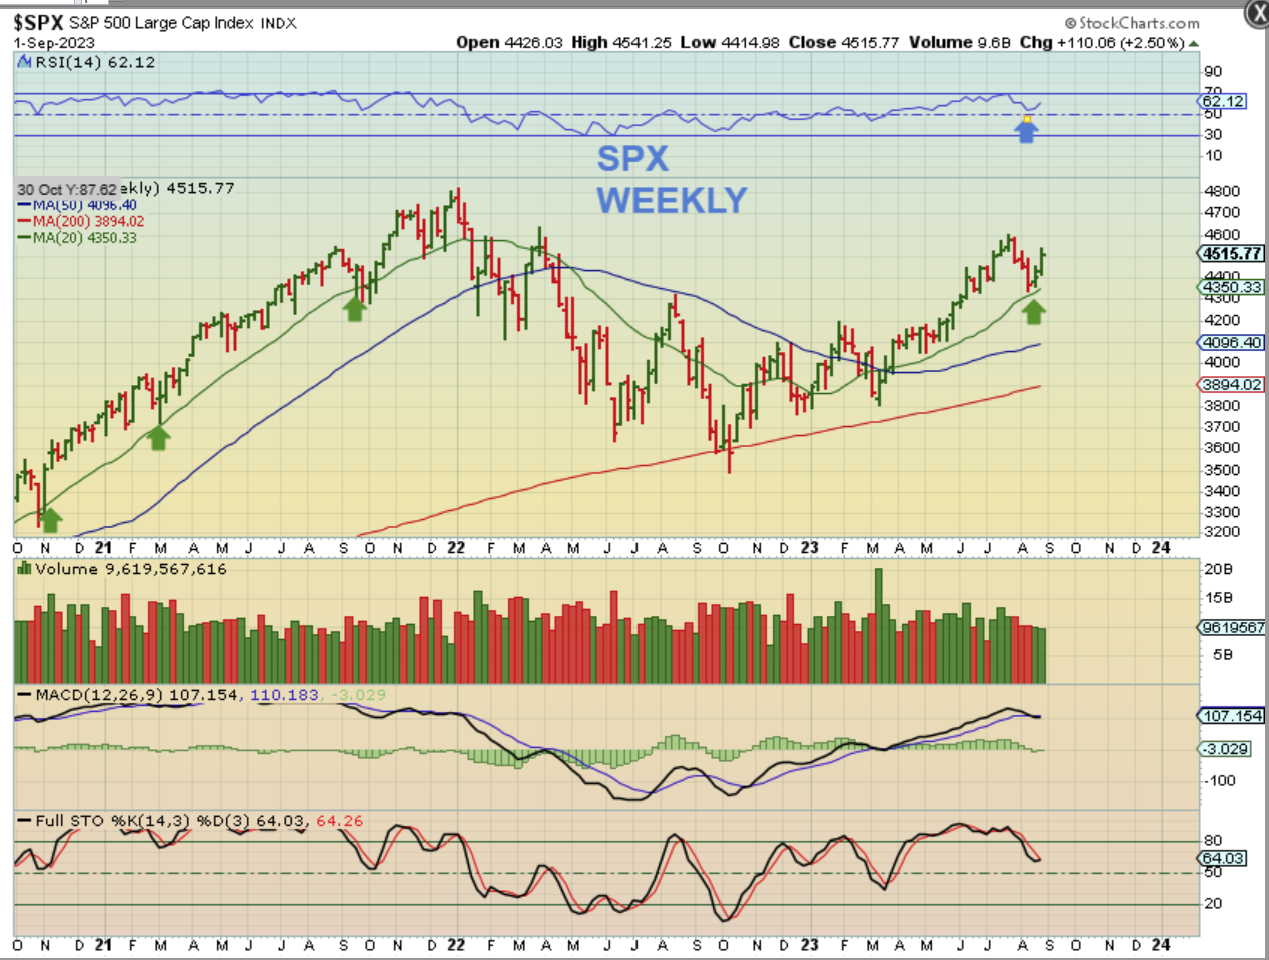
SPX WEEKLY -The SPX also reversed at the 20 week ma and closed up 2.50% on week two. The weekly RSI on both of these charts curled up above the 50% line, and that is bullish.
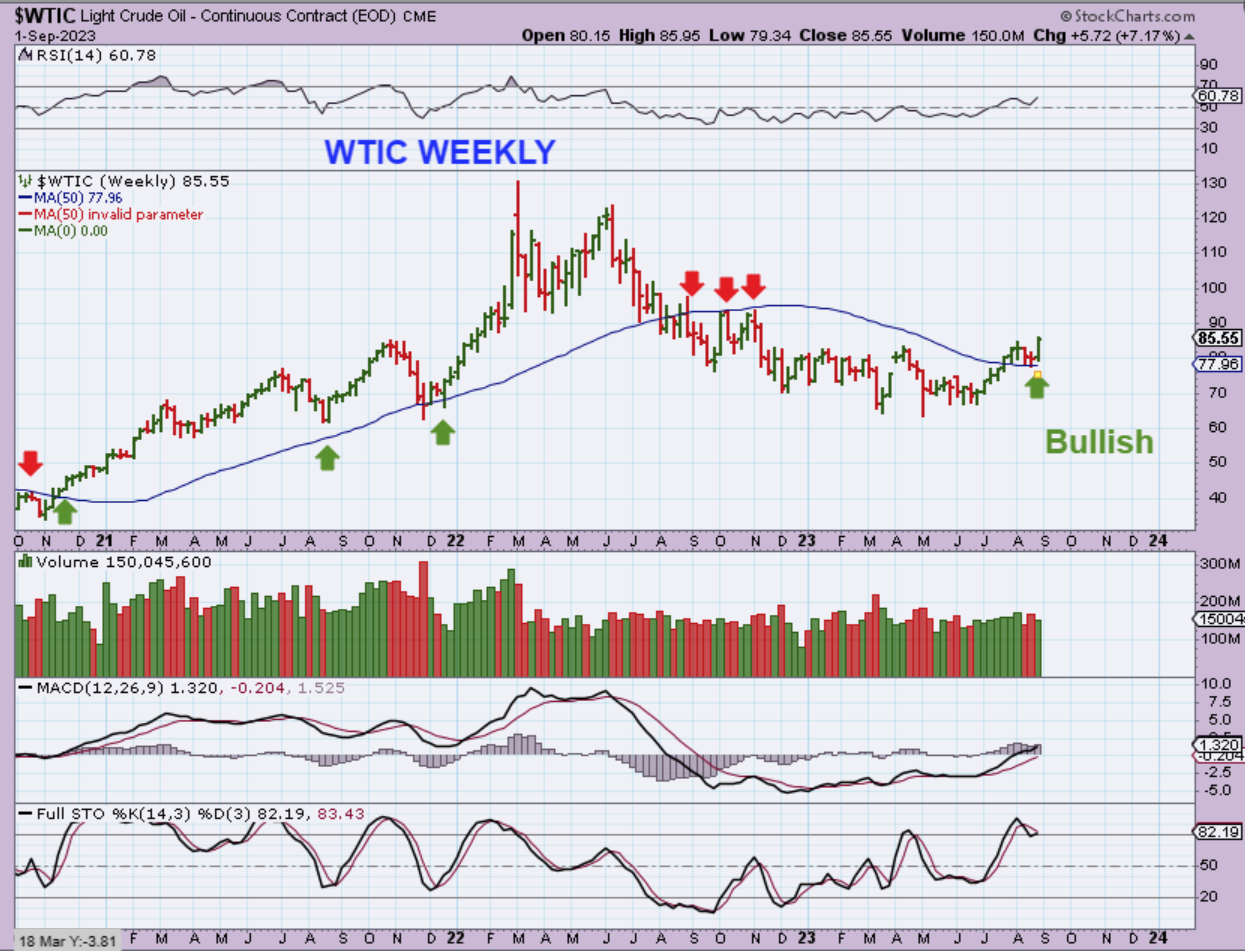
WTIC WEEKLY – Oil remains bullish after dipping into a dcl and reversing sharply. The RSI curled up at the 50% line here too. Oil looks like it wants higher prices.
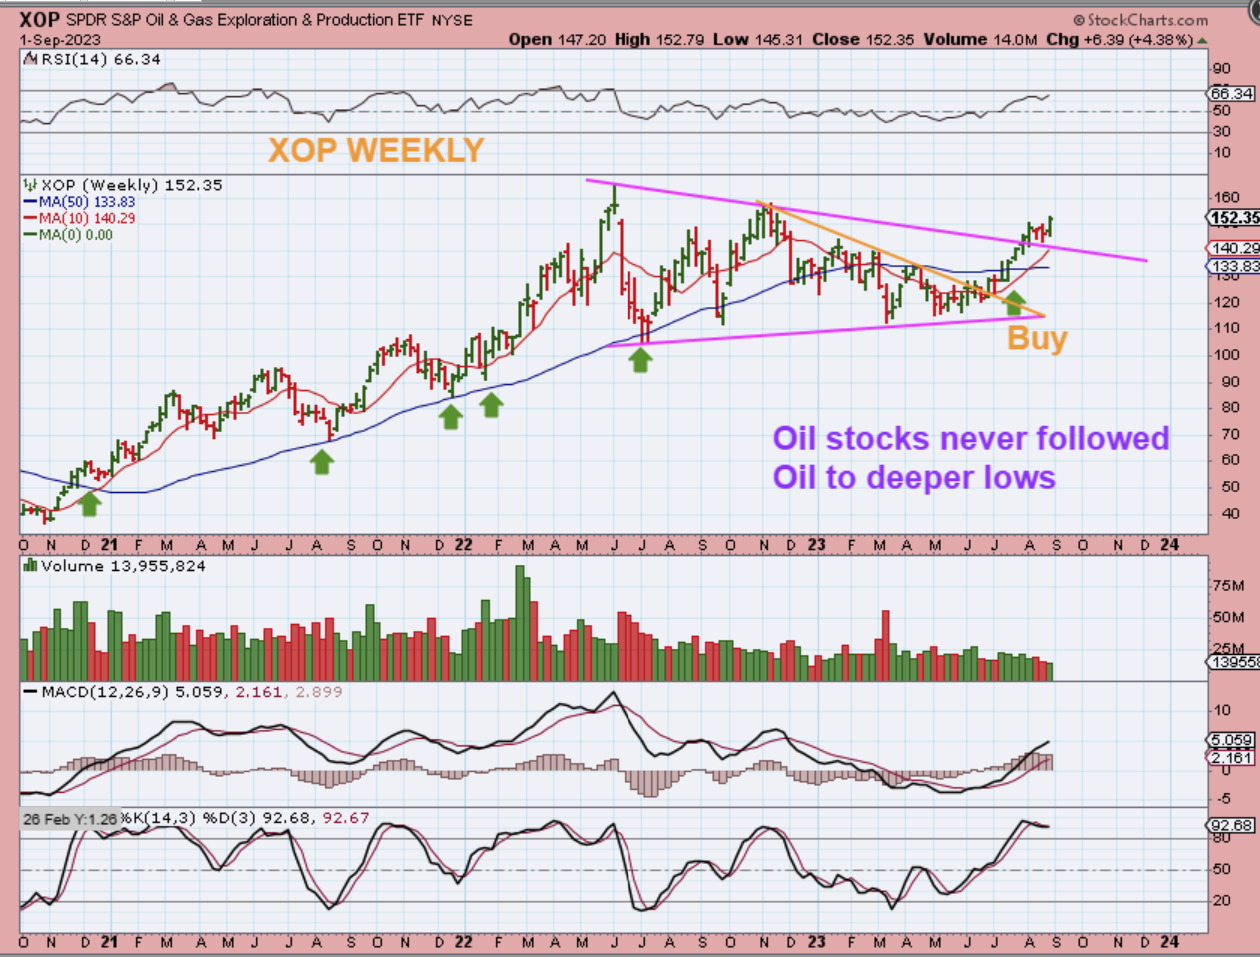
XOP WEEKLY – Oil stocks have been running higher for weeks and after a very mild dip that back tested the trendline, it reversed higher too.
.
I have been saying this for a while now: Even though we would be expecting a drop into the 3 yr cycle low, this chart continues to give off bullish vibes.
.
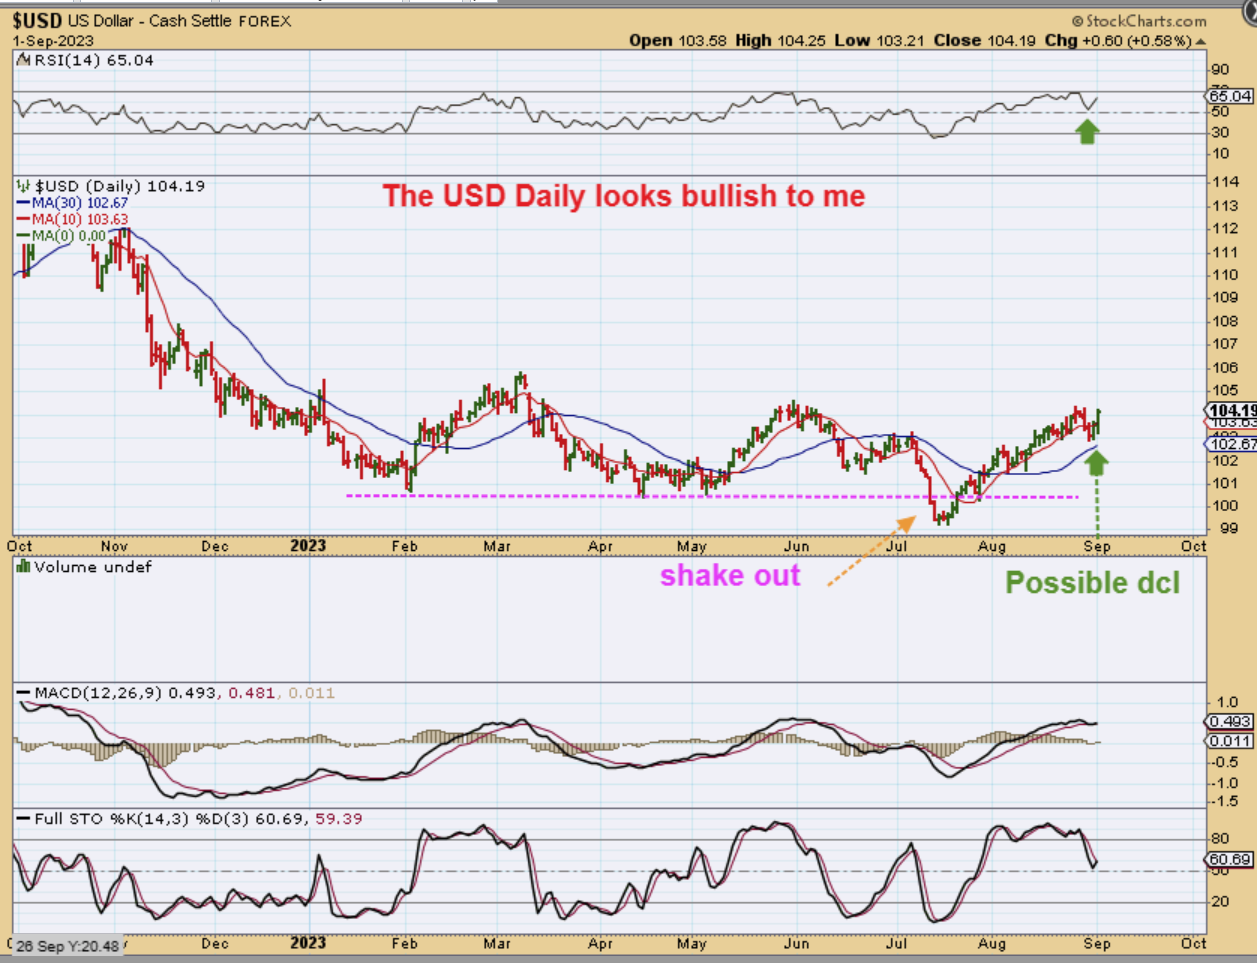
USD DAILY – On the daily I was looking for a dip into a dcl as we got late in the count. We got the dip, but it was very mild and we may now have a dcl in place with a strong push higher on Friday. This honestly looks to be a bullish chart. You will see when I get to the weekly charts that…
1. If this chops sideways and dips lower, we are fine, but…
2. If it rips higher, that becomes weekly bullish too.
.
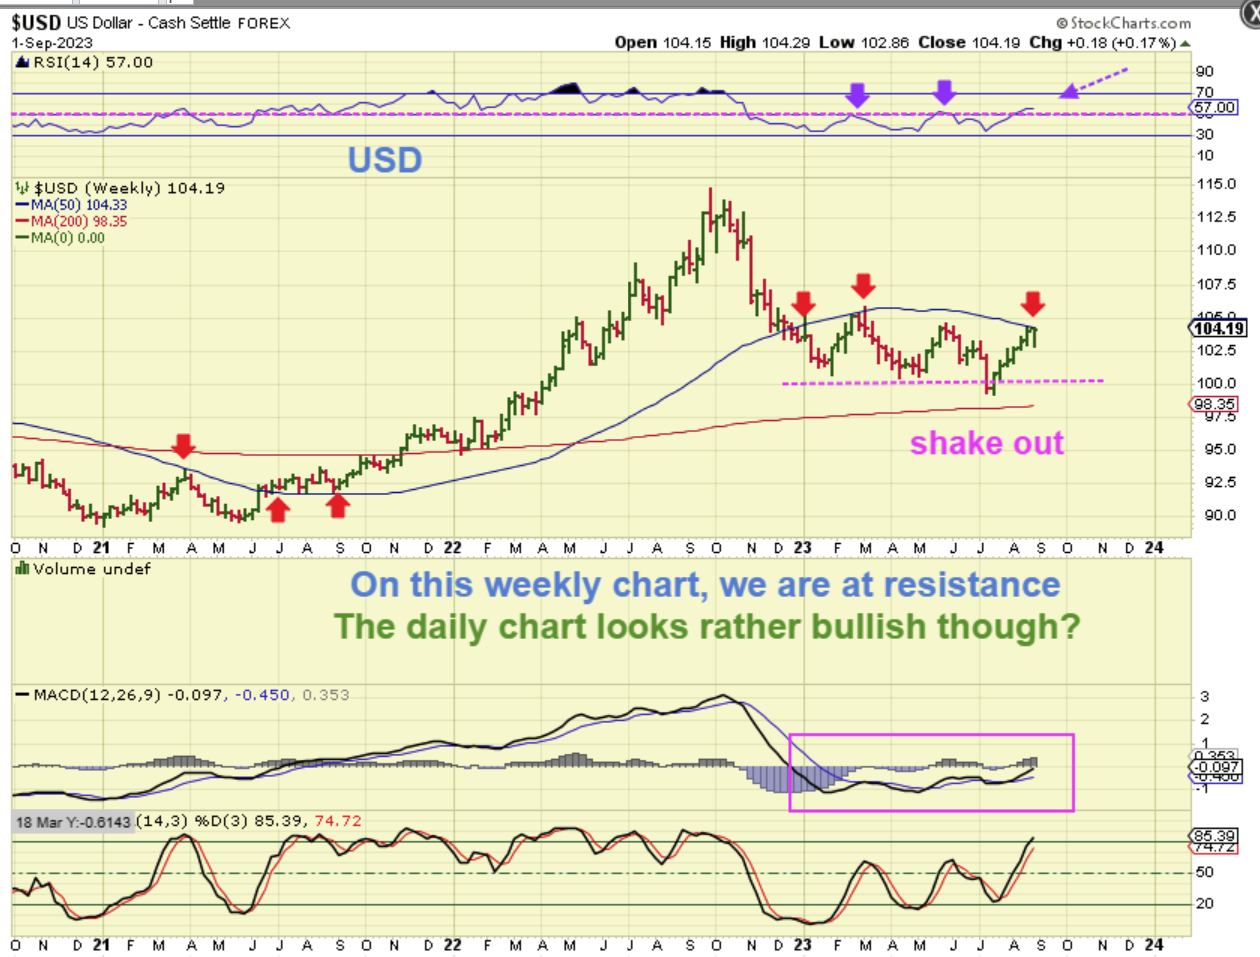
USD WEEKLY – You can see why I said the above. The USD is still at resistance and if it chops sideways and starts to dip lower eventually, this will be a rejection at resistance. A rally higher is a breakout and …
.
The Bullish USD version: A rally higher is a breakout and in the last 2 weeks, I have entertained the idea of a possible 3 yr cycle low coming in 6 months early with that ‘shake out’. This would possibly come due to Fed rate hikes and other circumstances. Next – a more bearish version on the USD…
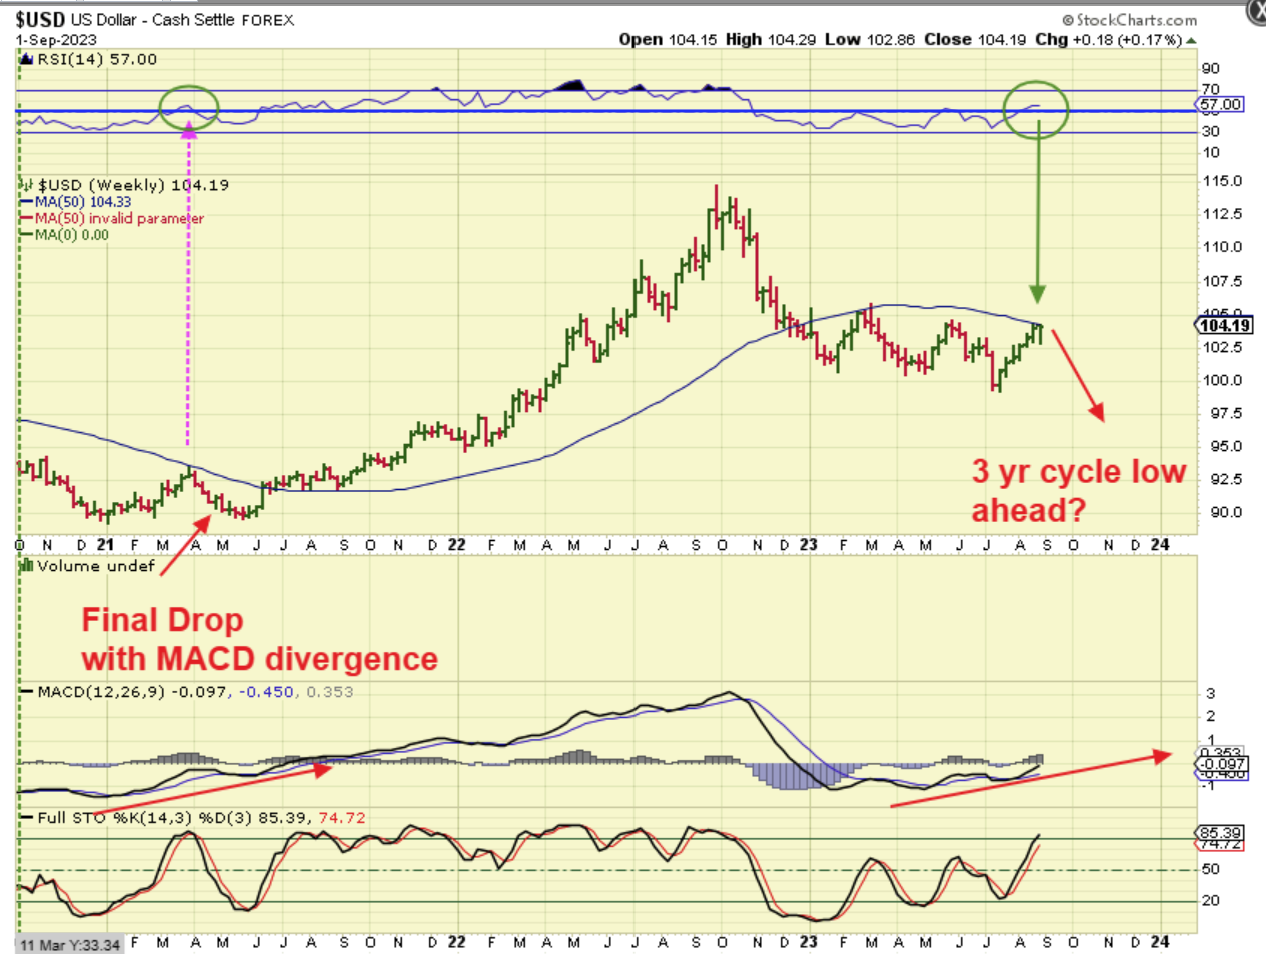
USD WEEKLY is at resistance. It looks similar to the 2021 run to this area as the USD was due for 3 yr cycle low. The RSI went bullish then (& now), but it still did that final drop as the MACD continued rising (divergence). So we just have to give this a bit more time, and see what that USD will do. We also need to see whether or not Gold can break higher under either circumstance. We have seen times in the past when Gold and the USD ran higher together. It is rare, but possible under inflationary conditions.
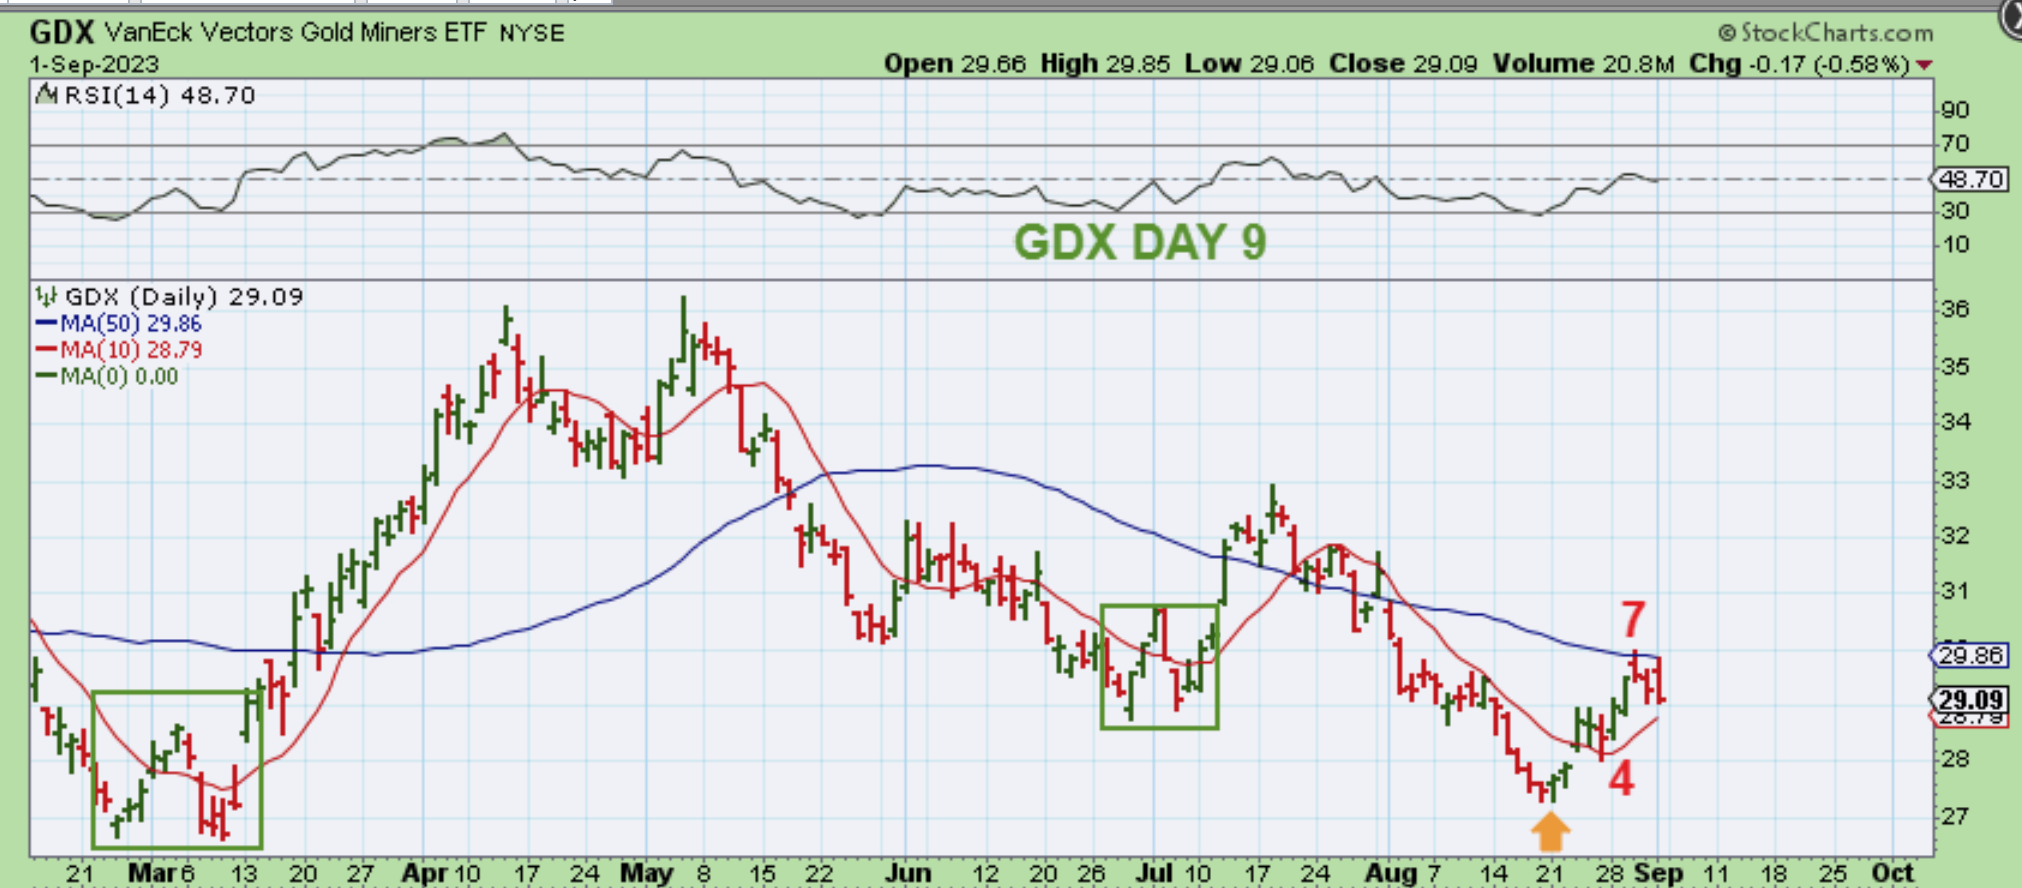
GOLD DAILY – I just found it interesting that Mon-Wed has seen a strong move in Gold, and then as the week ends, we see a sideways chop lower Thursday & Friday. Looking at Gold here, it made a new high on day 9 and then dipped mildly as the USD surged on Friday, but it remains nicely above that 10sma and the 50sma.
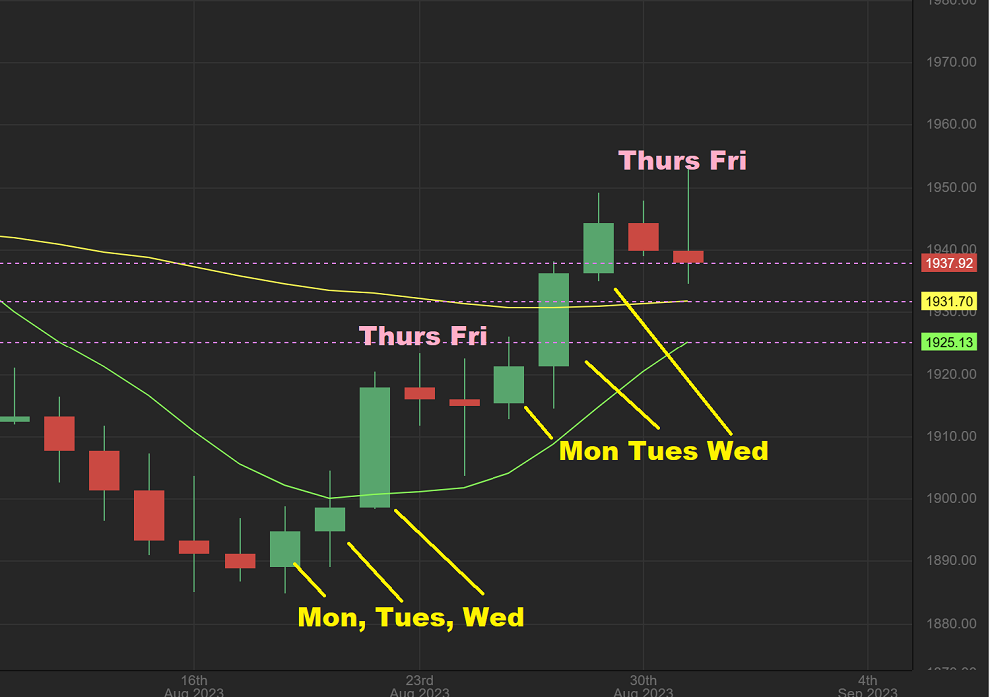
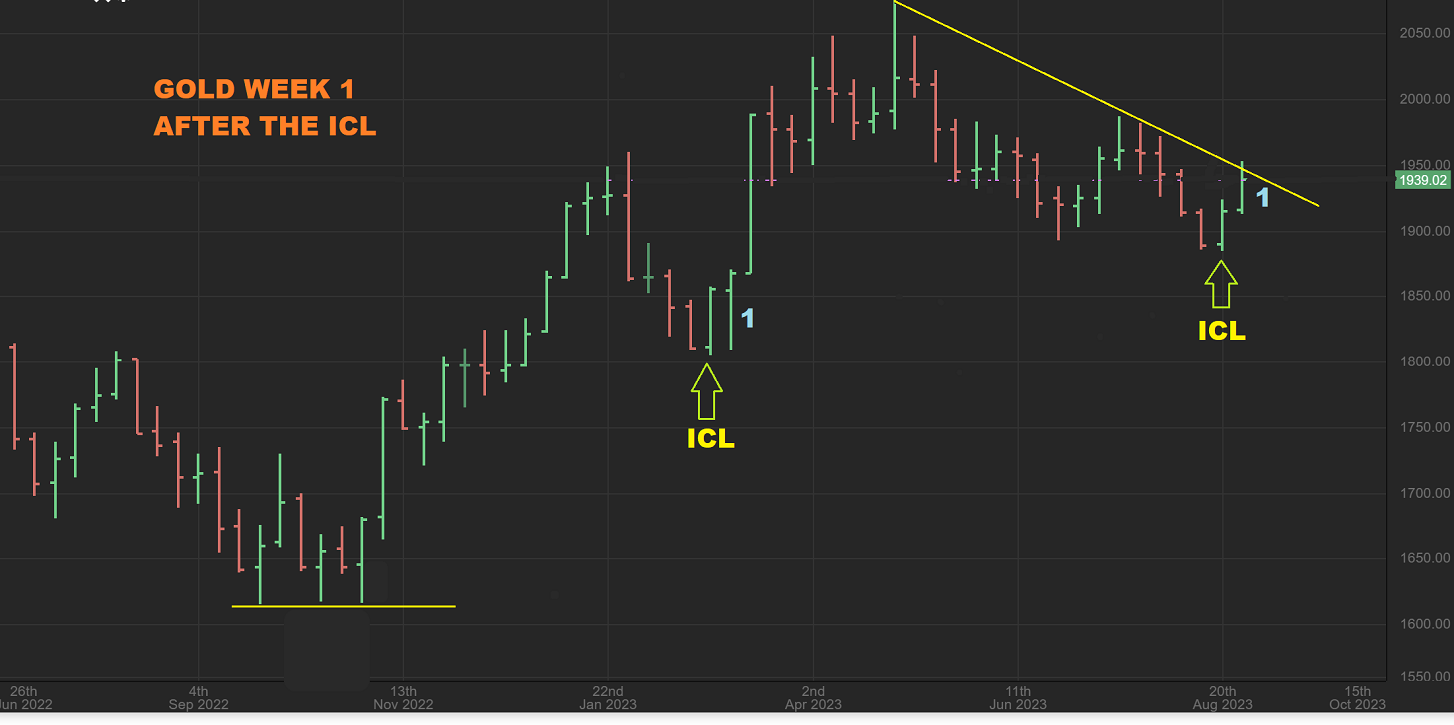
So with Thursday and Fridays dip, The GOLD WEEKLY Chart shows nothing unusual. We are pushing on a trend line and I’d love to see this break higher next week. That USD is of course the obvious obstacle, because if The USD breaks higher, Gold could pull back. We just have to wait and see if Gold can break out next week. This was only week 1 after what should be an ICL swing low in place.
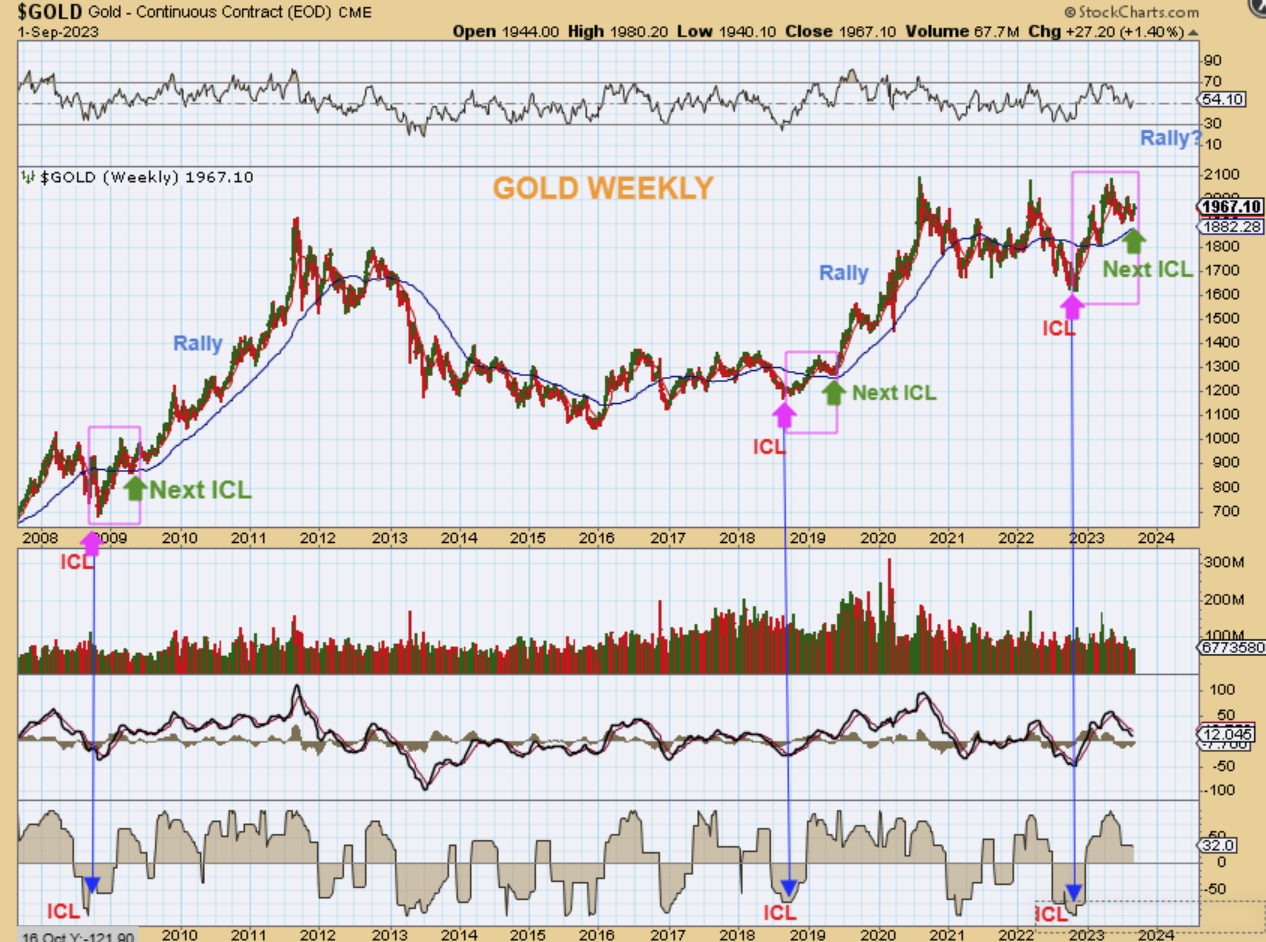
GOLD WEEKLY – Here I wanted to show you how things have unfolded so far, since calling that Deep ICL shakeout (Intermediate Cycle Low) In Oct 2022. As you can see in the Magenta Square, it has unfolded exactly as it did at the Major low of 2008, which gave us that strong 2008-2011 run, and the Major low of 2019, which gave us that strong 2019 -2020 run. This means that …
.
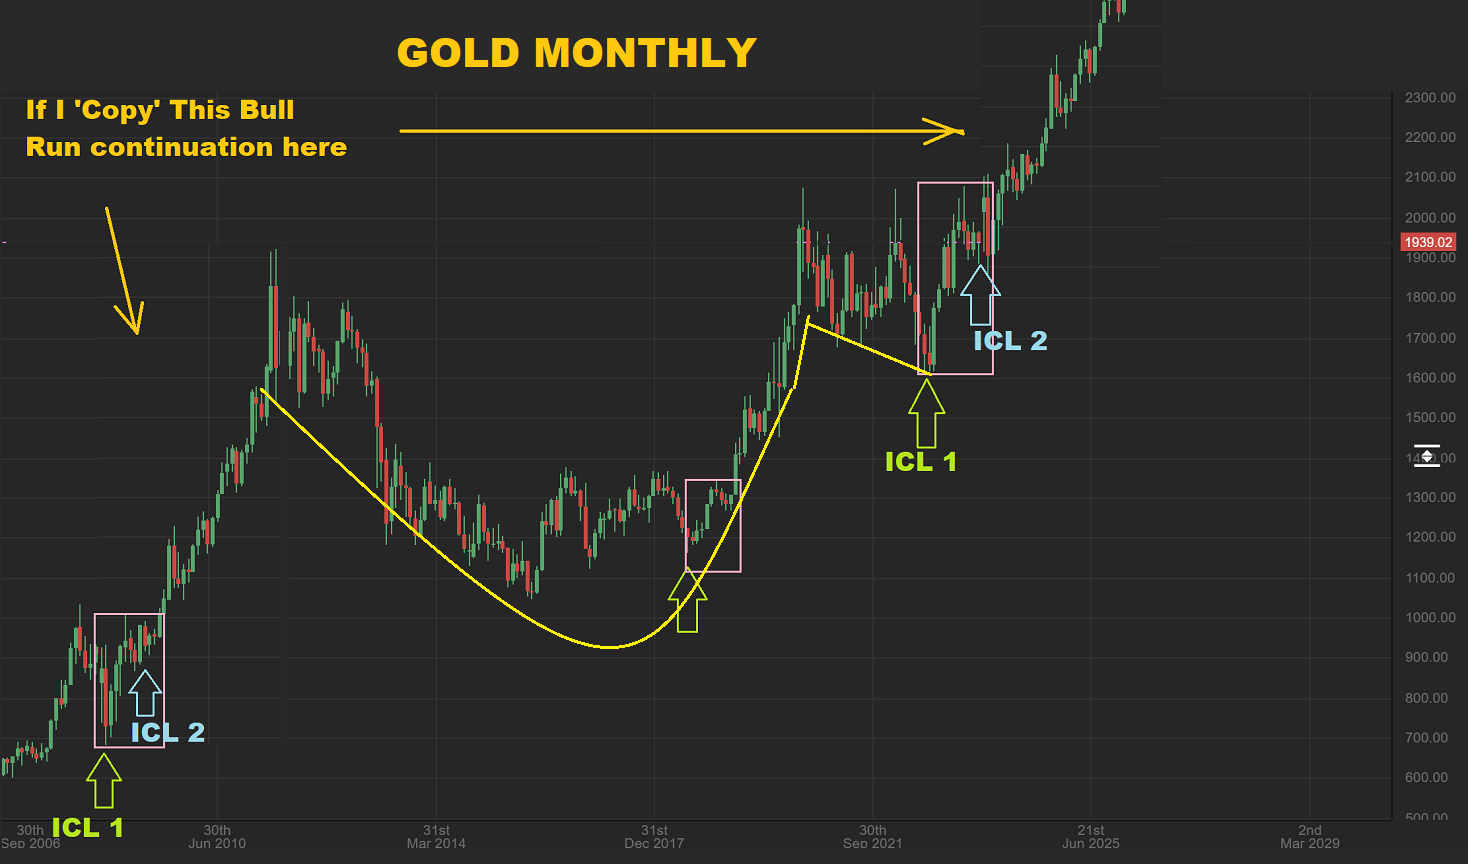
So this means that…let’s just say that a repeat of that 2008 run happens, which looks very much like what we have now (see the Magenta Box). This would give Gold a break to new all-time highs and a continuation of the strong run higher, so at this point this is what I still have to expect. Now take a good look at the 2008 ICL and rally on this chart and imagine that kind of a run higher from here. I can also show you that on my next chart- The Monthly chart of Gold.
GOLD MONTHLY – So if we do see Gold break out higher, I think we are in for a very strong rally and if this happens? You will not see any more weak looking Miners if this happens. Miners will double and triple as their profits greatly increase. We need this break out in Gold, and so far Gold and Silver are doing well.
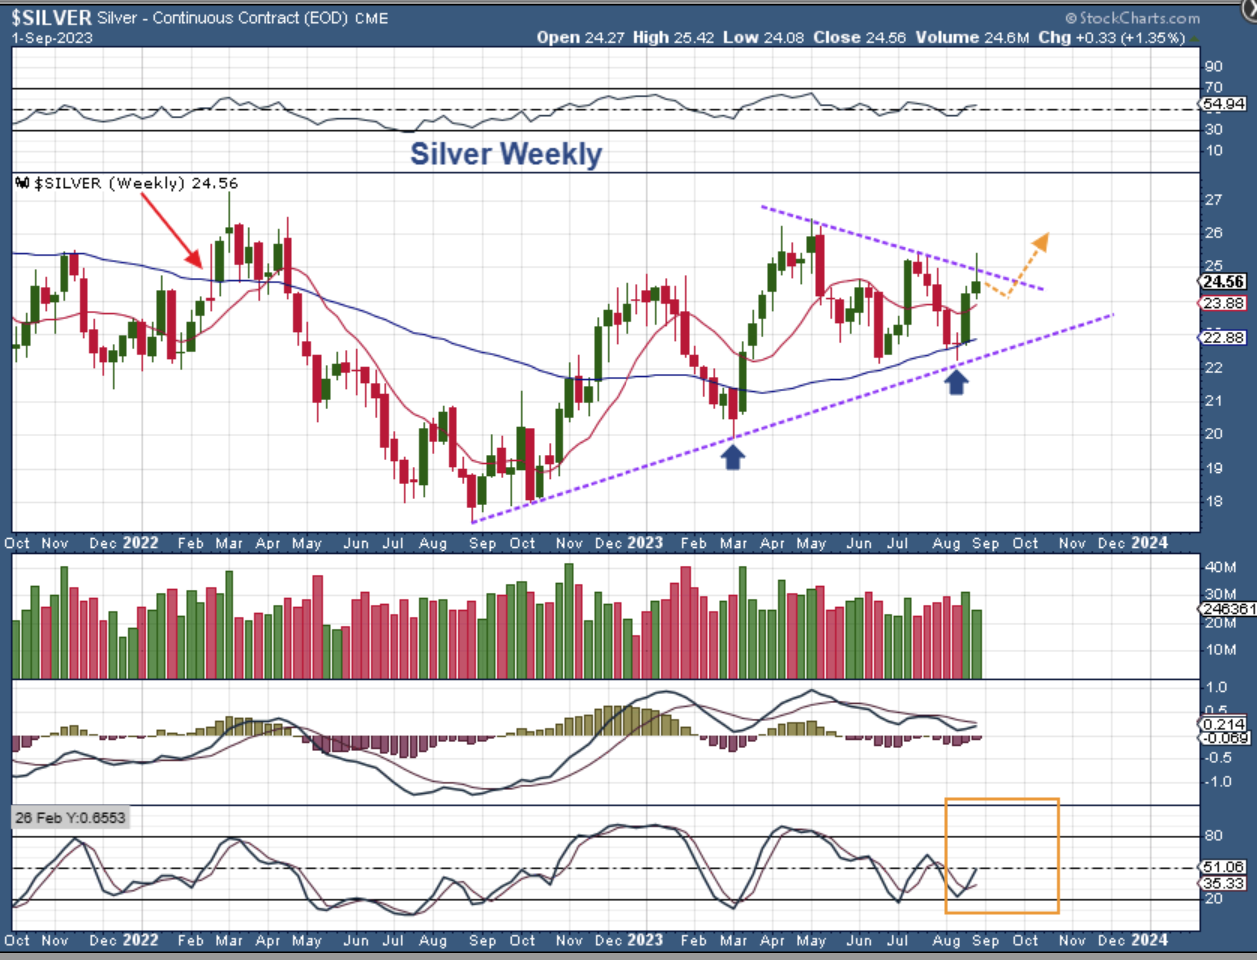
SILVER WEEKLY -Silver tried to break out on week 2 of its’ ICL, but it fell back inside. Price is tightening inside of a tringle-like pattern, but it appears to need a little more time. Let’s step back…
.
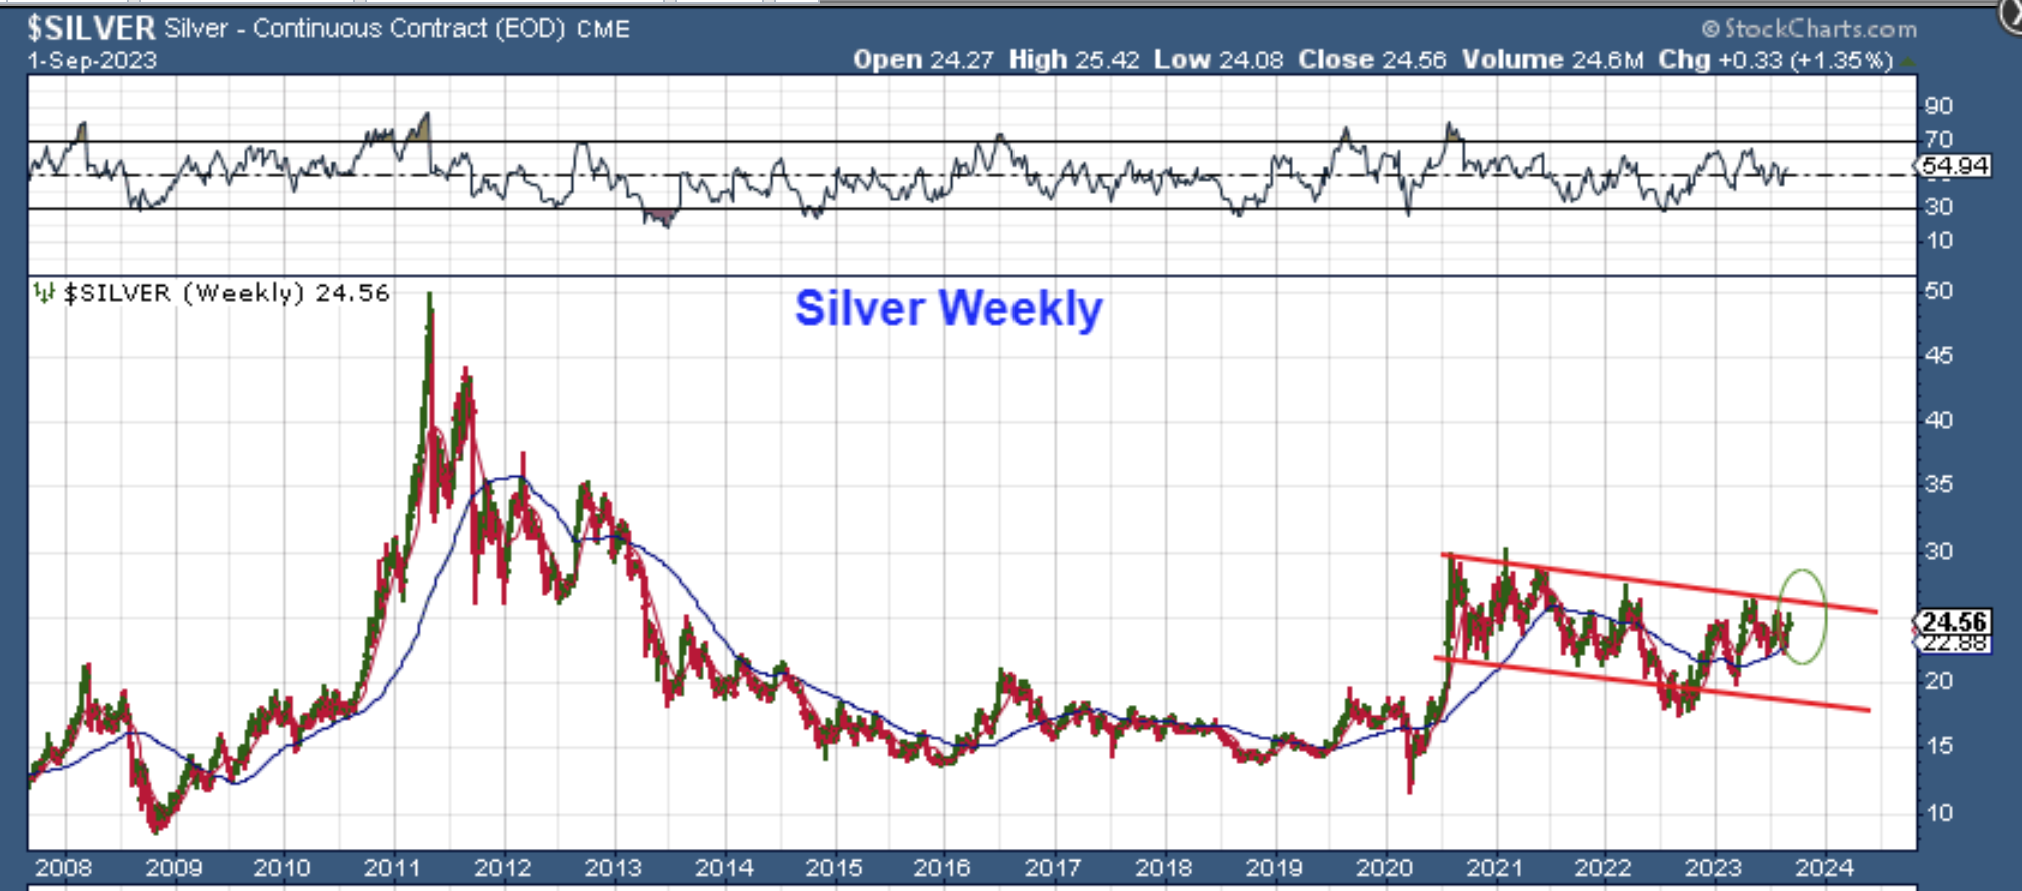
SILVER WEEKLY – Silver has been in a LONG choppy consolidation since the strong covid relief rally of 2020. Baack then it looked like Silver was going to break higher and run back to $50, but it chopped sideways with the strong USD running to new highs. When the USD peaked and started to drop into a 3 yr cycle low, Silver looked similar to Gold. You can see a similar shakeout move in September 2022 and then a push higher, but it sure has been a choppy push higher. The big question: IS SILVER SETTING UP TO BREAK OUT? The next chart seems to say, “Yes!”
.
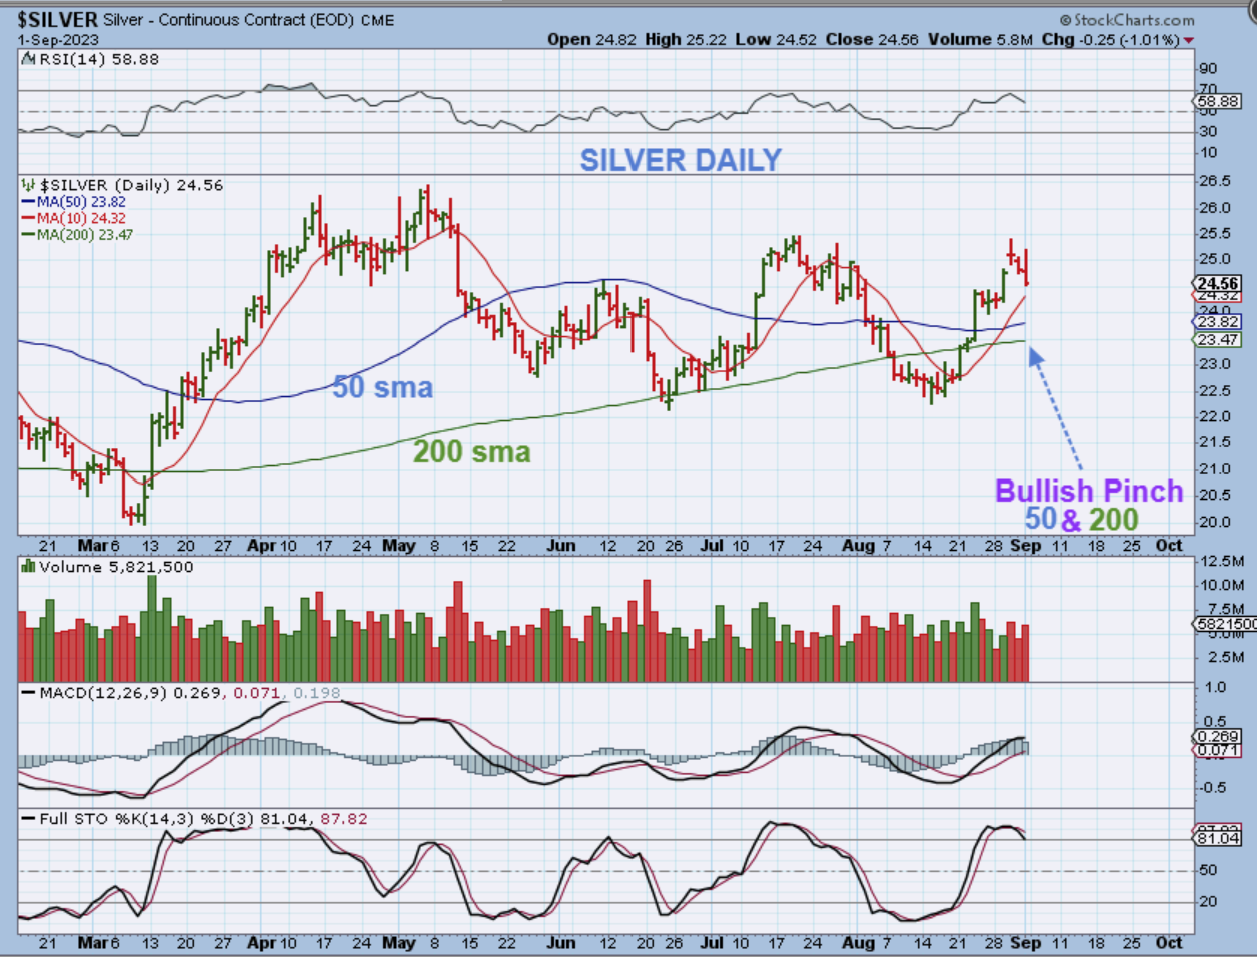
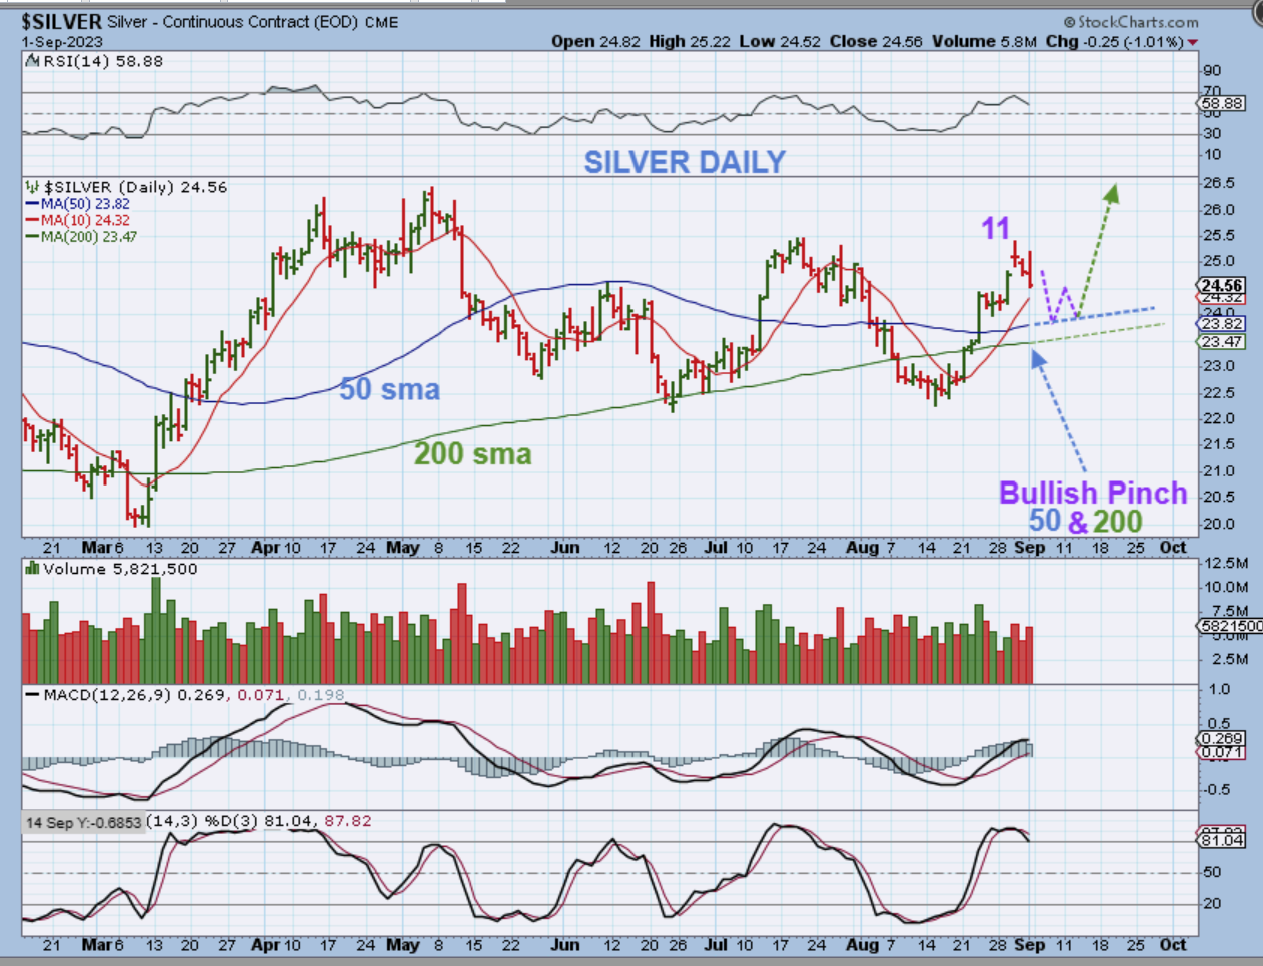
When I look at this daily chart of Silver, it is quite bullish coming out of the recent ICL. We now have a bullishly aligned and tightly pinched 50 & 200sma. This is like looking at a chart that the doctor has of your vital signs and lipid profile and so on and hearing him say, “It is very healthy to have these indicators lined up like this. You, Mr. Silver, are currently very healthy.” So…
.
Of course we all know that Mr. Silver likes butter and salt, so he may at times droop down a bit, but even if the USD Pops and drops next week with a false break out, Silver can do this and remain very healthy. We are only on day 13!
.
Well, GDX is struggling at the 50sma and I hate that as much as everyone else, but GDX is also only on day 9. If you look at the last 3 bottoms that I put in squares, they always seem to start off with a Pop and a drop before continuing higher, but with Gold and Silver looking like an ICL is in place, we expect that the Miners should start to improve.
.
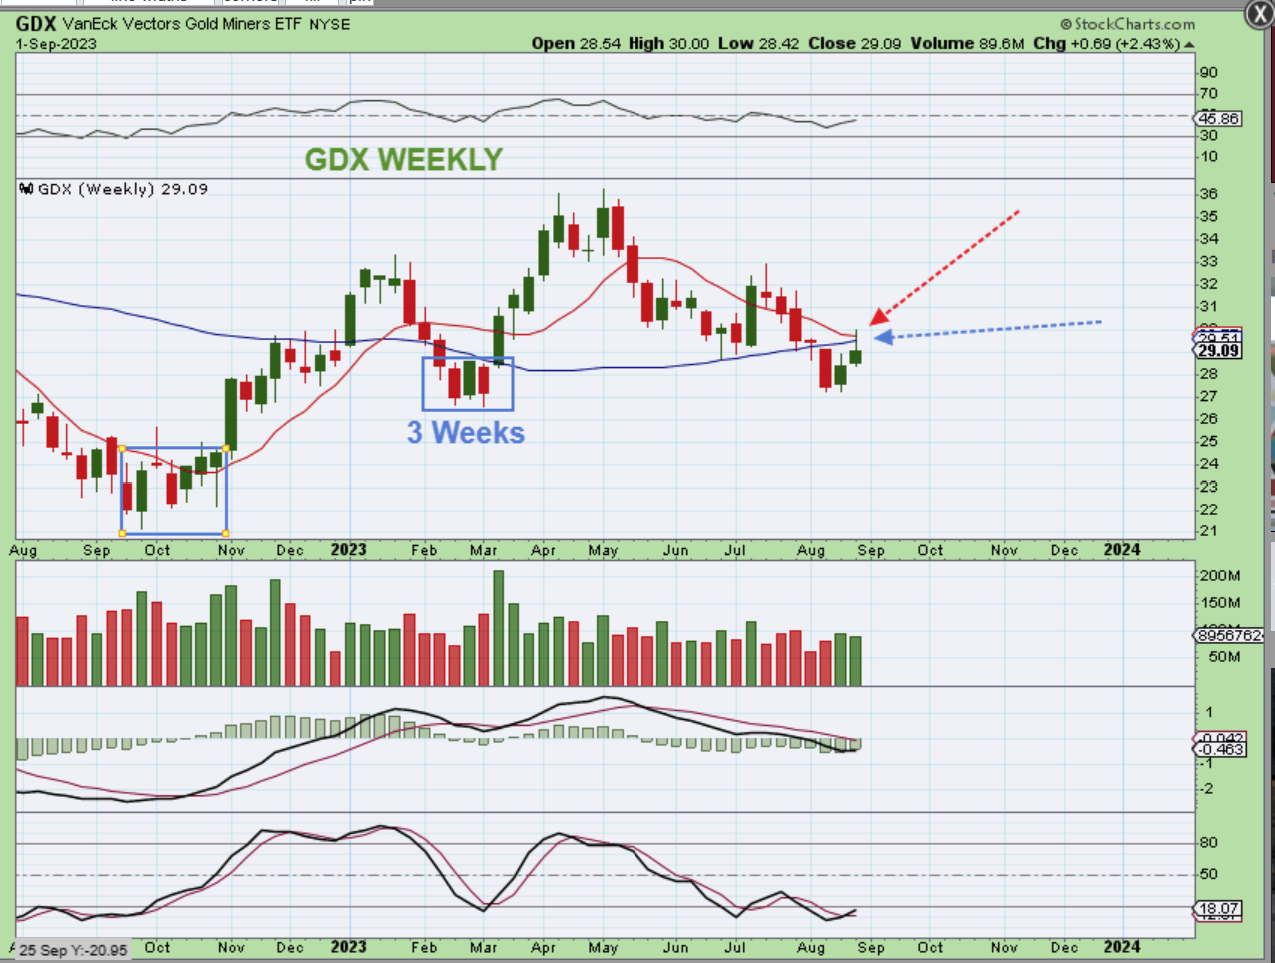
GDX WEEKLY – Again I am pointing out that at the major lows like Oct 2022 and march 2023, the Miners have a hard time blasting off, but after a couple of weeks at the lows, they did. Is this due to the fact that they sell off so much into those lows that people don’t buy and hold? Are buyers nervous and keep selling the pops? That is possible, GDX does spend a couple of weeks at the lows, but as Gold and Silver begin to climb again, they usually kick it into gear. Also…
.
Also as you can see, The GDX Weekly is at double resistance too, similar to where the daily is under the 50sma. We probably need that push above the 50sma on the daily to gain confidence, but this weekly chart is very oversold and should be putting in a major low.
.
-The General Markets have moved nicely out of their lows.
.
-Oil has also pushed higher, dipped back into a dcl, and continued onward too.
.
-To be honest, the Gold and Silver charts look very good too, they have healthy set ups on the weekly and the daily basis.
.
– The only troublesome area is the way that USD looks to be set up. Yes, it is under resistance on the weekly chart, but the daily looks like a dcl may have formed high and that makes it look strong enough to break out. You all know the story already: The USD should drop soon and put in a 3 yr cycle low in Jan 2024, but with this setup I have wondered if it could have come in 6 months early with Fed manipulation? Maybe, maybe not. It may just chop sideways, sell off further, and launch Gold and Silver to their next break out point. If so, Miners will follow. So the set up is fine, we just need more time. I hate the volatility as much as the next guy, but I just use the charts to tell me how things look, and in this weekend review, you can see it too.
.
There is a lot more below… Enjoy your 3 day weekend!
.
~ALEX
.
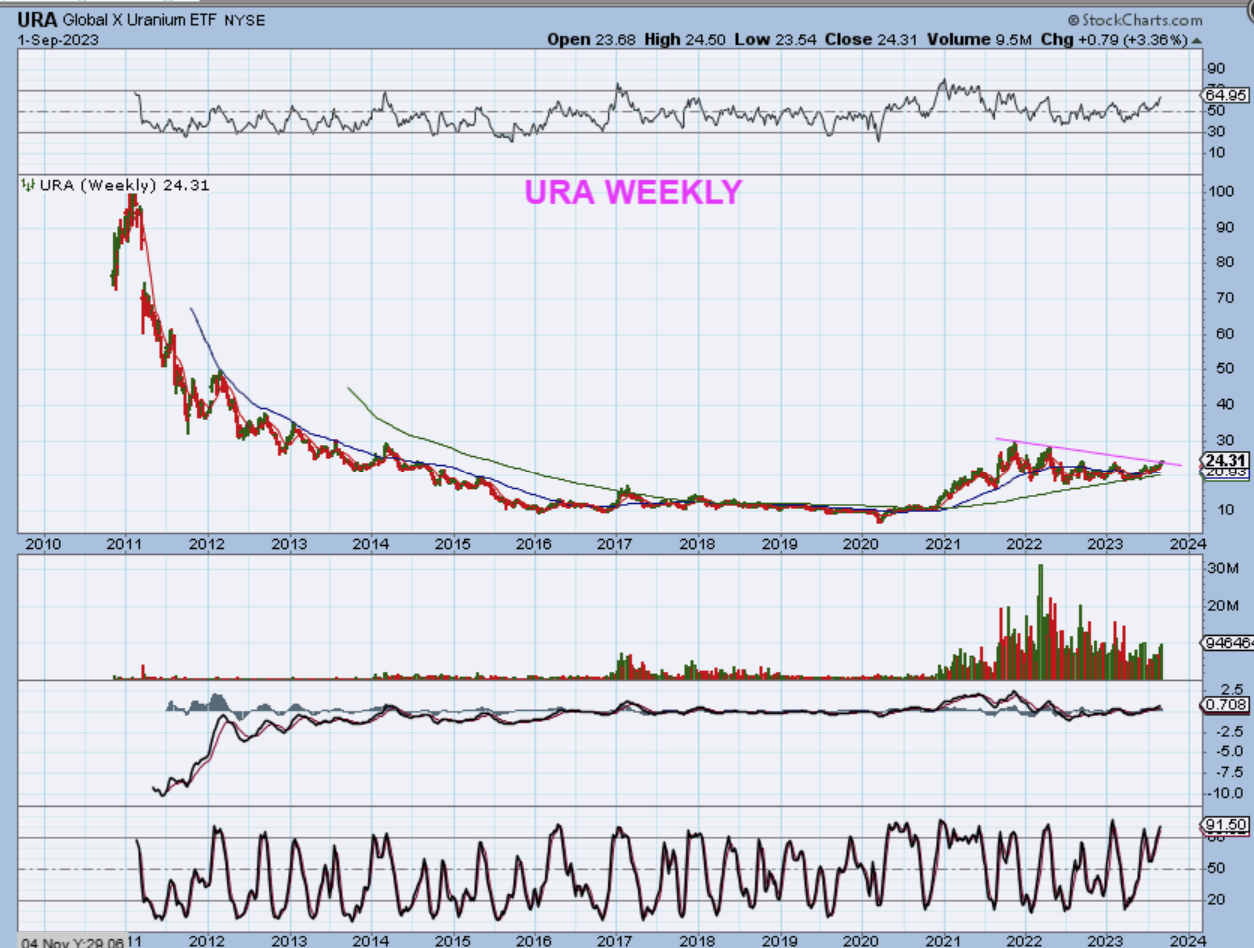
URA WEEKLY – Uranium stocks have been in the reports recently as bullish ( yet choppy) set ups. URA is breaking out this week.
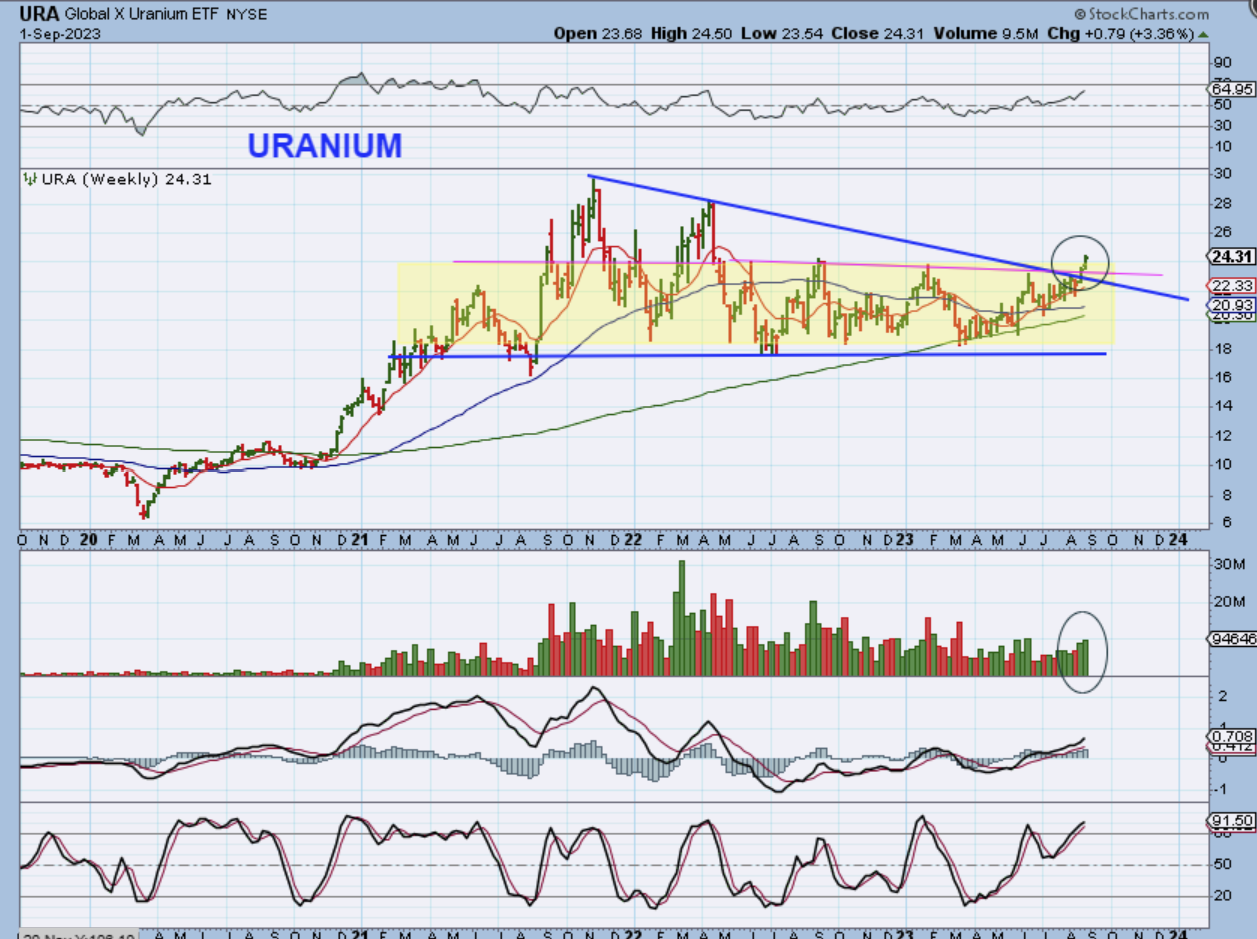
URA WEEKLY – The big picture potential is huge if these continue to run, and the individual stocks look good too. We’ve discussed UUUU, CCJ, NXE, UEC, URG, DNN.
.
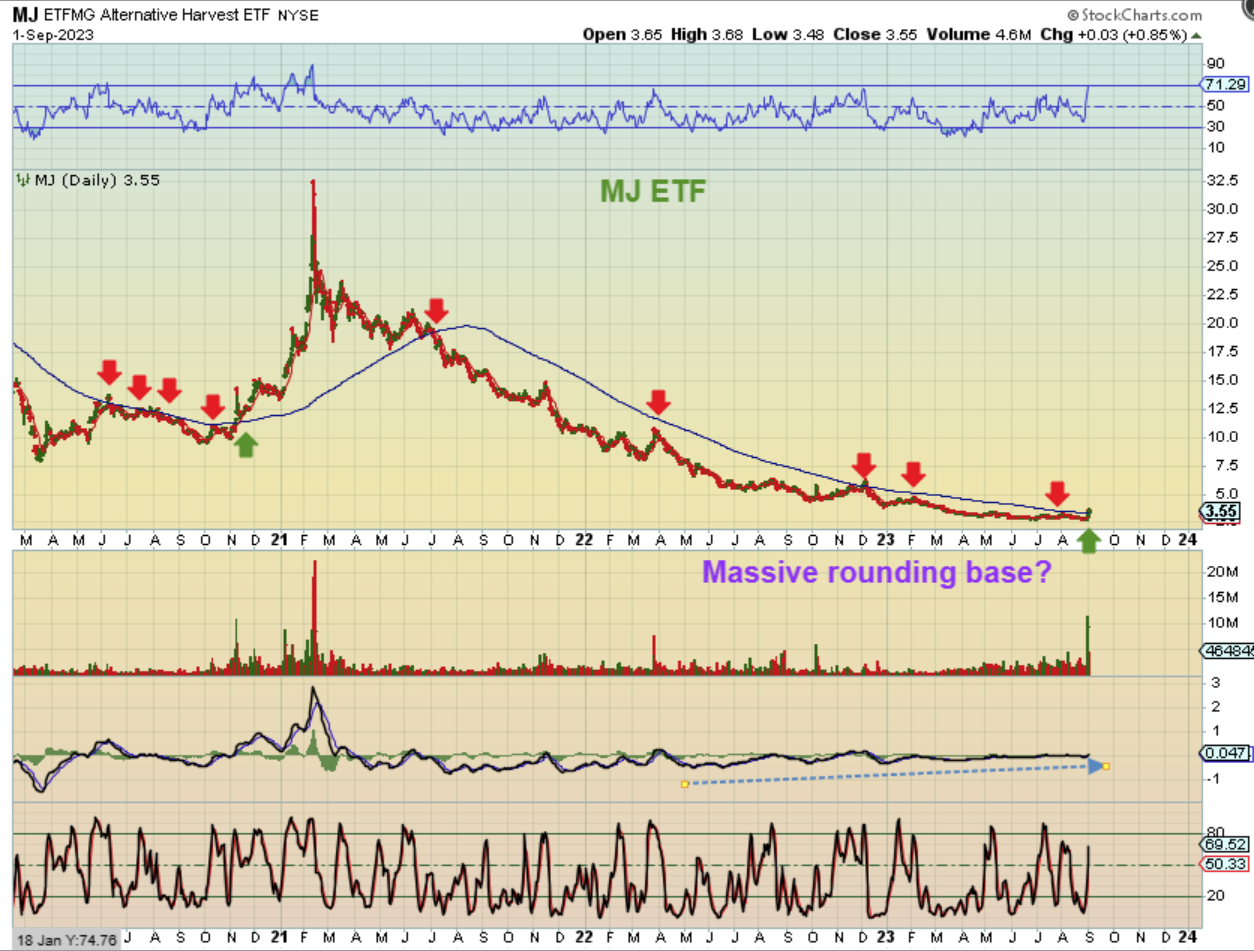
MJ ETF – I discussed the MJ Pop last week and it has changed the weekly chart to bullish. The possible changing of how it is classifies (from a schedule 1 to a schedule 3) has several benefits, including possible tax breaks, tax credits, easier access to banking and credit benefits, and so on. Could this sector FINALLY have a bottom and begin to rise up from here? I think it is very possibly a game changer for the sector. It will be a choppy bottom, some MJ Companies will still go out of business or be bought out, but over time some of these stocks could easily rise up 1000% from their lows if – if – if the rescheduling happens and causes a bull run.
.
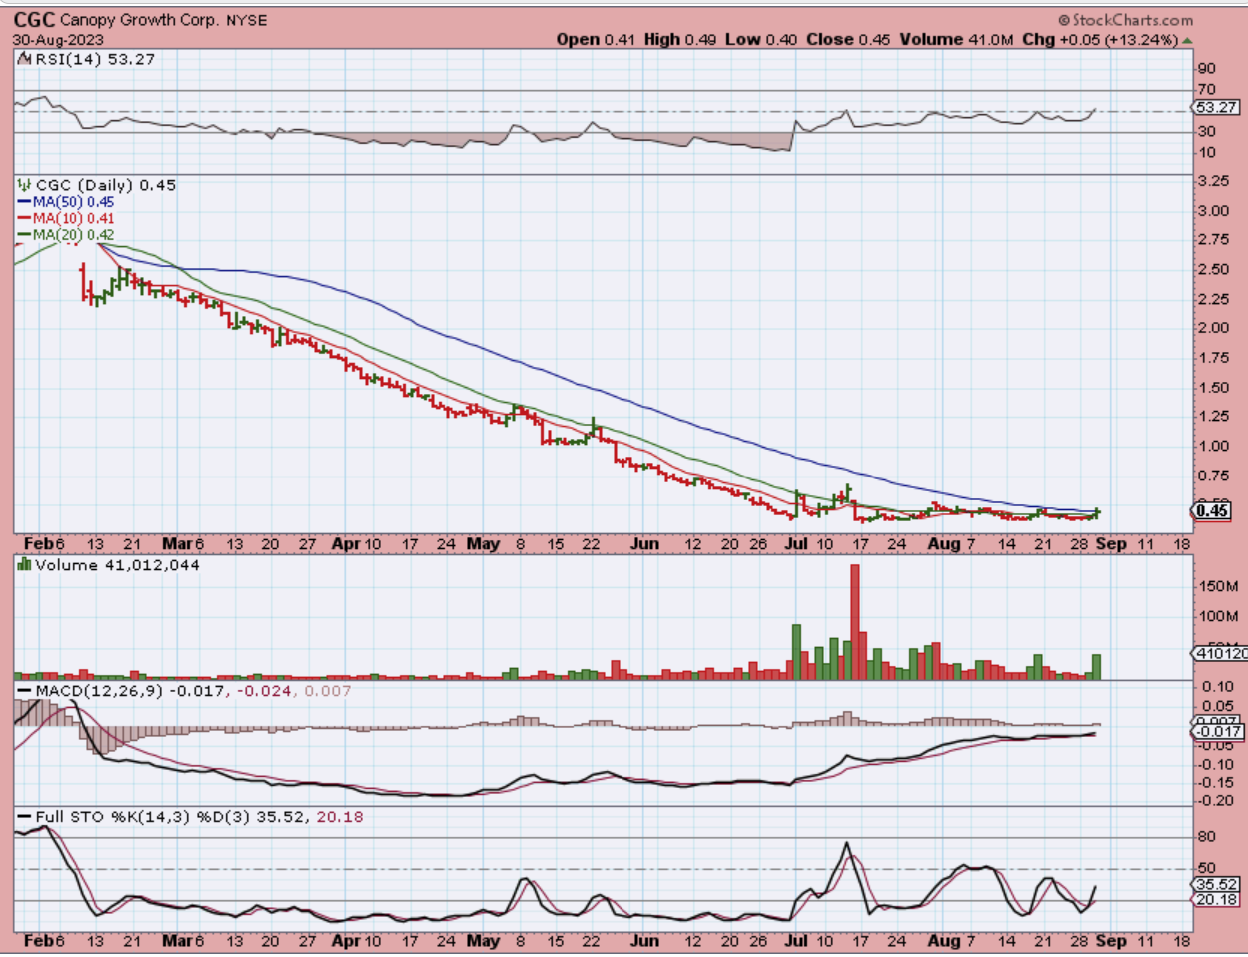
Last week I pointed out this 40 cents stock that used to trade up in the $40-$50 area. It has a very nice base and good potential…
.
CGC started to pop and was up 10%…
.
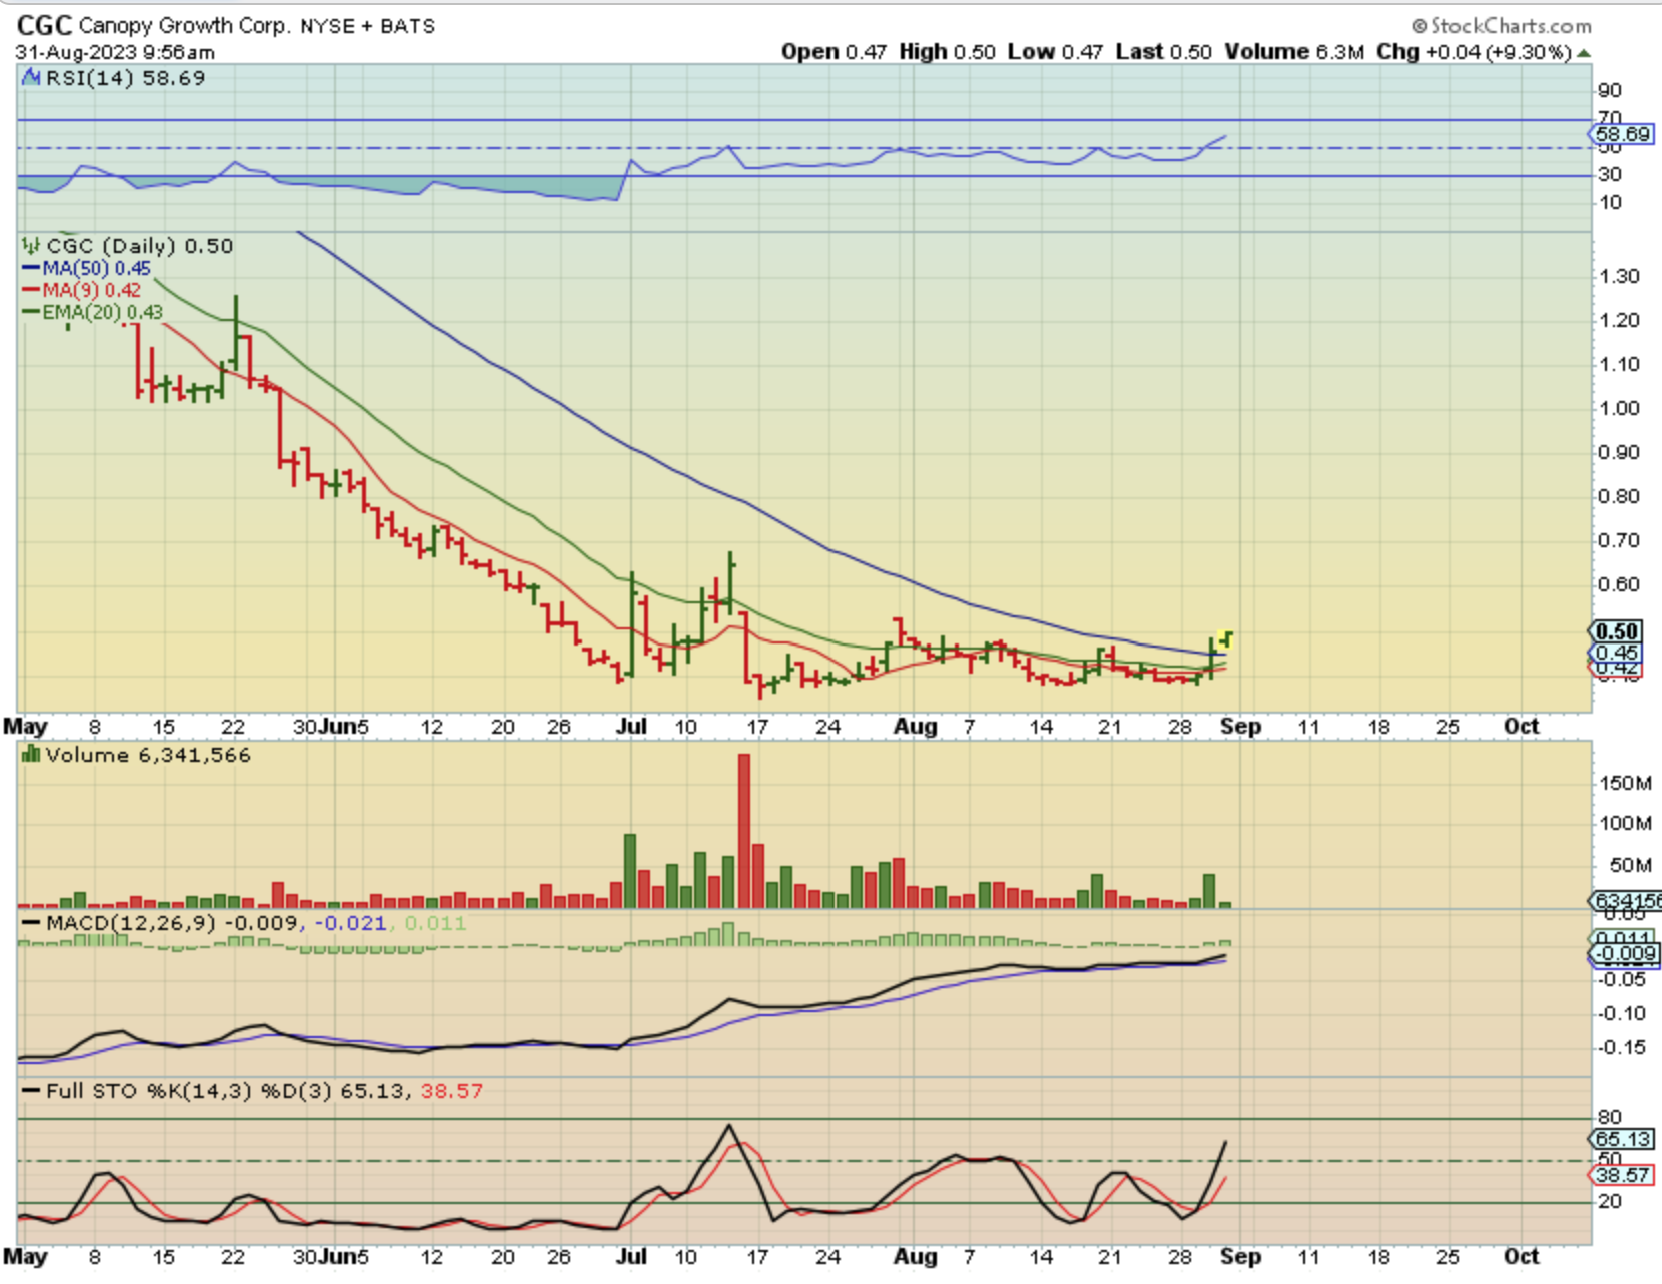
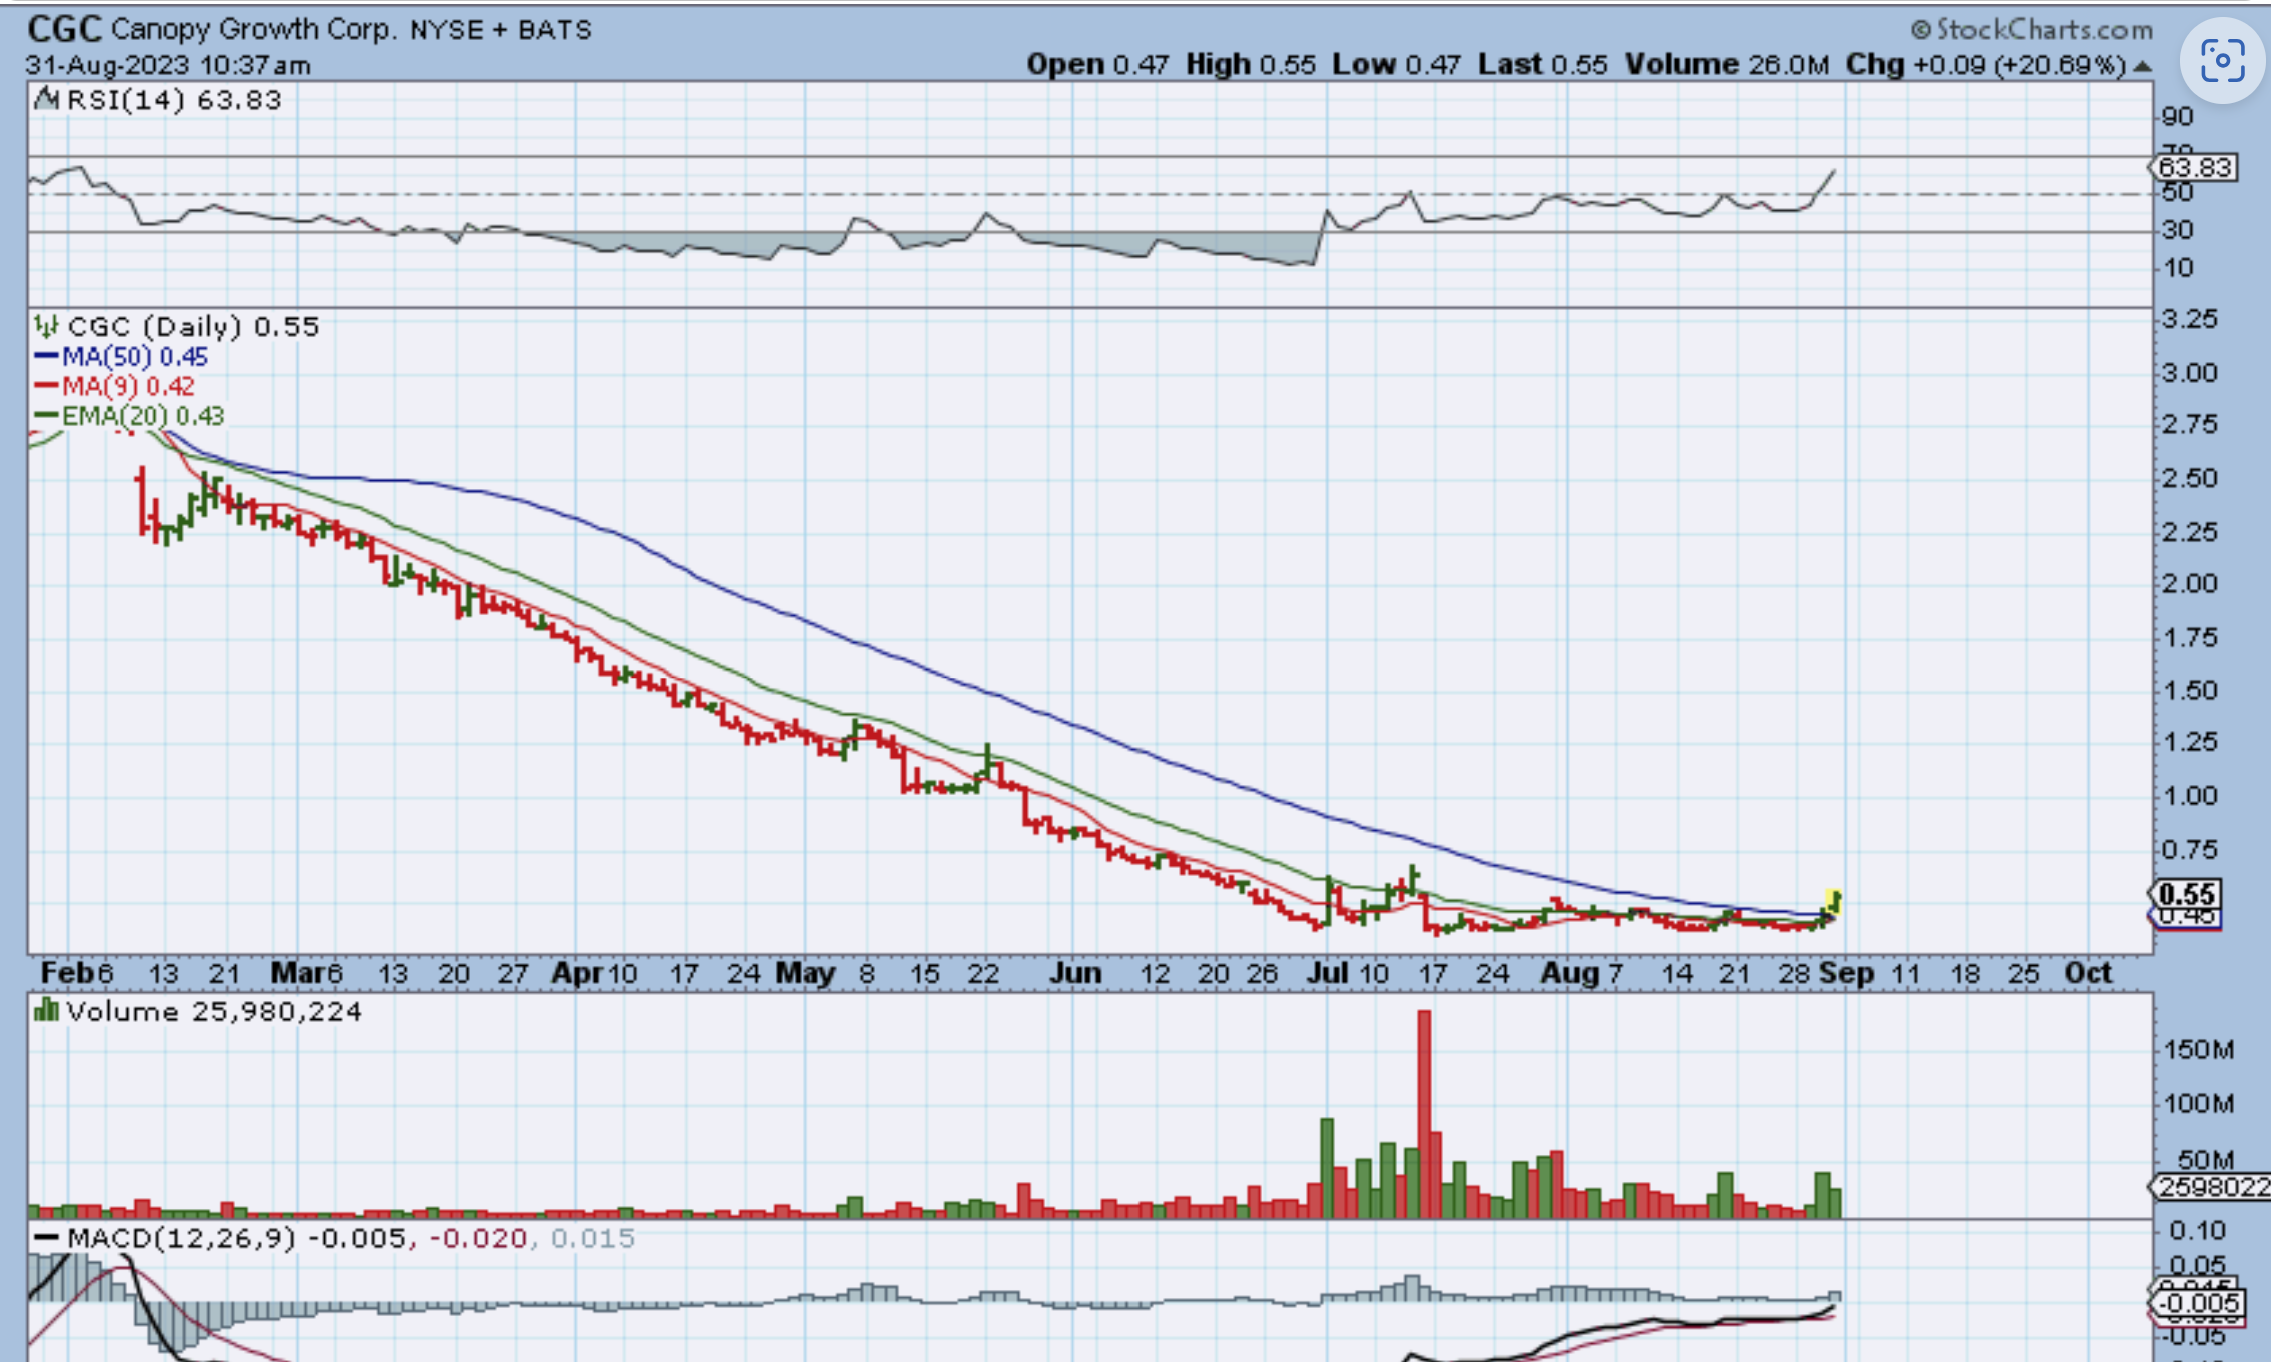
CGC broke higher and was up 50% from the lows in just a couple of days. It has since dropped back to 55 cents, but you can see what I mean by the potential IF IF IF these get running. It is still a big ‘if’. great risk/reward though.
.
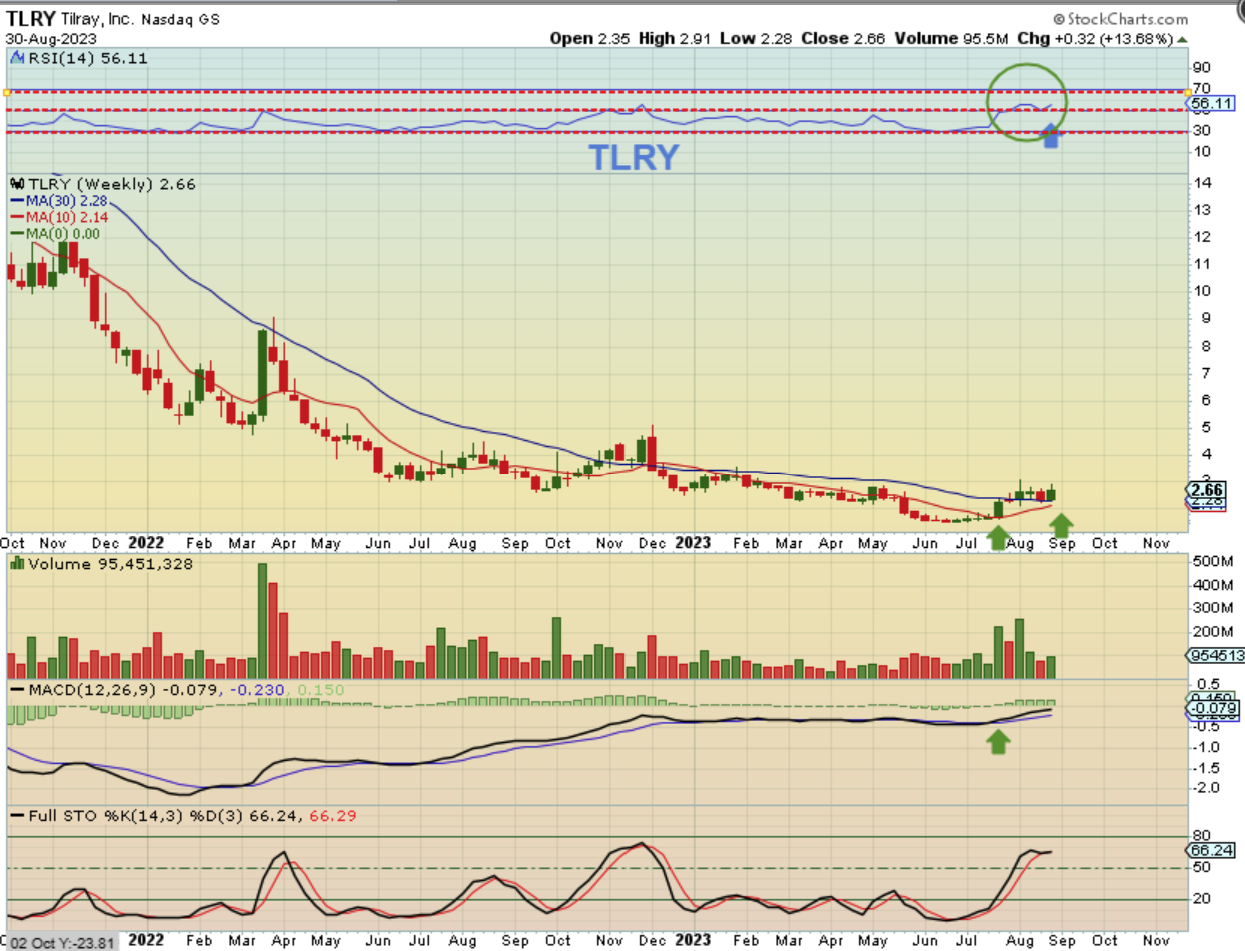
TLRY WEEKLY was also highlighted as an MJ Company that actually bottomed when it released its’ earnings report. This weekly chart shows the RSI above 50% already and a base formed where price is above the 10 & 30 week ma. This is bullish and it closed at $3 this week (up 27% this week alone!).
.
Important Note:
The MJ Sector has popped and dropped several times in the past, so we need to be aware that this might be another false hope. It might be short covering on the news possibilities. That attempt to get MJ rescheduled may or may not happen, but I wanted to show you the possibilities and to be honest – the 2 trades that I made this week were very good. I know that it will be choppy and very difficult to ride with this price action, but over time it may offer great gains. You can buy a small position on the pull backs and try to ride it, or wait until it starts to ‘trend’ up along the 10 or 20sma, to see if this move has lasting power. At that point, buying dips along the way would also pay off nicely and be a bit safer.
.
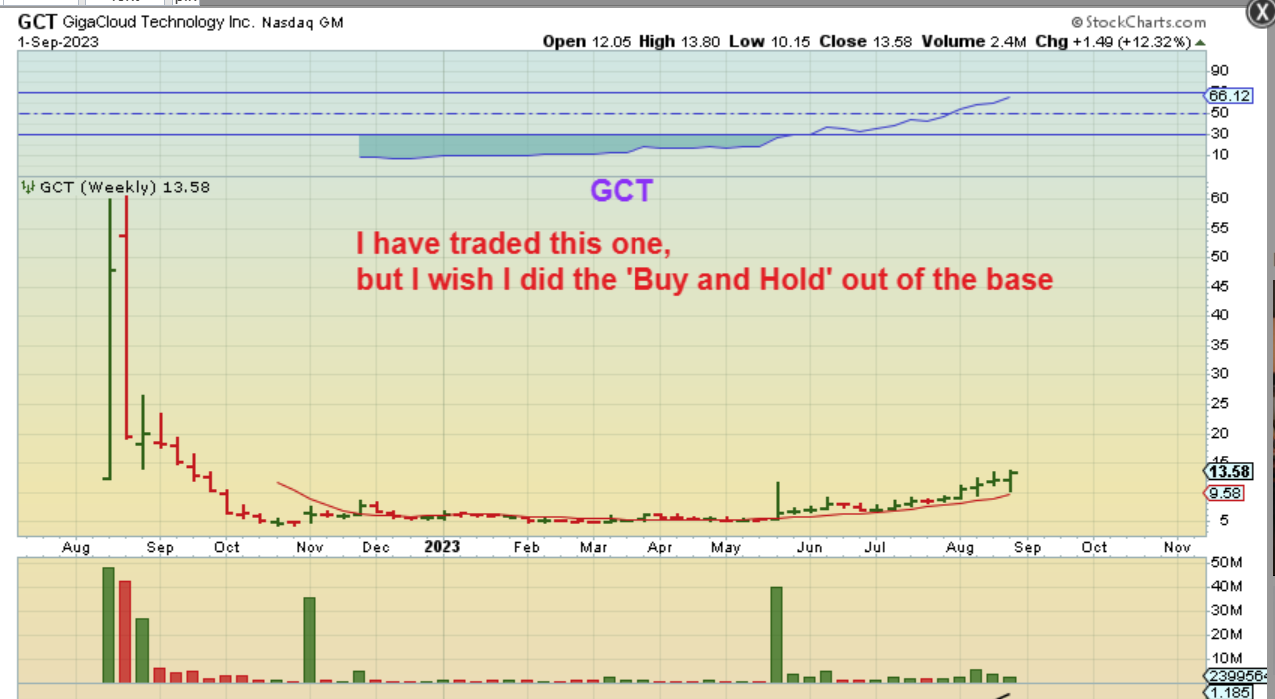
For Example: GCT is an example of a Crash, a base similar to MJ Stocks, and a rally that I have traded and had in the reports lately. Read the chart. This doesn’t look like much but it was $5 to almost $15 now, since March! I do not own it at this point, I sold before earnings. 🙁
.
FOR THE WATCHLIST:
And in this weekend report I wanted to just post a few Bullish stocks in the General Markets. I have posted them in the past as bullish, but how did they act during the correction? Did they stay bullish and ready to possibly run again? Many did, so let’s just take a quick look.
.
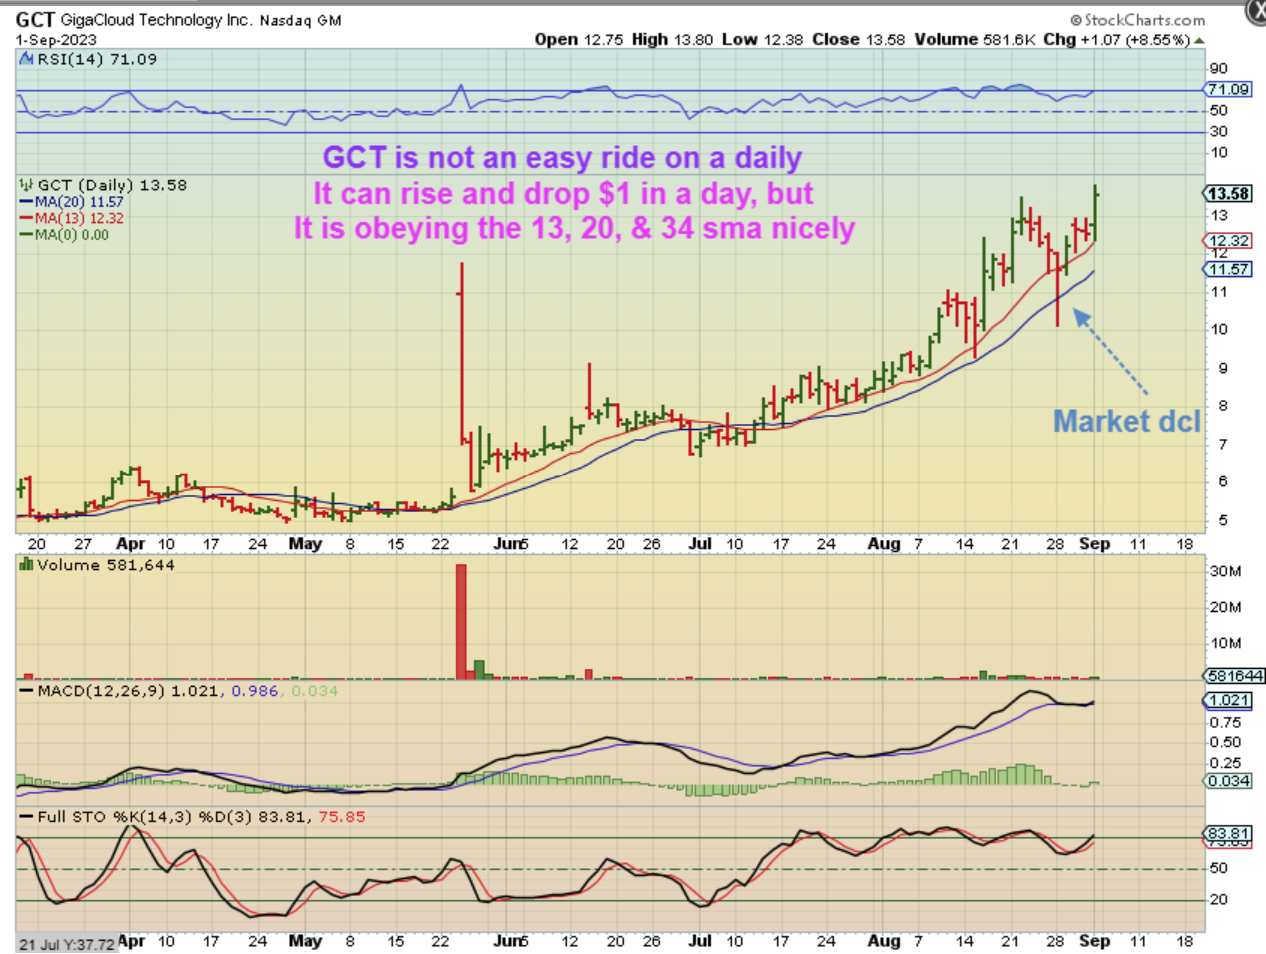
I’ll just start with that GCT daily chart. You can see why I sold it heading into the earnings report. It was choppy and would gain and lose $1/day, but like I said, the ‘Buy and Hold’ out of the base is almost 200% gains so far.
.
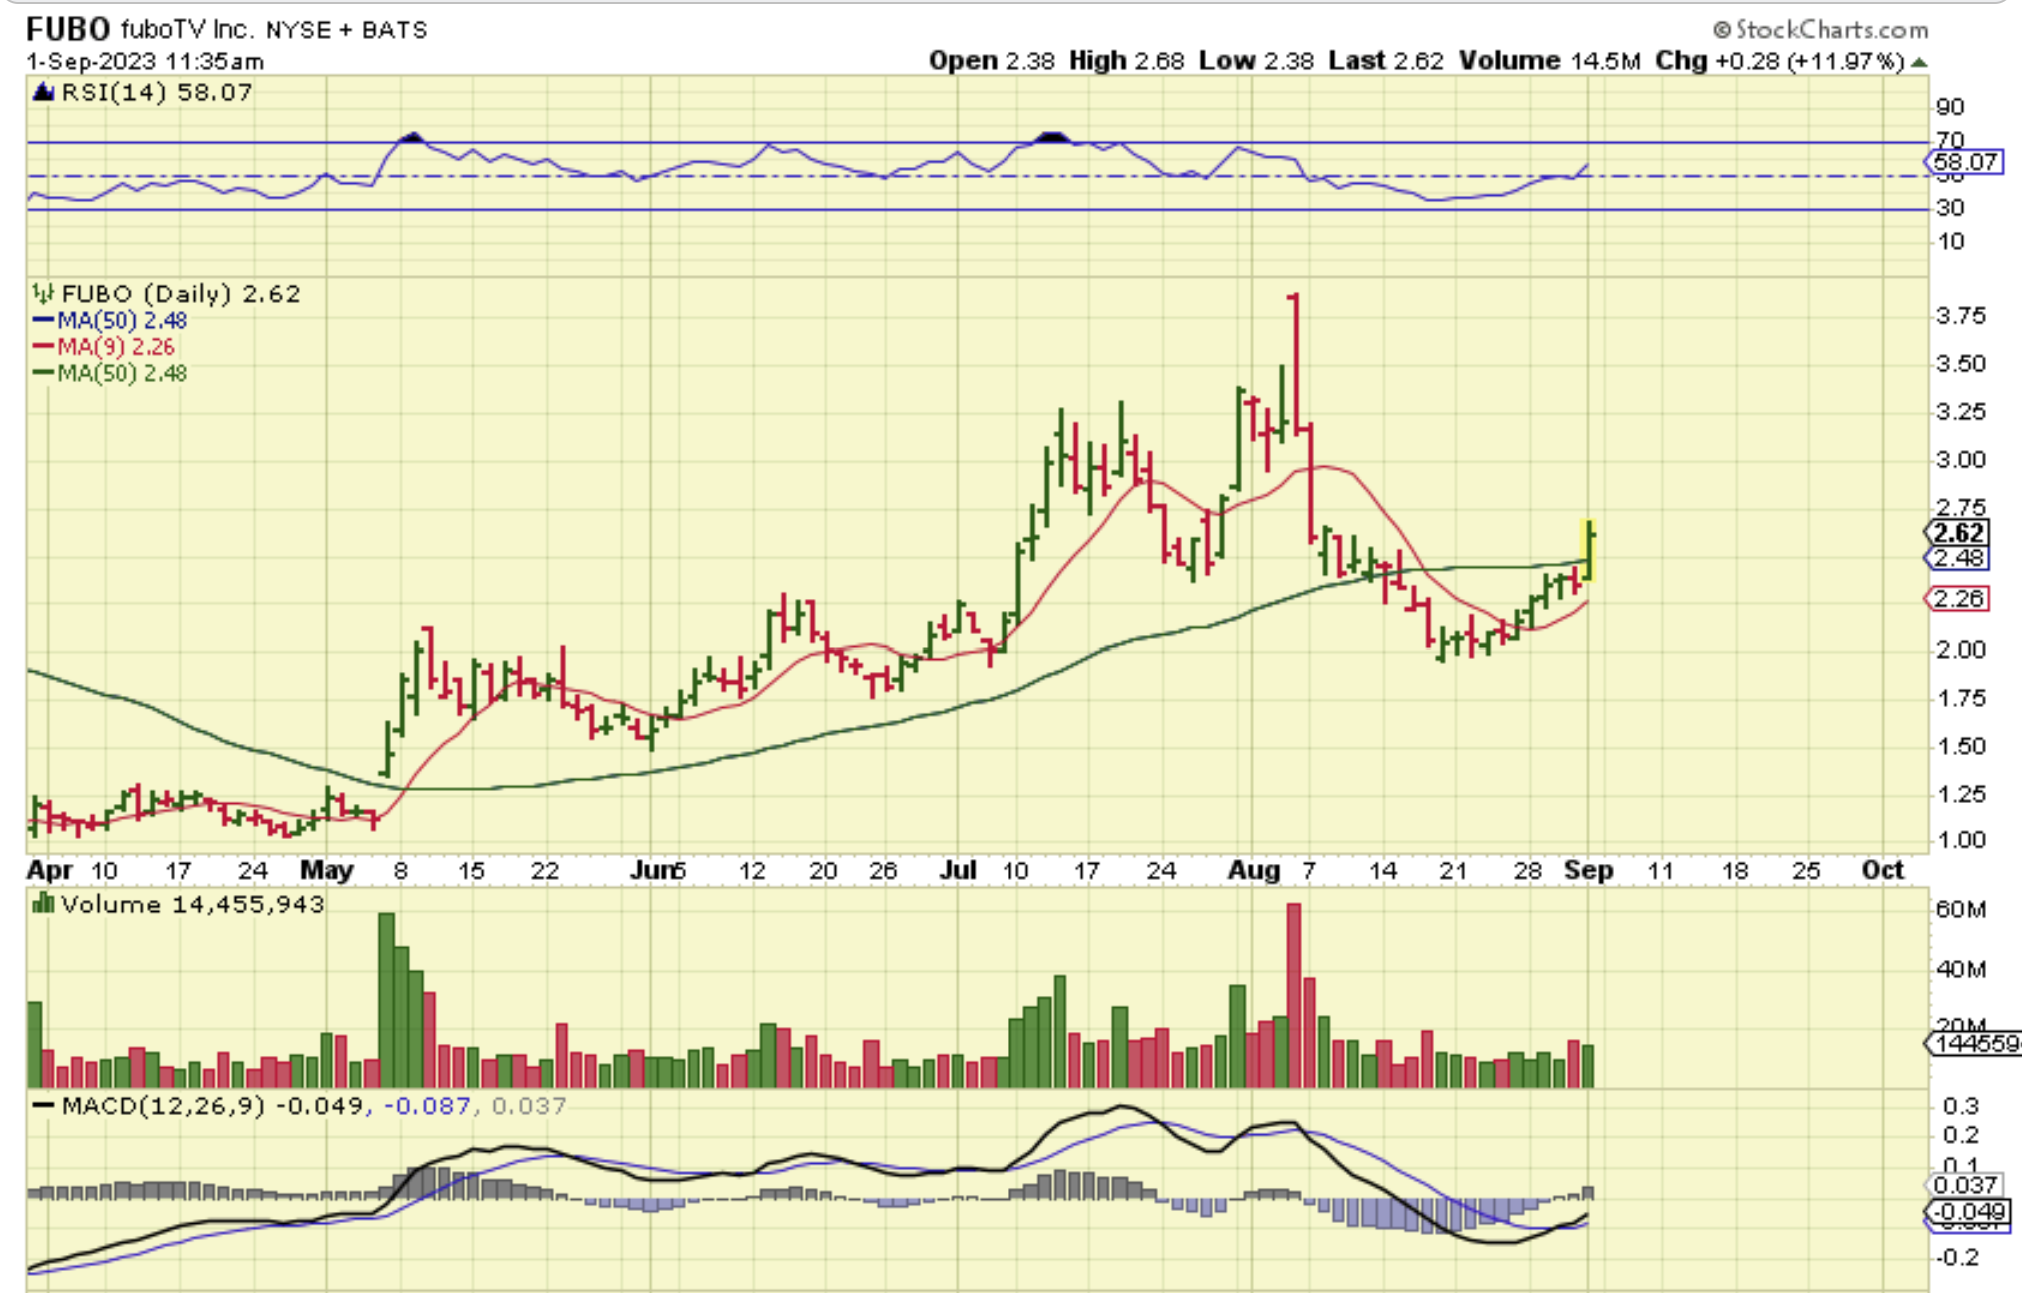
FUBO crashed during the market drop into a dcl, but it looks to be recovering. With the General Market lows behind us, this could be bought with a stop at the 50sma.
,
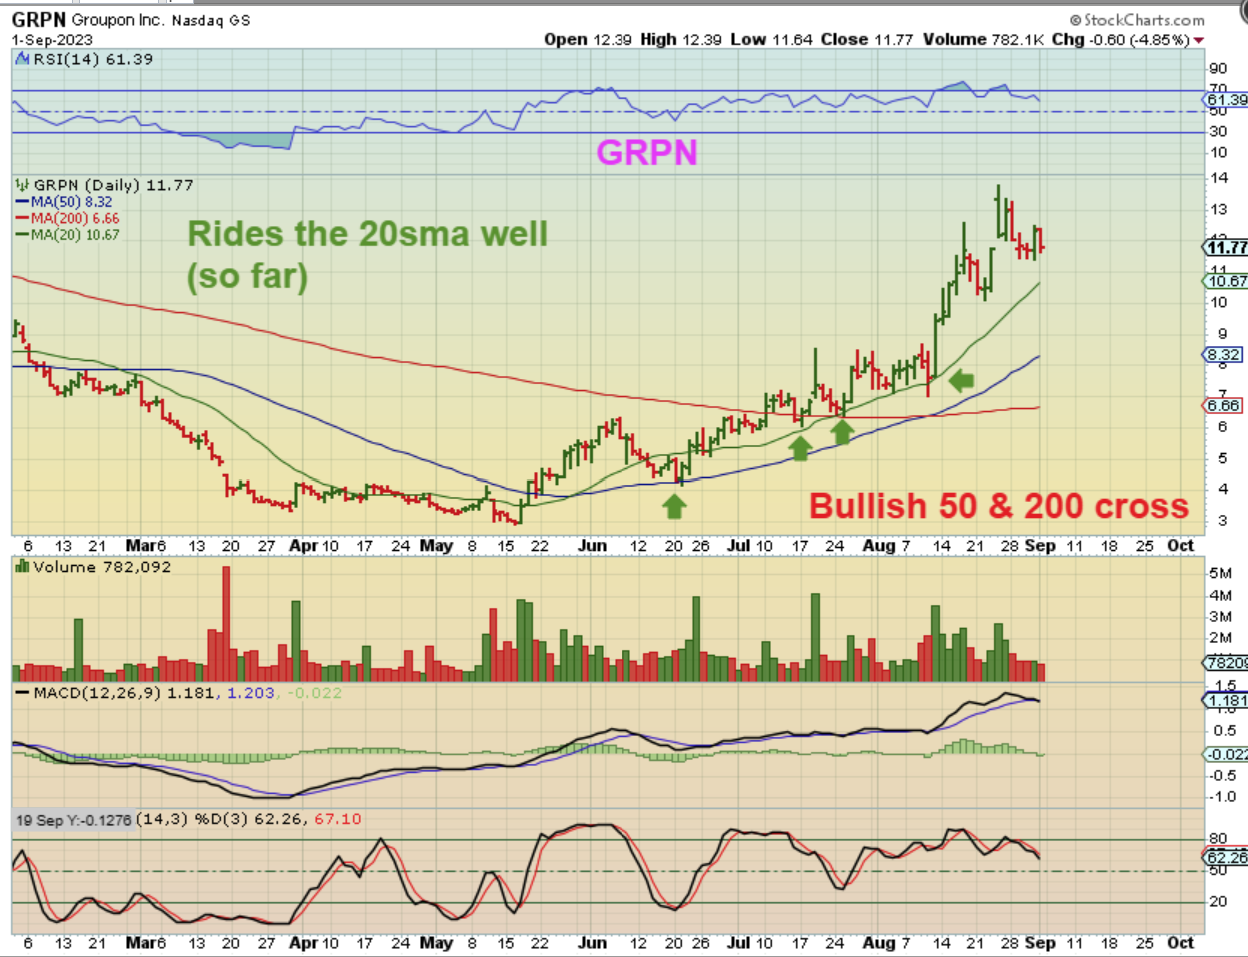
GRPN has been a slow and steady runner after earnings was released in early Aug. This one barely dropped during the market correction, so it is a strong stock. If this drops to that 20sma, I may take an entry.
.
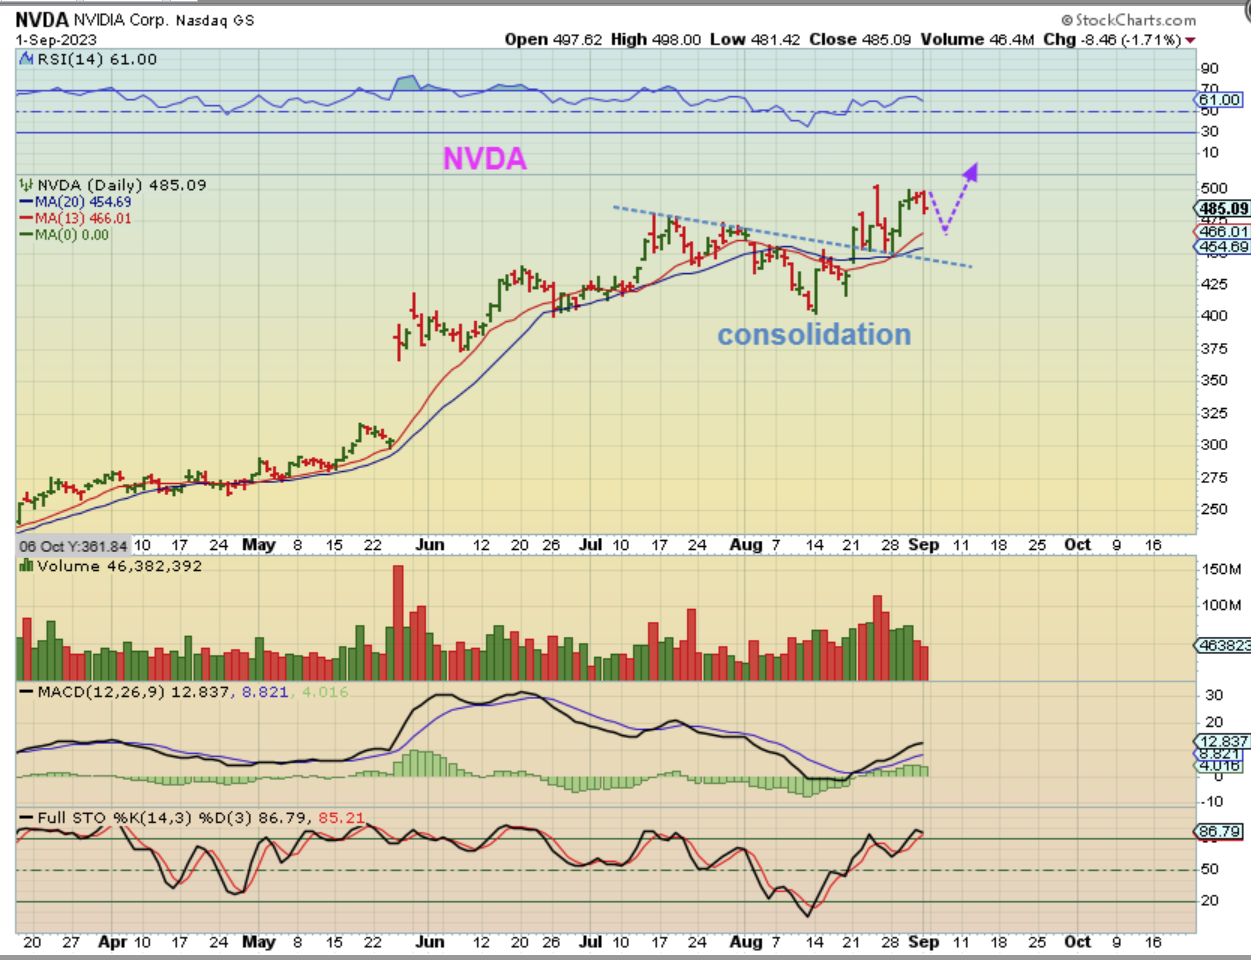
NVDA is consolidating gains from a strong run, and with the release of STRONG earnings report, could continue higher after a quick dip.
.
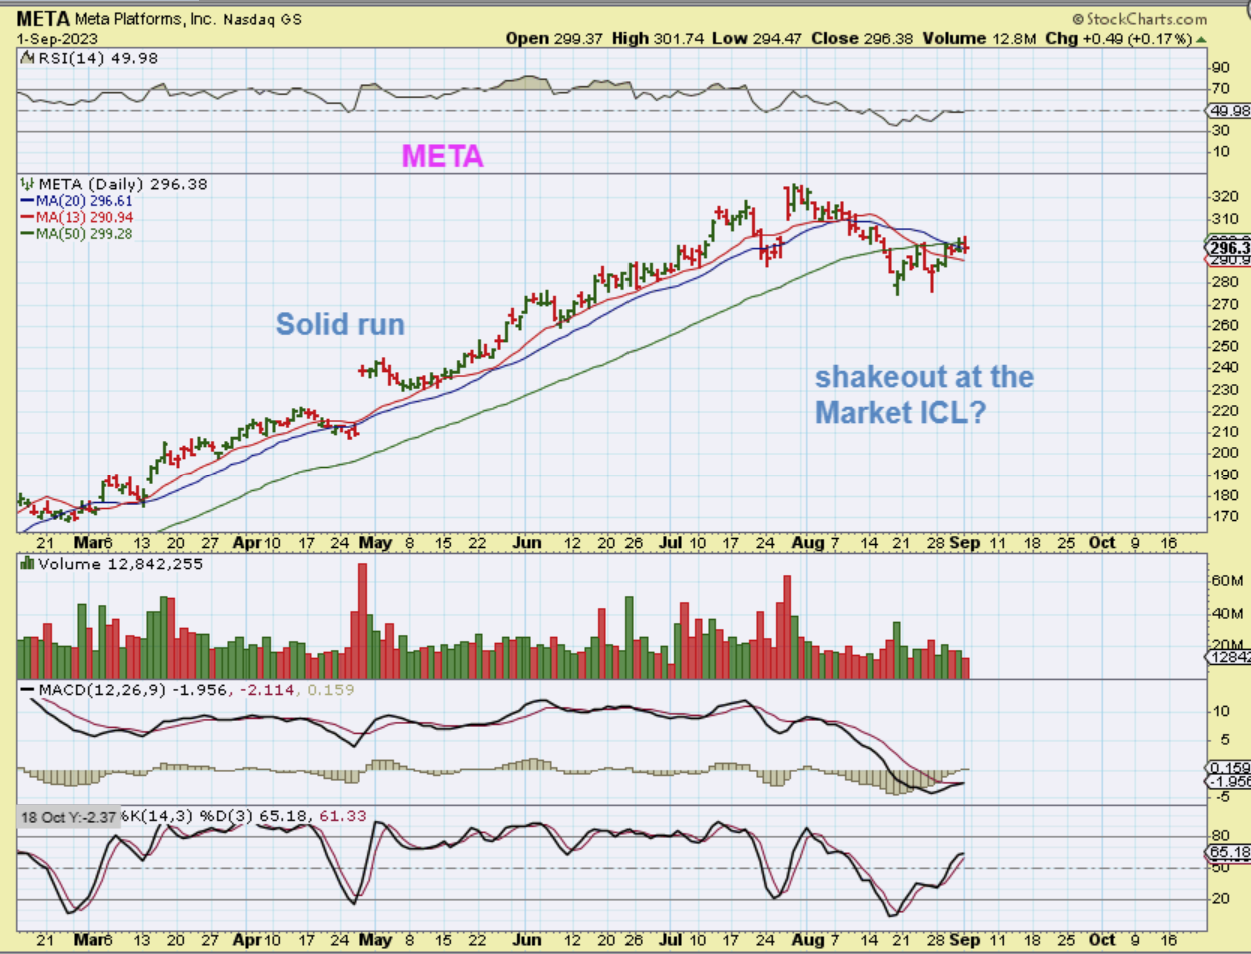
META is a possible shake out and one could buy and hold a recovery. if you, like me, were holding a 10% position in EXK and it is just dead at the lows, maybe you want to put it in a proven bullish stock if it recovers? Have you seen…
.
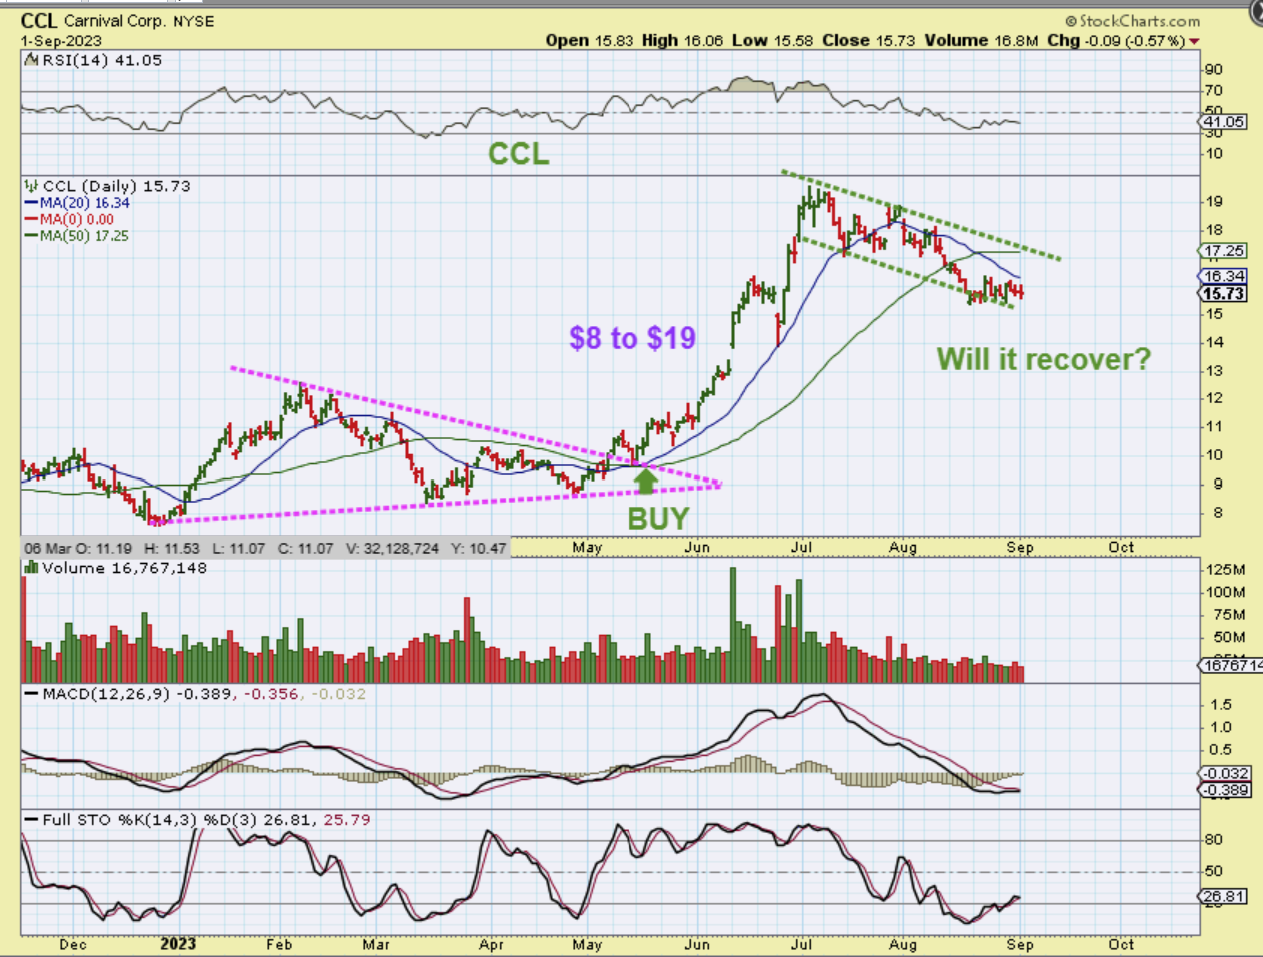
Have you seen AMZN, ADBE, CRM (earnings POP last week), Royal Carribean and Carnival Cruise recoveries? These are still looking bullish after the recent pull back.
.
CCL – People are lining up for cruises post covid and CCL ran from $8 to $19. It pulled back to the $15 area during the recent market correction, but it may recover and run again, so put it on a watch list or buy with a very tight stop? It is worth watching.