Friday September 1st – 3 Day Weekend Ahead
Today is Friday, September 1st (Wow, already?), and this is the last trading day of the week before the U.S. goes into a 3 day weekend. I don’t think that there is anything major to worry about as far as holding some positions over the weekend, so let’s review our current set ups.
.
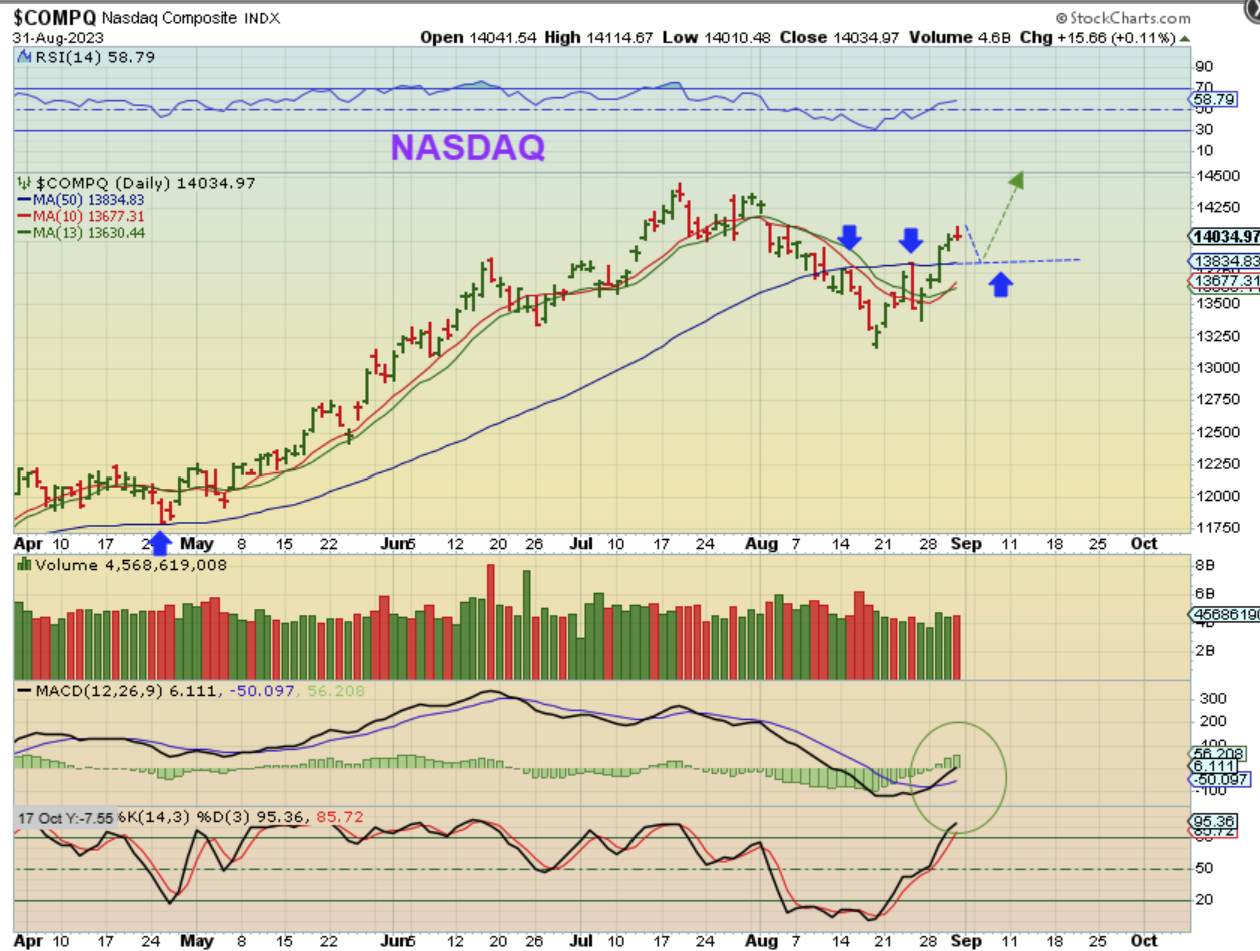
The NASDAQ did a little pop and drop, and yesterday I had already mentioned that we could see a small back test and then rally higher next week. That pullback does not have to happen, but the selling did come in by the end of the day yesterday.
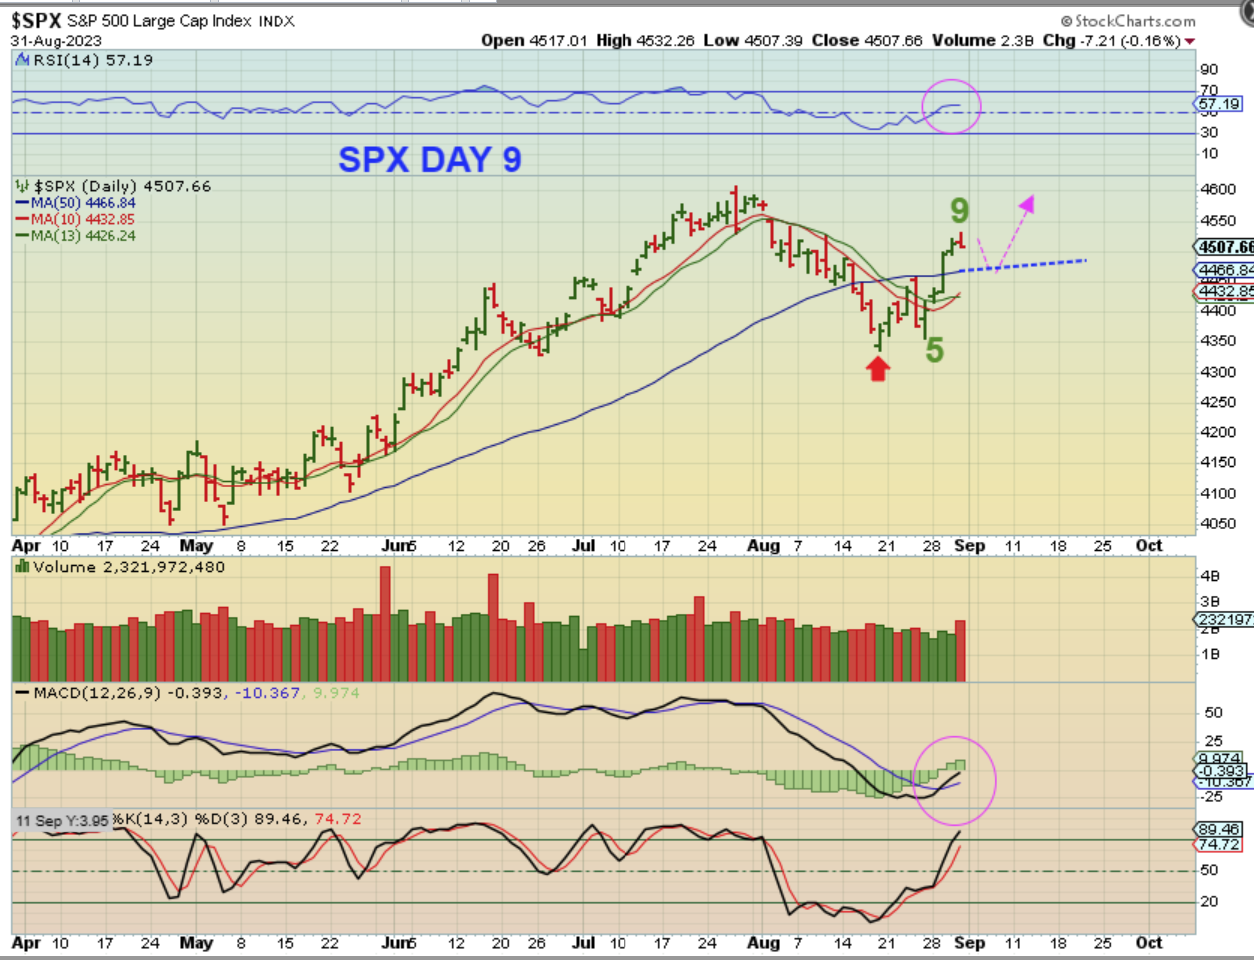
The SPX is on day 9 and it also popped and dropped into the close, so a back test is possible, we’ll see. The RSI and The MACD are bullish and things look good going forward.
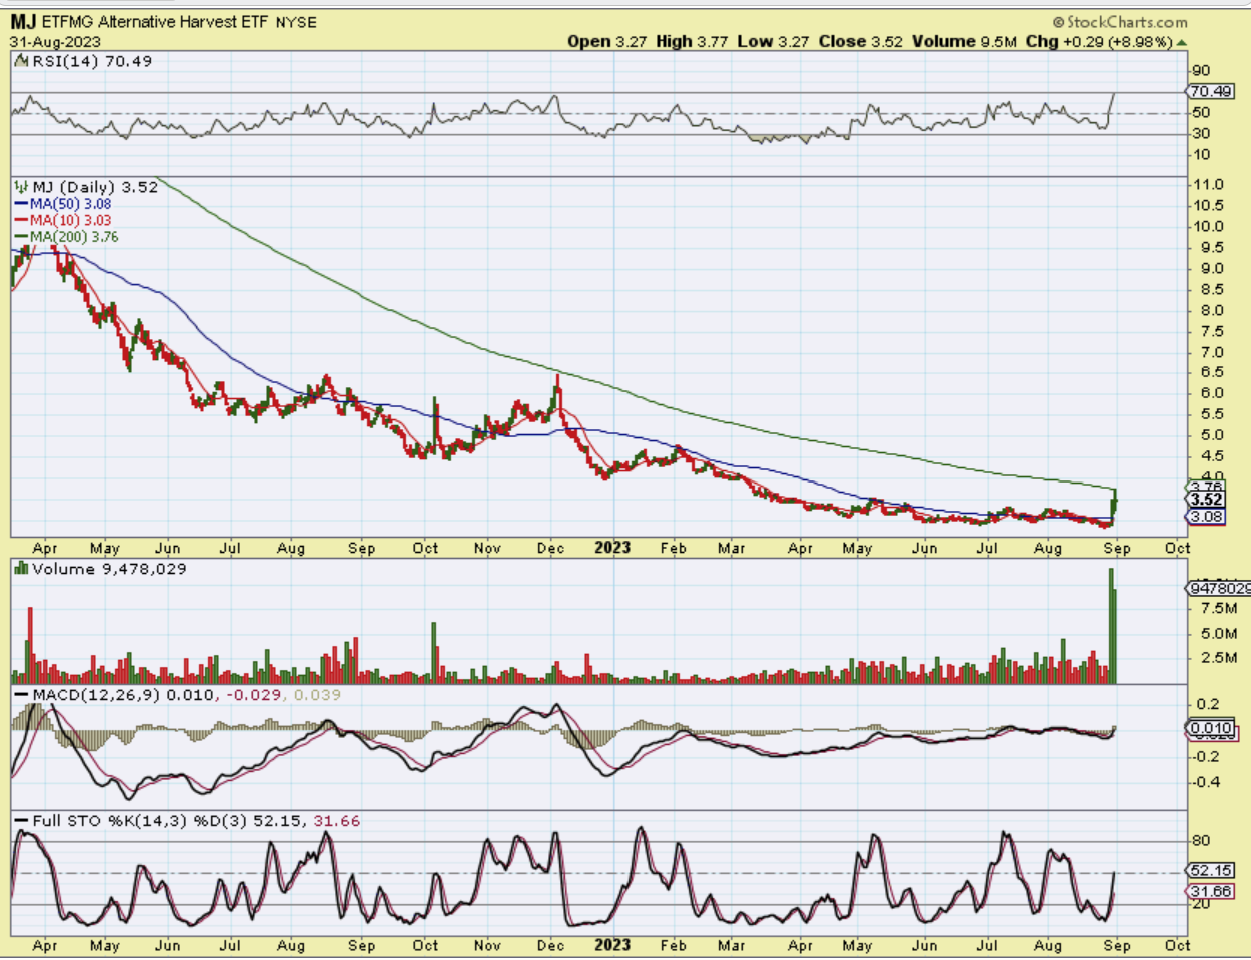
The MJ ETF popped another 9% and some of the MJ Stocks were up another 10-30%. We always see BIG MOVES in this sector and Crypto. So the MJ ETF is at resistance and it tagged that 200sma and dipped lower. We’ll see if this is the end of the road again, or can this finally break out and move out of this massive sell off? Huge money will be made in this sector if we finally break out and begin a stairstep higher, so I’ll be watching this sector closely.
.
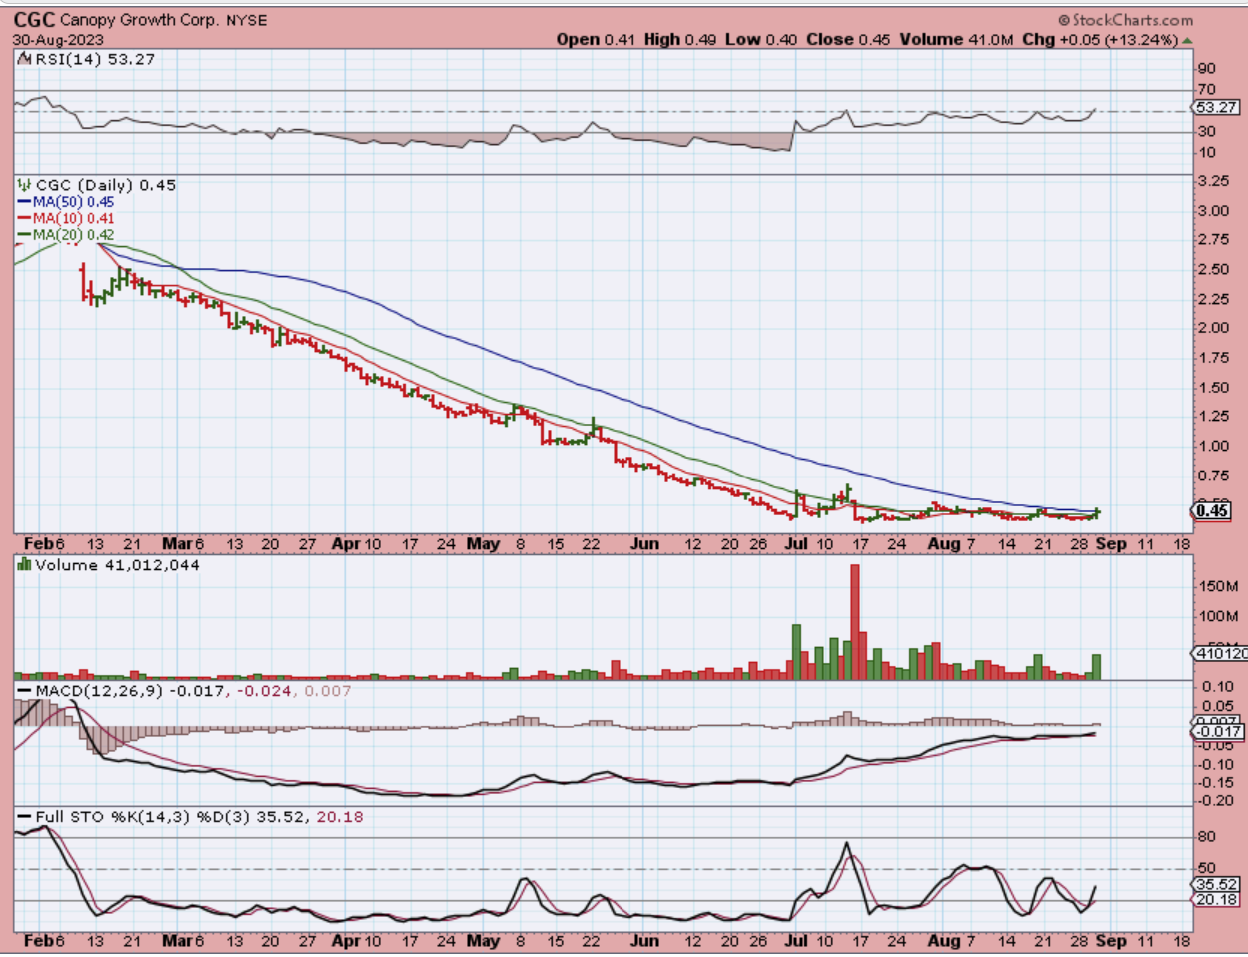
I had mentioned CGC & TLRY (& others) as examples of how explosive these can be. I used this chart to show a 13% gain on Wednesday. Well…
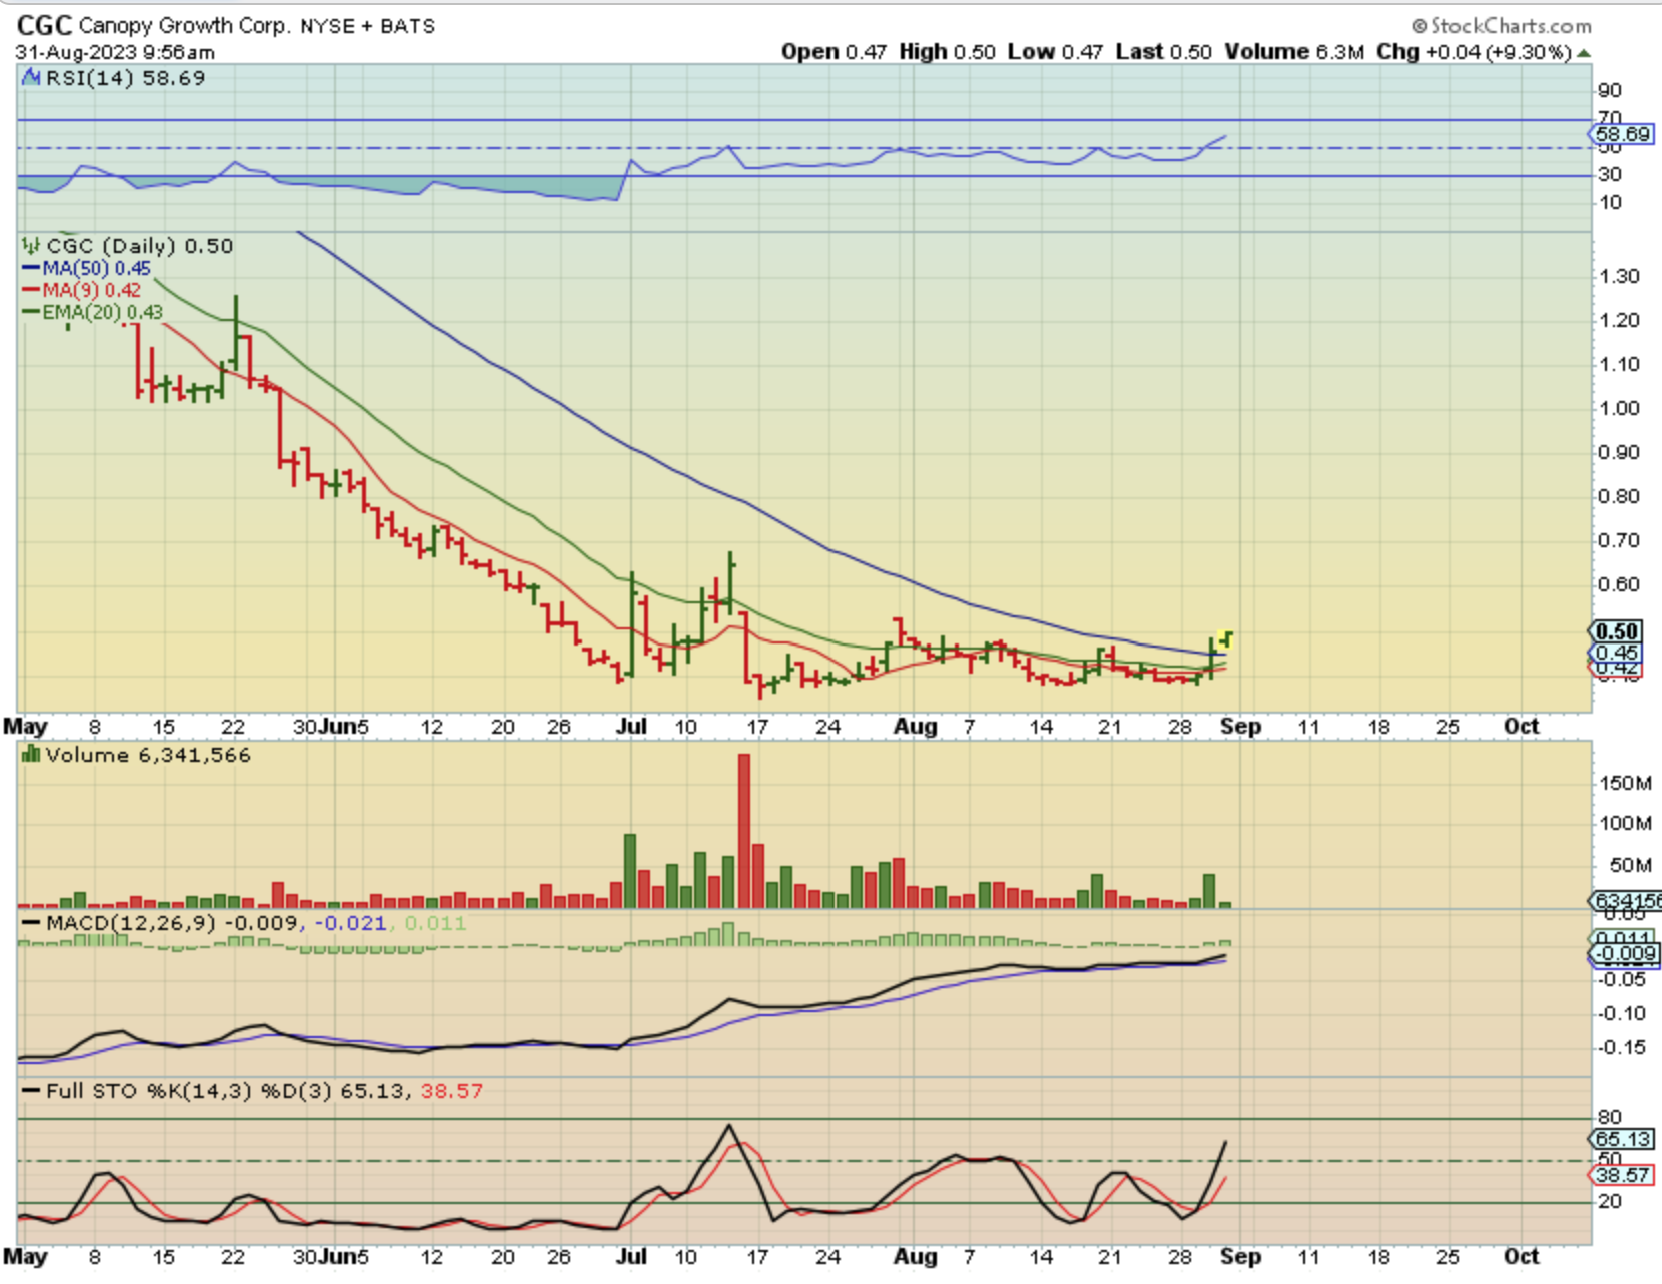
CGC started to rip higher from the open, now up 9% and I posted this at 9:56 a.m., it then…
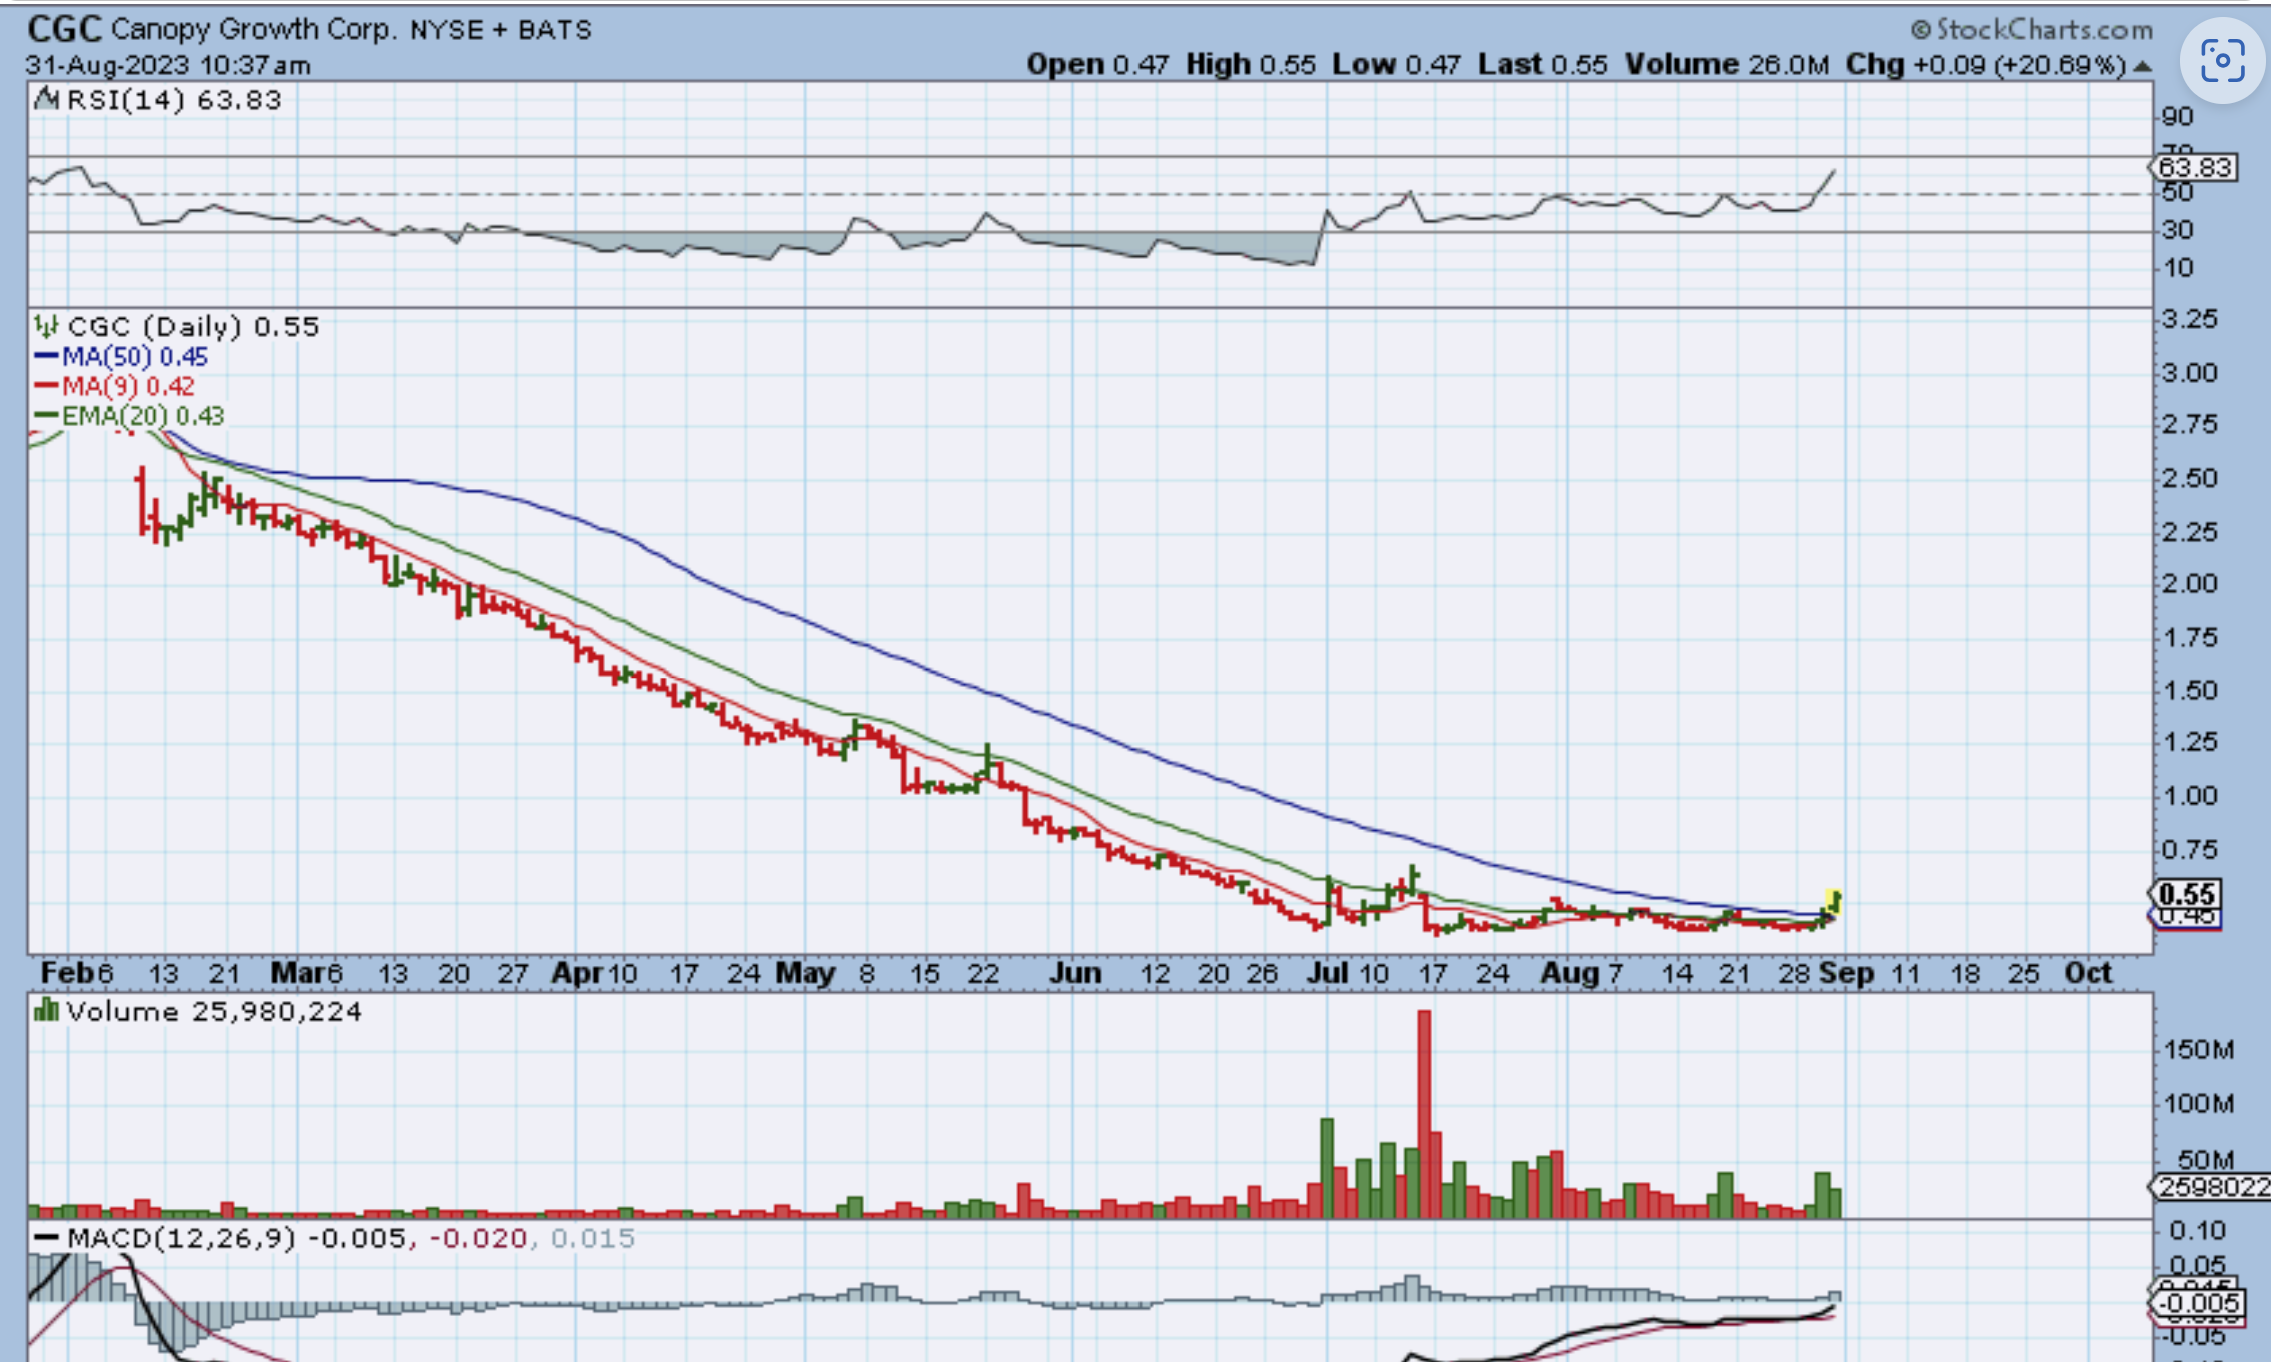
CGC then continued going, up 20% by 10:430 and it was up 40% by noon. These could be huge gainers if they start to run & short covering happens too. I actually already traded these and the gains are big if you catch them right. Buying dips may be a great opportunity IF these start to run steadily. As a reminder…
.
As a Reminder I mentioned this yesterday about the possible long-term prospects if MJ gets re-scheduled by the Fed Govt.
.
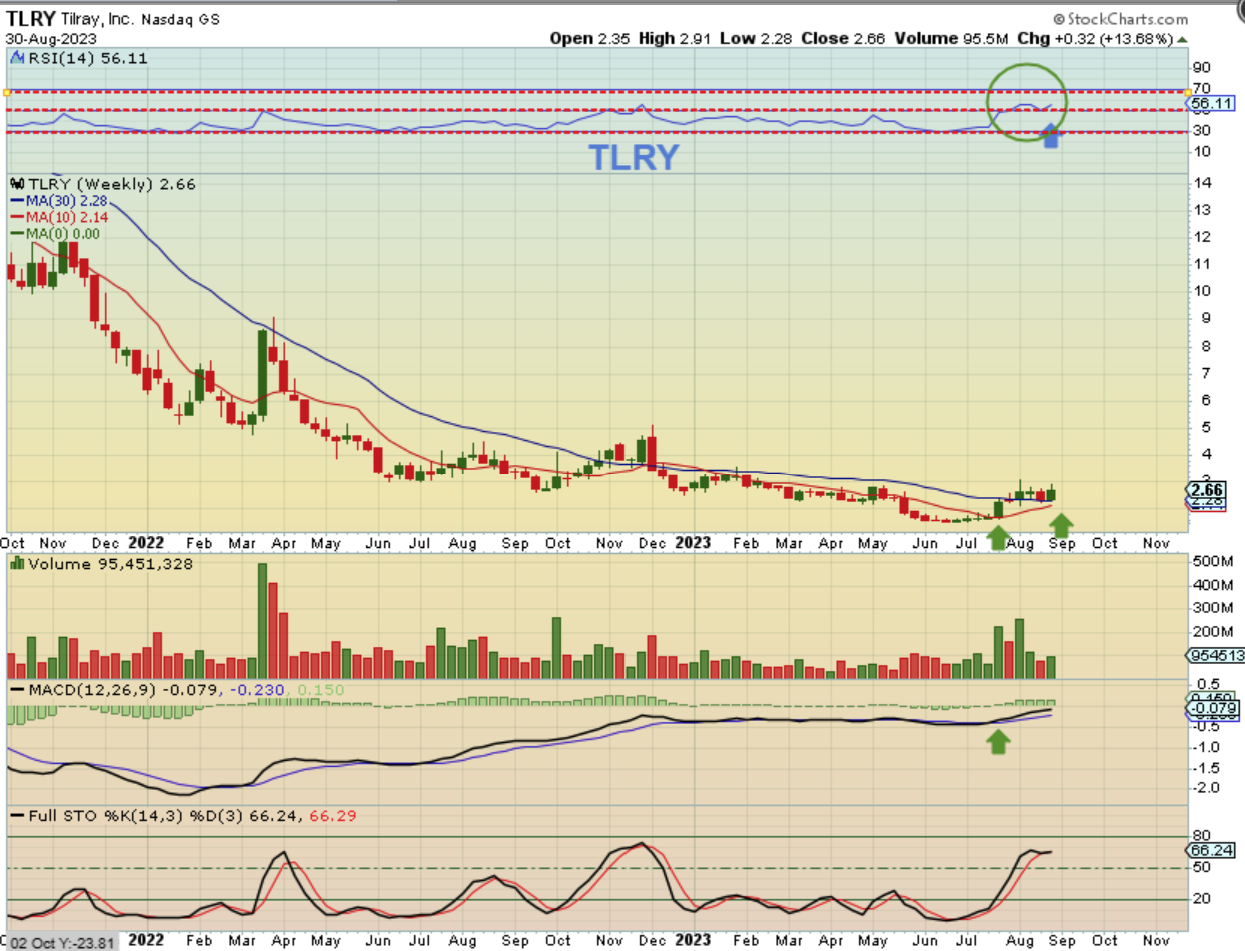
TLRY WEEKLY – The weekly chart though? I think that it is even more bullish! That RSI has not held above 50% in years, and it is there now. Price is right at a pinched 10 & 30 week MA, and that is very bullish on a weekly chart, so again, the massive weekly chart might be a bullish base formation. Lower lows again and again, but the weekly MACD is steadily rising. This might be very hard to buy and hold, but a small position might be a great way to track it.
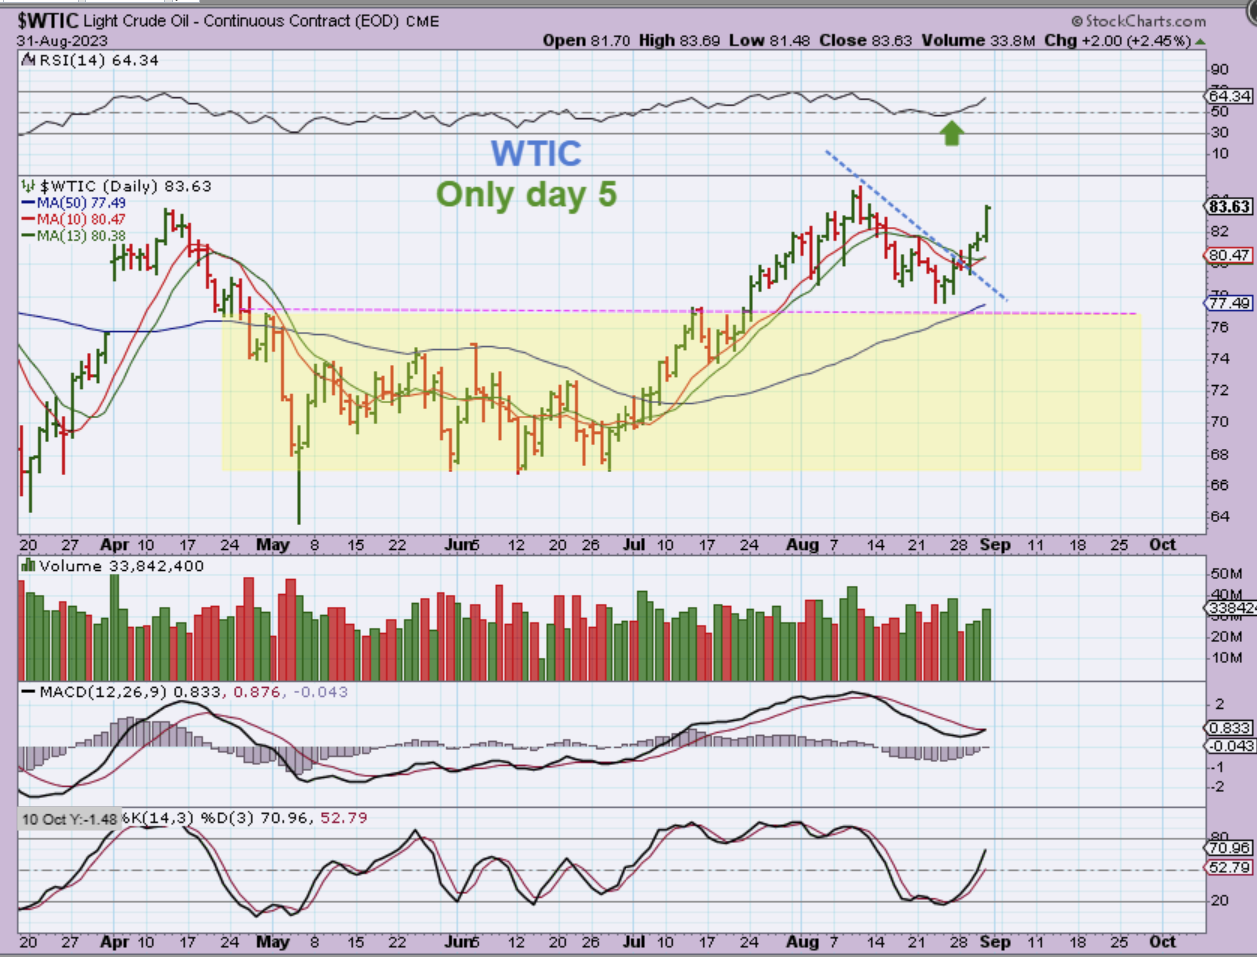
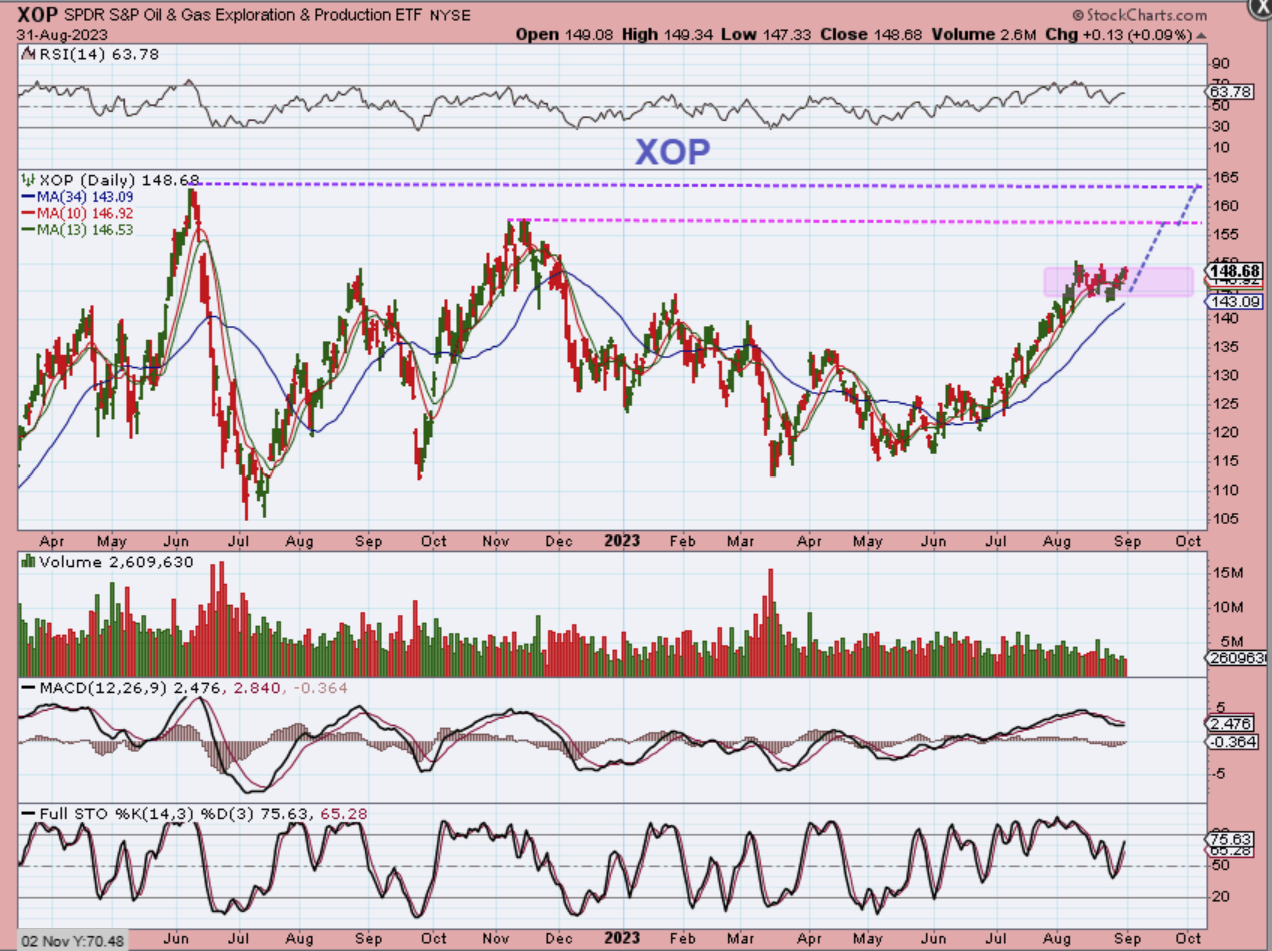
WTIC – Oil continues higher as expected. Trades here can be made with UCO, USO or any of the Oil Stocks. Traders also use GUSH with the XOP as a guide. Let’s look at The XOP…
The XOP chopped sideways or held up a little better as Oil dipped, so I would expect that it will push higher again as Oil moves higher. Yesterday, it was only up 13 cents but over time it should continue higher. We discussed APA, ERF, WTI, MRO, VLO, etc. as these moved out of their recent lows.
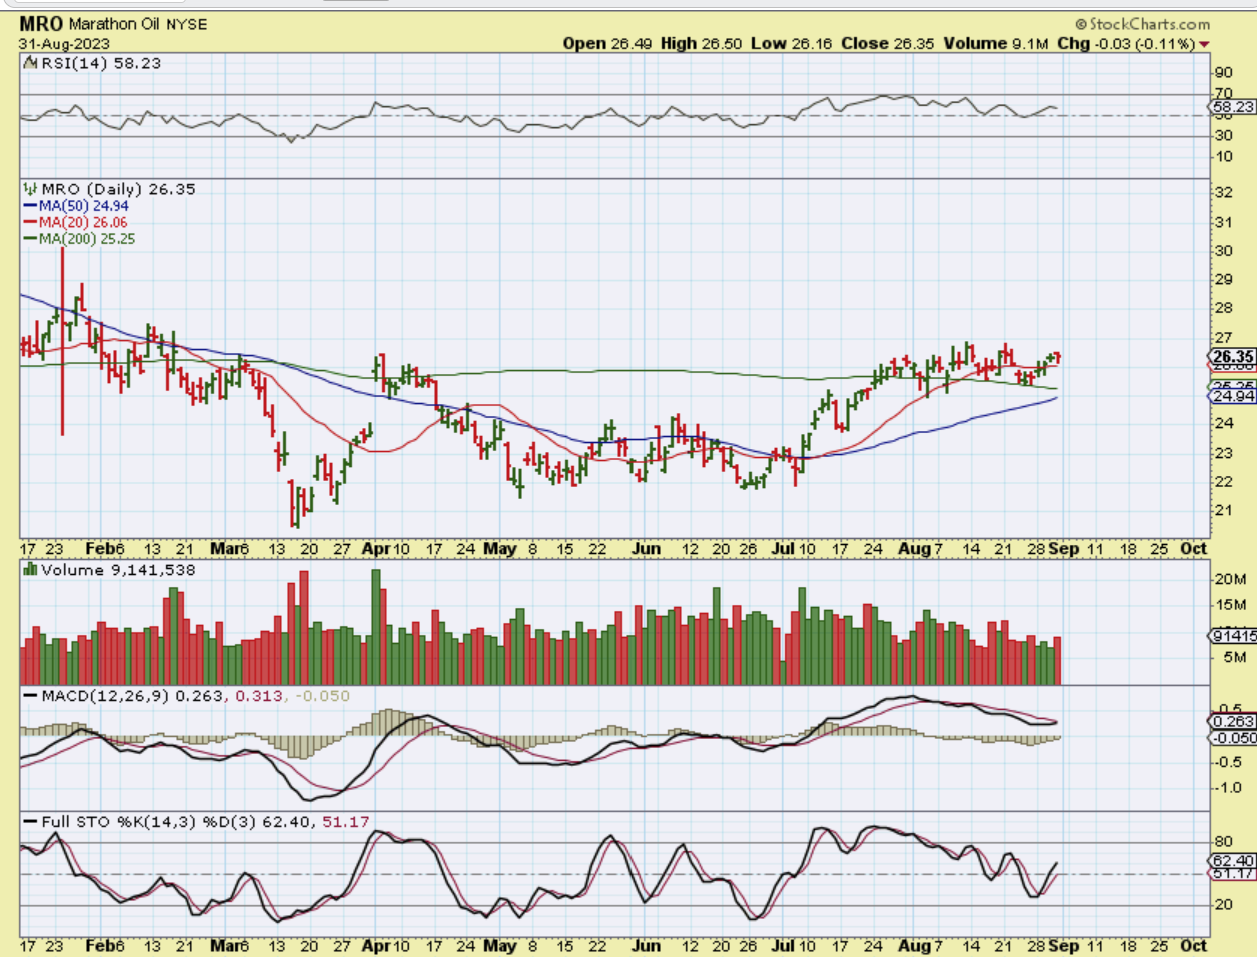
I looked at a few of the Oil stocks and again, they didn’t pull back as much as Oil. Some are climbing their 20 or 34 sma, and others like MRO have been chopping sideways while back testing the 200sma. They do remain bullish in the choppiness.
.
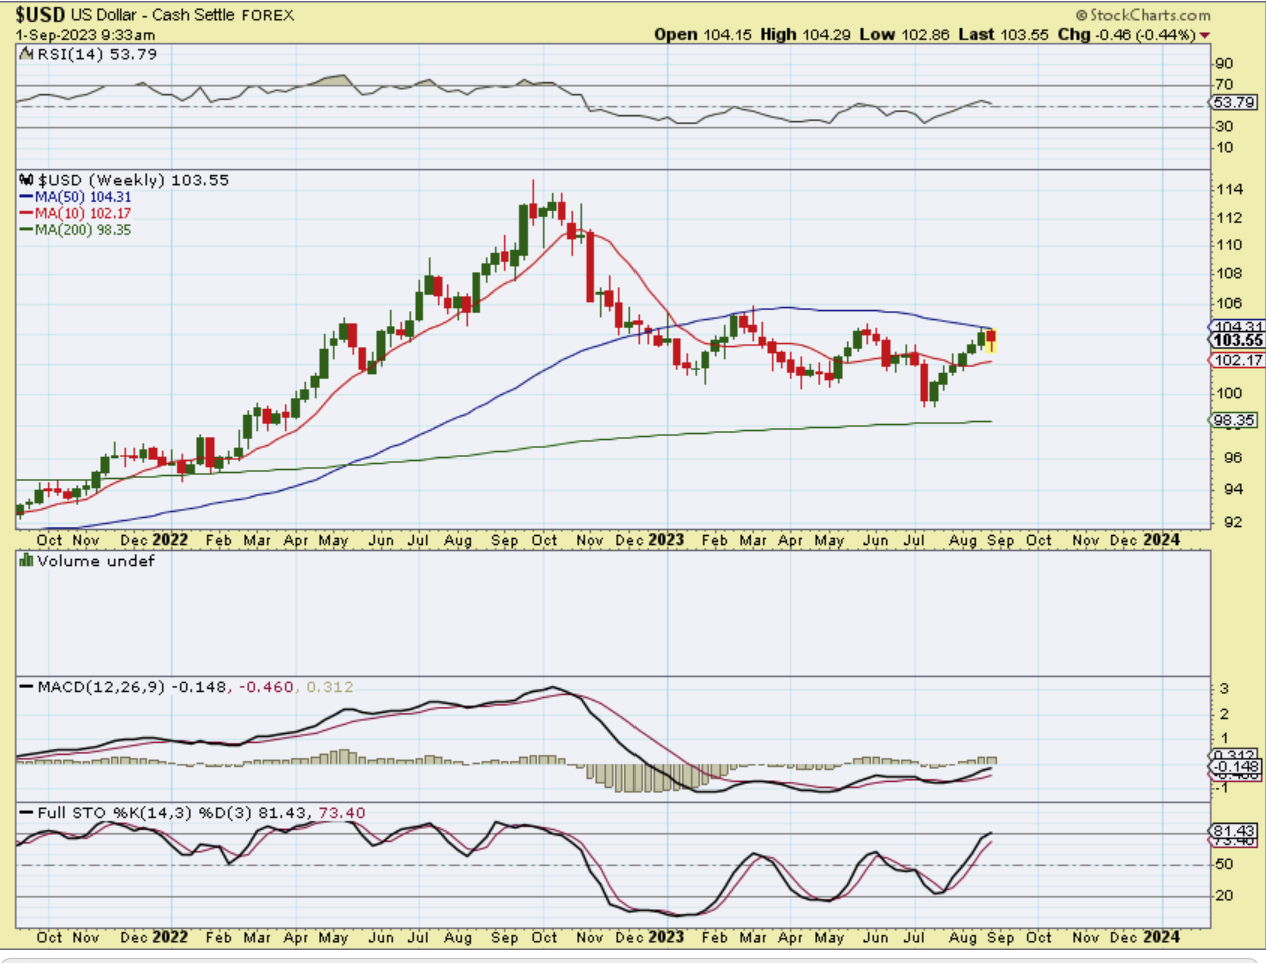
The USD put in a pretty good bounce yesterday, but as you’ll see, Gold & Silver were not drastically affected. Also…
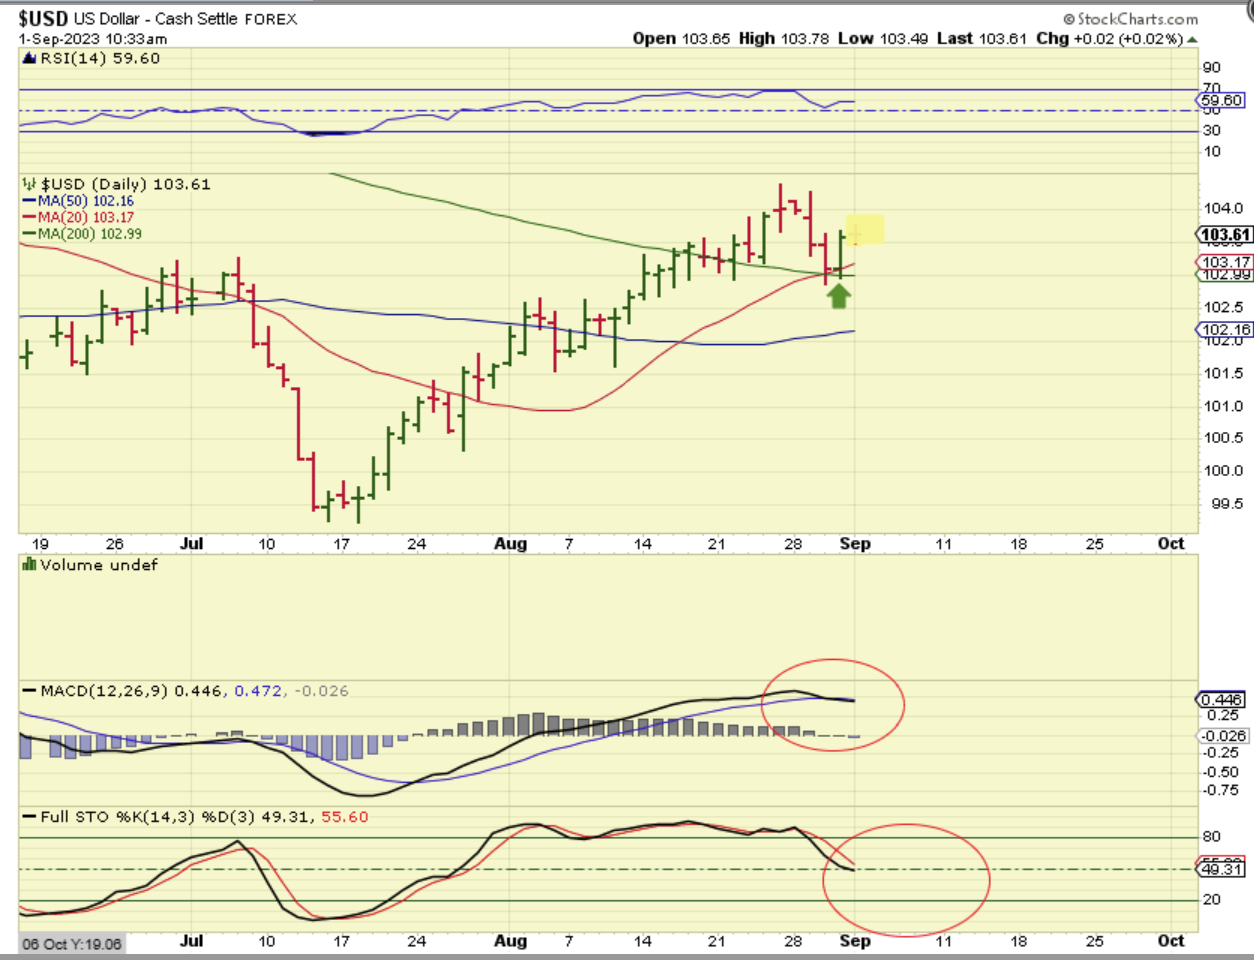
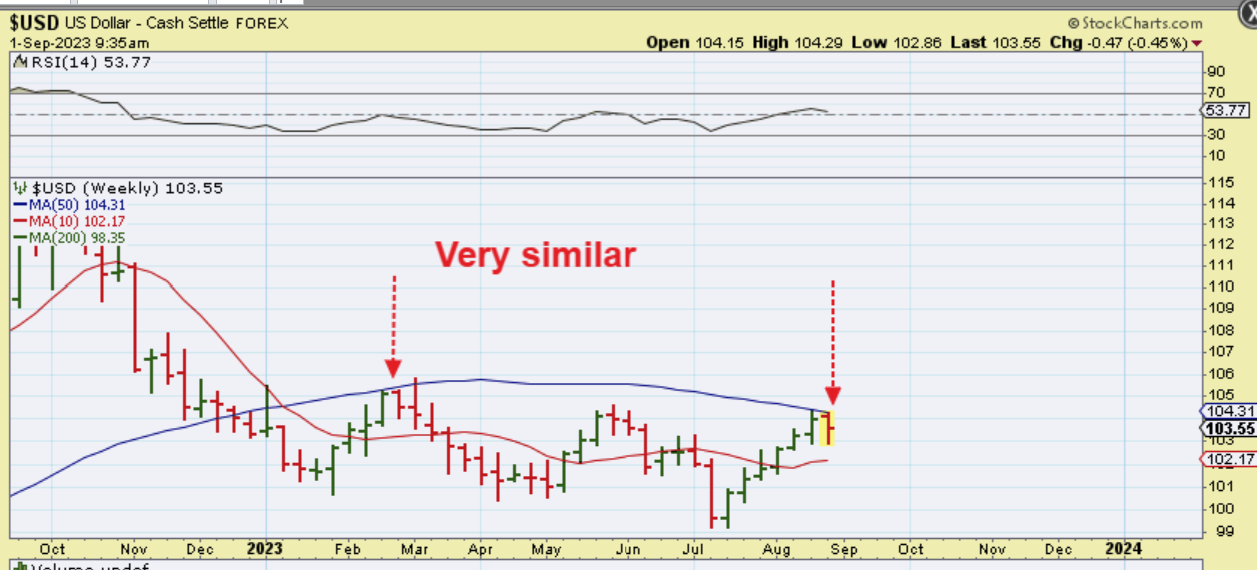
Take a look at The USD Weekly chart: It was rejected right at the 50 week ma, and this could be where it starts to roll over & drop into that 3 yr cycle low again.
When I use OHCL price sticks, The USD Weekly looks very similar to the last time it tagged this 50 week ma. It bounced for 1 more week and then rolled over.
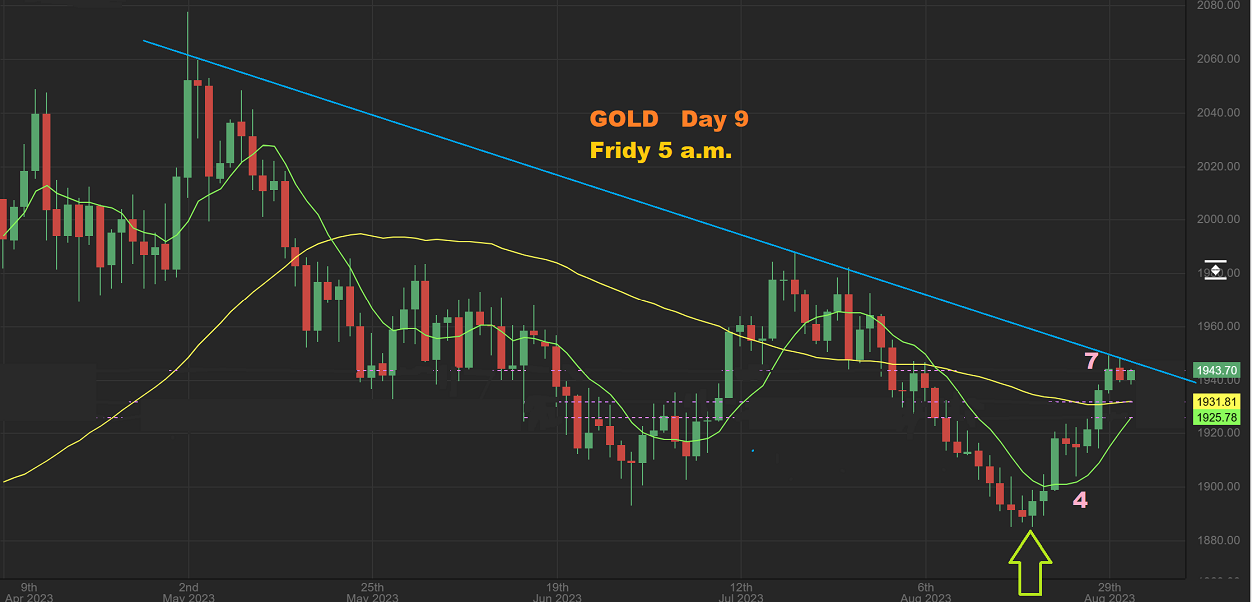
Friday 5 a.m. ET: GOLD Live –
Gold is starting to bounce this morning, and as you can see, yesterday it didn’t drop that much when the USD popped, so that is encouraging. In fact, this may crawl for a day or 2 more, to build energy to break out next week.
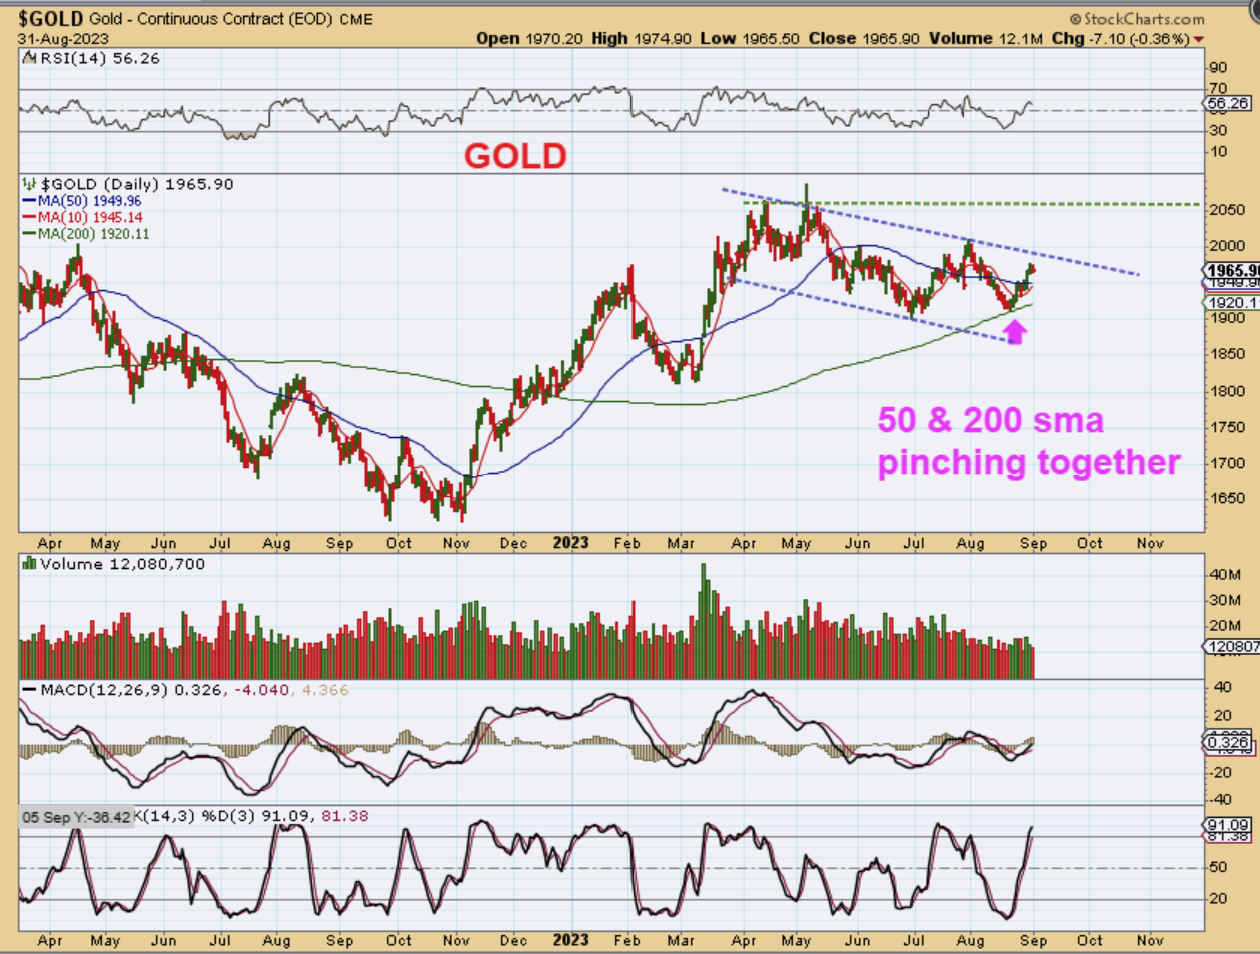
GOLD is also showing a pinch of the 50 & 200sma in the bigger picture. This is a bullish set up and we are expecting Gold to break that downtrend, run up to all-time highs, and then break out.
.
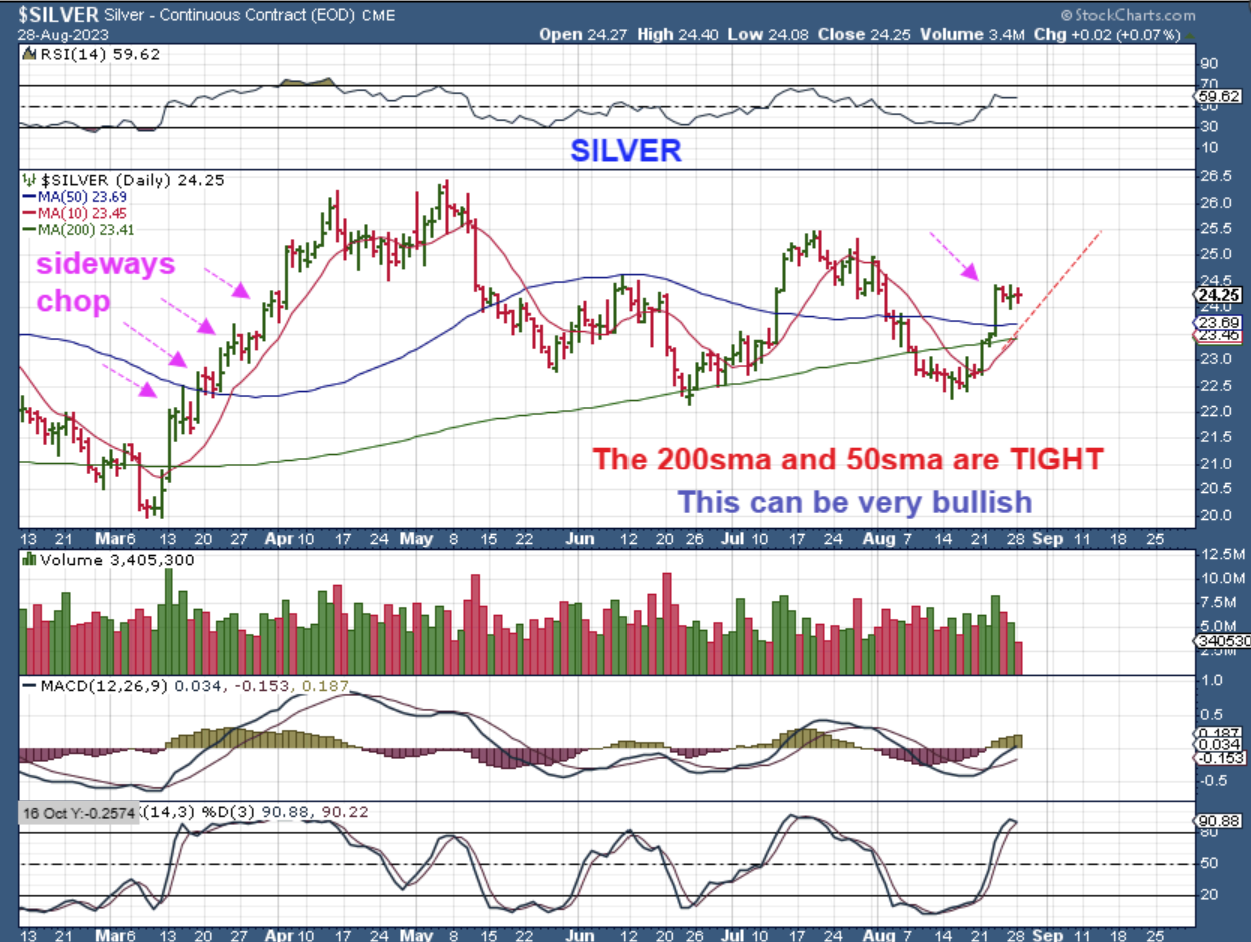
On August 28 I pointed out that Silver often chops sideways for a few days when it gets too far from the 10sma. See the left side of the chart.
.
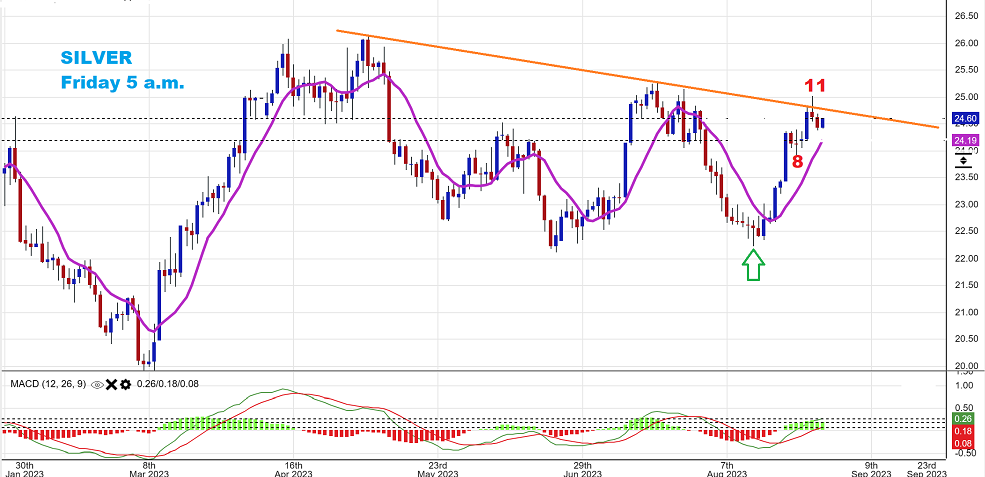
Friday 5 a.m. ET live SILVER – So yes, Silver is crawling sideways to the 10 sma, as expected. It looks to be preparing to break out higher too.
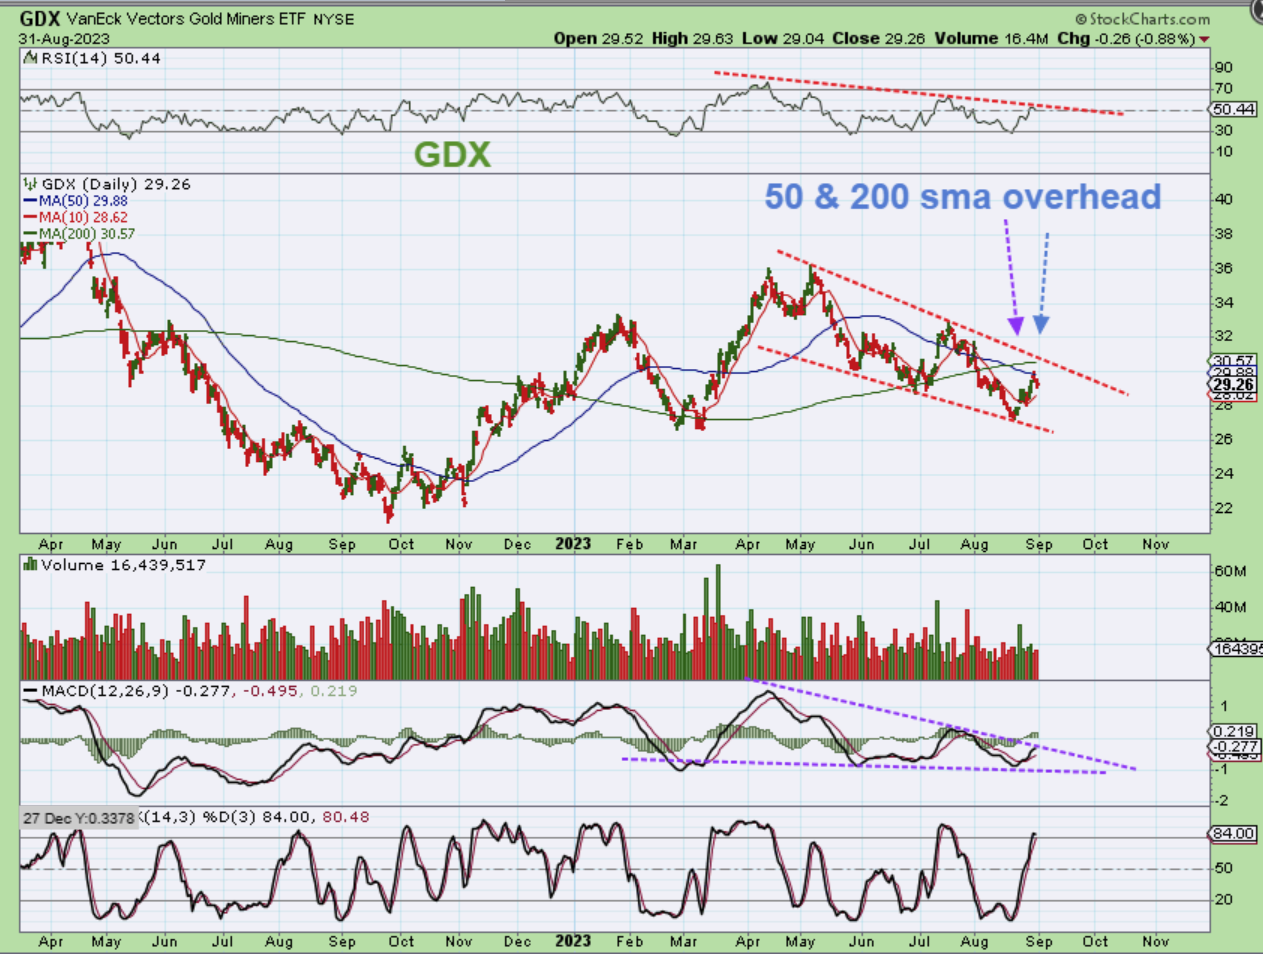
Here we see that The GDX ETF ran up to the 50sm and stalled. It also has overhead resistance with the 50 & 200sma, but I do like the wedges on the RSI & MACD. We just need a good push for this to break out and then we should be off to the races. Gold and Silver have trend lines overhead to break too, so when they break out, Miners will likely run.
Some of the Miners are weak, lagging, and still closer to the lows, like GORO, but others are holding up nicely.
.
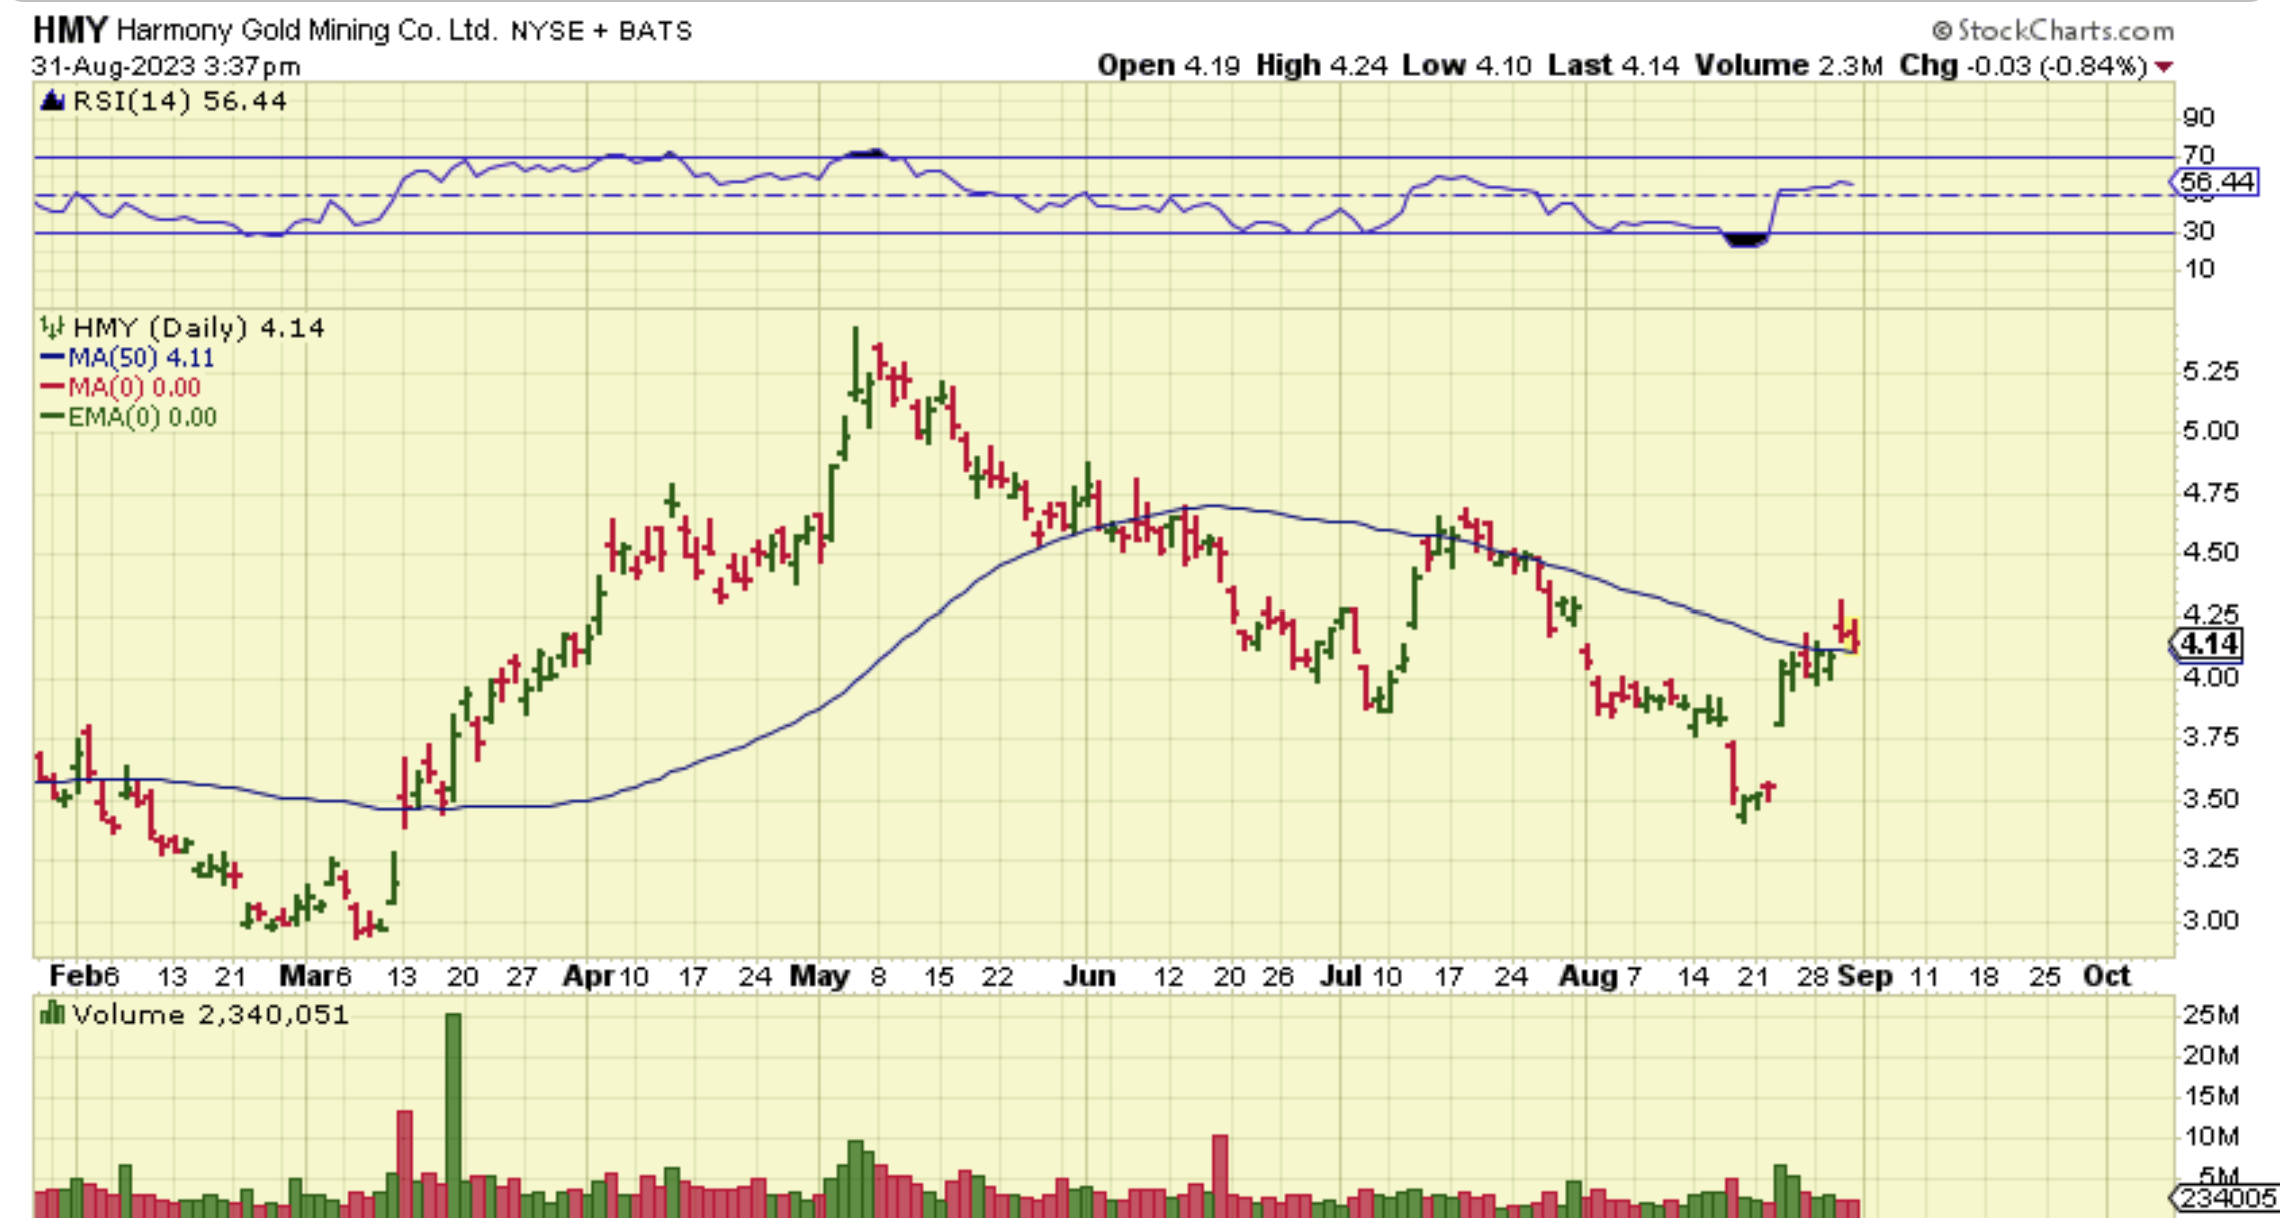
HMY has back tested the 50sma.
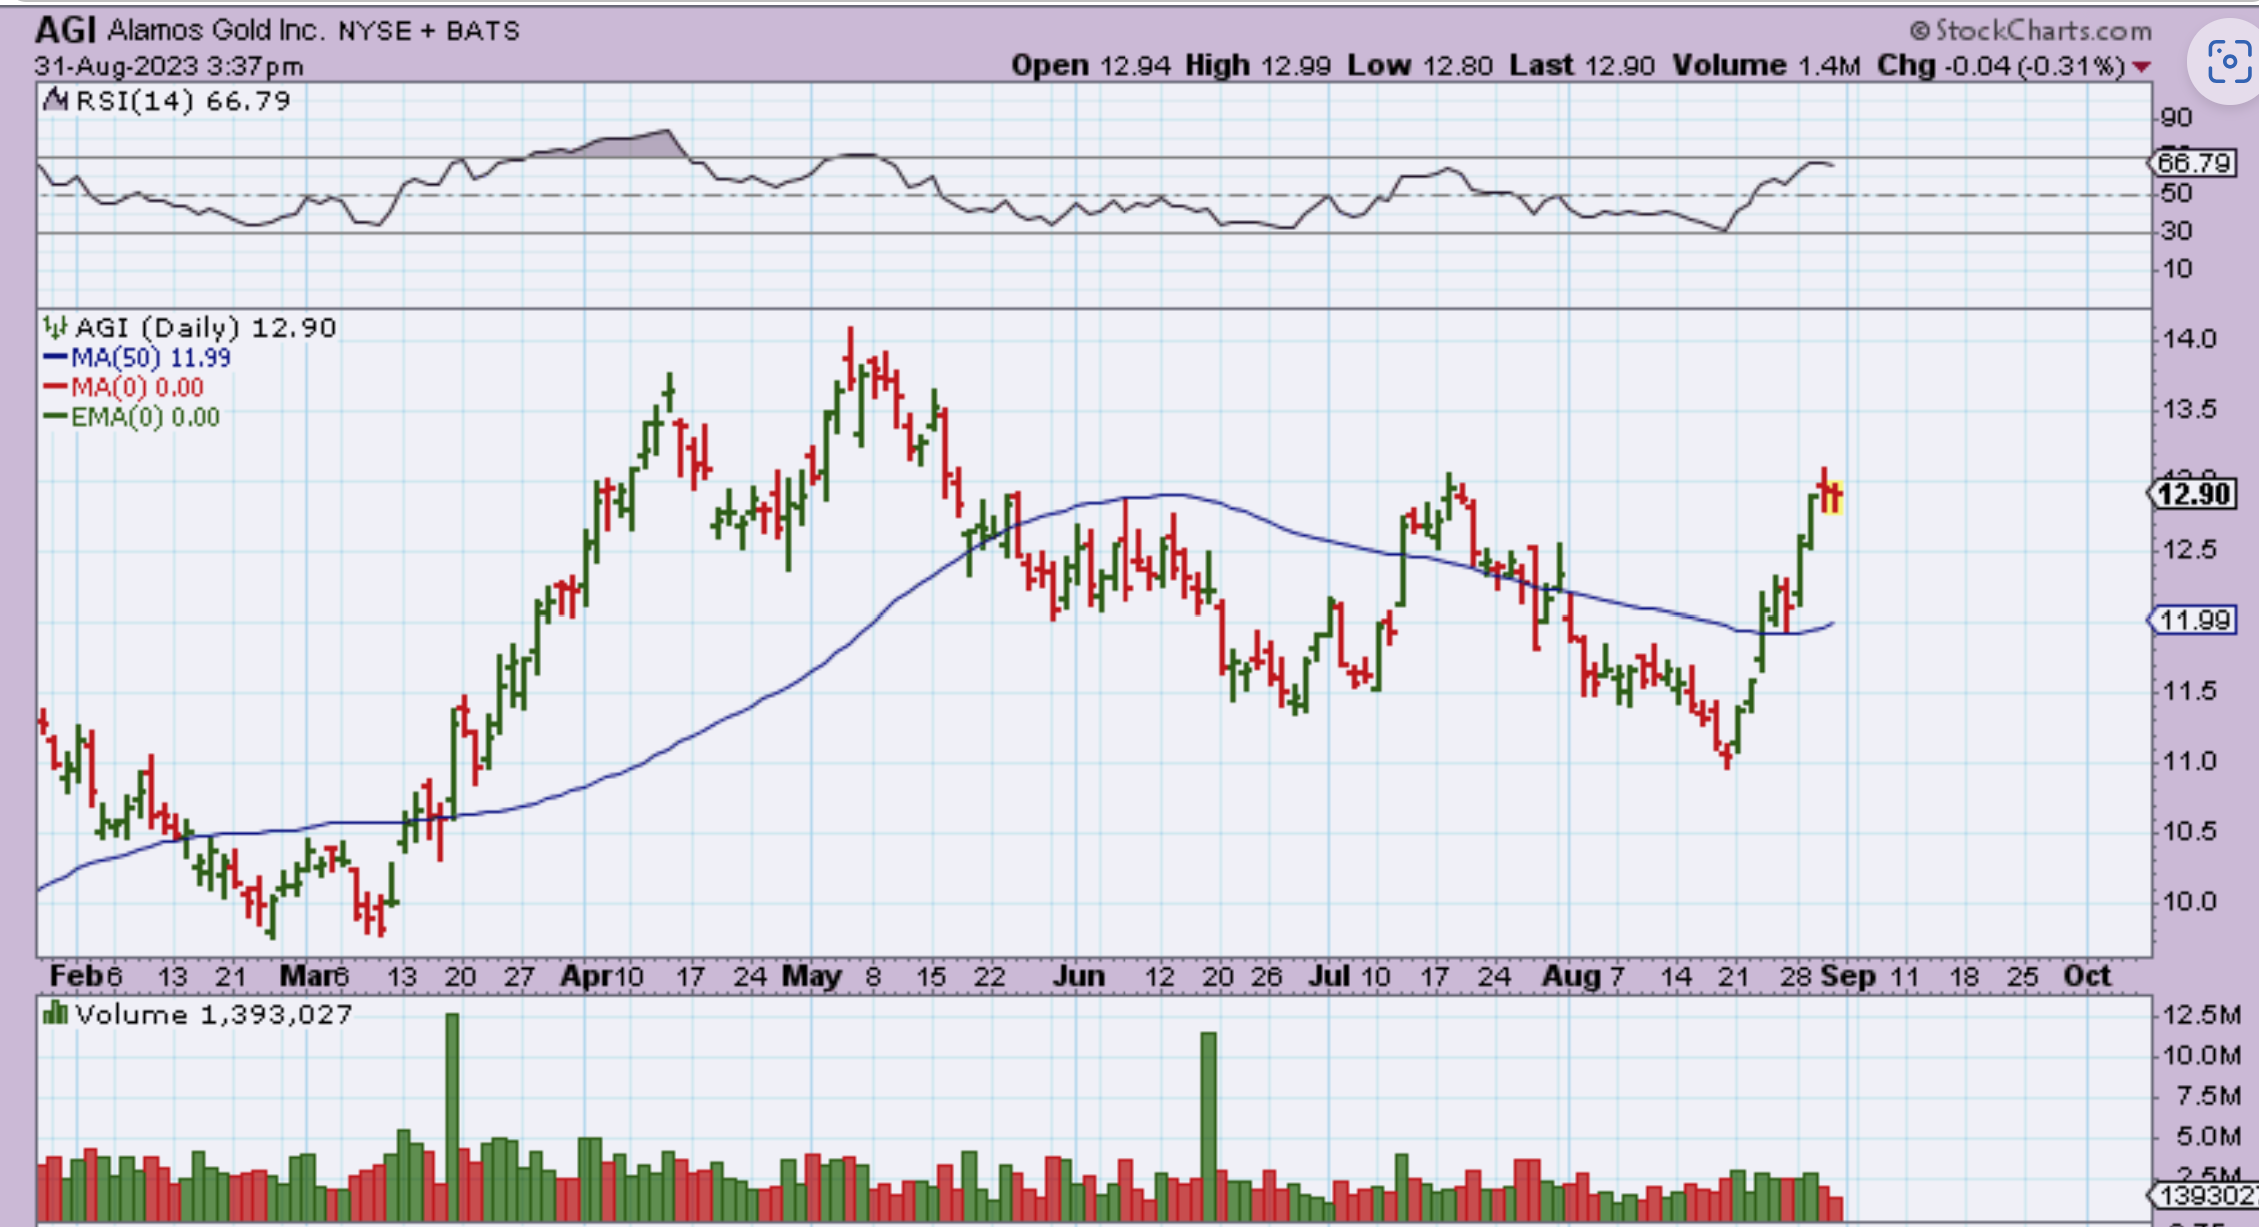
AGI , which was one of my favorites recently, continues to do well.
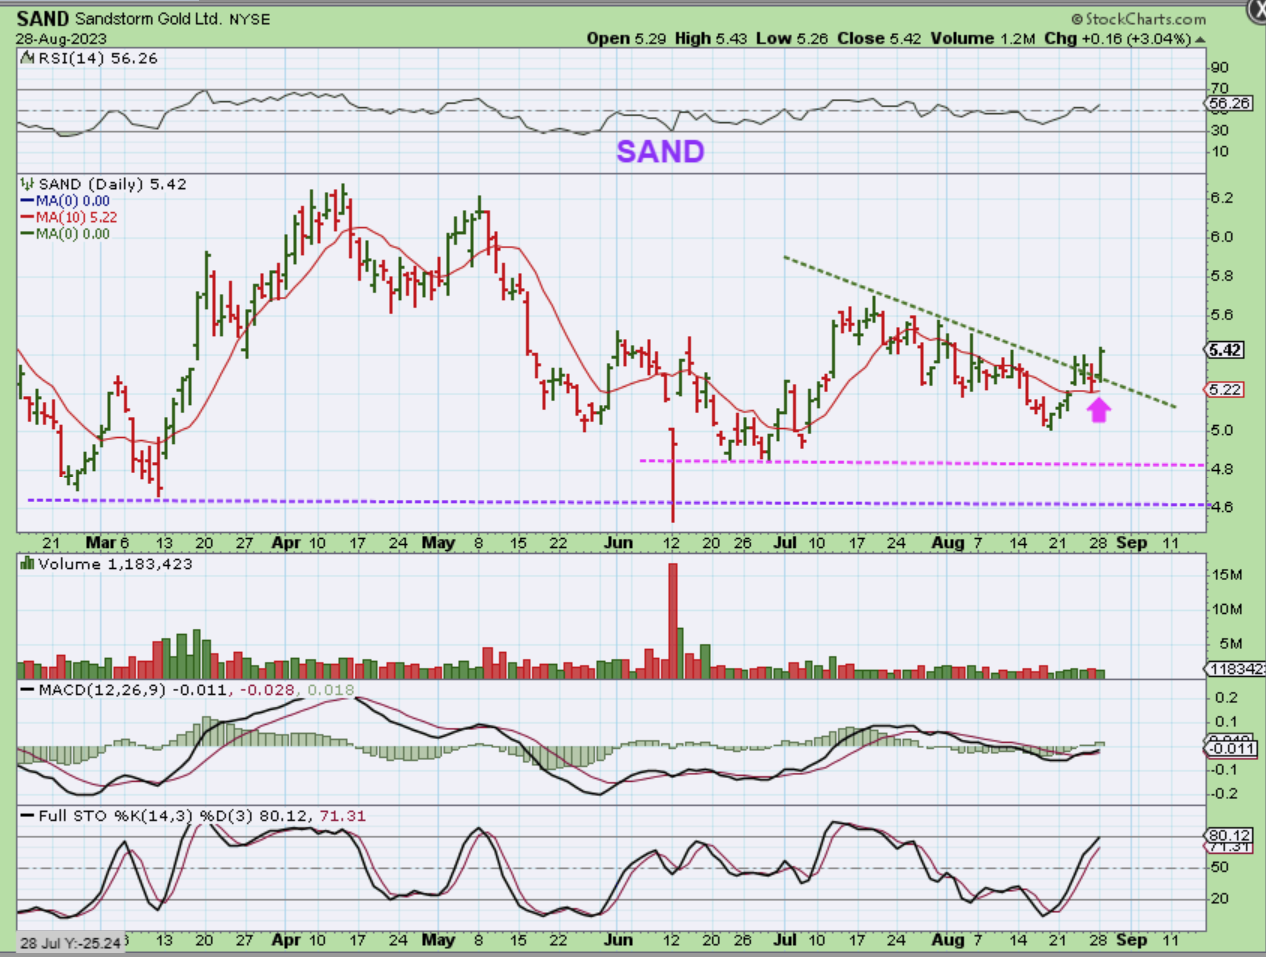
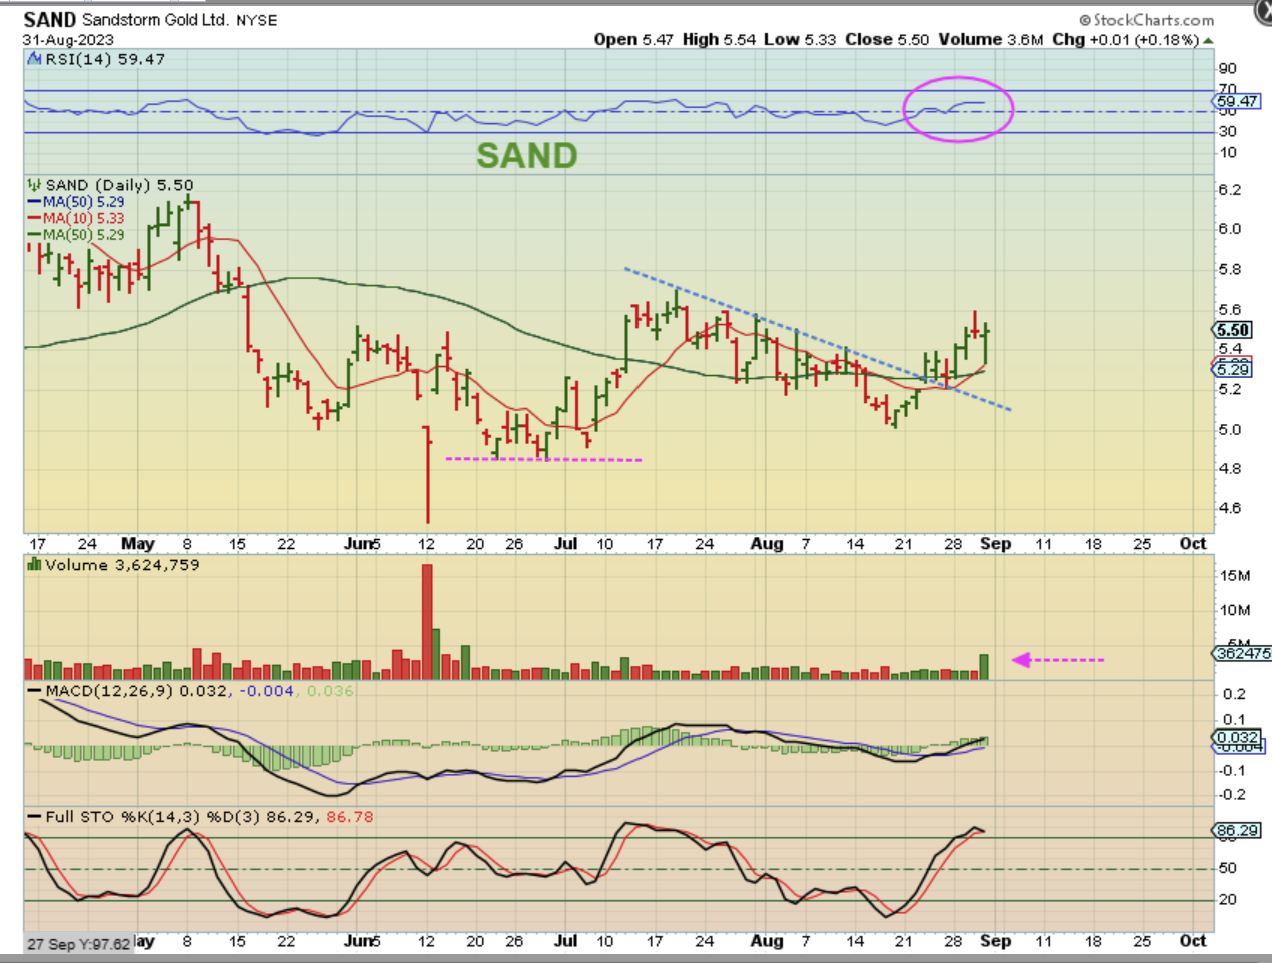
I just mentioned that SAND was breaking out as a buy with a stop at the reversal low on Aug 28. Is it holding up?
.
SAND – That was a pretty interesting day yesterday for SAND. It dropped to the now rising 10sma and reversed to green. That is bullish price action on a day when the USD was up and Gold and Silver ‘paused’. I would say that it is safe to move a stop up to the 50sma now.
.
Today is the Friday before a 3 day weekend in the U.S. and often I will mention that it is a good time to analyze your holdings and decide how much you want to be holding over a long weekend. In this case, however, we are early in the daily cycle for the General Markets, Oil, and the buy for the Precious Metals was down at the lows ( for a basket of miners) and they should be fine by the time the markets open on Tuesday. In other words, everything looks very good in the market set ups right now. Enjoy your Friday trading!
.
~ALEX
.
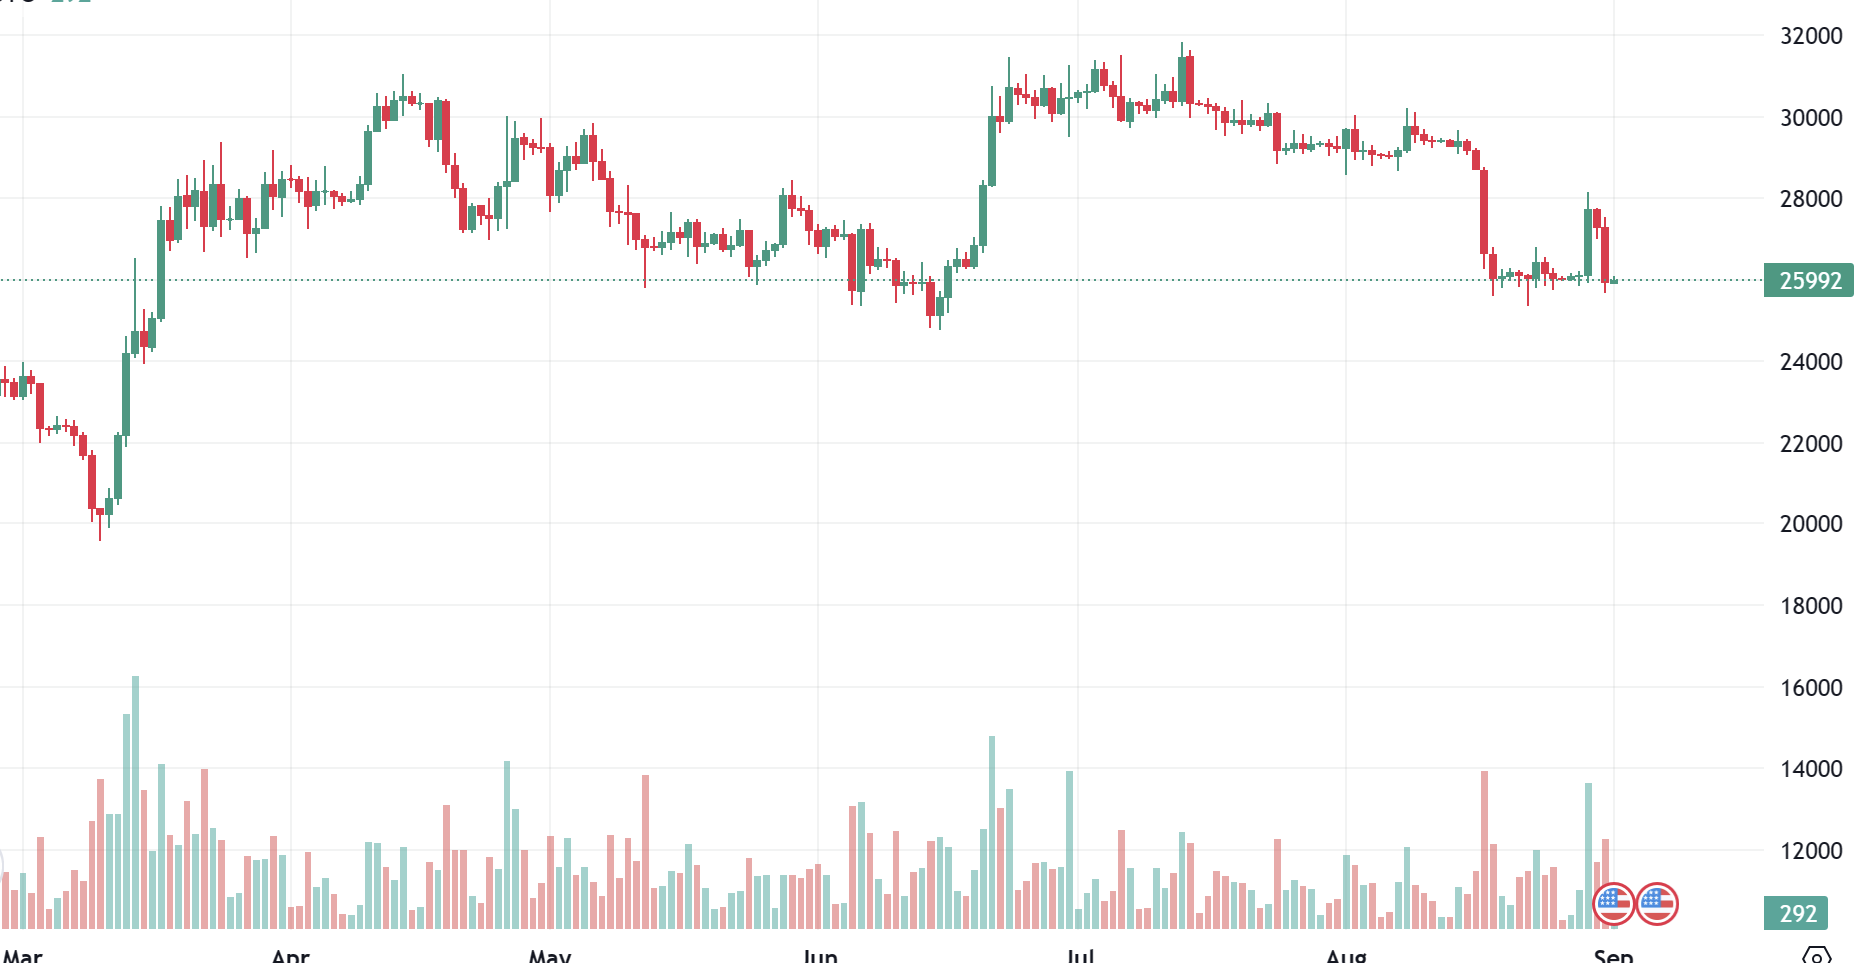
BITCOIN popped with the positive chatter pertaining to the proposed Crypto ETF, but wow- it really gave that back fast yesterday. Many of the Crypto stocks like MARA, RIOT, HUT, WULF, etc had Large Pops 2 days ago. Mara was up 30%, RIOT was up 18%, etc. At that time, I said that you could look for a dip to possibly enter, but this slam down may negate any desire to enter those trades. They may now return to recent lows.