
Wednesday August 30th – Strong Bullish Action
On Tuesday the USD started to drop a little more than it has over the past couple of days when I said that it looked ‘toppy’ or that it looks to be in a ‘topping process’. When the USD sold off, everything else really pushed higher. It was a bullish day across the board, and even Bitcoin and Crypto stocks had a huge day. That is good news, because we certainly do expect the USD to drop further over time. Lets take a look…
.
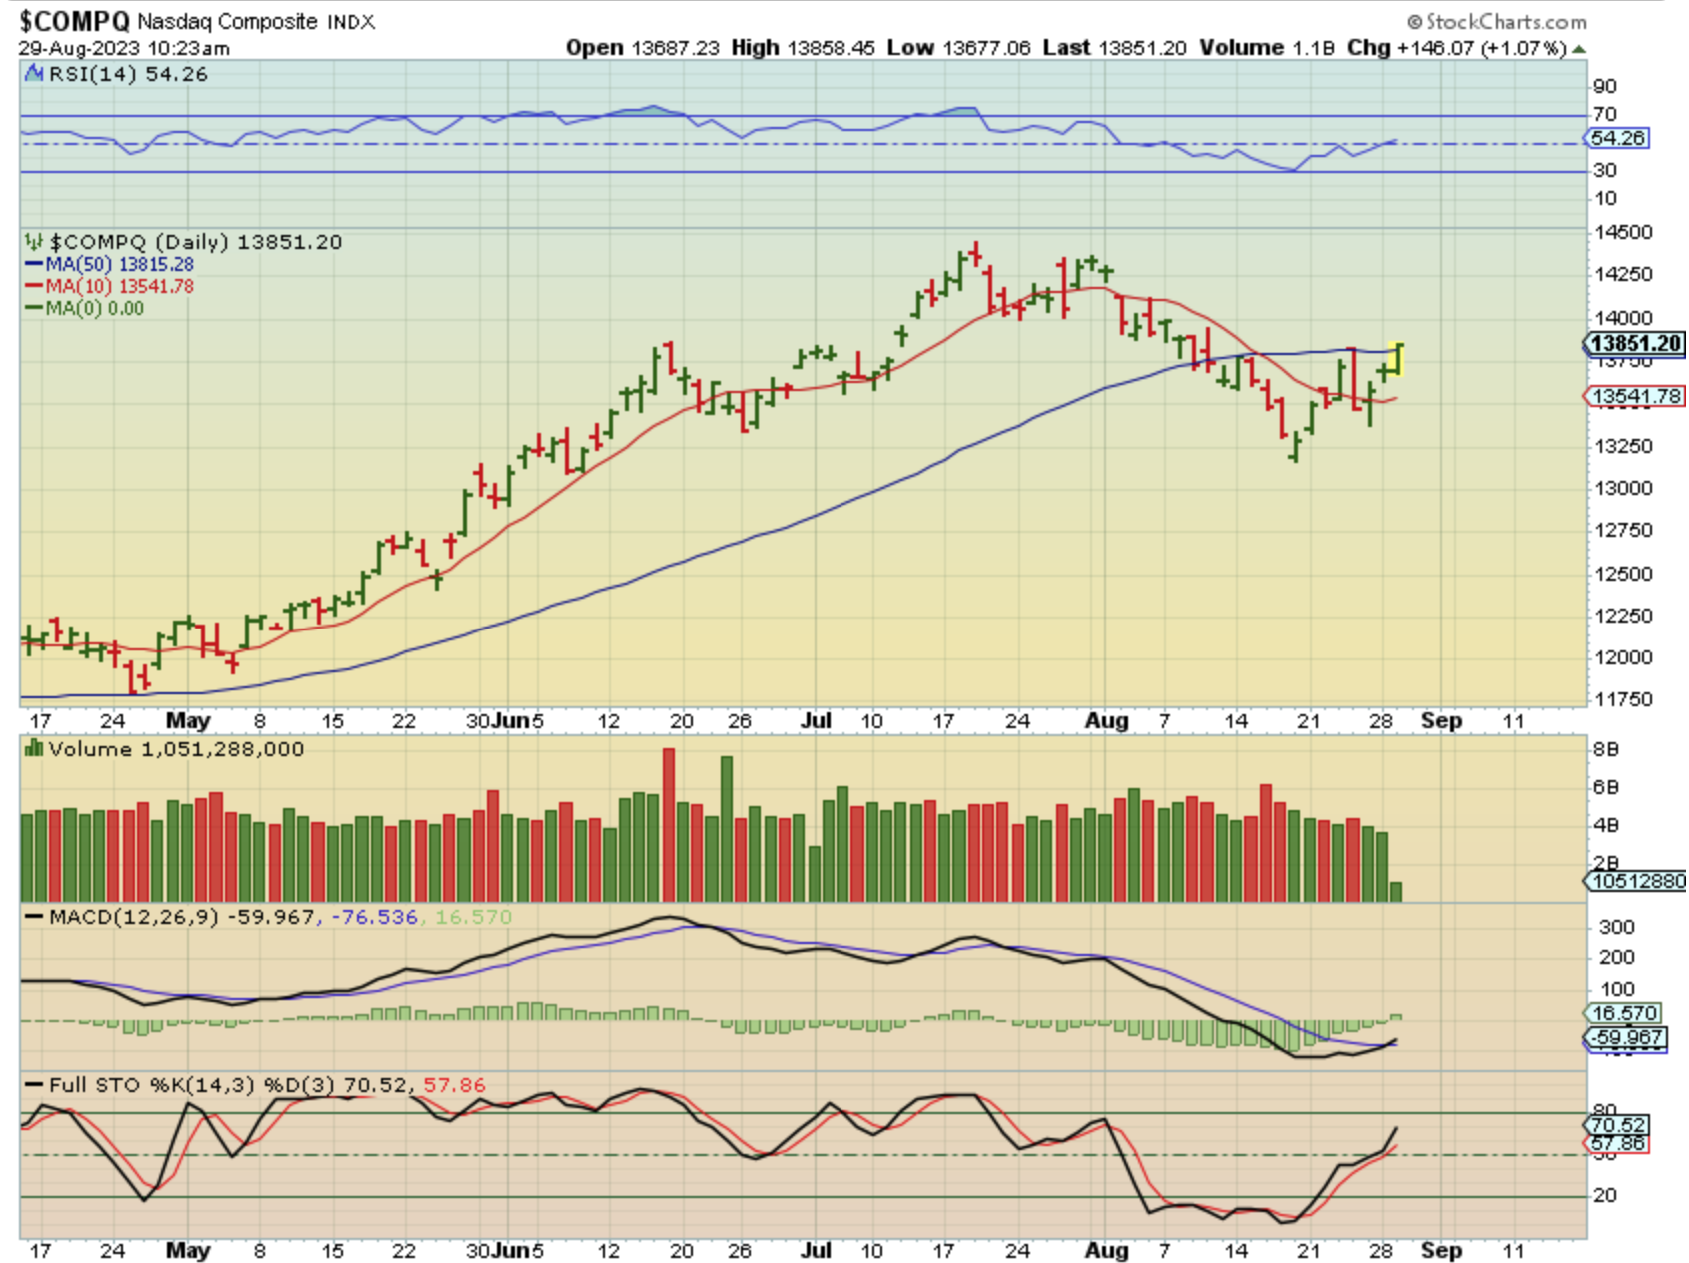
Within the first hour of trading The NASDAQ Indx started to break out, so I posted this chart.
.
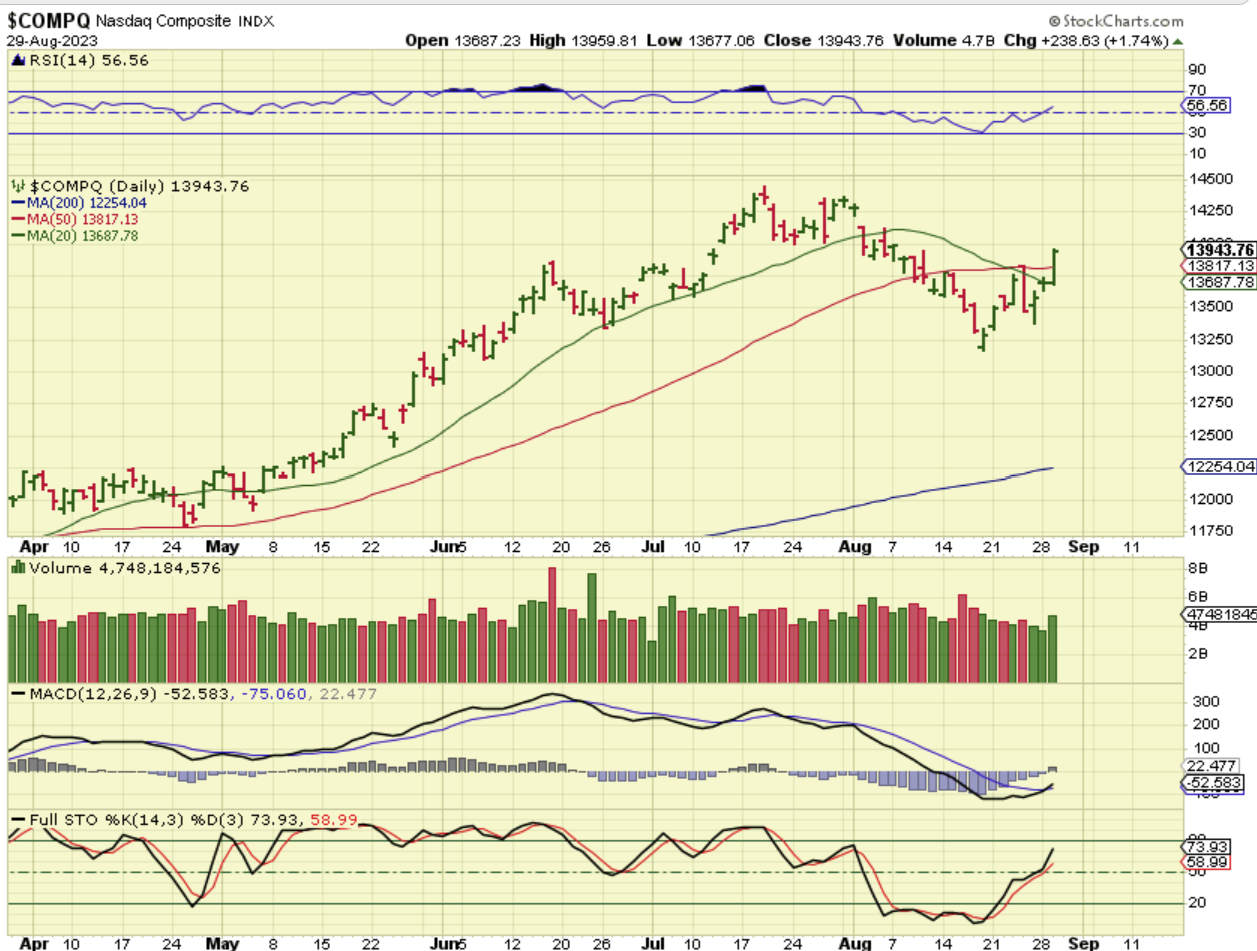
NASDAQ – By the close we now had a convincing break out, so when I was saying to use stops at the lows and raise them along the way, you could now raise a stop to the day 5 dip or the 50sma. The 50sma may be a bit tight right now, in case we see a back test, but day 5 is reasonable.
.
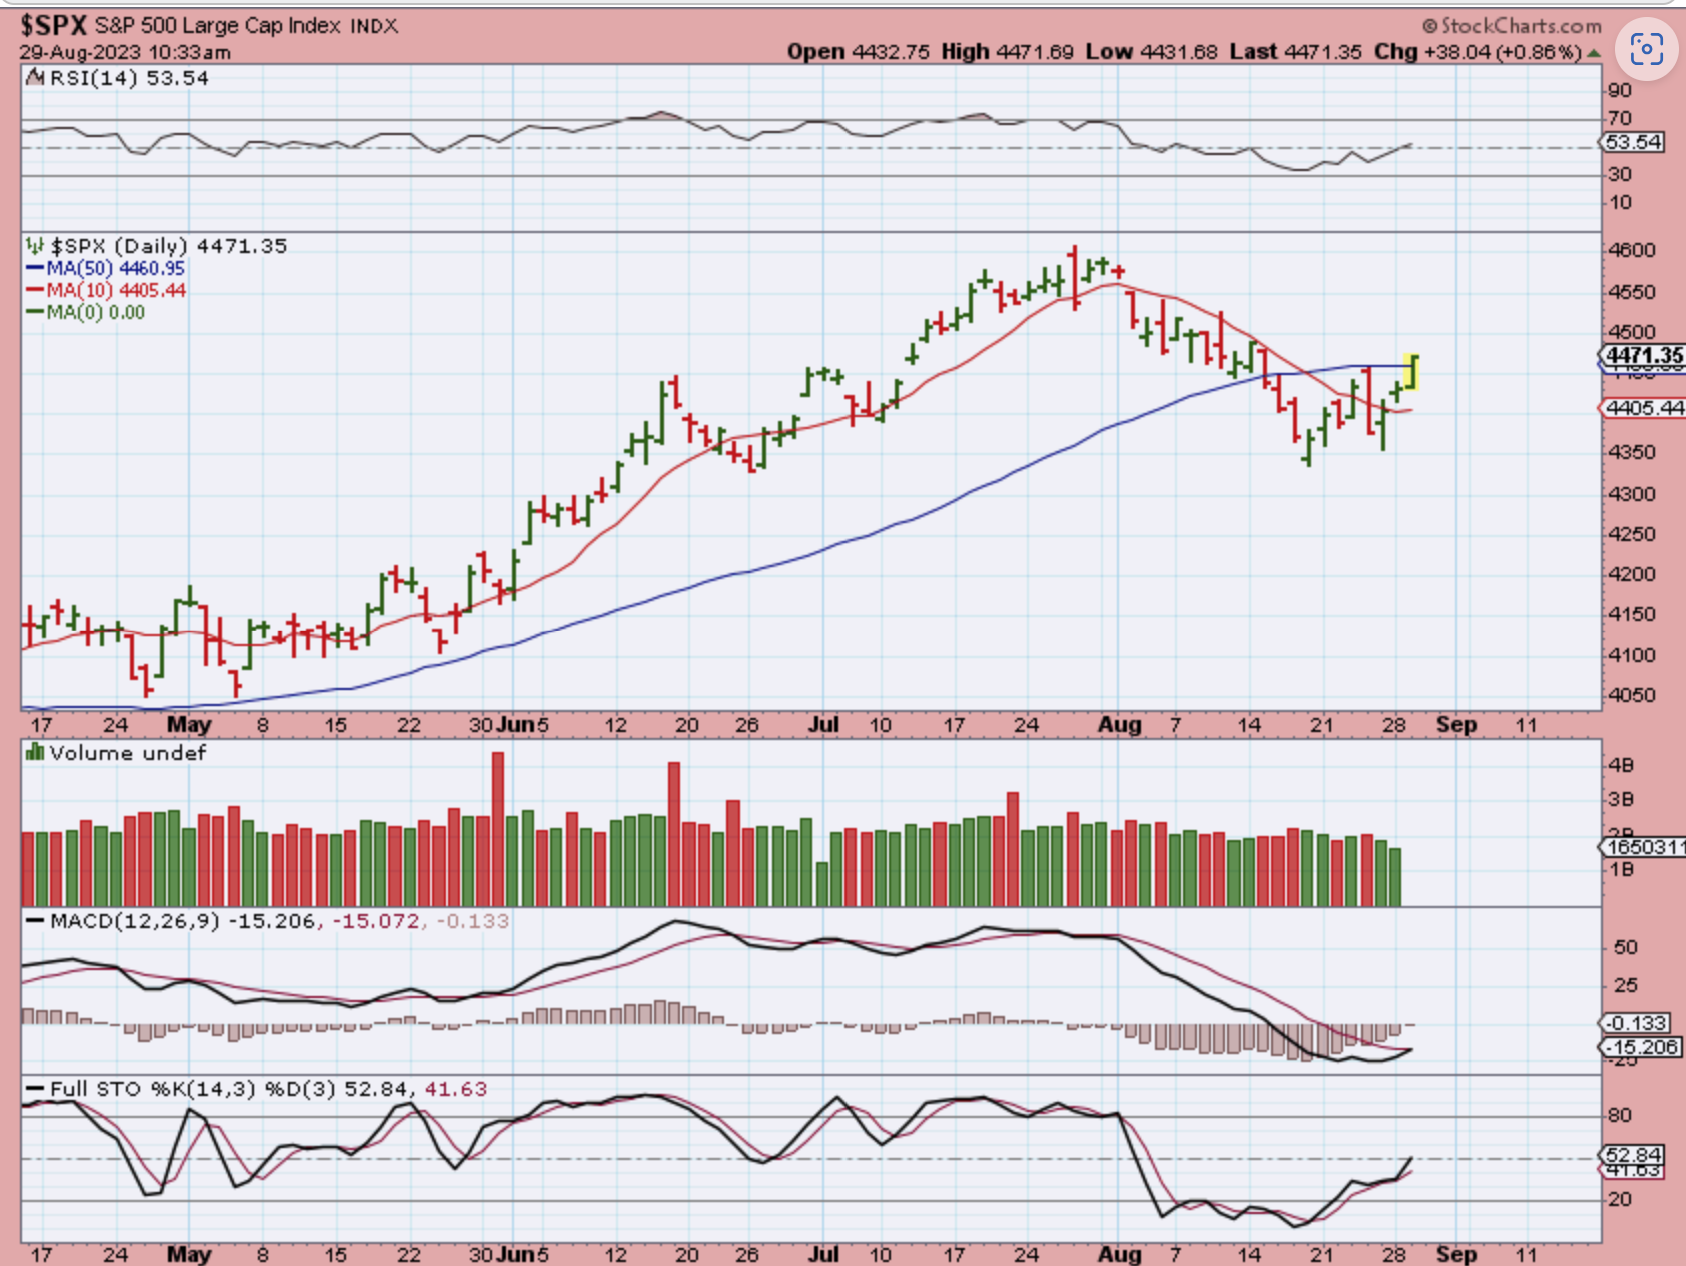
SPX – Again, an hour into trading we started to see the breakout in the SPX too.
.
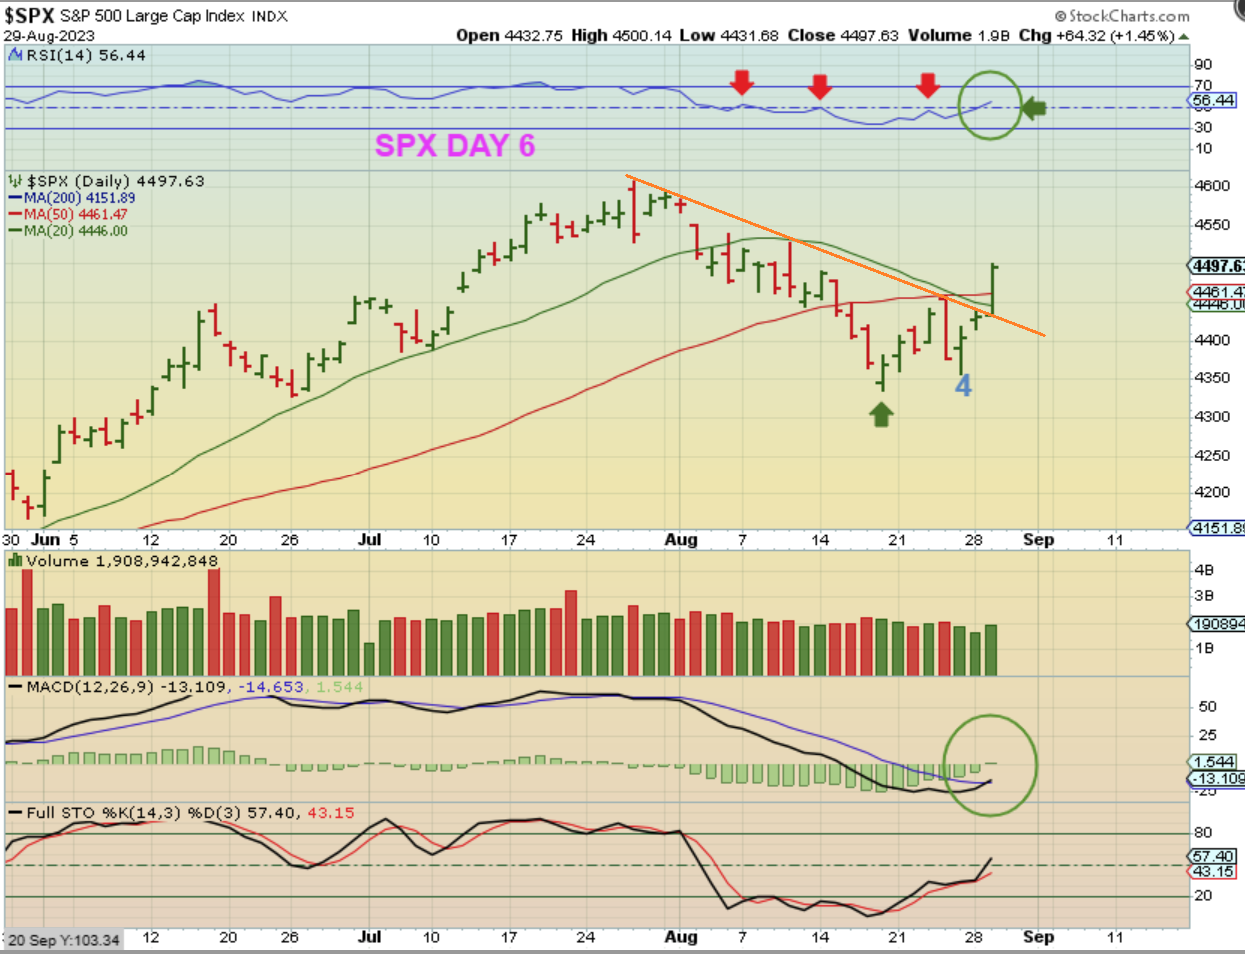
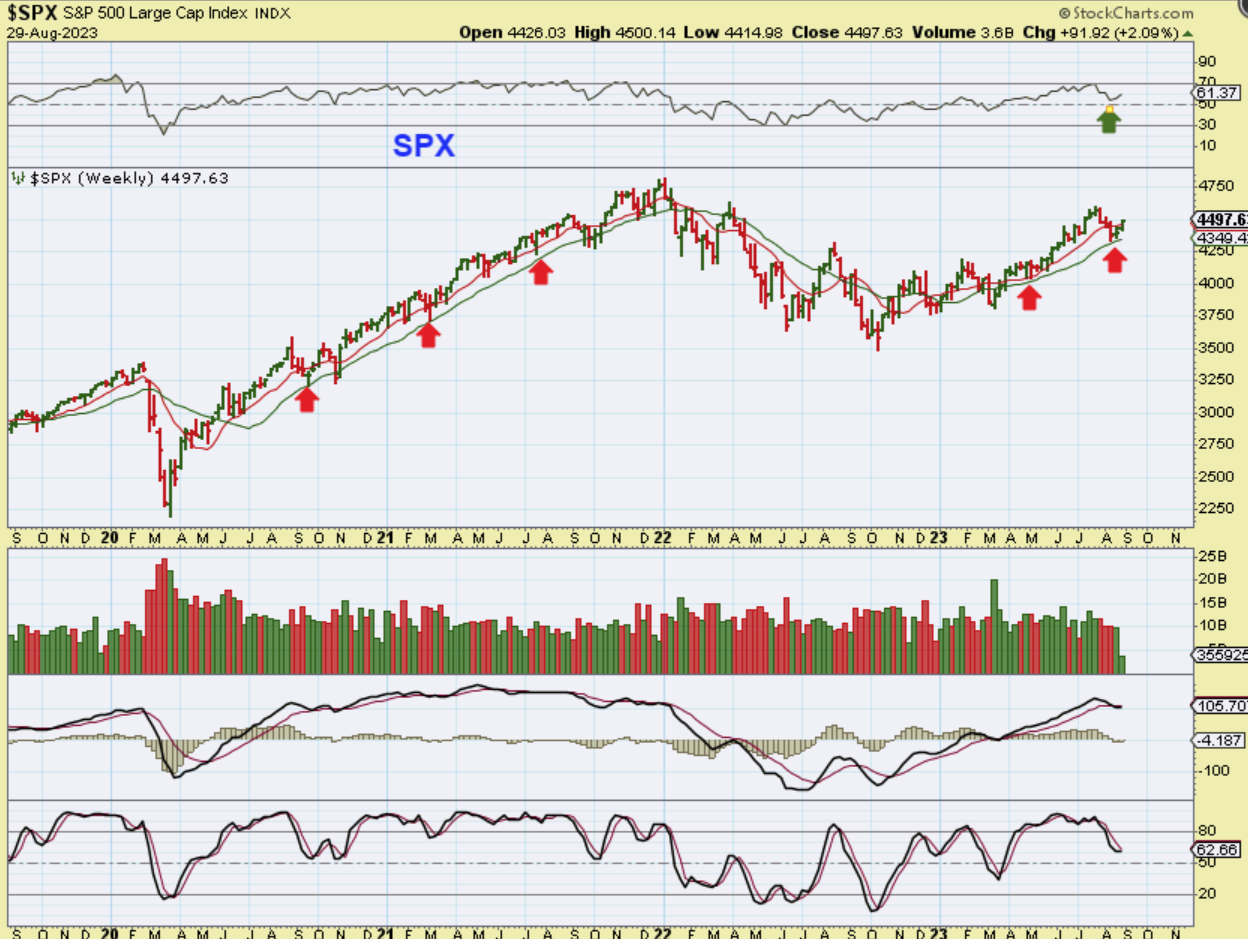
By the close, The SPX has a strong move above that 50sma and the downtrend line. The RSI also moved above 50 , now at 56%. This trend line break and surge makes me think that the ICL may be in place here too. Let’s step back…
THE SPX WEEKLY has reversed at support and is up 2% already in week 2. Notice that this does look very similar to ICL dips on that 2020 – 2021 bull run. See the Red Arrows & drops to the green line. So at this point, all you have to do is use stops and raise stops along the way, but it looks to be a longer term low.
.
You likely recall that in late 2022 and early 2023, I was calling for the drop into the USD 3 yr cycle low to last all year, and the General Markets to run bullishly higher toward the former highs into the year end, to test the prior highs. Then MAYBE we get a double top & a dip with a short recession, but we’ll just have to look at things when the time comes.
.
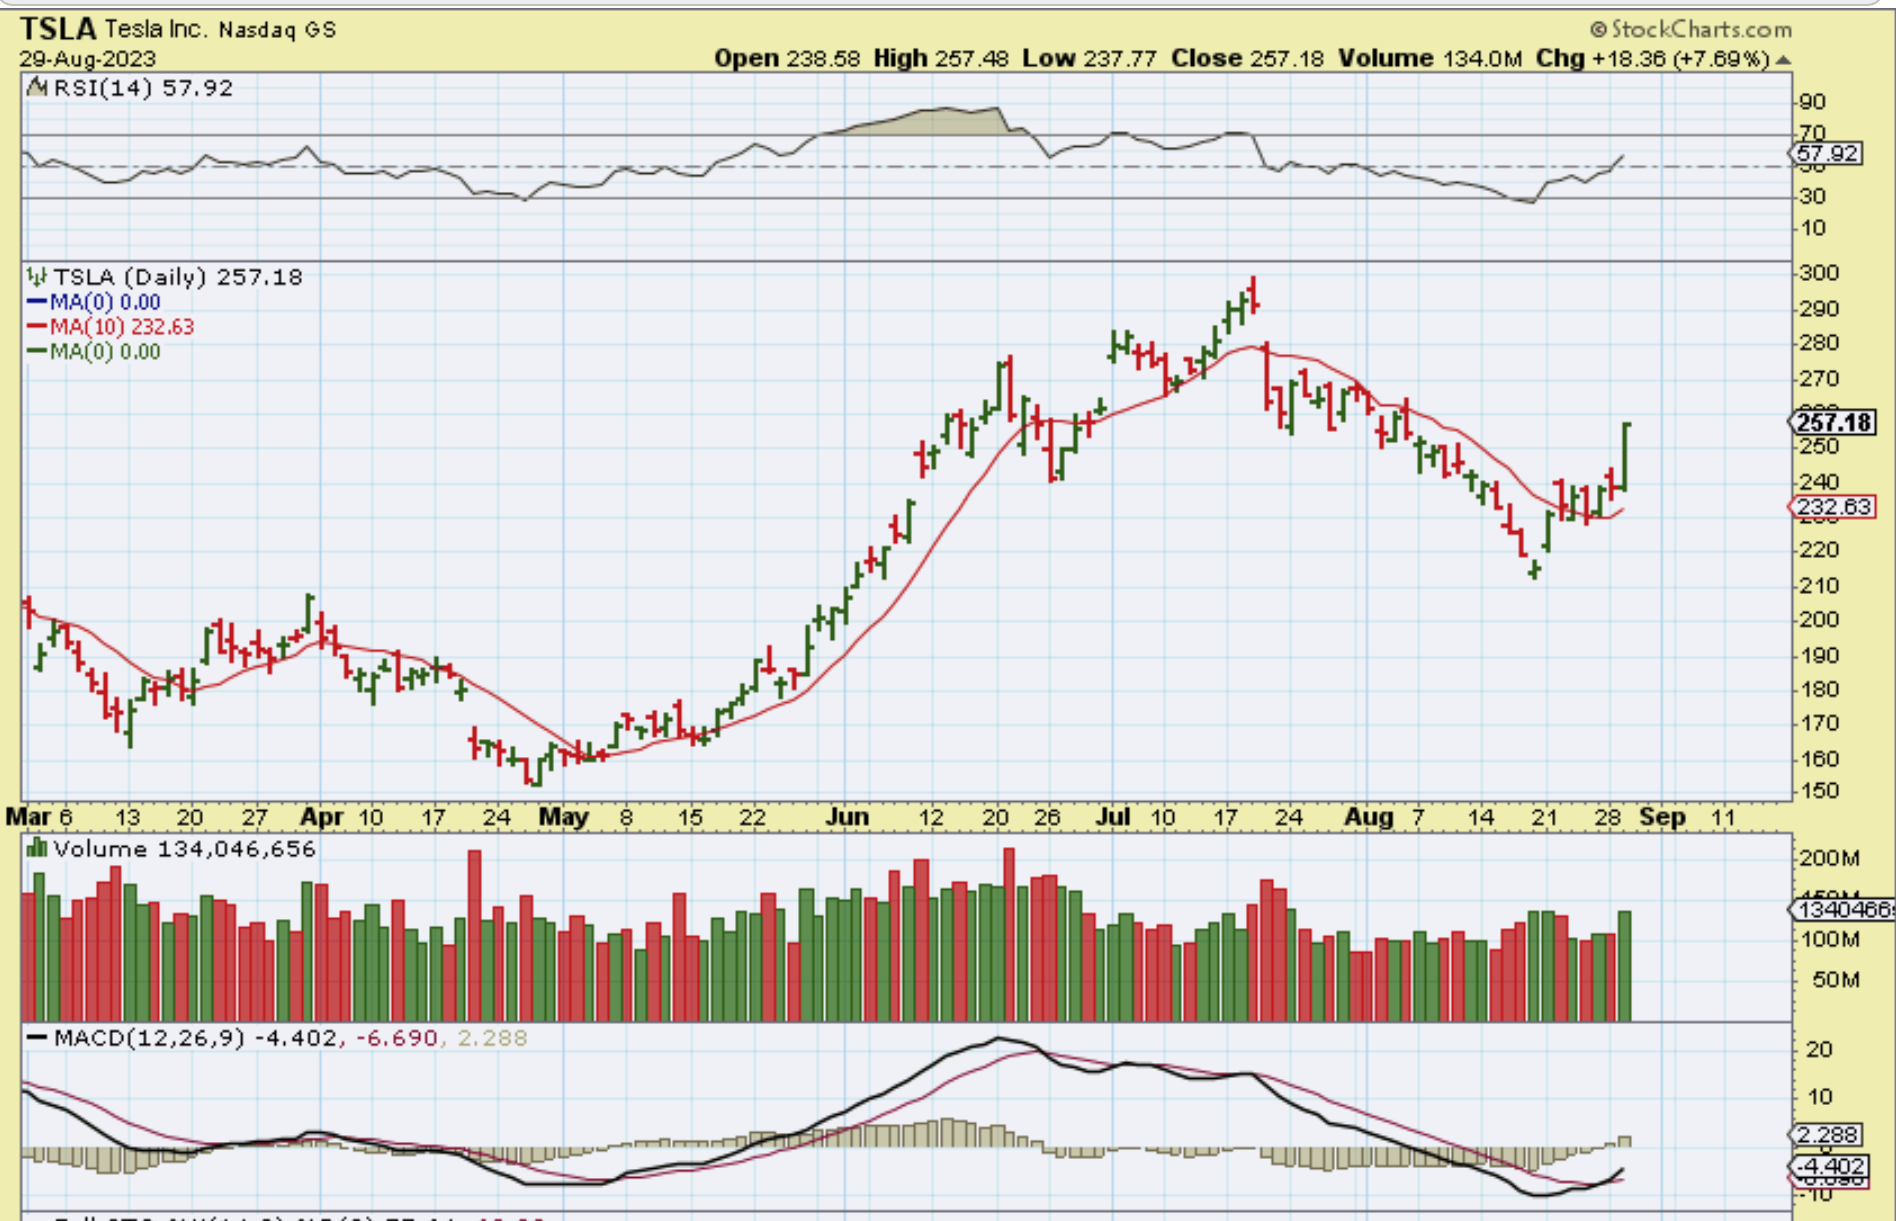
That makes the formerly bullish stocks like TSLA, NVDA, AMD, MU, etc buy candidates.
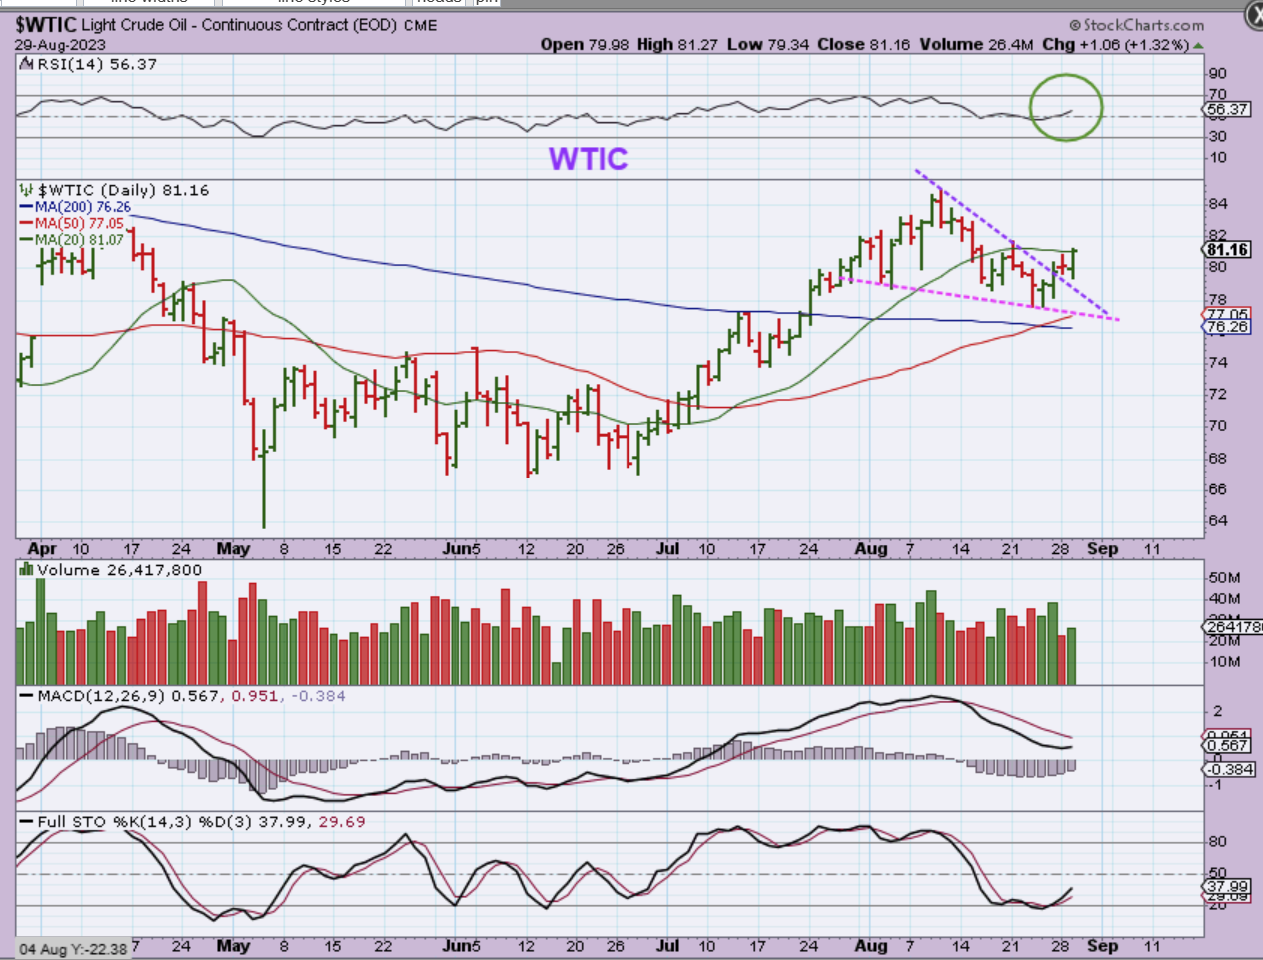
WTIC – Oil broke higher and that dcl seems to have come in above both moving averages. I wouldn’t have expected that, but Oil broke a downtrend and a close above the 50sma is very bullish after a correction.
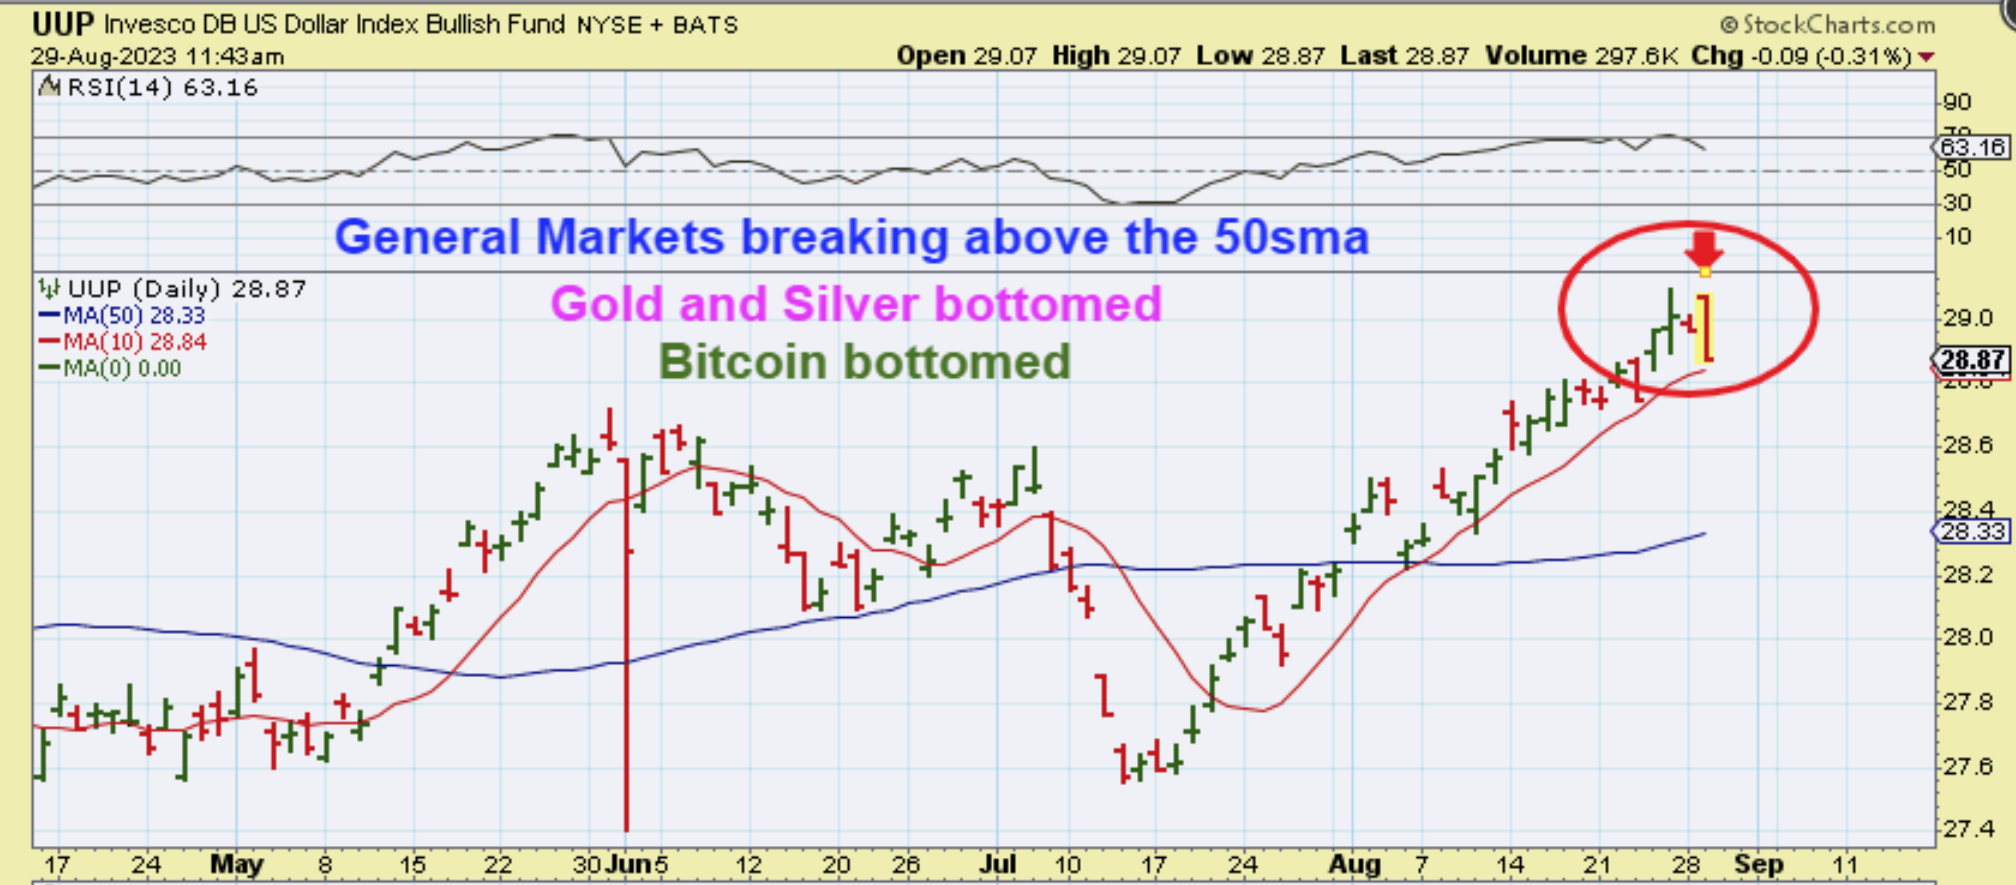
This was The UUP giving us a bearish engulfing on Tuesday morning and this is when things were really ramping up in other sectors.
.
YESTERDAY I WROTE:
.
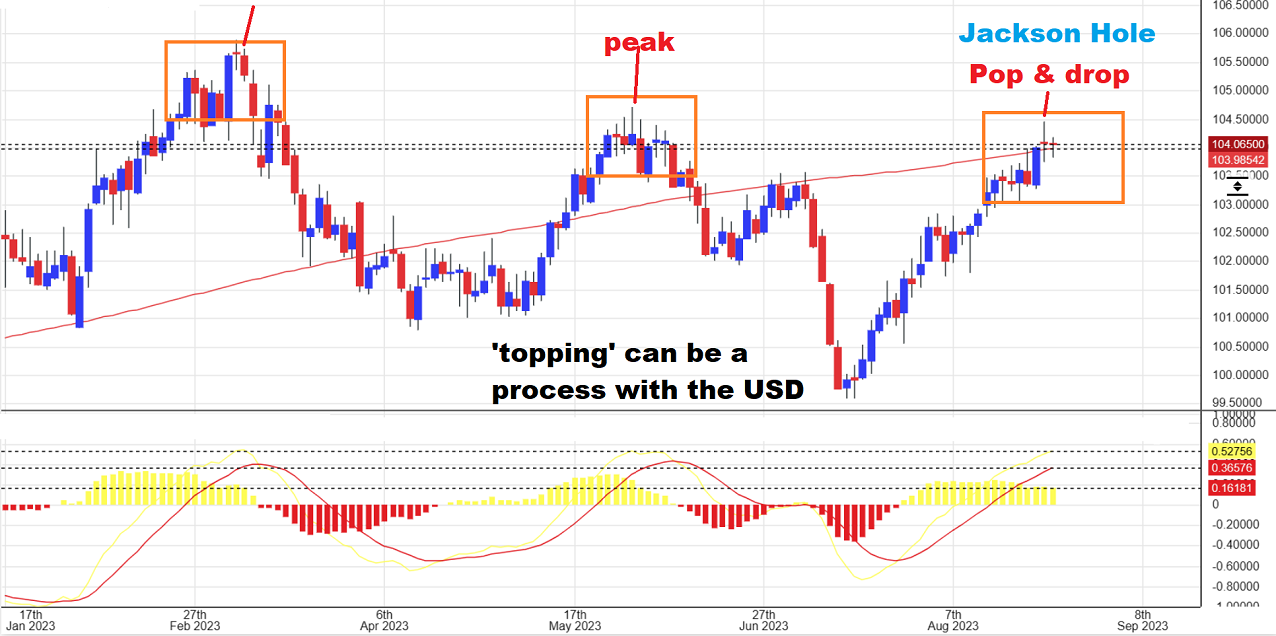
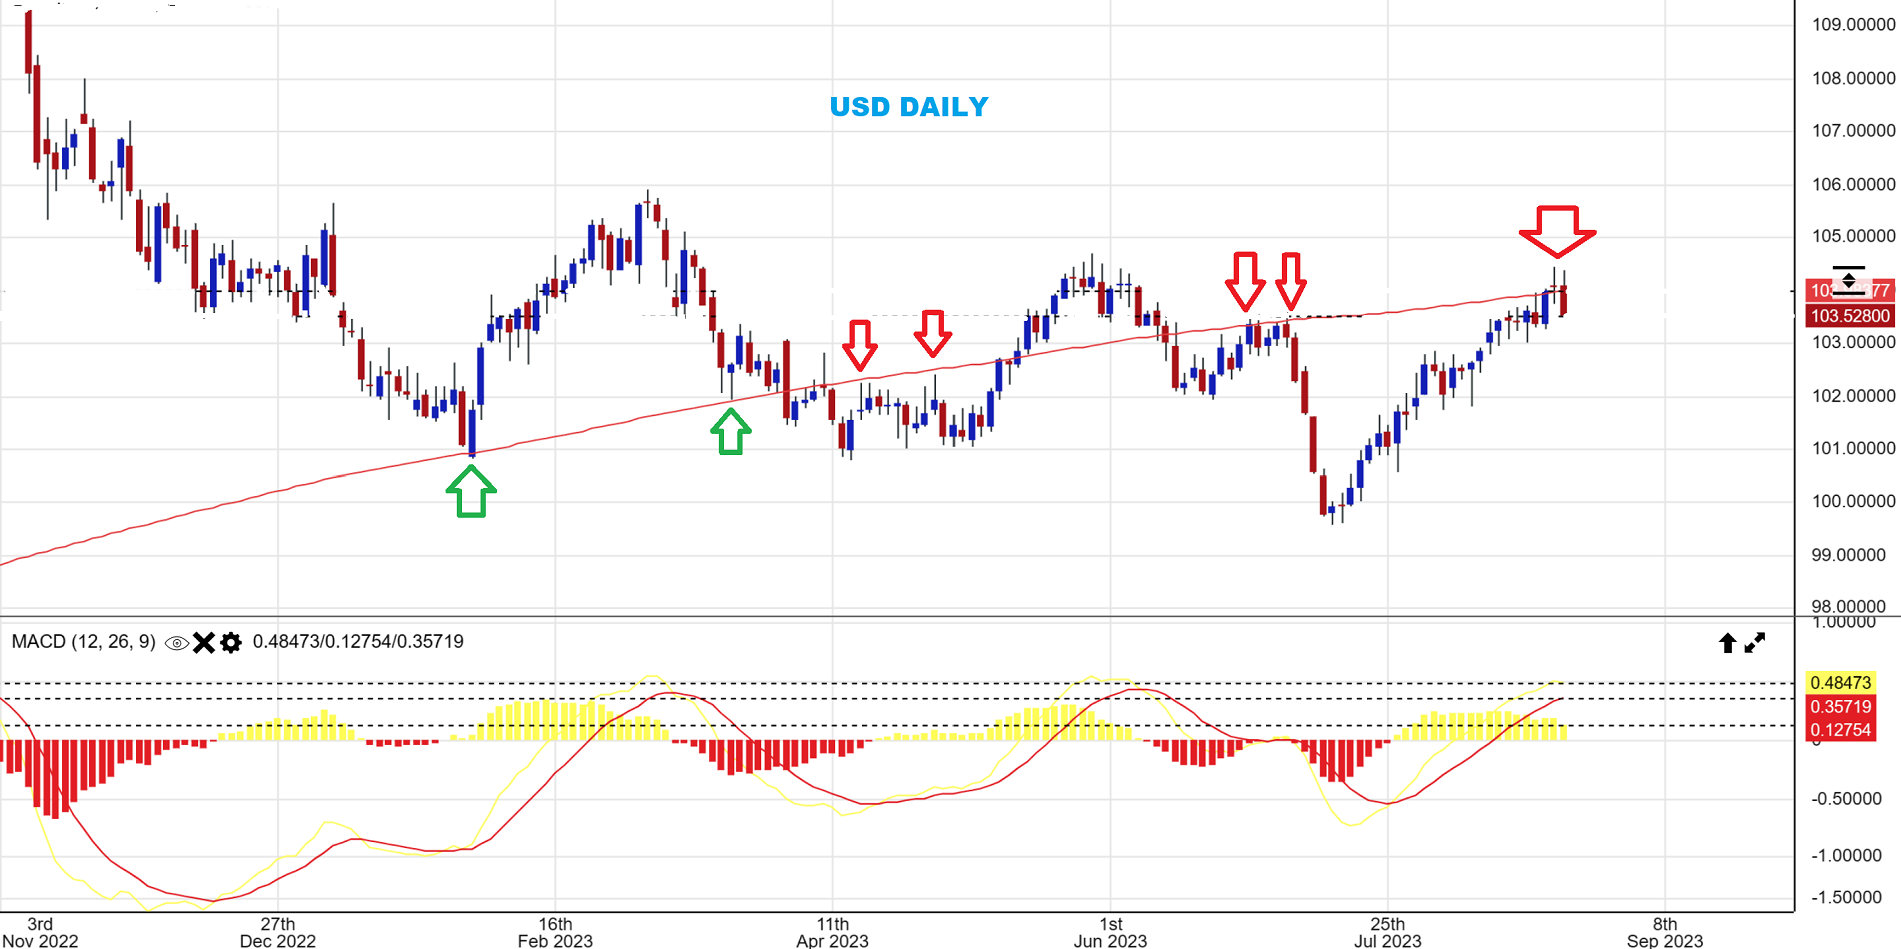
THE USD popped higher Friday with the Jackson Hole speech and then sold off. Take a look at past peaks and you’ll see similar price action. Topping can be a process. As mentioned in recent past reports, The USD is due to dip into a dcl and Gold is due to rise up out of one, so I’m just going to show this topping action.
.
THE USD then dropped on Tuesday.
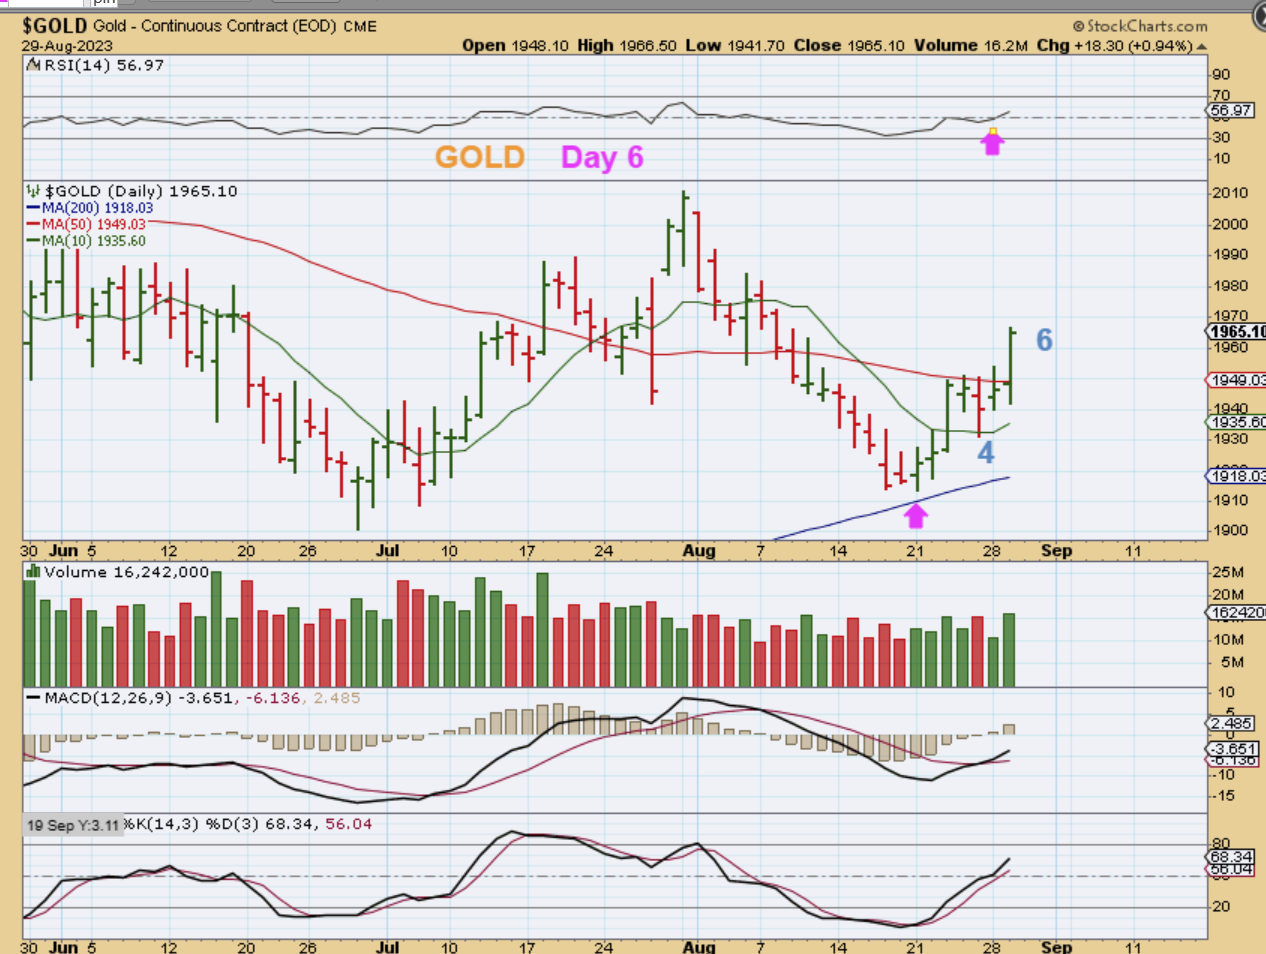
And GOLD really popped nicely here on day 6.
.
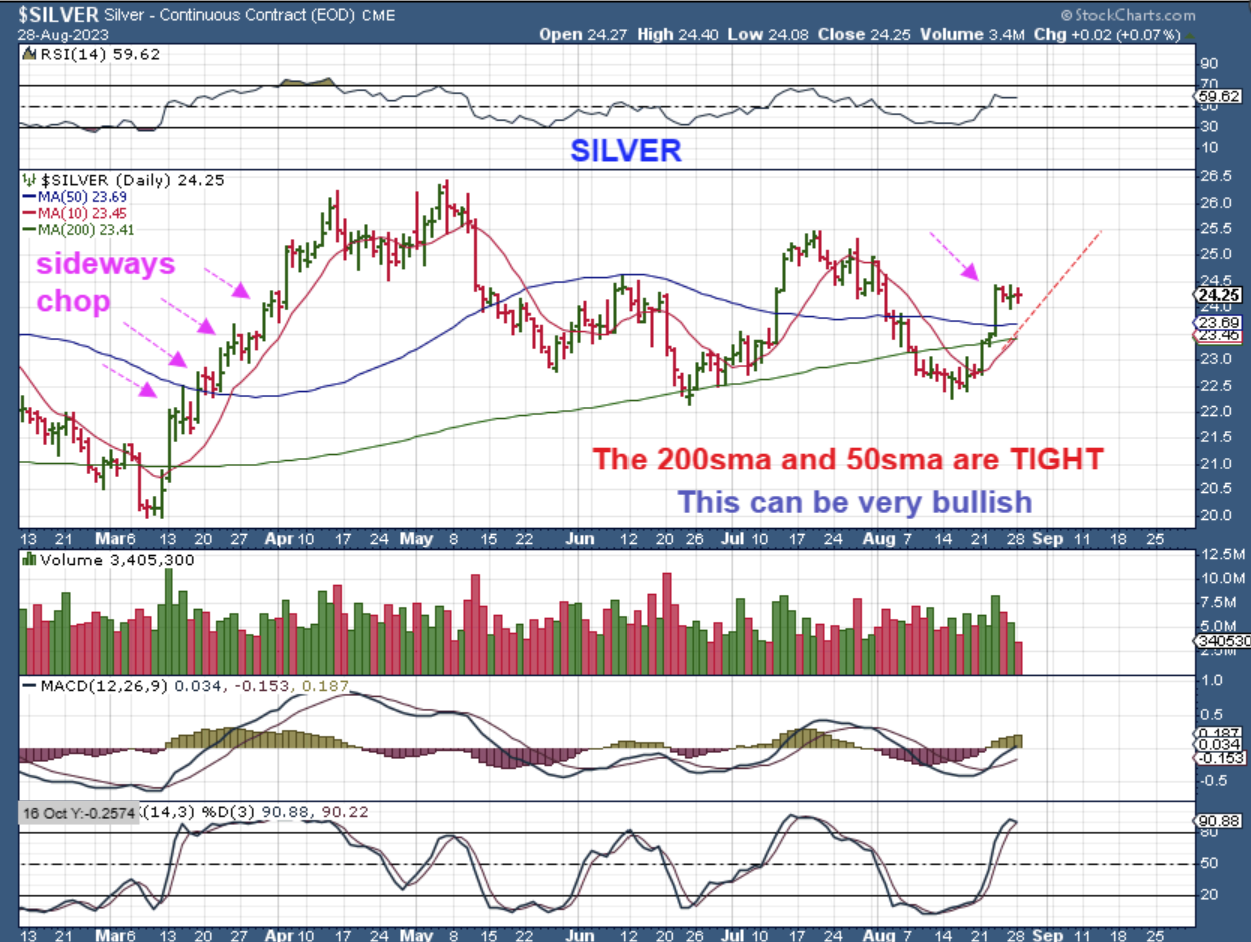
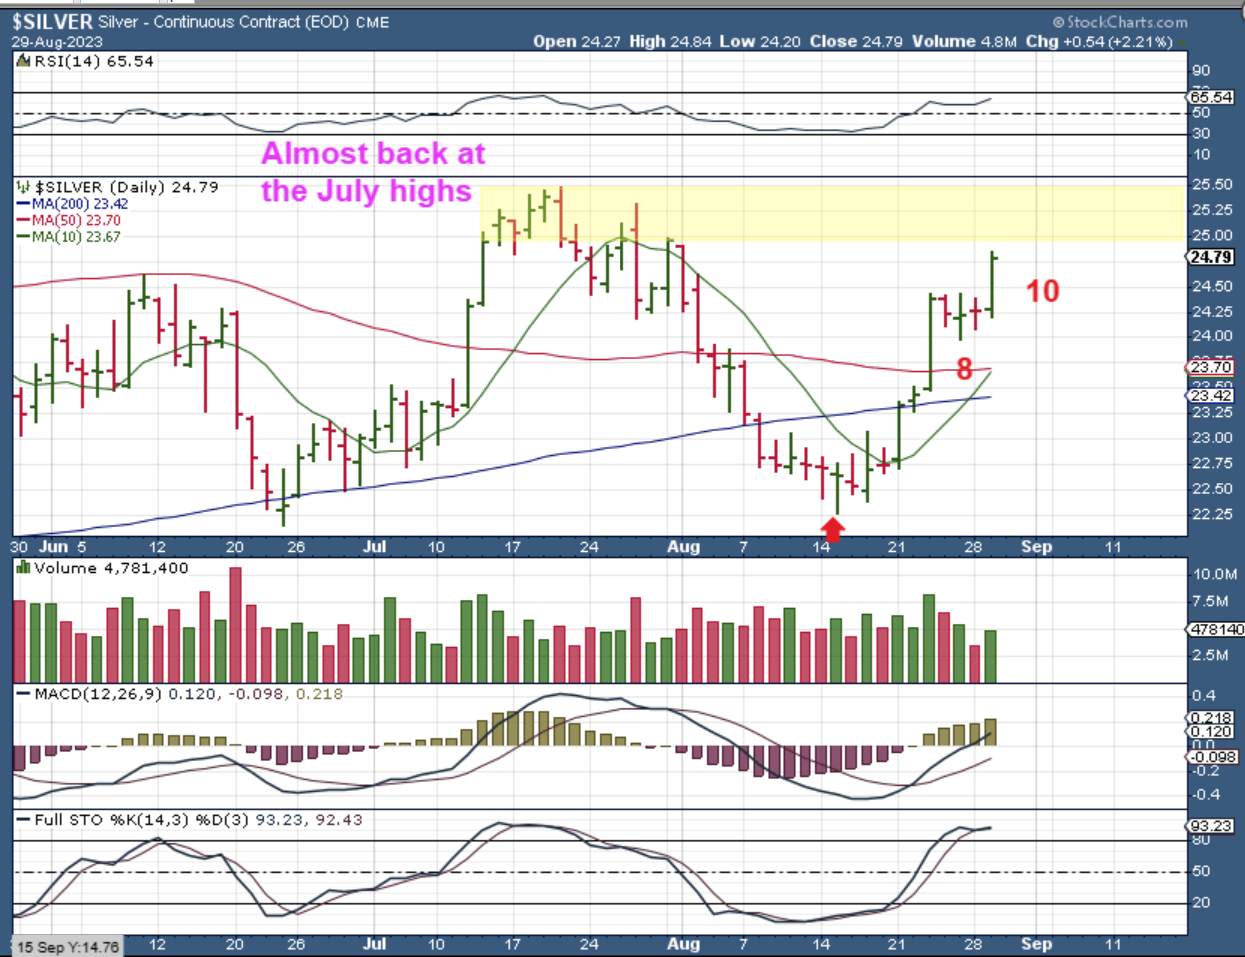
In Tuesdays report I wrote that SILVER is bullishly churning sideways too. Read the chart.
.
I warned that selling the dips or ‘wiggles’ could leave one behind when Gold or Silver Pops!
And so now we see that SILVER has indeed suddenly popped sharply on day 4, day 6, and again yesterday on day 10. I know that Silver was boring and even dipped lower last Friday and this Monday, but the surprise should be to the upside and you want to ‘be in it to win it’, as the saying goes. 🙂
.
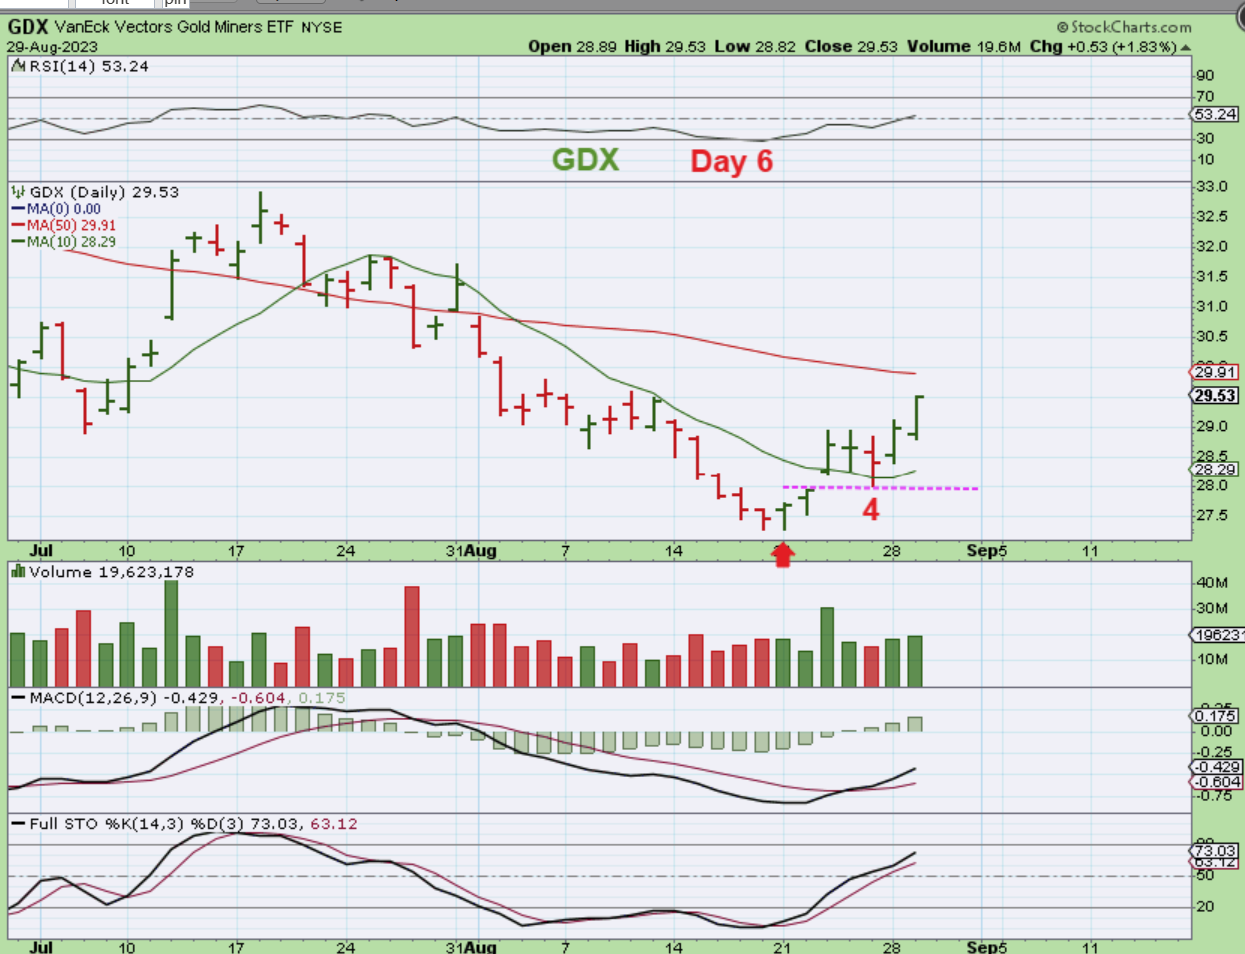
GDX is heading toward the 50sma. Can it break through it without a pause? It can, and I say that for 2 reasons. 1. Some Miners are already doing that with ease. 2. GDXJ already did it. I’ll show you that shortly, but for now GDX is a bullish chart and Fridays dip that may have caused people to sell their miners is becoming more and more hard to see as time goes on.
.
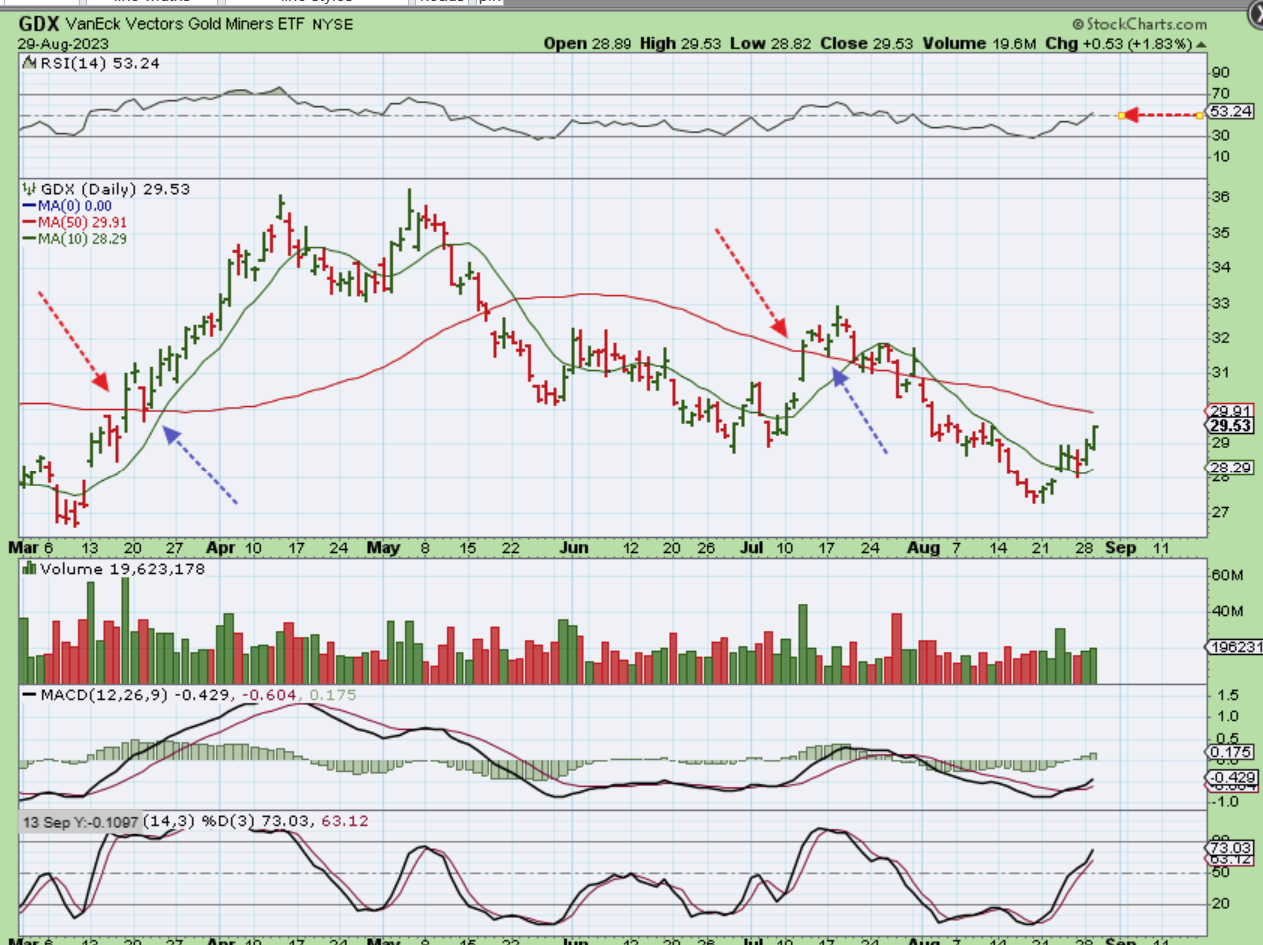
When we Step back using this chart, you can examine prior moves toward the 50sma.
The GDX was able to break through, do a back test, and then continue higher. This helps us to see that some kind of a pause around the 50sma could take place, and it may be above or below the 50 and it really should be brief.
.
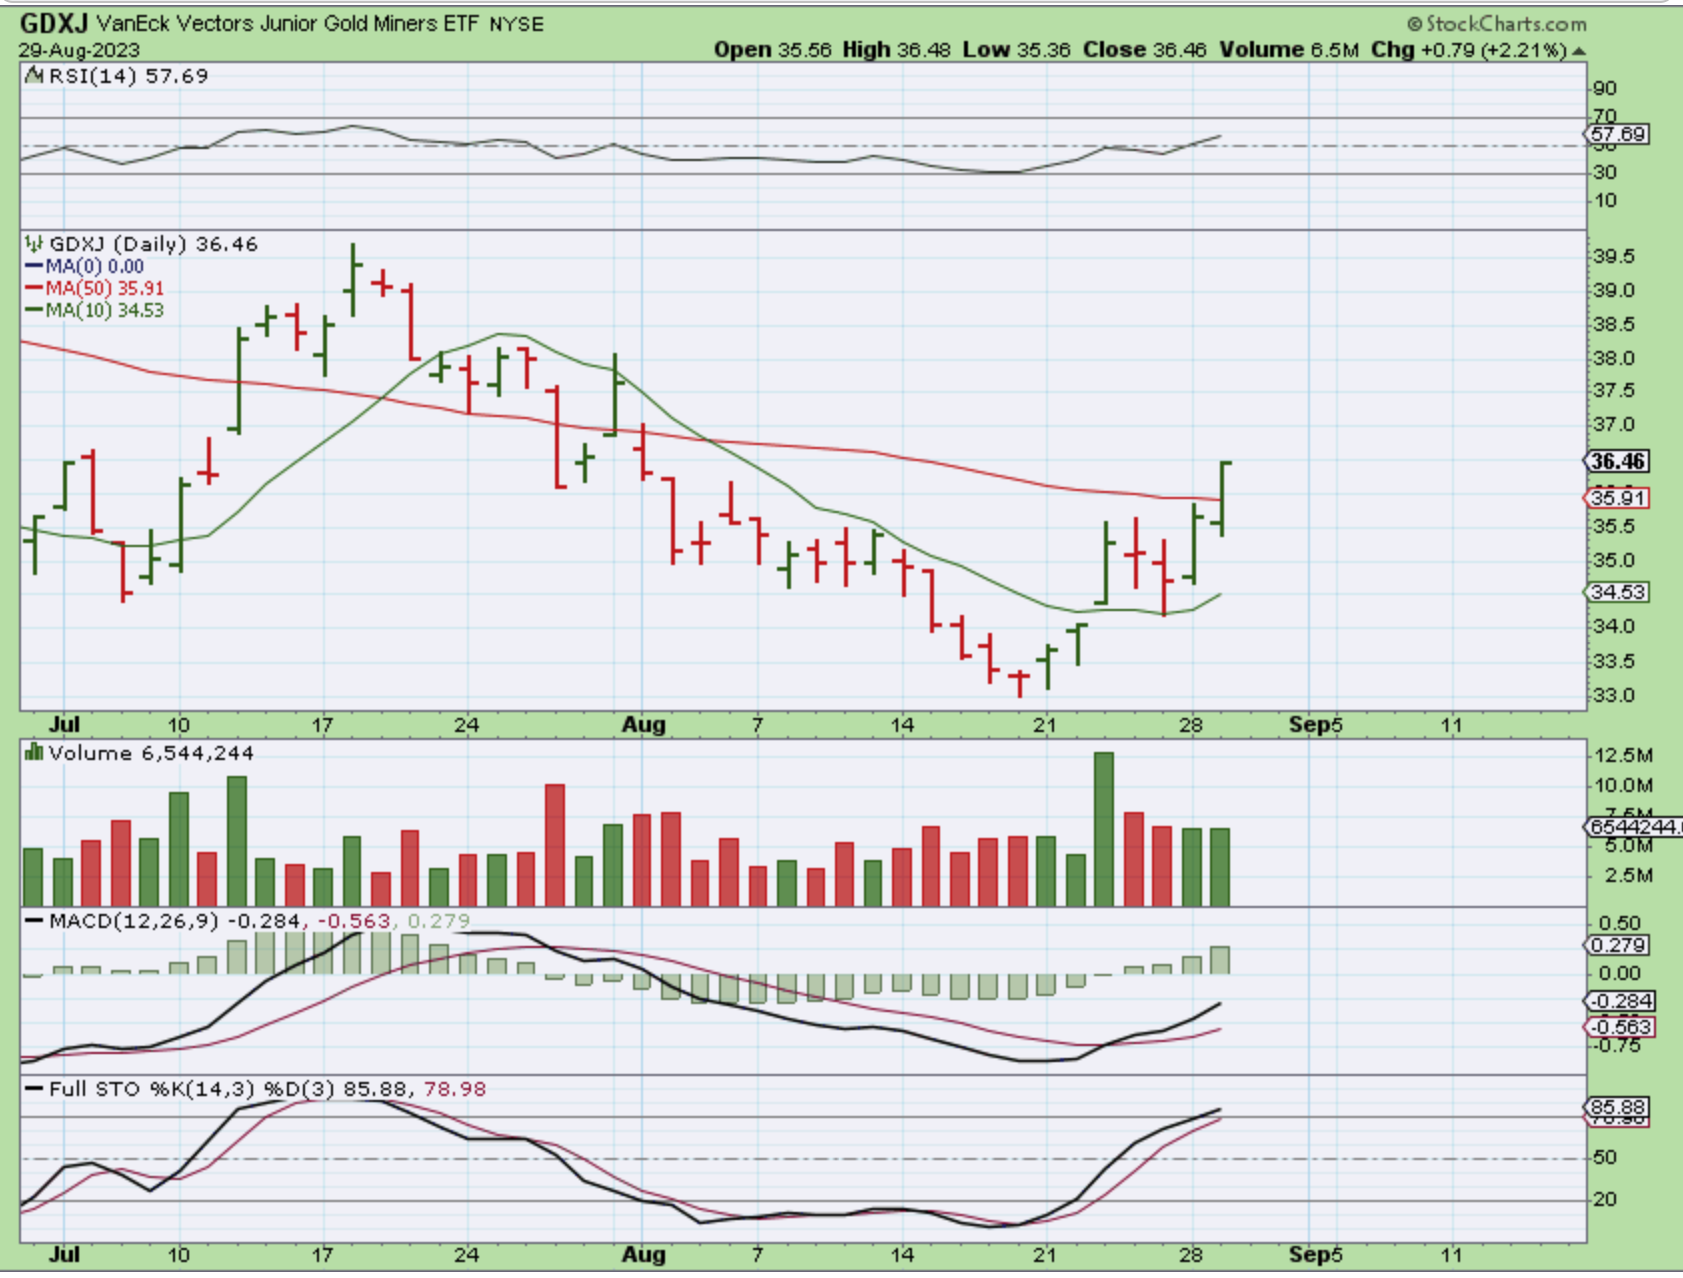
The Juniors seem to be leading, with The GDXJ easily breaking above its’ 50sma yesterday. Friday was a simple bounce off of the 10sma, that is why we use charts. The sell down Friday seemed to be a bad ‘Jackson Hole’ sell off, but it was a gap fill for many miners and only lasted intraday.
.
I will admit this: I would have expected SILJ and Silver stocks to be doing MUCH better right now, when I look at that Silver chart. That was a little concerning to me in the back of my mind, but all you can do is observe how this plays out and see if buyers flood in and push Silver Miners quickly higher. It was encouraging to see SILJ cut through the 50sma this easily yesterday. Maybe we are now on our way to…
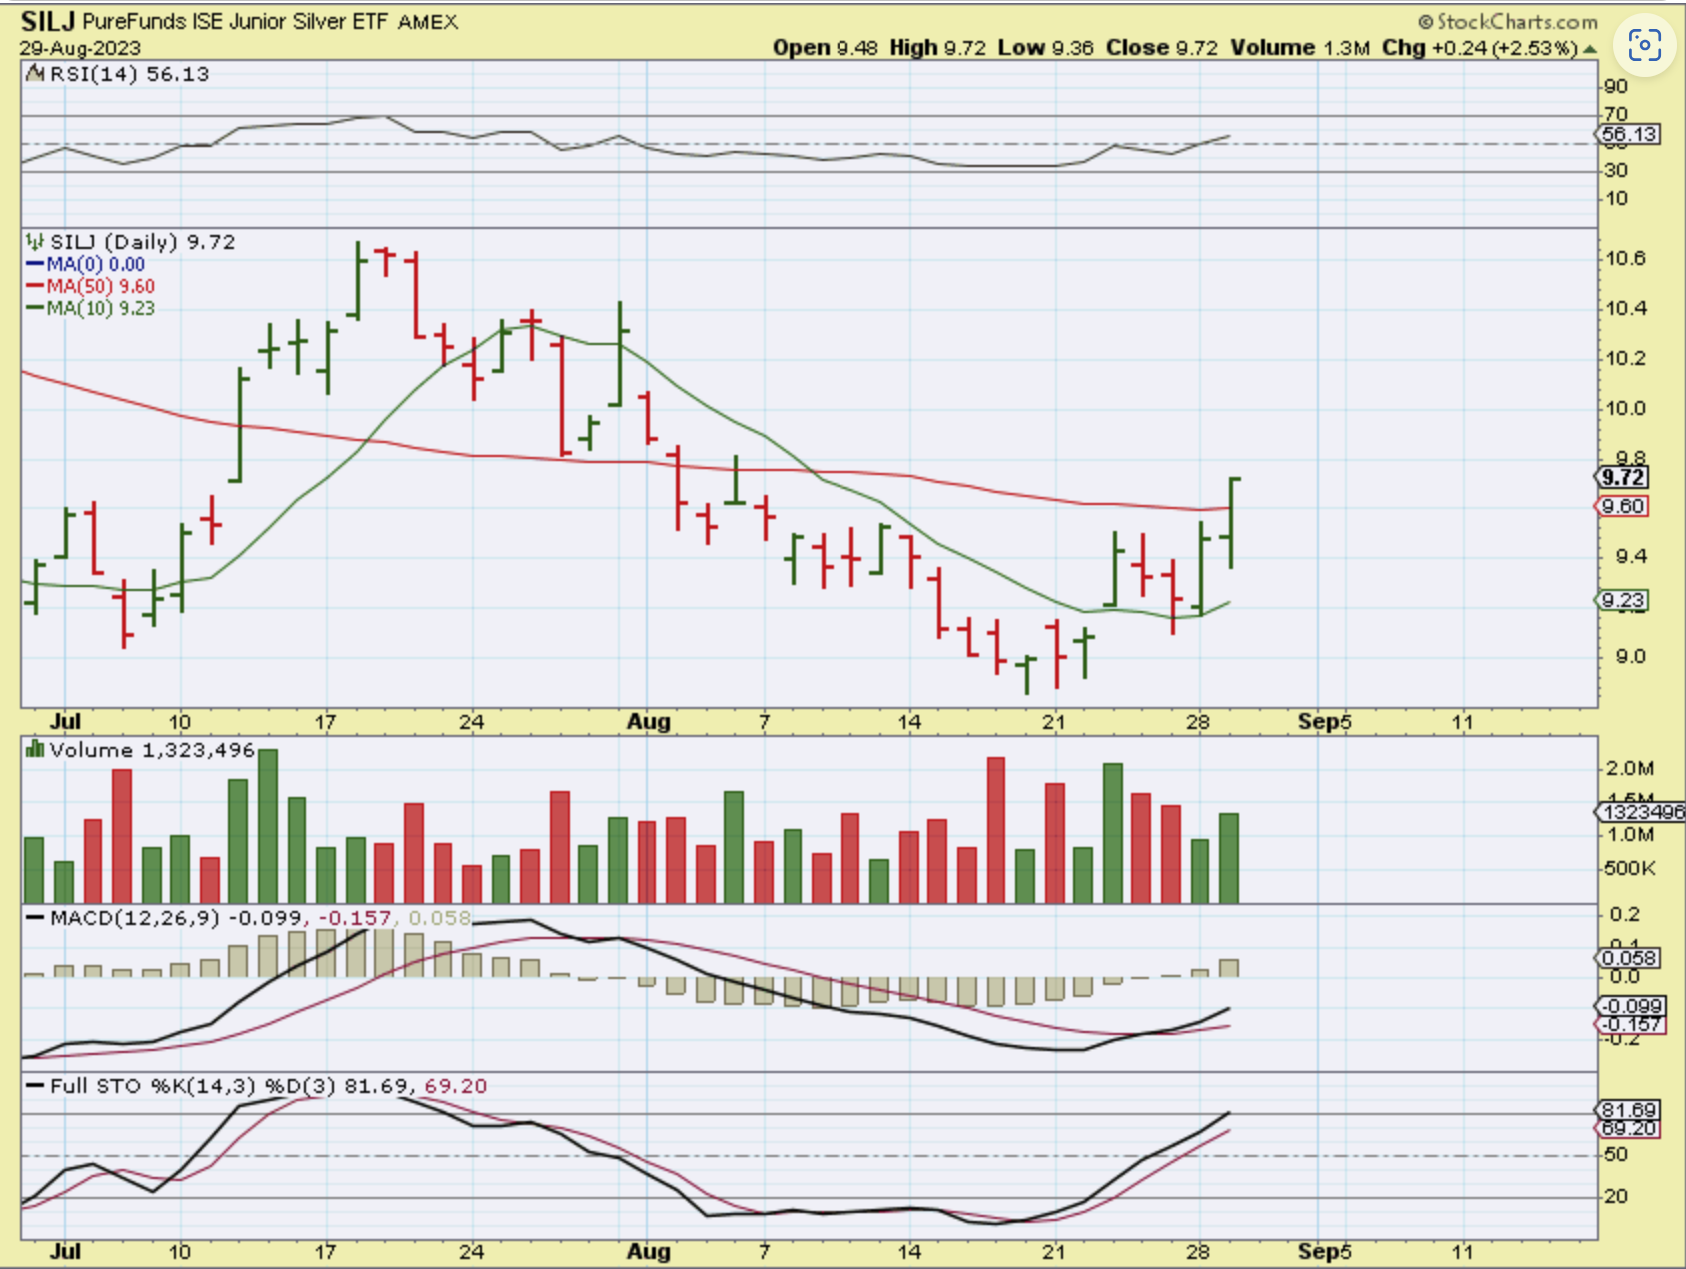
.
Maybe we are now on our way to seeing some “Up 7-9% days” in these Silver stocks? I do hope so. Let’s just discuss a few Silver Miners, and examine the potential.
.
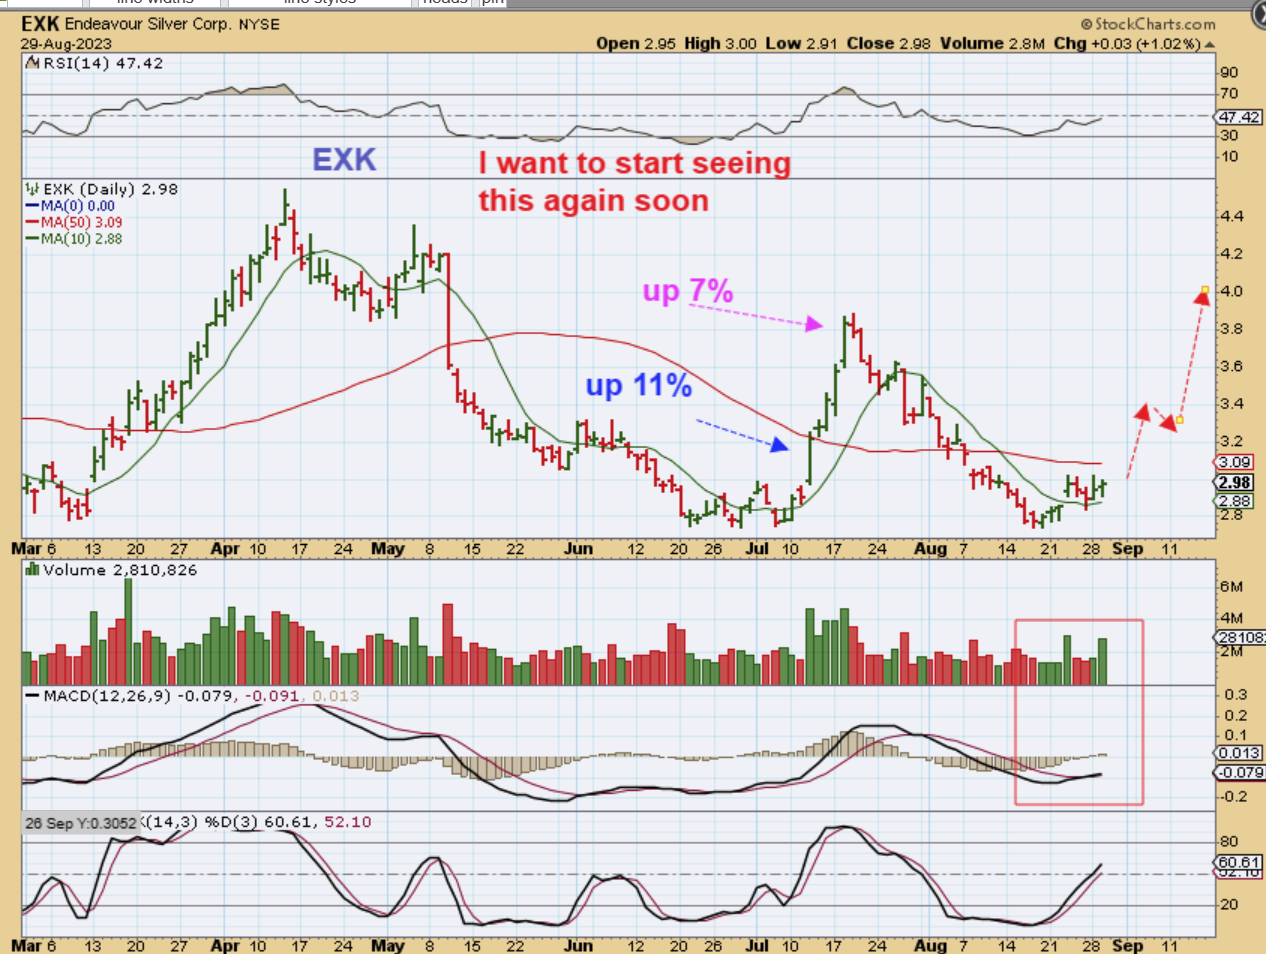
EXK: This is what I am talking about when I discuss laggards in the Silver sector. Go back up to the SILVER chart and see how it moved last week and this week. With that, EXK should honestly have a couple of 7-10% days in place. We may see that take place soon (if not, I’ll become concerned a bit).
.
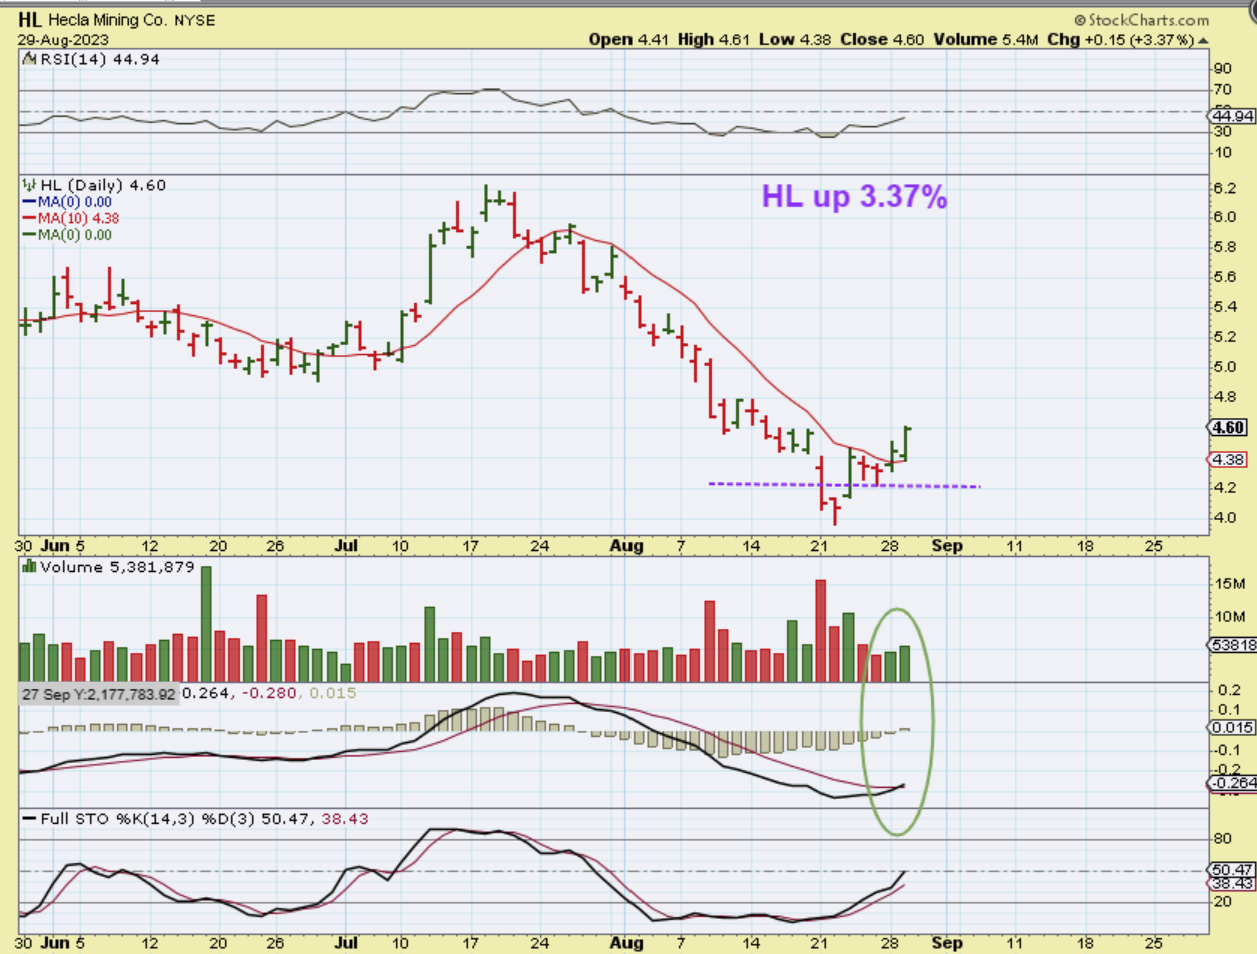
HL- Hecla is starting to pop and was up 3.37% yesterday. If I own a lagger, sometimes I’ll do this as the week goes on:
This was up on Monday over 3% Monday and up over 3% again on Tuesday. If it were to do that Wednesday, Thursday, and Friday, Heclas’ weekly chart would be ‘Up over 15% for the week’. That would be bullish. If it continues to chop and is only up 3% by Fridays close? I might sell it or cut my position size and go elsewhere.
.
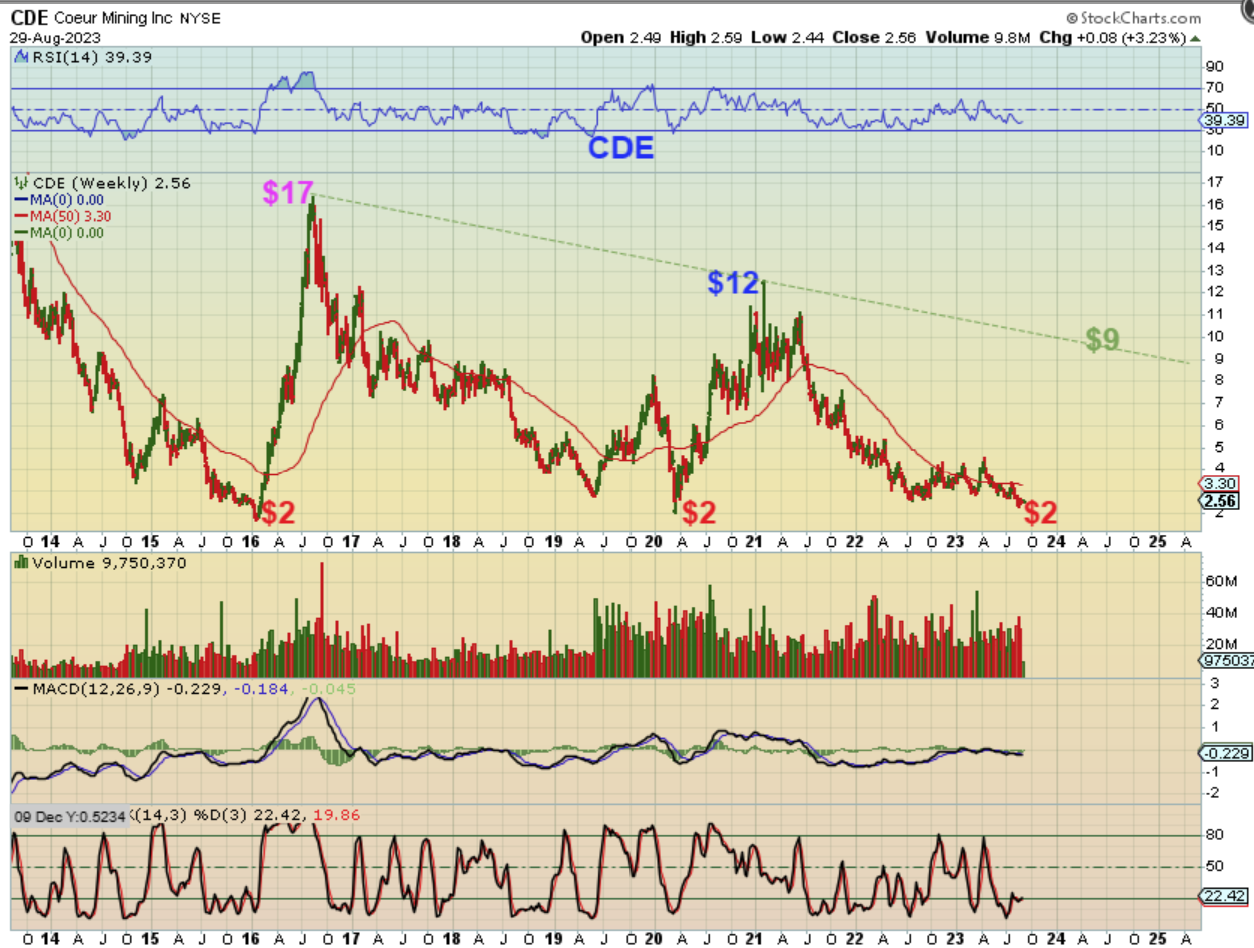
CDE: This is also not following Silvers blast higher (yet), but it did break the downtrend, it did hold at the 10sma, and it does have a bullish AMCD and decent volume. So we’ll see what it does for the rest of this week. IF Gold is going for ‘all-time highs’ and Silver rips higher too, these would have to follow. Now let me show you something about that…
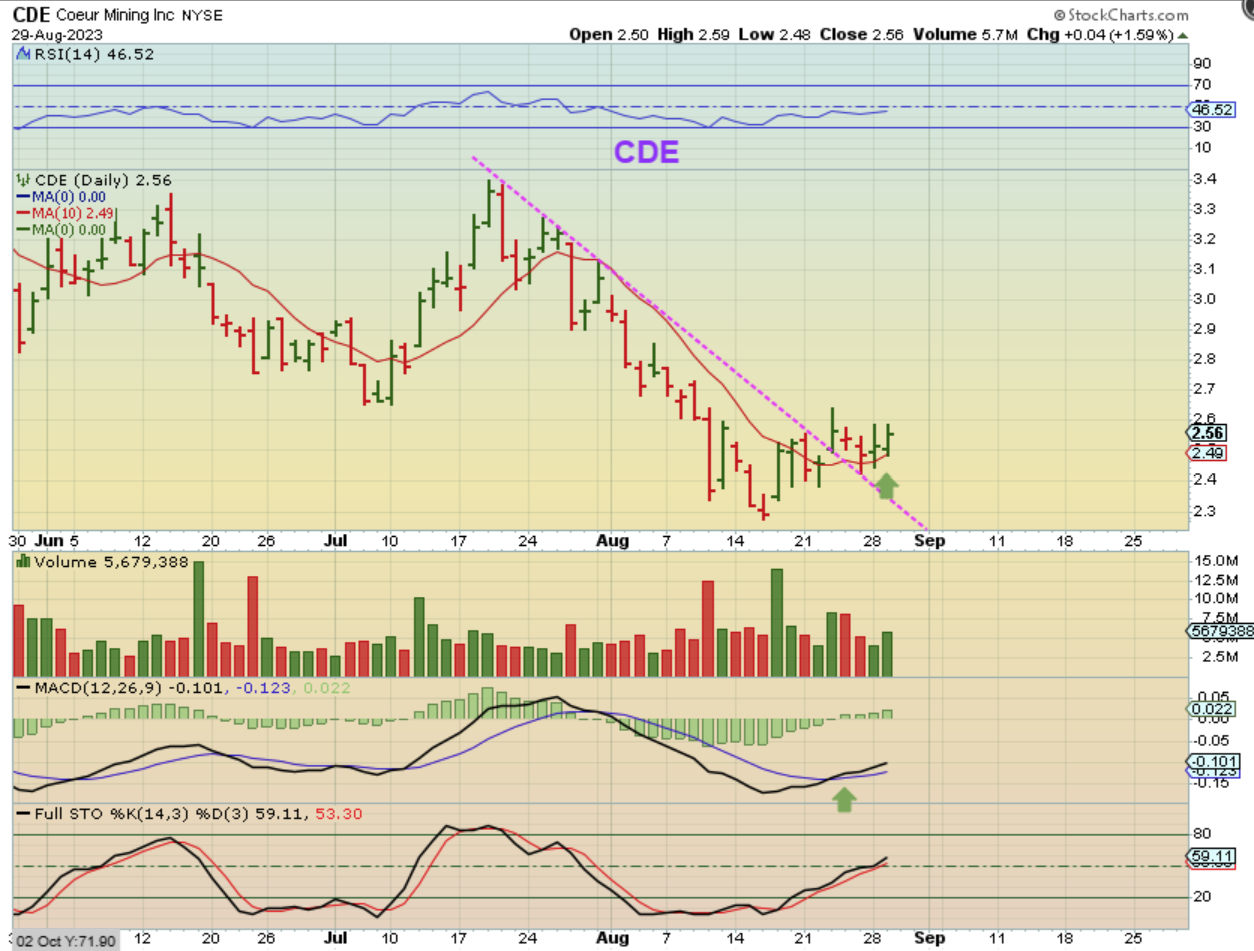
CDE: This shows how ugly and weak CDE always looks at $2.
– In 2016 it chopped down to $2, almost exactly as it has right now.
– In 2020, it crashed down to $2 and looked broken.
– Both times, it doubled and tripled and more, so I’ll give these a little time and we might have a great surprise to the upside once the Buyers start to flood in. That 2016 move was relentless buying, and we could see that again if Silver continues to perform well and breaks out.
.
With the USD dropping lower yesterday, everything caught fire. Even Bitcoin Popped and the crypto stocks started to climb up in a big way, the way they often do once they catch fire. Gold & Silver Miners pushed higher, but I admit, it was a bit disappointing to see most of them only move up 2or 3%, with an occasional 5-8% here and there. Gold and Silver look very good, and you saw that GDX is pushing the 50sma area, GDXJ & SILJ already broke through that area, so we’ll give it more time and see if this sector starts to put in the kind of days that we’d expect it to.
.
Overall, this is a great start to the week with all of the bulls running in the street. I have mainly been focused on the precious metals sector and the buying opportunities are starting to pay off, but with the General Markets now breaking above the 50sma with strength, it could be that we have very good buy opportunities there too. And what about Bitcoin? We saw it put in a post 60 day dcl, but the action was choppy sideways and crypto stocks got cut in half. Are they ready for a solid run? It could be, so I may have to start adding a little of everything to the reports on the dips. Yesterday was a very bullish day in many sectors! Enjoy your Wednesday trading.
.
~ALEX
.
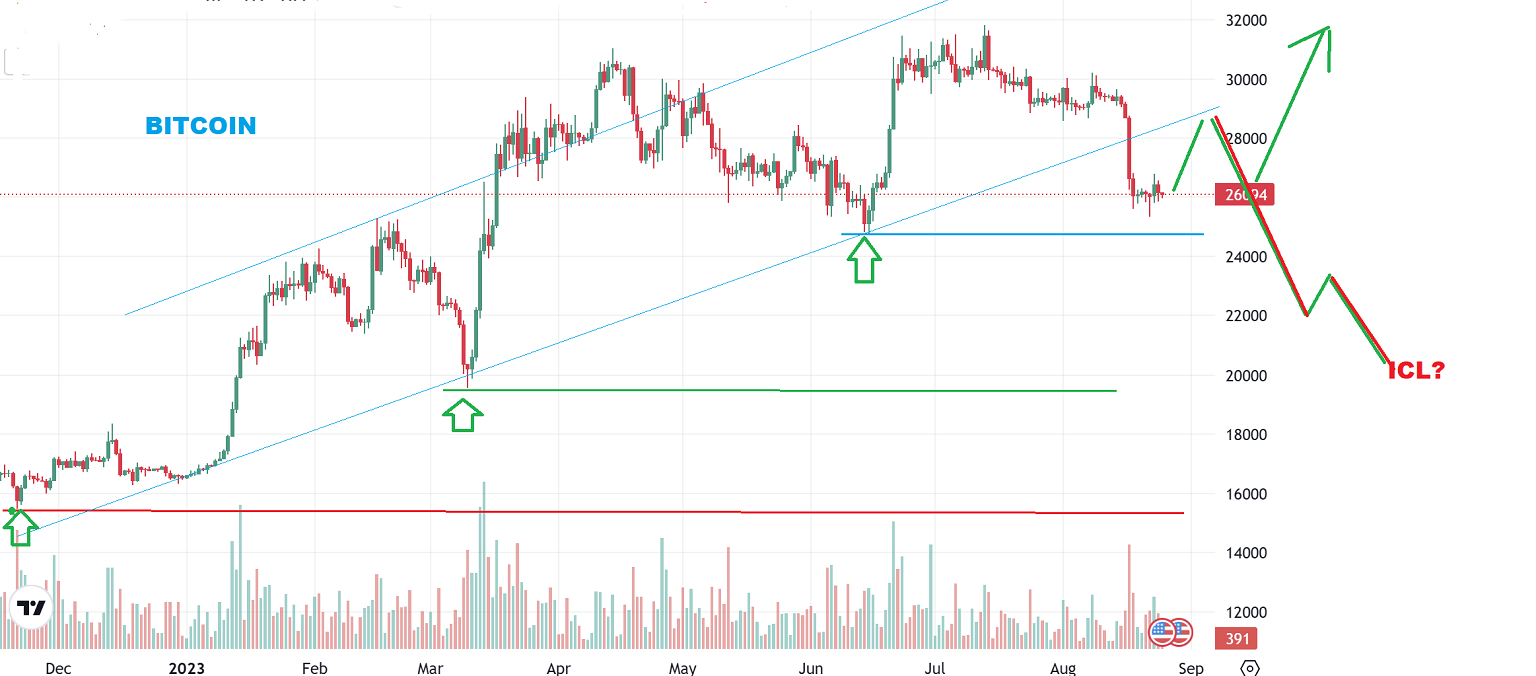
BITCOIN crashed 2 weeks ago and that did not look good. It broke an uptrend and I posted that uptrend with this chart. We still had a ‘higher low’, and with a dcl due around day 60+, this could push higher, but I was not very confident in that with this charts set up.
This recent sell off crushed MARA, RIOT, HUT, WULF, CIFR, etc. In just 1 month RIOT & MARA fell from $20 to $10, so who knows where the bottom would come in? It was risky.
.
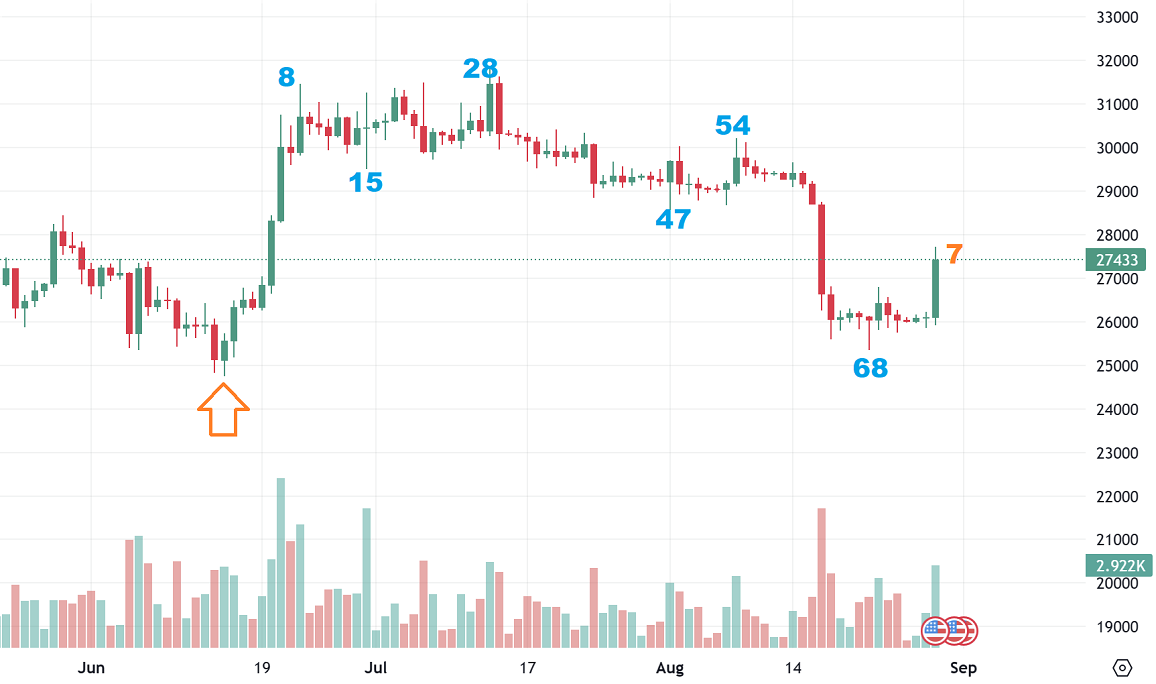
Bitcoin put in a POP on what is now showing up to be day 7 after that final dip on day 68. The Crypto Stocks acted like absolute rockets, with some gaining 10-15%, others gaining 20-30%. How do you play that? They can dip 14% and be perfectly fine, but they could also just keep running away as a lock out move. This is a tough one, but we’ll look at RIOT…
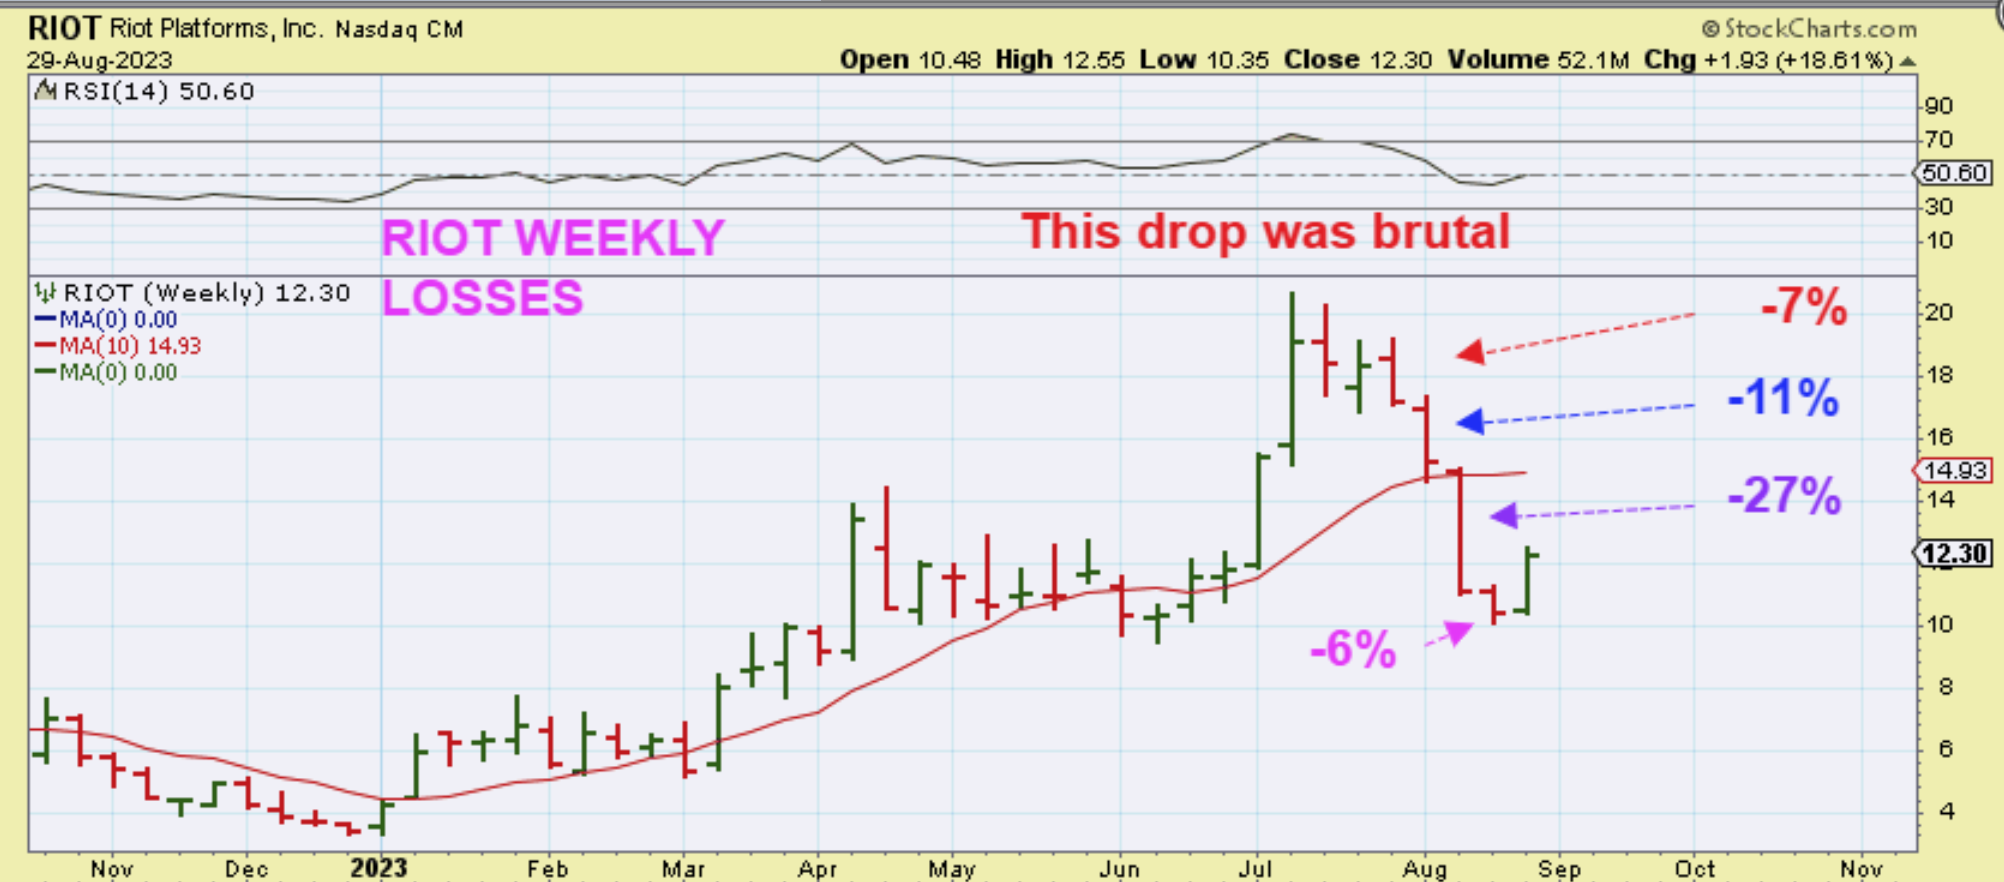
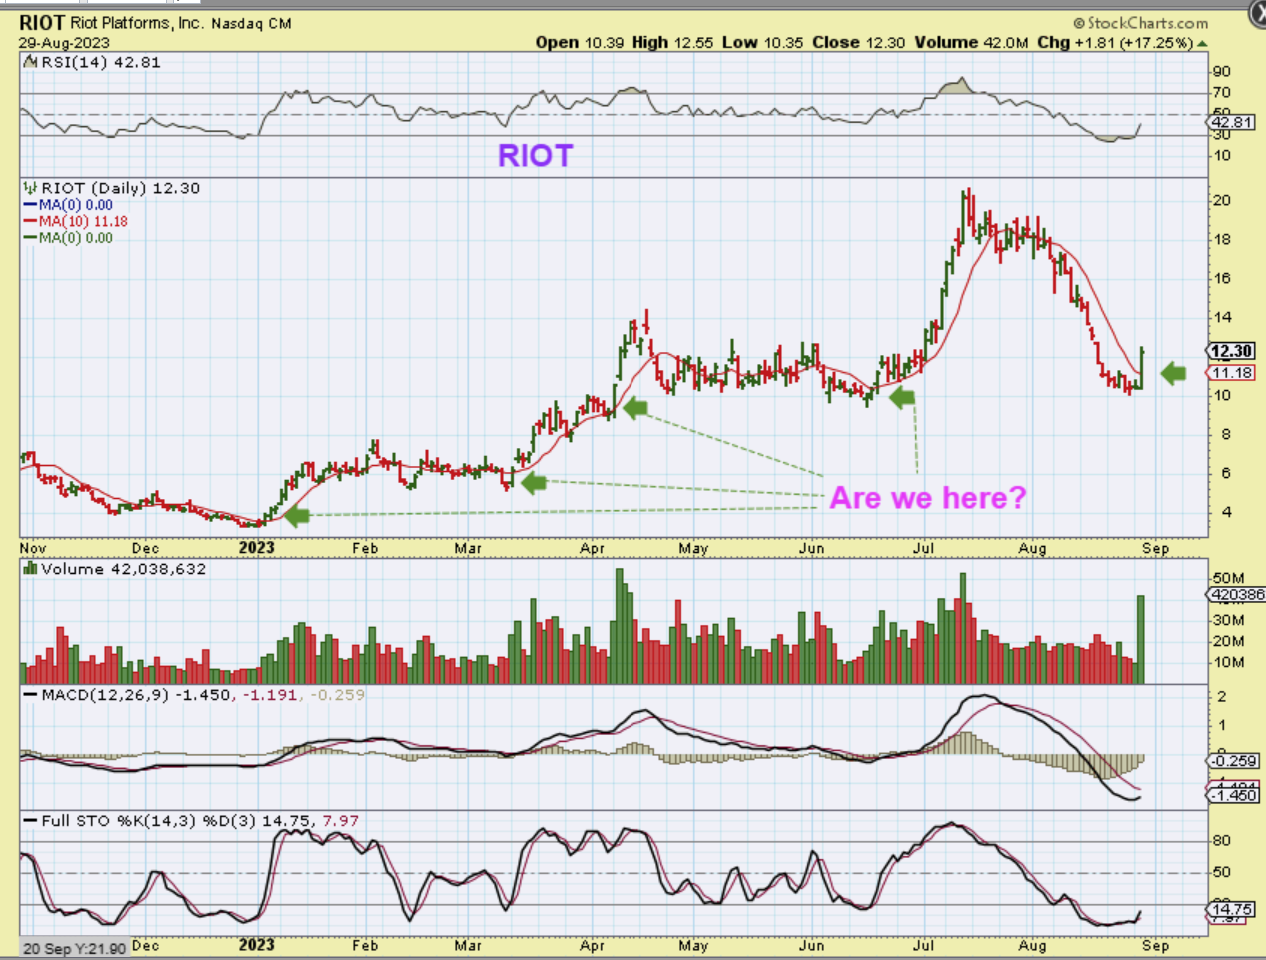
RIOT WEEKLY: What can I say? Yes, it surged up 18% yesterday, but Riot was down 0ver 50% in 4 week drop of sheer terror and pain. This dropped from above $20 to $10! Now we’ll look at the daily chart…
.
This crash was extremely painful for anyone trying to buy or hold.
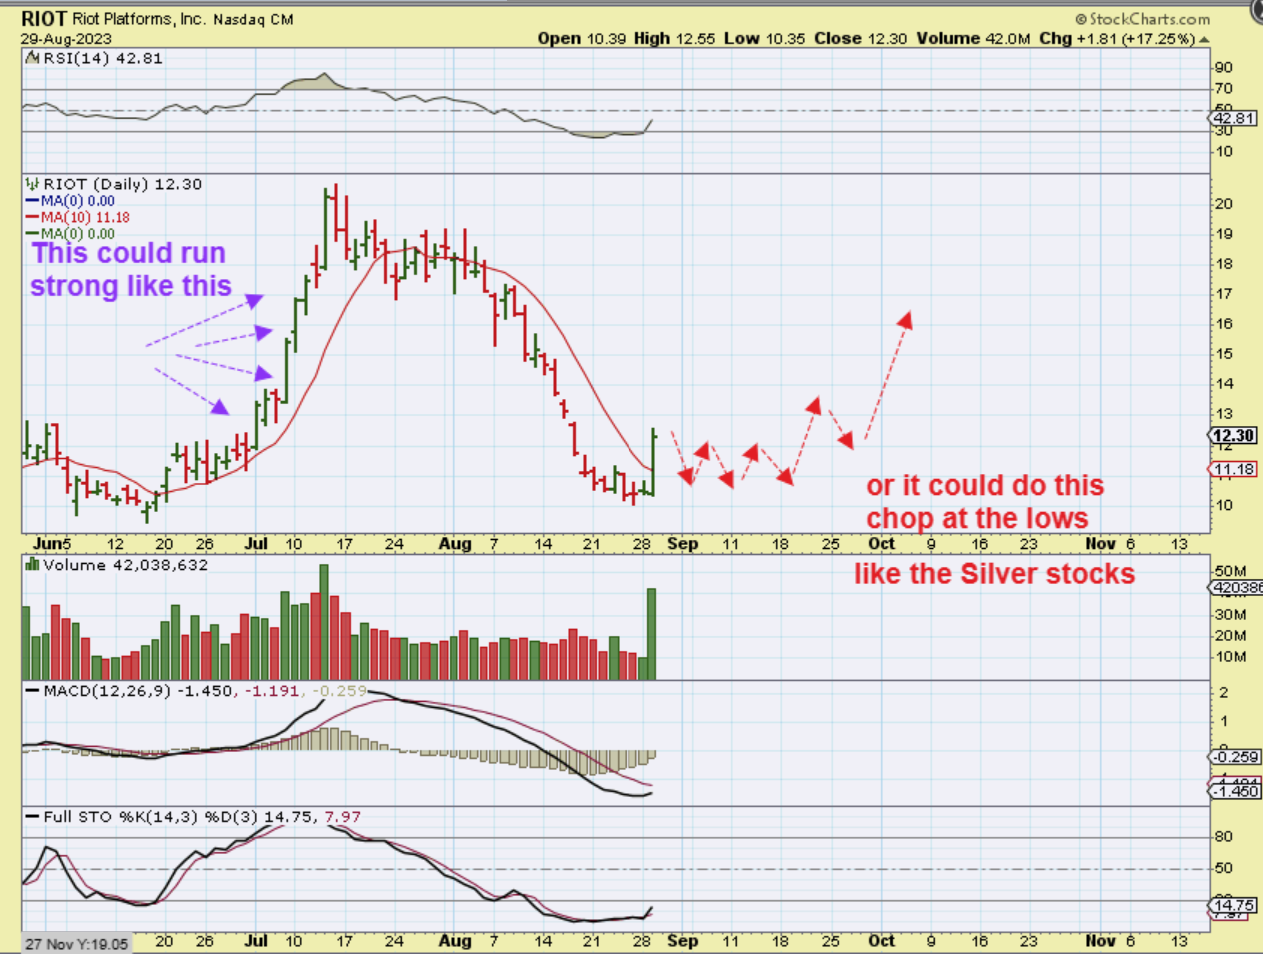
With that trend line break on Bitcoin, are we now at an ICL low with this dcl? That may have been an ICL drop. Is this going to be the start of the next big run? It very well could be, but this could also be a very volatile run too. If you want to buy & try to get some upside, you can wait for a dip to be safe, but there is still risk involved when we try to examine things from the perspective of a 1 day 20% pop. Start small with a buy and hold? Add on the way up? That could be a possibility. Why am I a bit cautious?
.
Why am I initially so cautious?
Simply because even though we could be at an ICL, we could drop for a few days too. Yes, this 1 day pop out of the lows can certainly become 5 straight days higher with short covering, but it also can chop at the lows first. So picture Riot doing what EXK & HL are doing now after their sell off. These chops can be large in crypto too. So if you bought at the end of yesterday, you could see a dip from $12.30 to under $11 again. Price in June at the lows spent 2 weeks sideways at the 10sma.
So as long as you the buyer understand the risks (& possible rewards of a strong short covering run), you can…
1. Control position size to avoid pain on dips and
2. Add on dips if and when they come along
.

