August 27th Weekend Report
THE NASDAQ was rejected at the 50sma on Thursday, day 4, and then on Friday, day 5 it regained the 10sma.
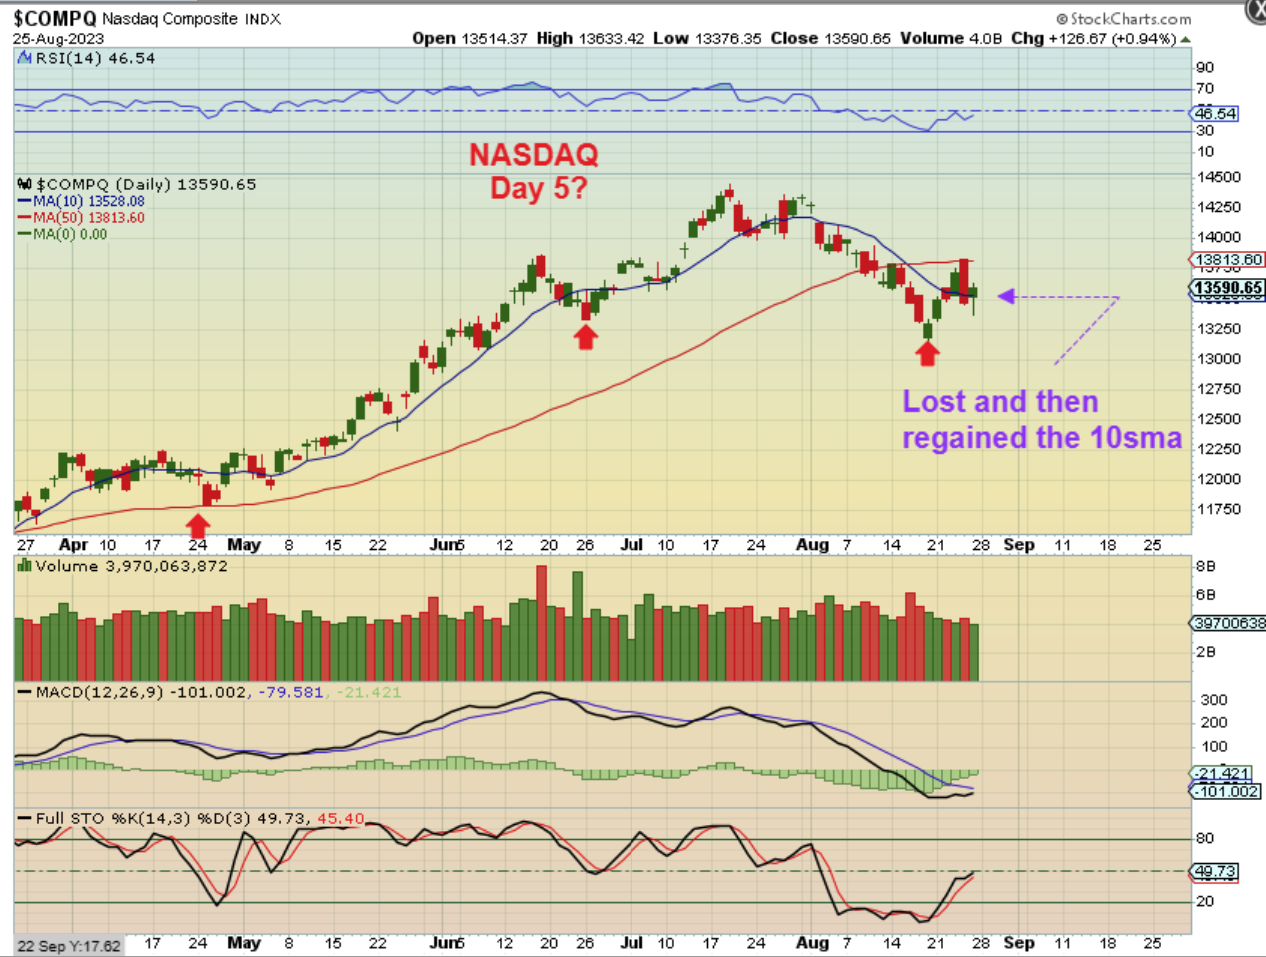
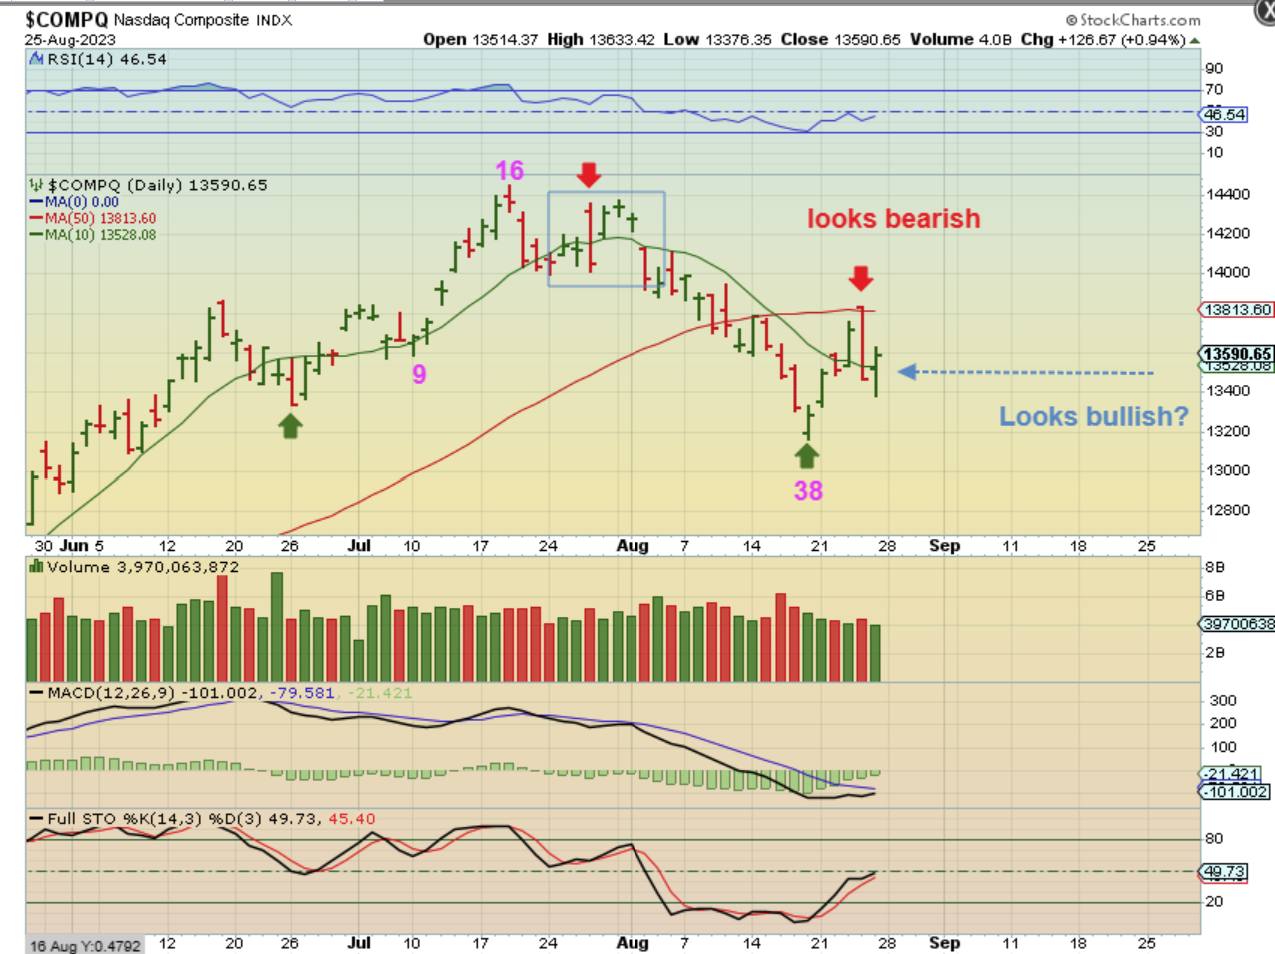
NASDAQ DAILY – Day 38 is long enough to give us a dcl in the general markets and now we have to wait and see if this can break out above the 50sma next week or not. For a while now…
.
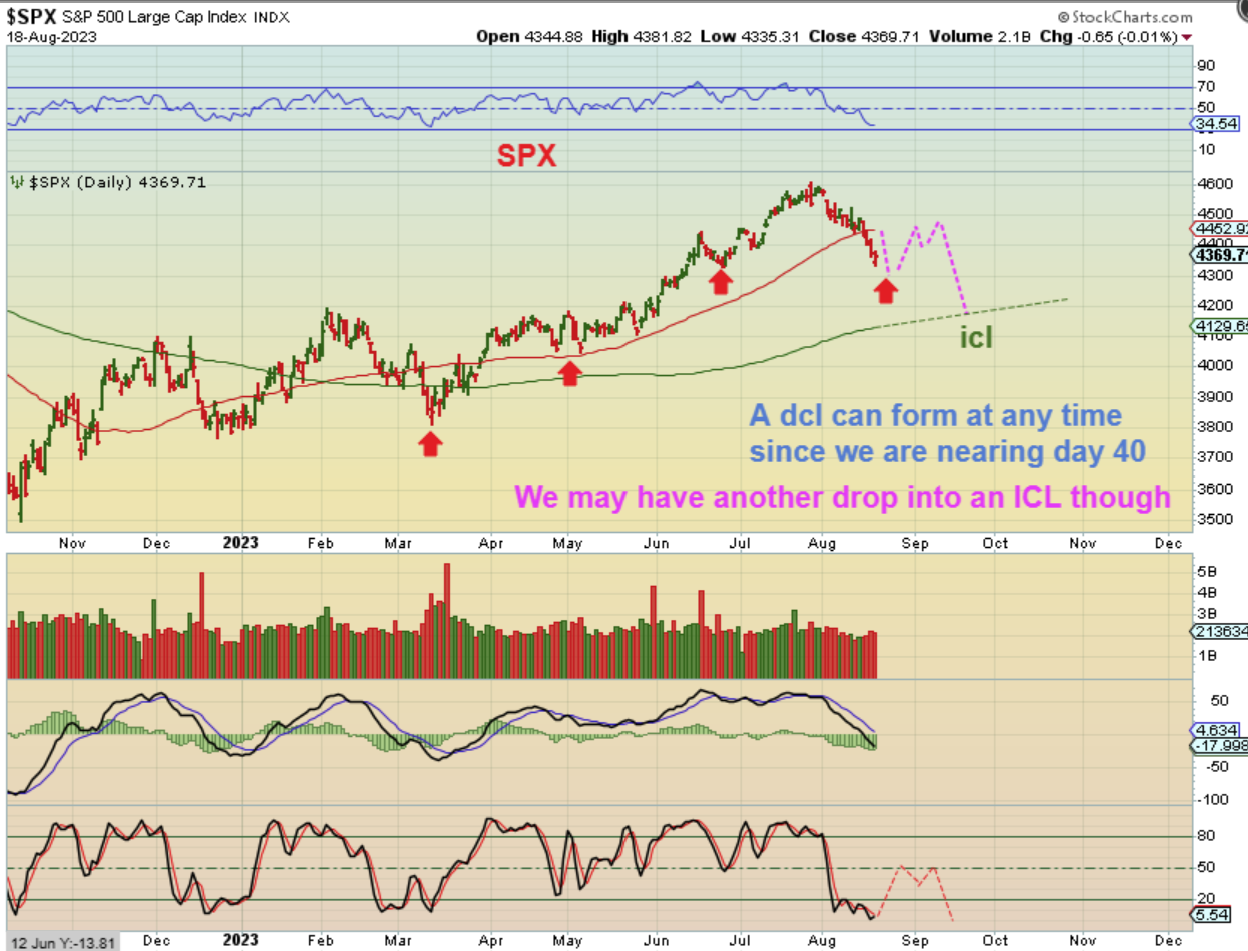
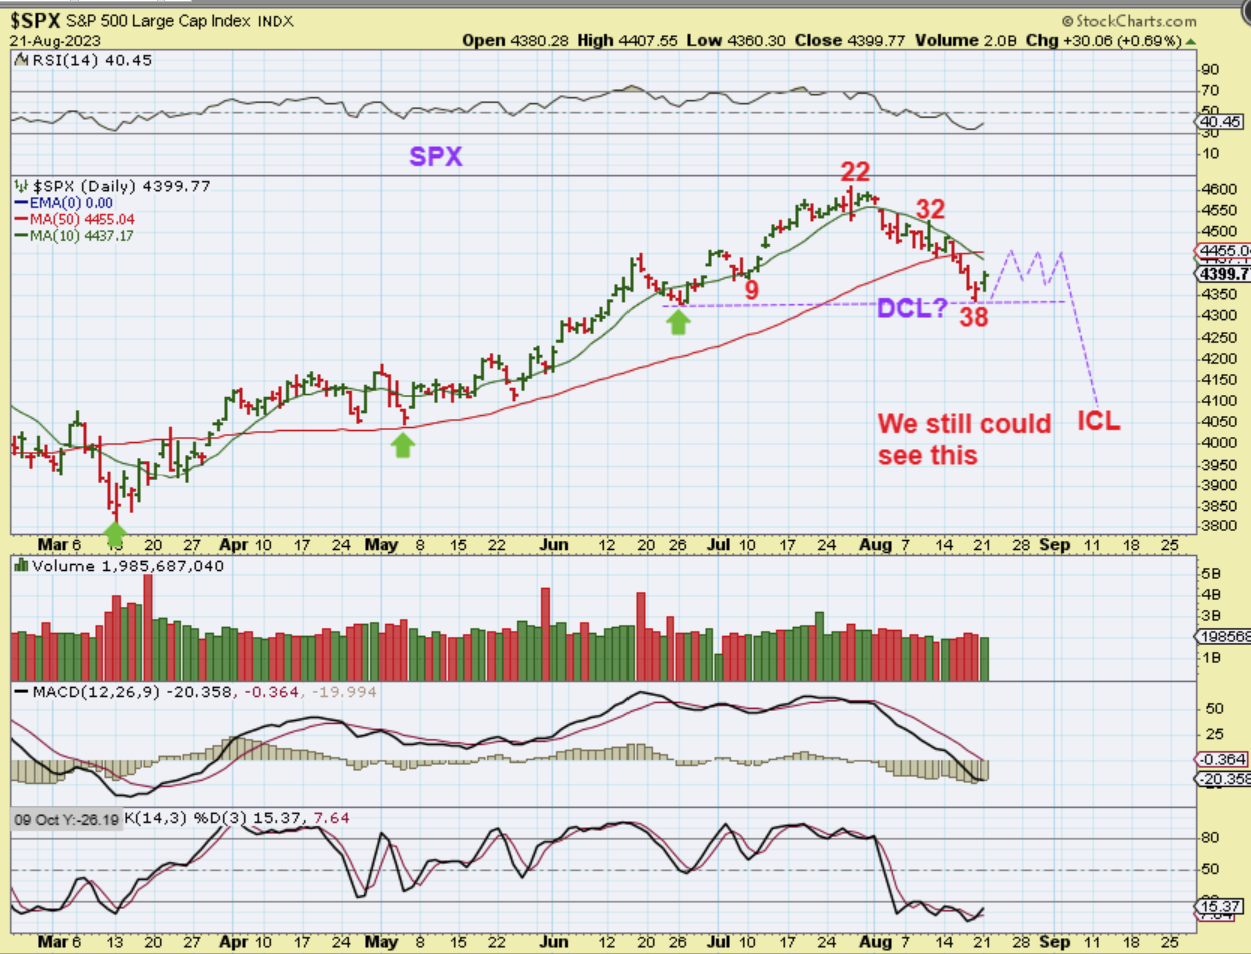
For a while now I have warned that we may only get a small bounce and then drop into an ICL. This was my August 18th chart.
.
This was my August 21st chart, and you would have to have a stop set on a buy. It may be choppy and higher, but it seems more likely to be choppy and lower into an ICL.
.
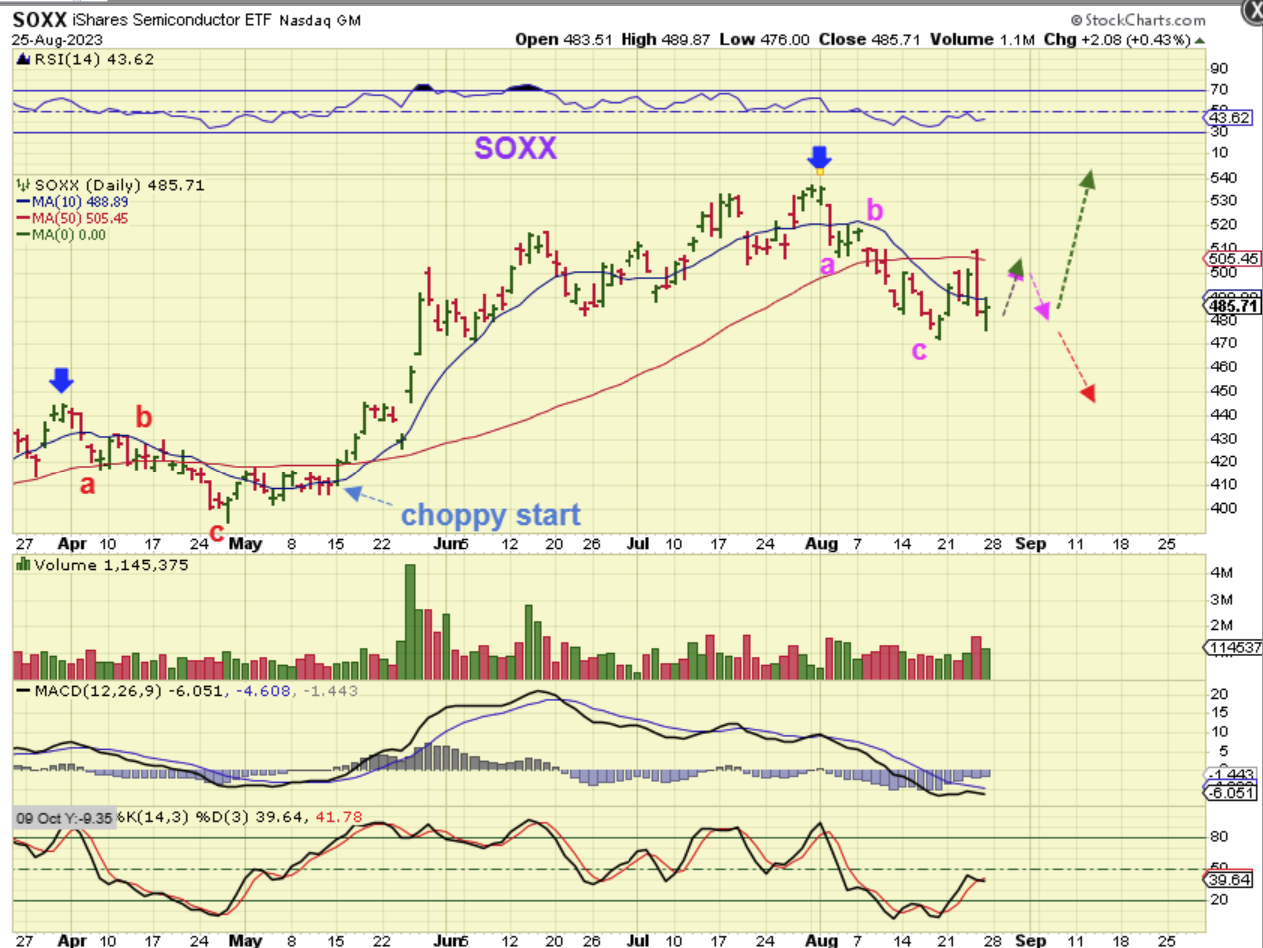
THE SOXX really got slammed down on Thursday, but it also reversed on Friday. It could go either way and I wanted to point out how that low in April was choppy or whip-saw under the 50sma too, but it resolved higher. These markets could go either way until we get some clarity.
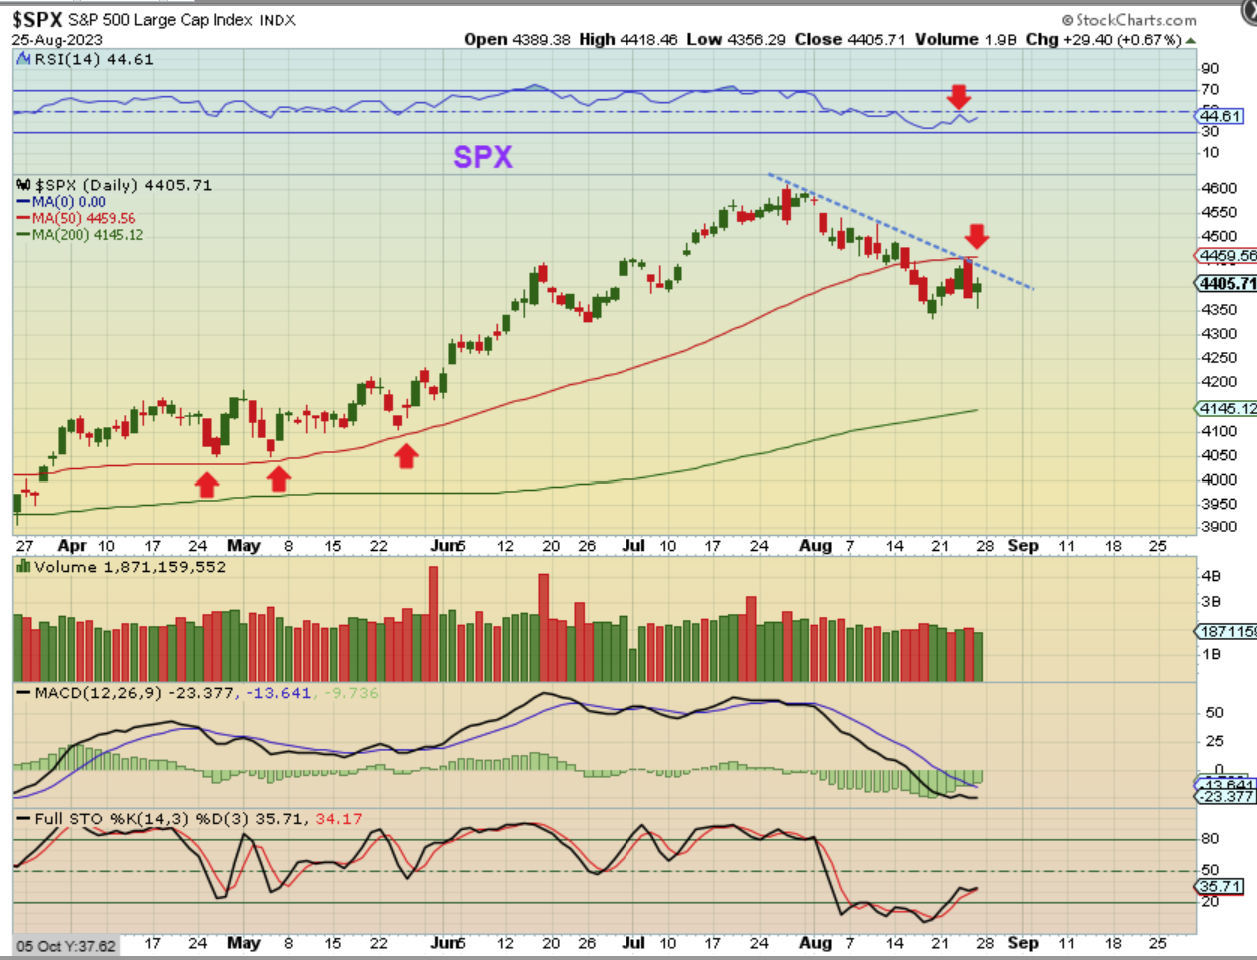
THE SPX was rejected at the 50sma for now too.
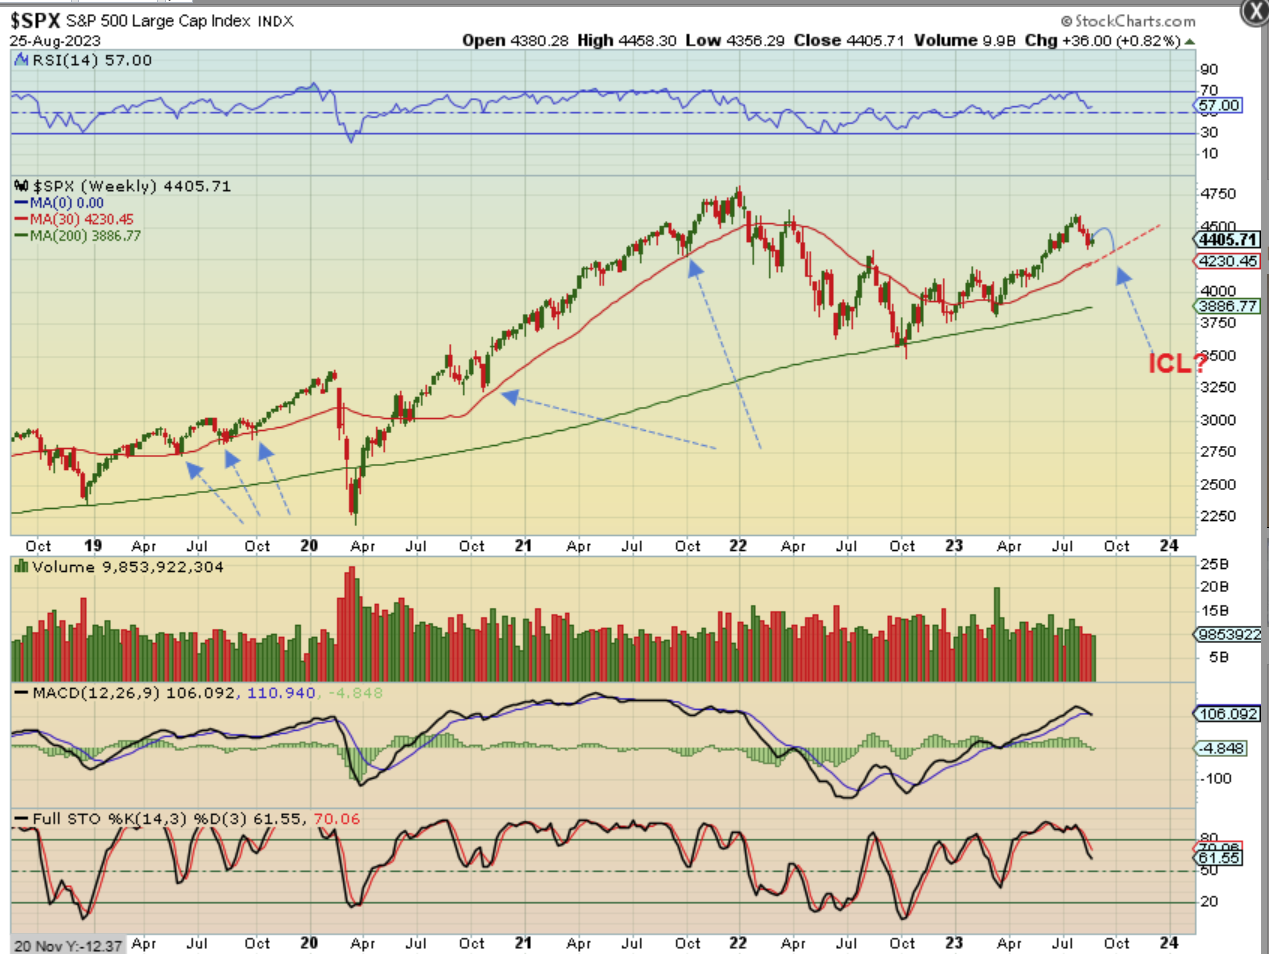
SPX WEEKLY– So on the weekly chart I will show what a weak bounce out of a dcl may look like, and then a drop into an ICL at the 30 week ma. That would be an a-b-c style drop.
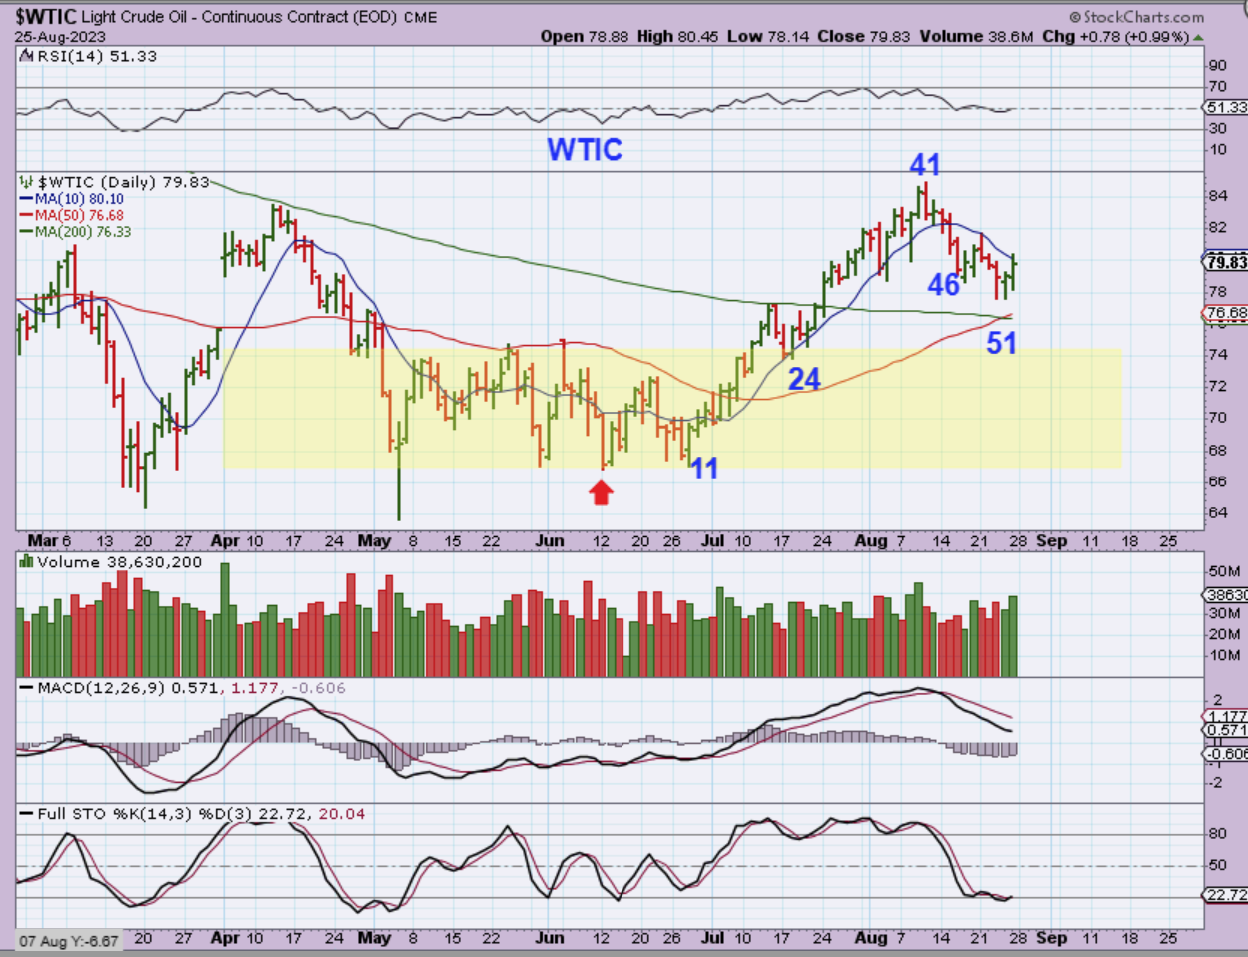
WTIC DAILY – I thought that Oil might drop down to the 50 & 200sma intersection, but at this point we do have a small swing low in place at day 51 and that is actually enough. A close above that 10 sma could indicate that Oil has a new daily cycle and act as a buy signal.
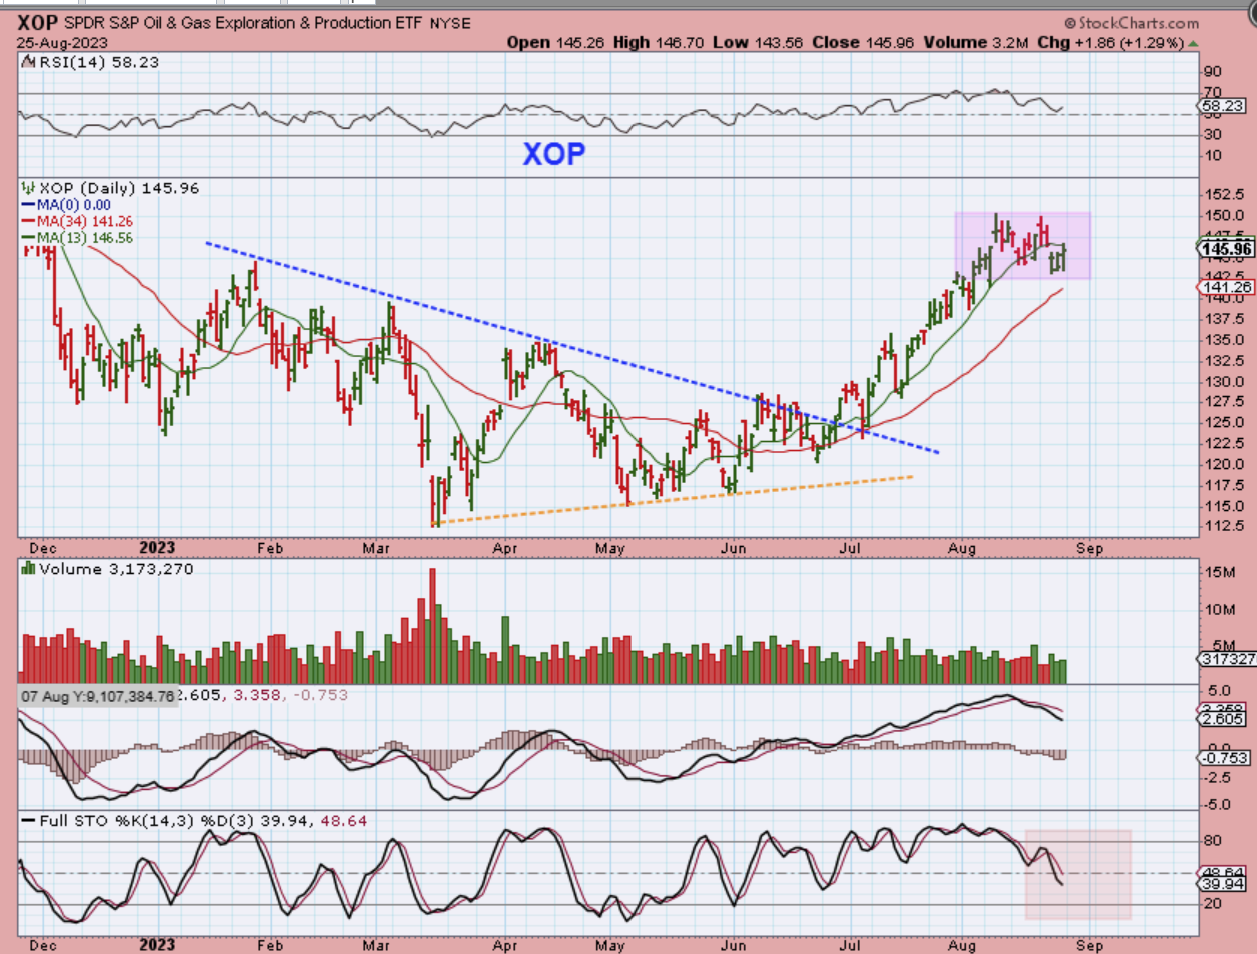
XOP DAILY- Notice that oil stocks really didn’t pull back as much as Oil did. Oil dipped down into a dcl, but a few Oil stocks simply chopped sideways at the highs. That is bullish action for the next daily cycle. If Oil does drop to the 50 & 200sma over the next couple of days, you can see that the XOP could also drop to the 34 sma.
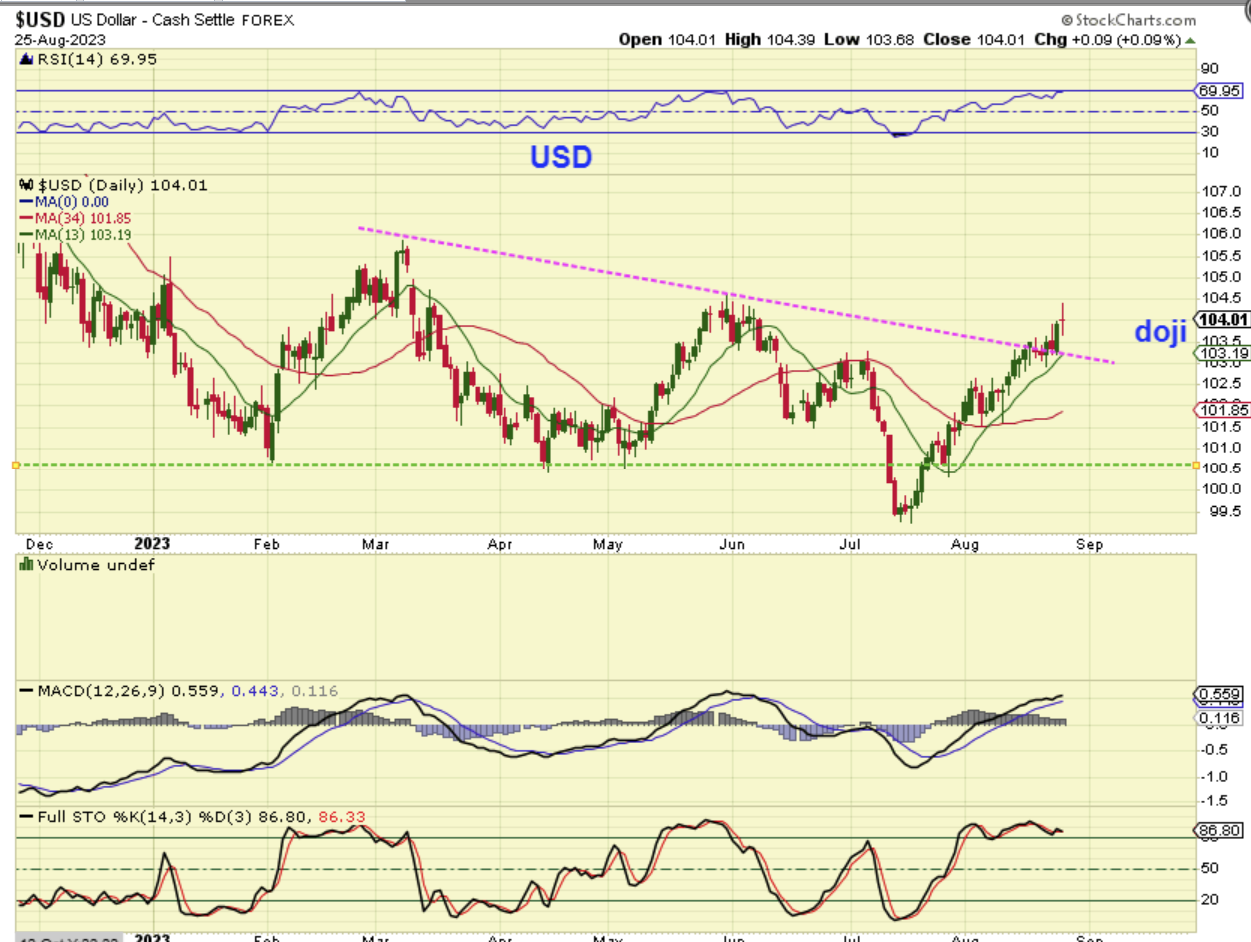
I’ve been saying that The USD really does look bullish recently and even though we have a doji (indecision & possible top with a drop into a dcl), the USD broke a downtrend line and…
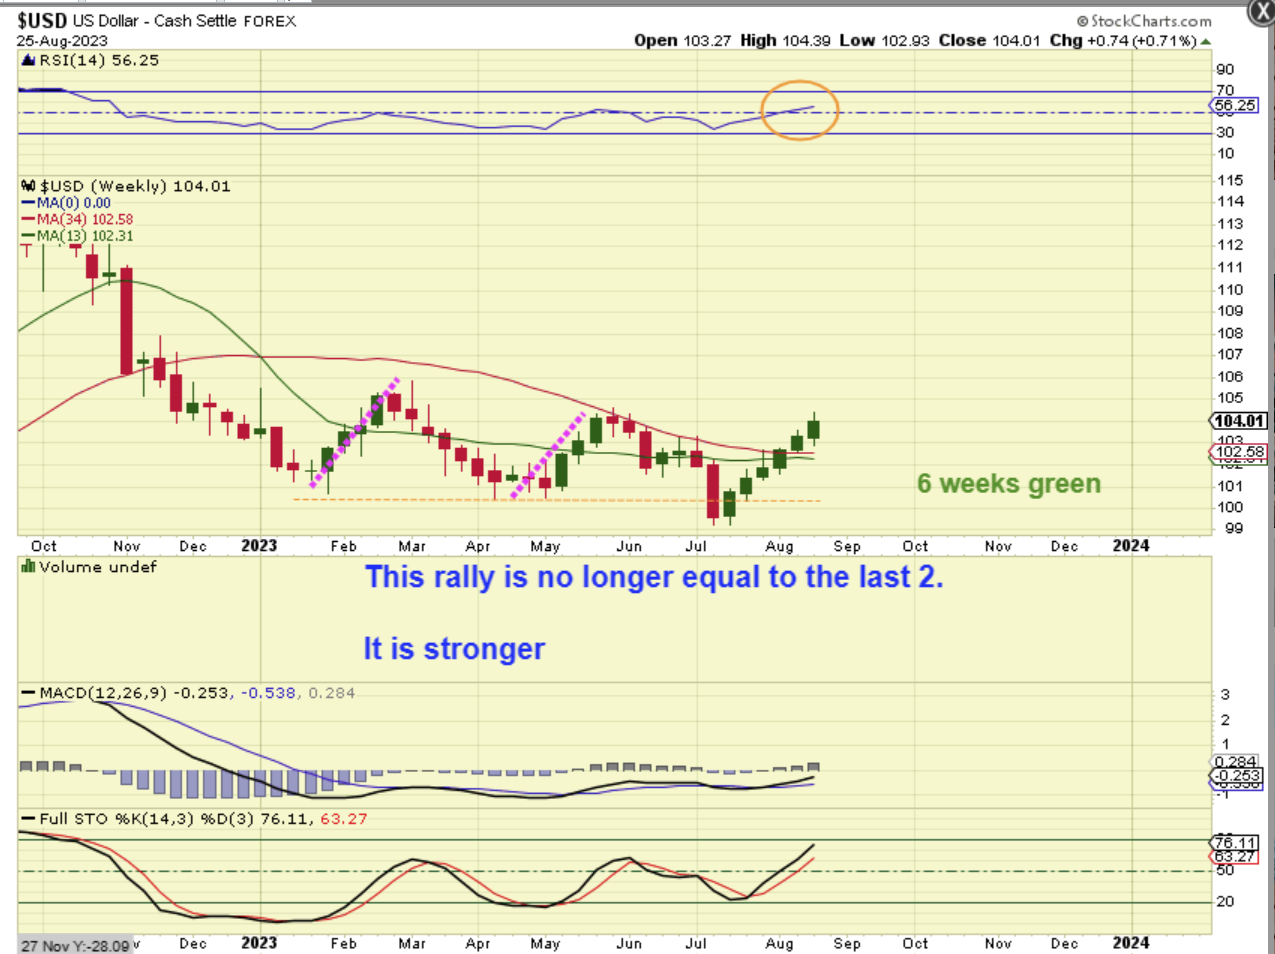
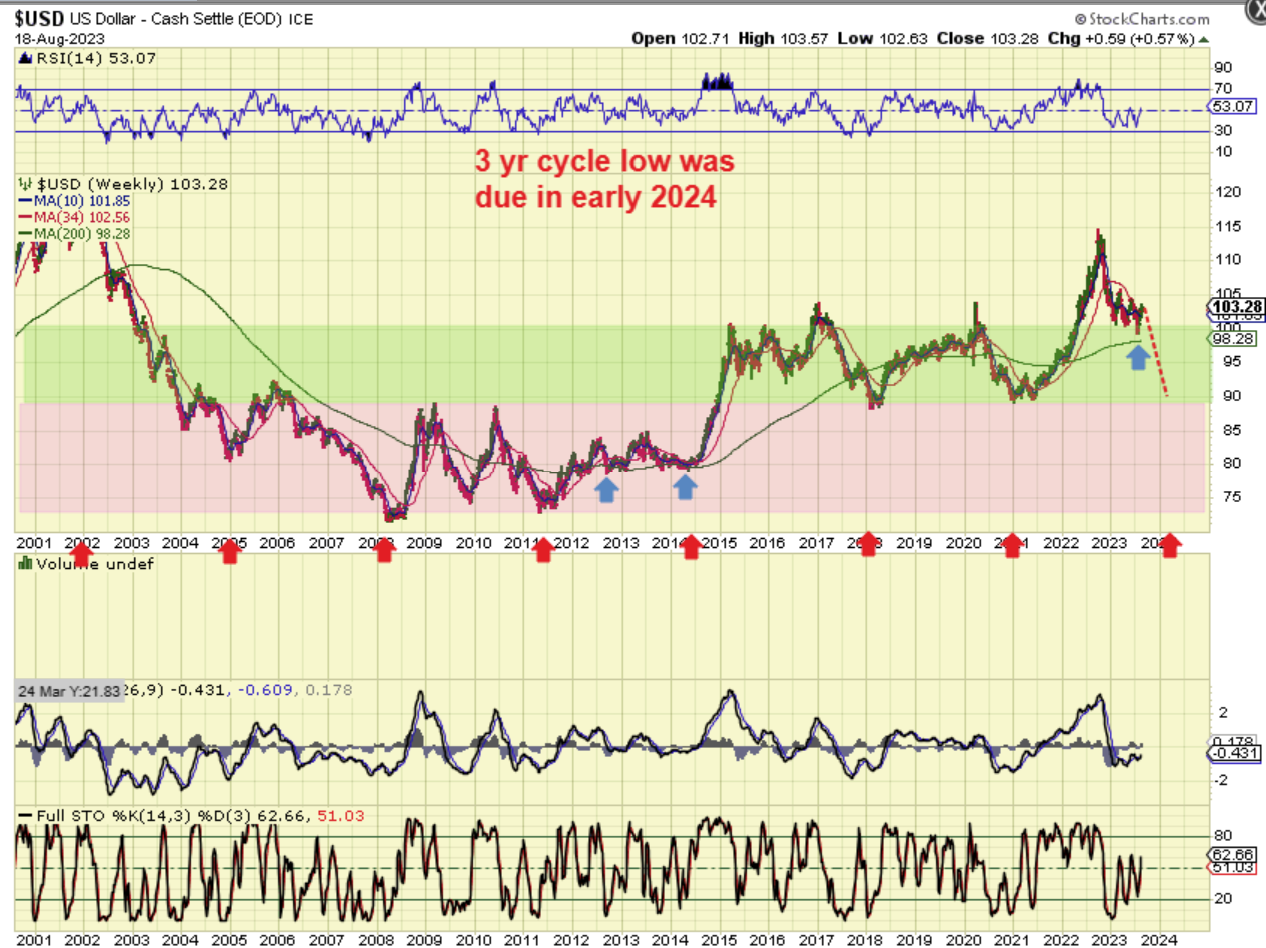
USD WEEKLY shows us that the symmetry of the 3 recent rallies is now less symmetrical. This last run higher out of the lows is stronger and longer. I am wondering if that 3 yr cycle low has found its bottom 6 months earlier than it was due to, possibly because of fed intervention with rate hikes, etc. The good news is that with this run in the USD, Gold & Silver have perked up despite that run.
.
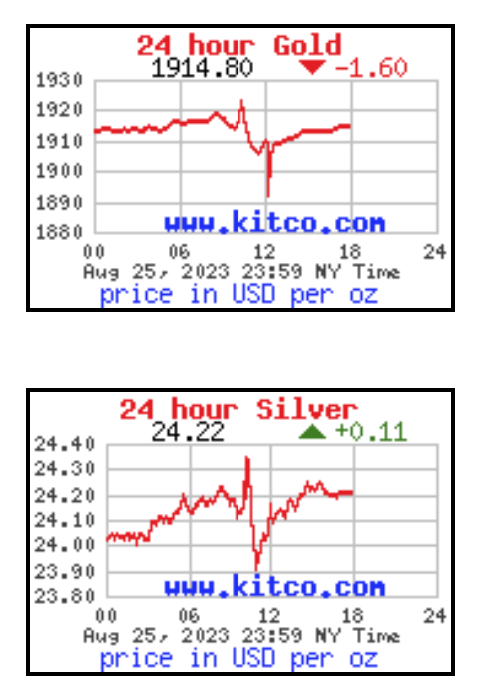
WE HAD A JACKSON HOLE FED SPEECH ON FRIDAY AT 10 AM ET. WAS IT AS VOLATILE AS A FED WEDNESDAY? OH YES, IT WAS! This was Gold & Silver at a glance. A Pop and drop and attempted recovery. Notice that Silver rallied, crashed, and recovered to green. Let’s discuss that Fed Speech…
.
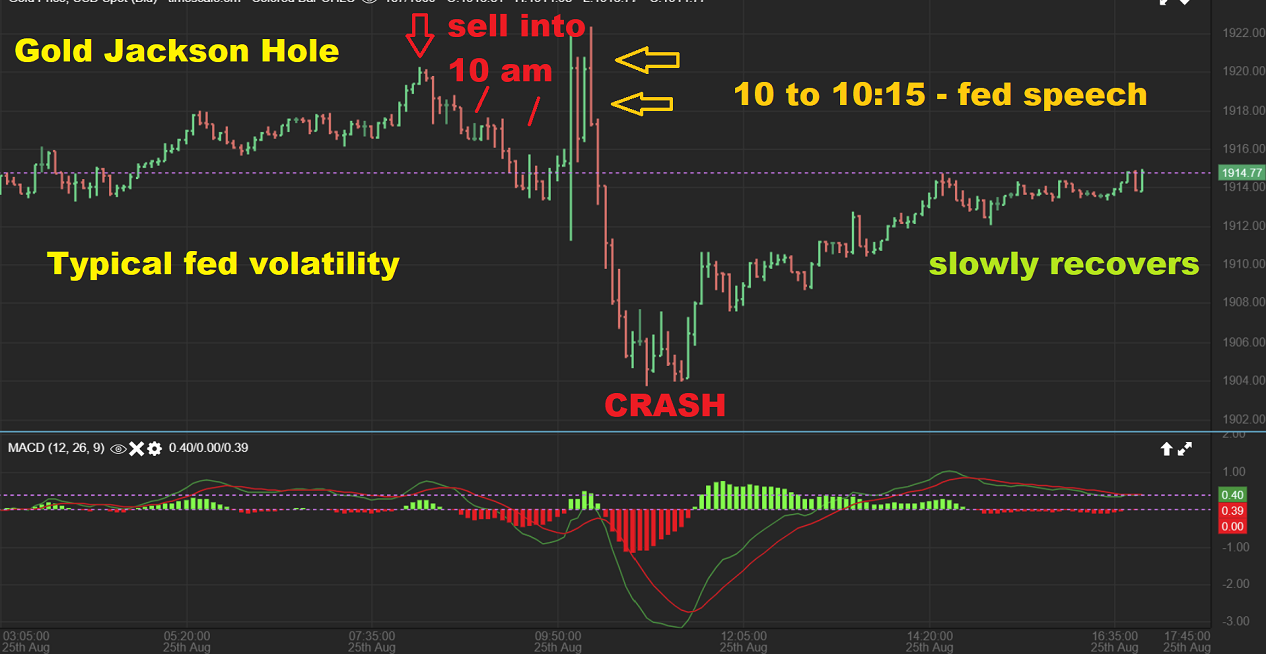
GOLD & JACKSON HOLE: If you follow the chart morning to close, you can see that…
1. Gold sold off into 10 a.m., as we were heading into the Fed Speech.
2. Suddenly a strong pop came in making Gold look bullish. It got choppy, but for 15 minutes of that speech Gold was popping to the highs of the day.
3. Then it crashed. I was away with family, so I don’t know why it popped and why it crashed during that speech.
4. I came home around 1 p.m. and I saw Gold, Silver, and Miners recovering out of these lows and as you can see, Gold closed up near the price at the start of the Fed Speech.
.
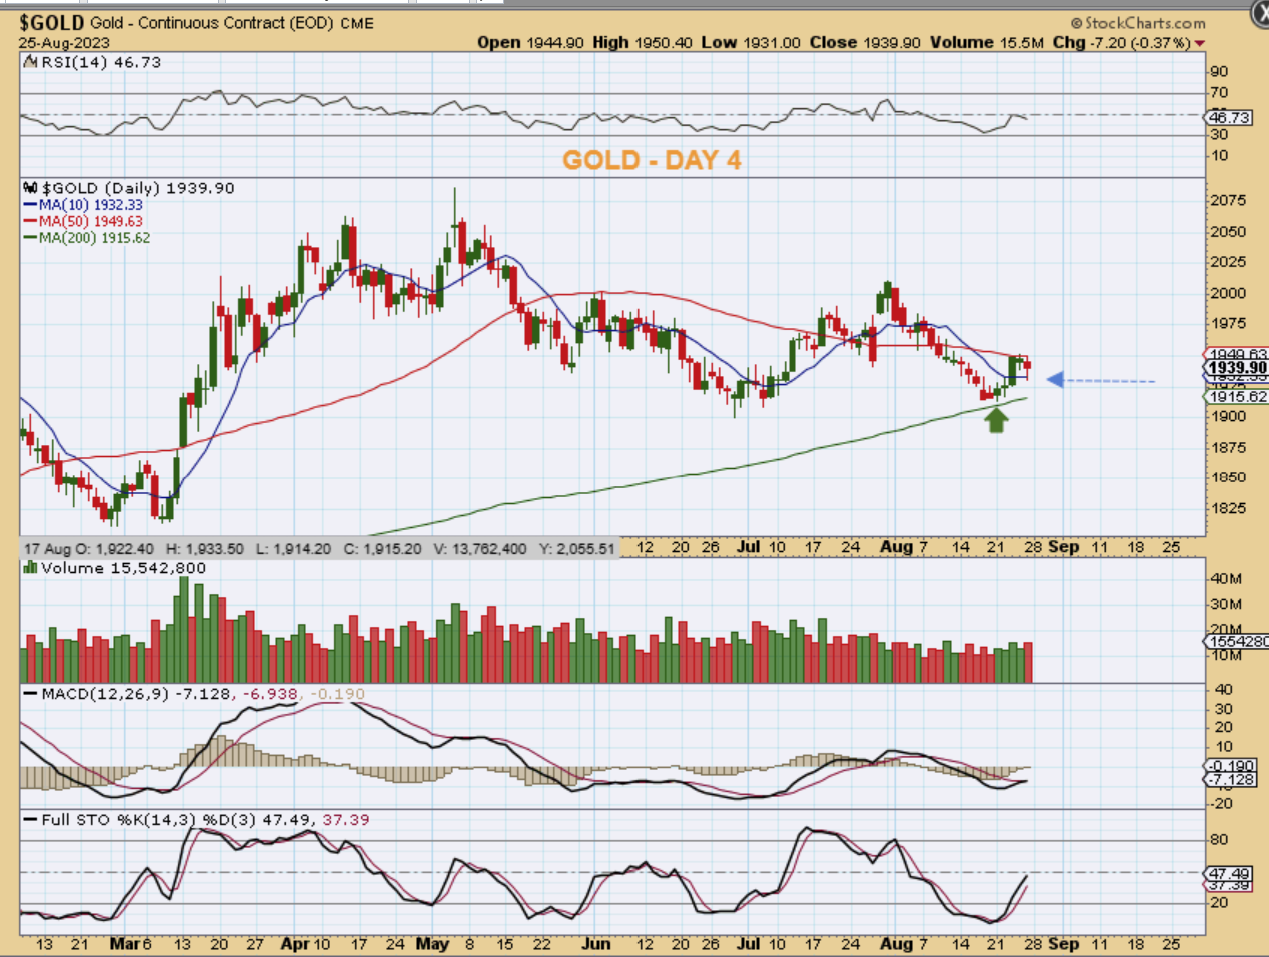
So, GOLD dipped lower to the 10sma and started to recover on Friday, day 4, leaving Golds’ price pinched between the 50 & 200sma. Even though the USD hit new highs this week, Gold is closer to the 5 day highs, and not near the lows.
.
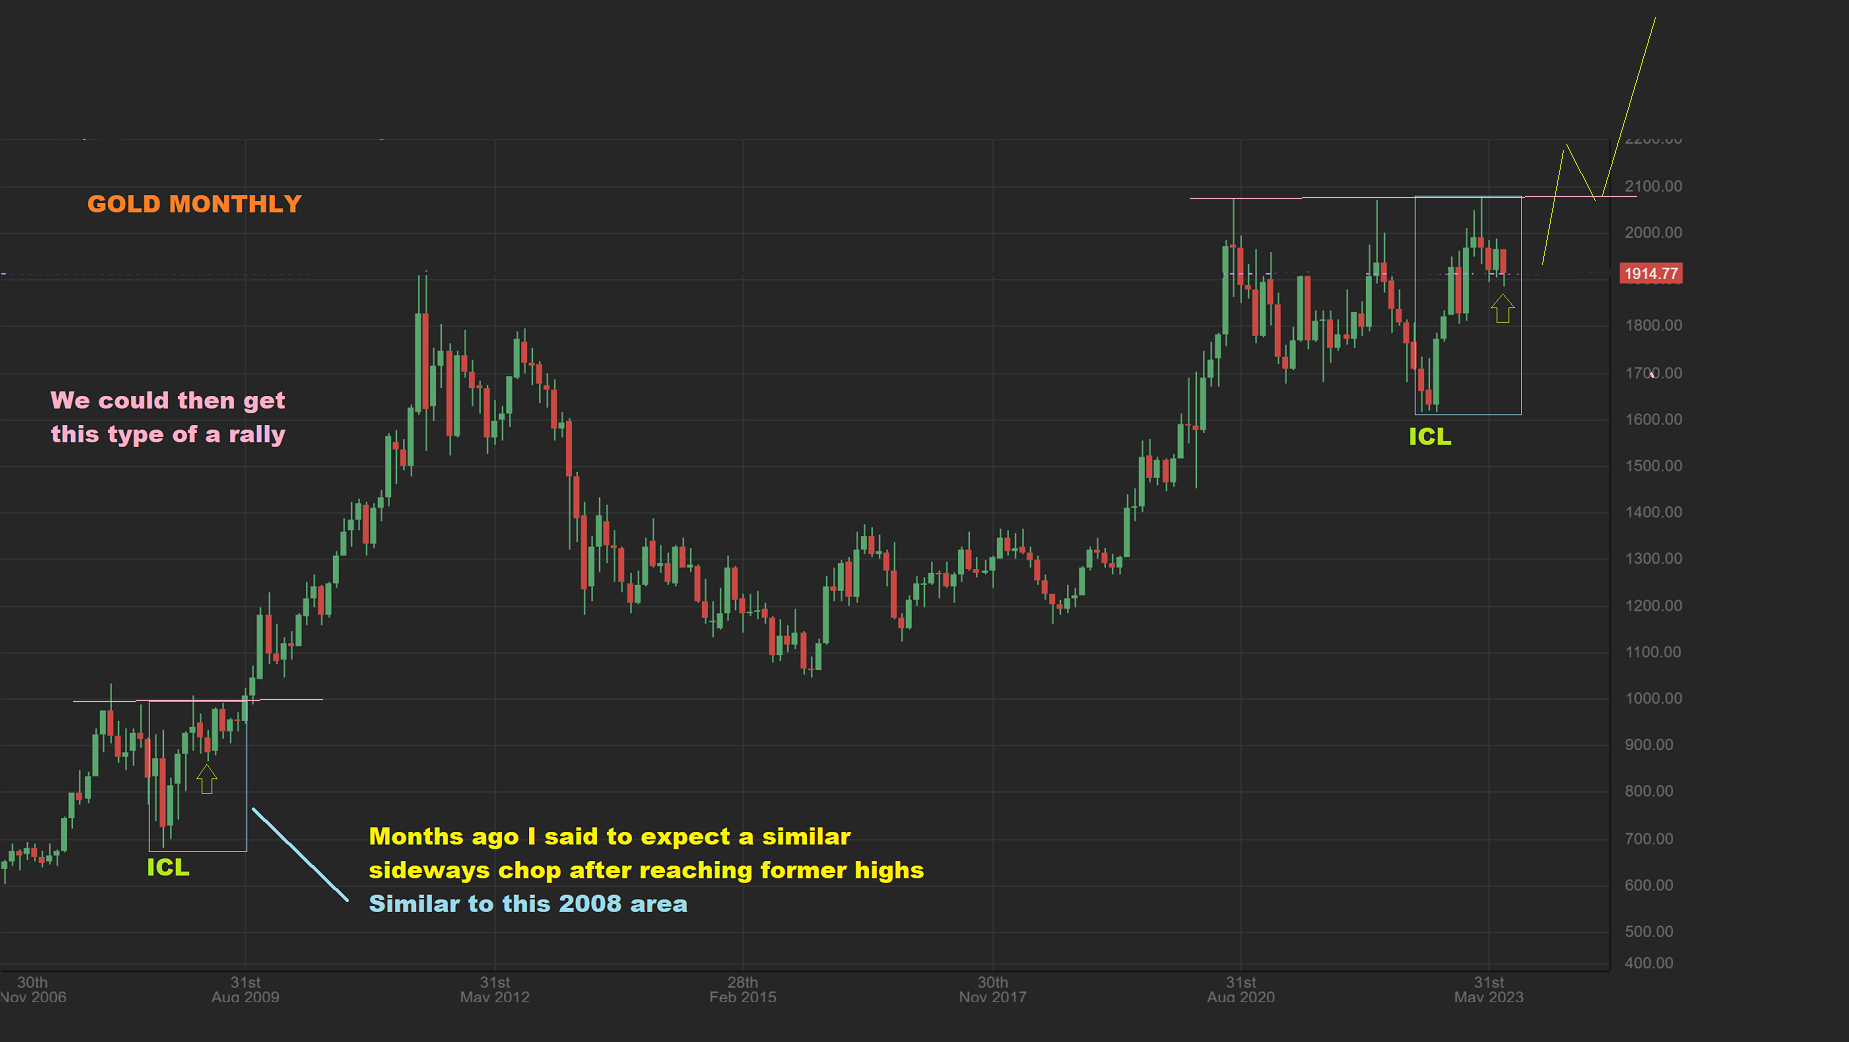
GOLD MONTHLY – We are near the end of the month, so I decided to take a look at an up-to-date Monthly chart of Gold. At this point the chart remains bullish and it still looks similar to the 2008 correction that was followed by a breakout to new all-time highs.
.
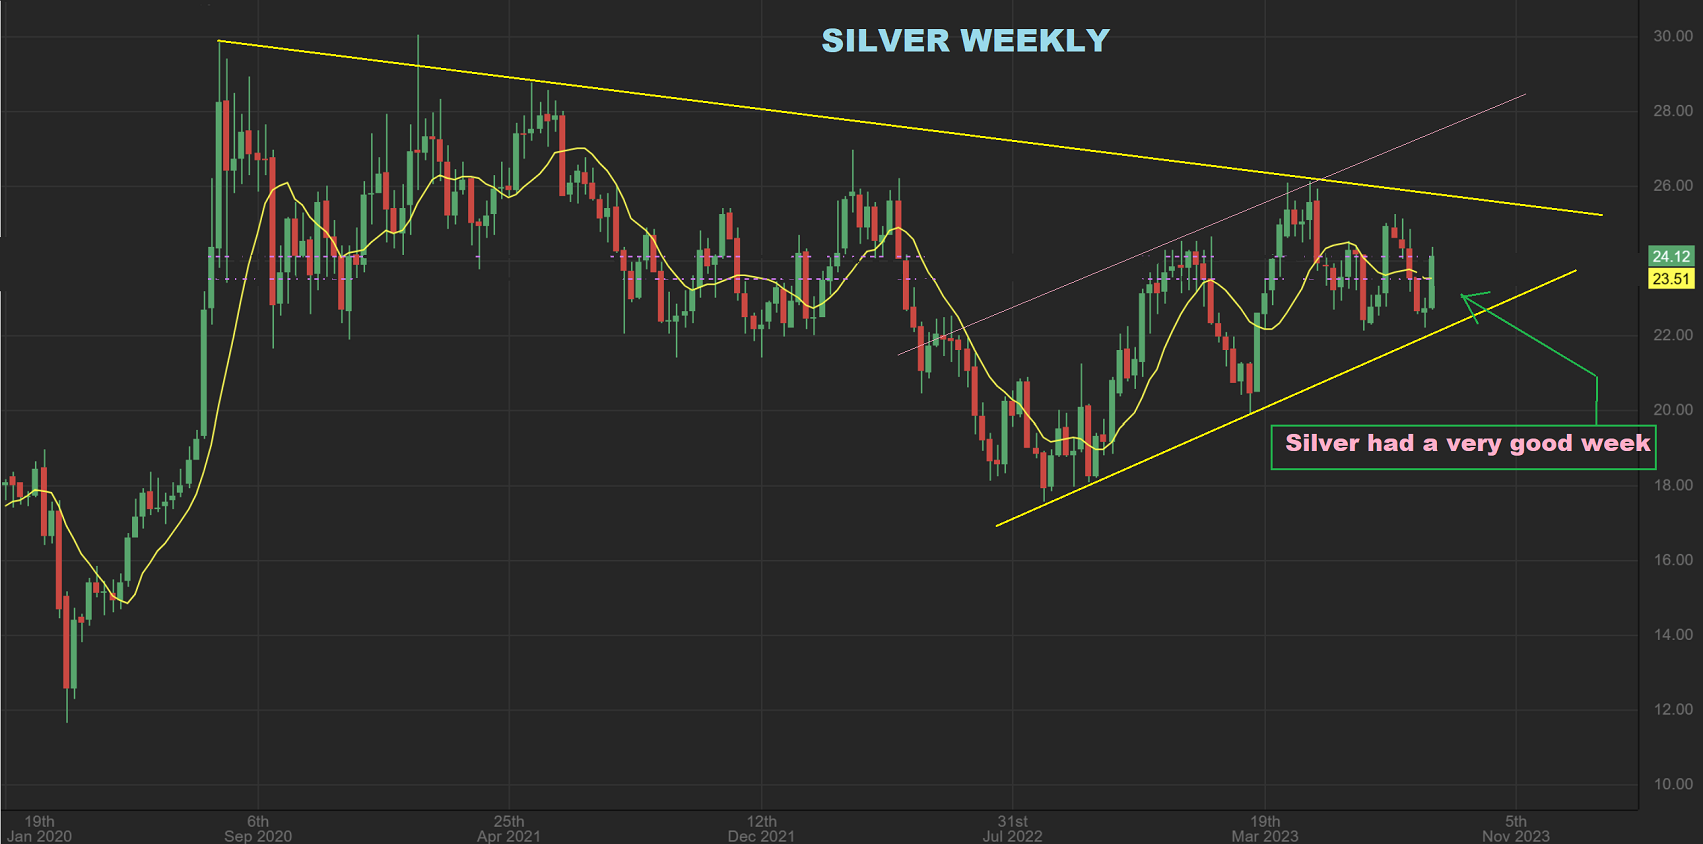
SILVER WEEKLY – Silver had a very good week when you consider how the USD ran to new highs, right? Silver was up over 6.6% for the week. This strong candle remained in place after the Jackson Hole speech and the USD rise. It is also in a weekly uptrend with past ICLs forming higher lows. This is actually a very large bullish ‘correction’ or ‘consolidation’, so let me step back and show you that…
,
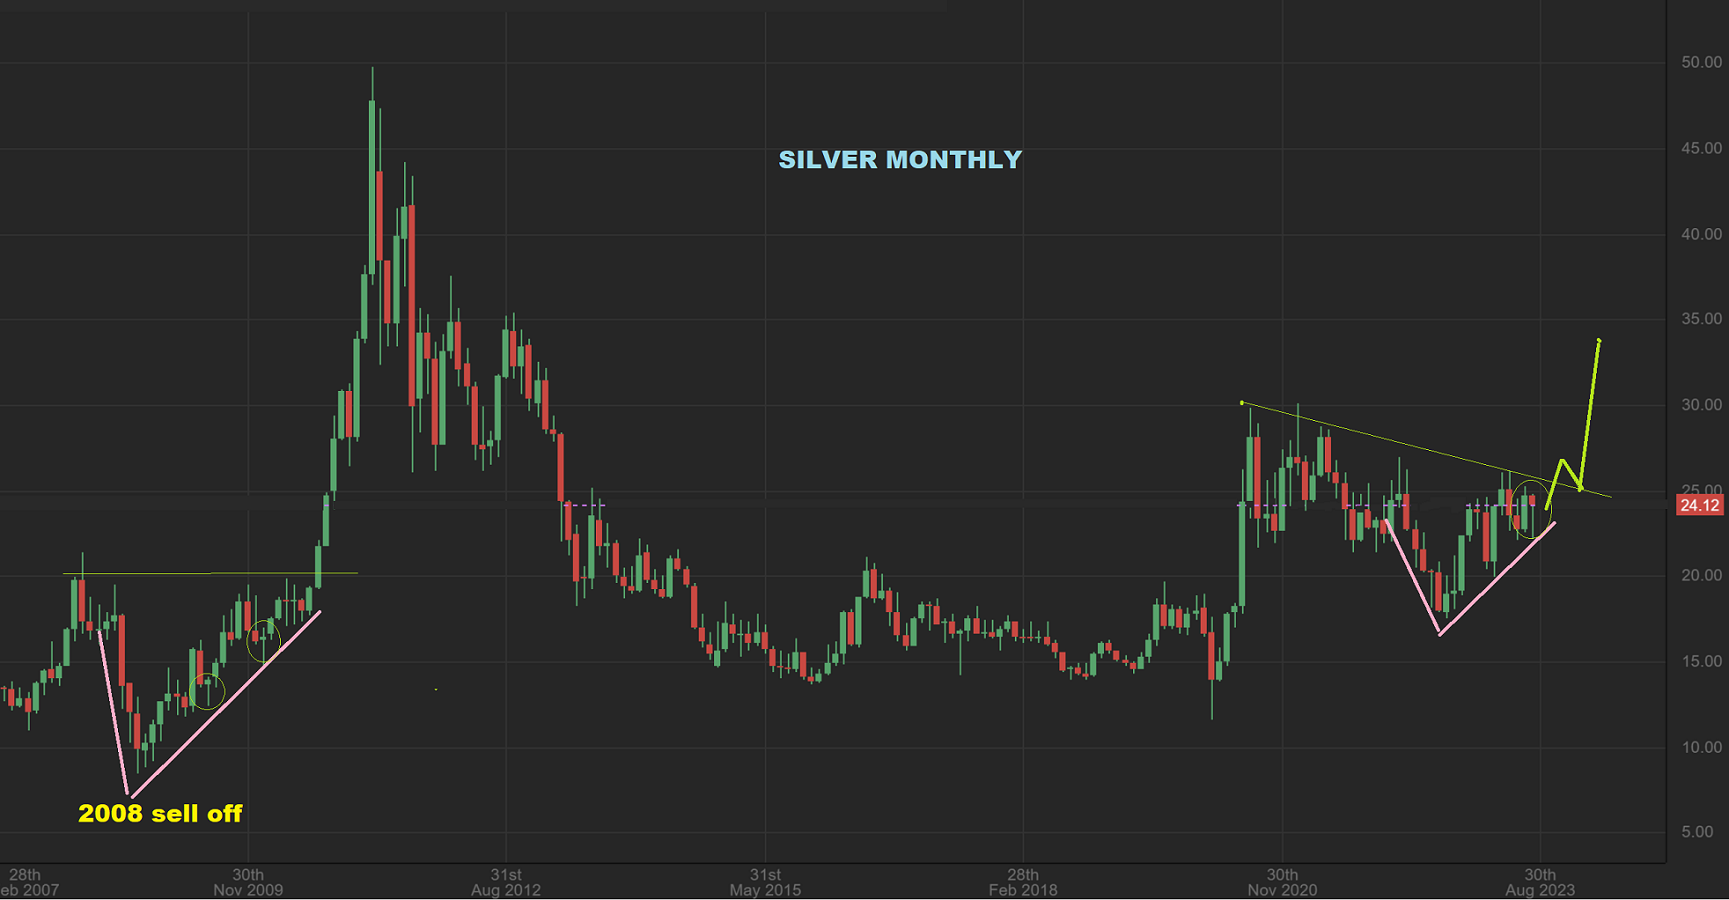
SILVER MONTHLY – Silver has been in a consolidation for many months, but again, with a series of higher lows now it is bullishly pushing higher. A breakout from here could really accelerate too.
..
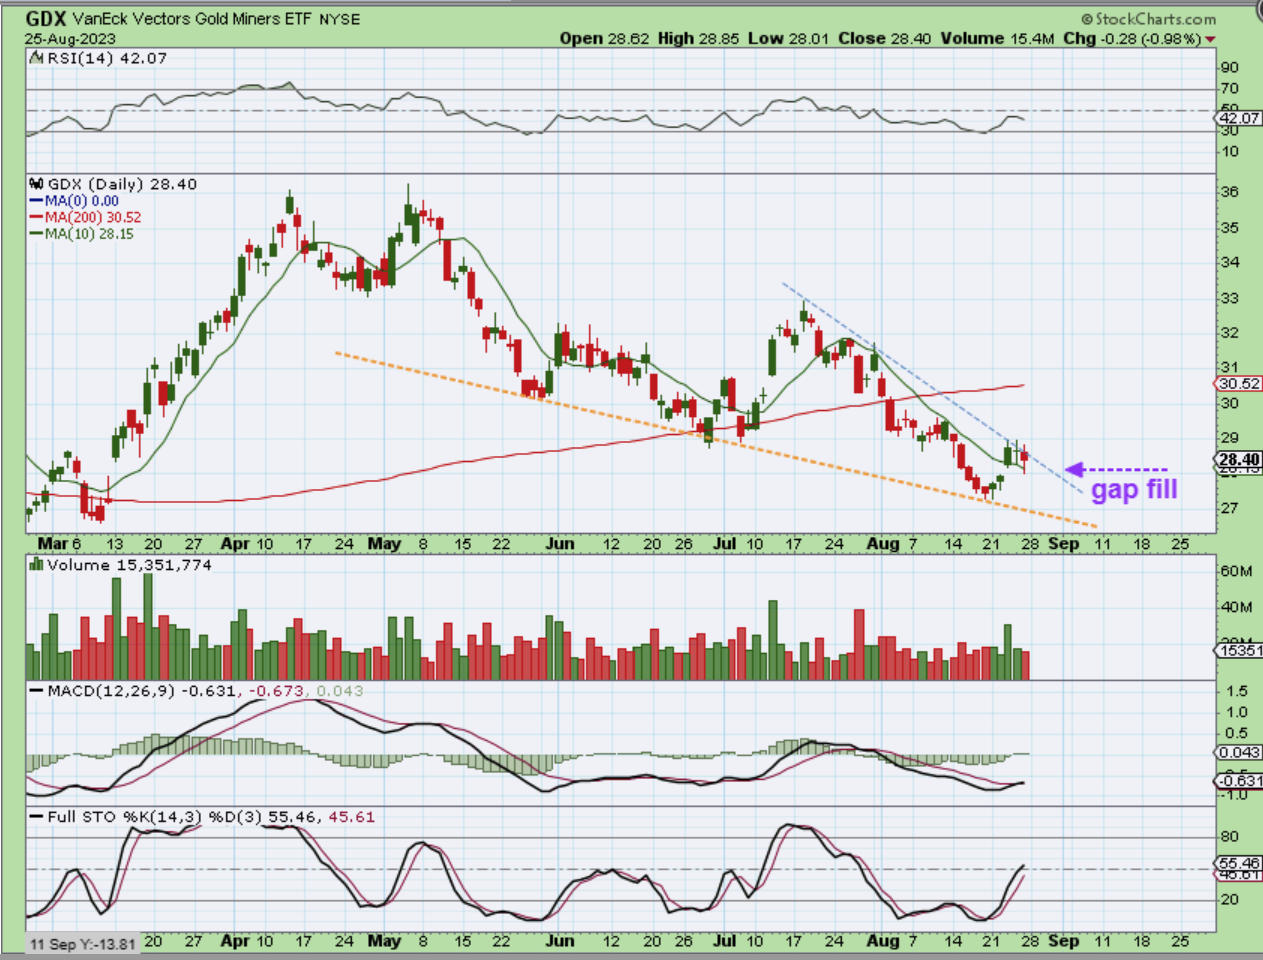
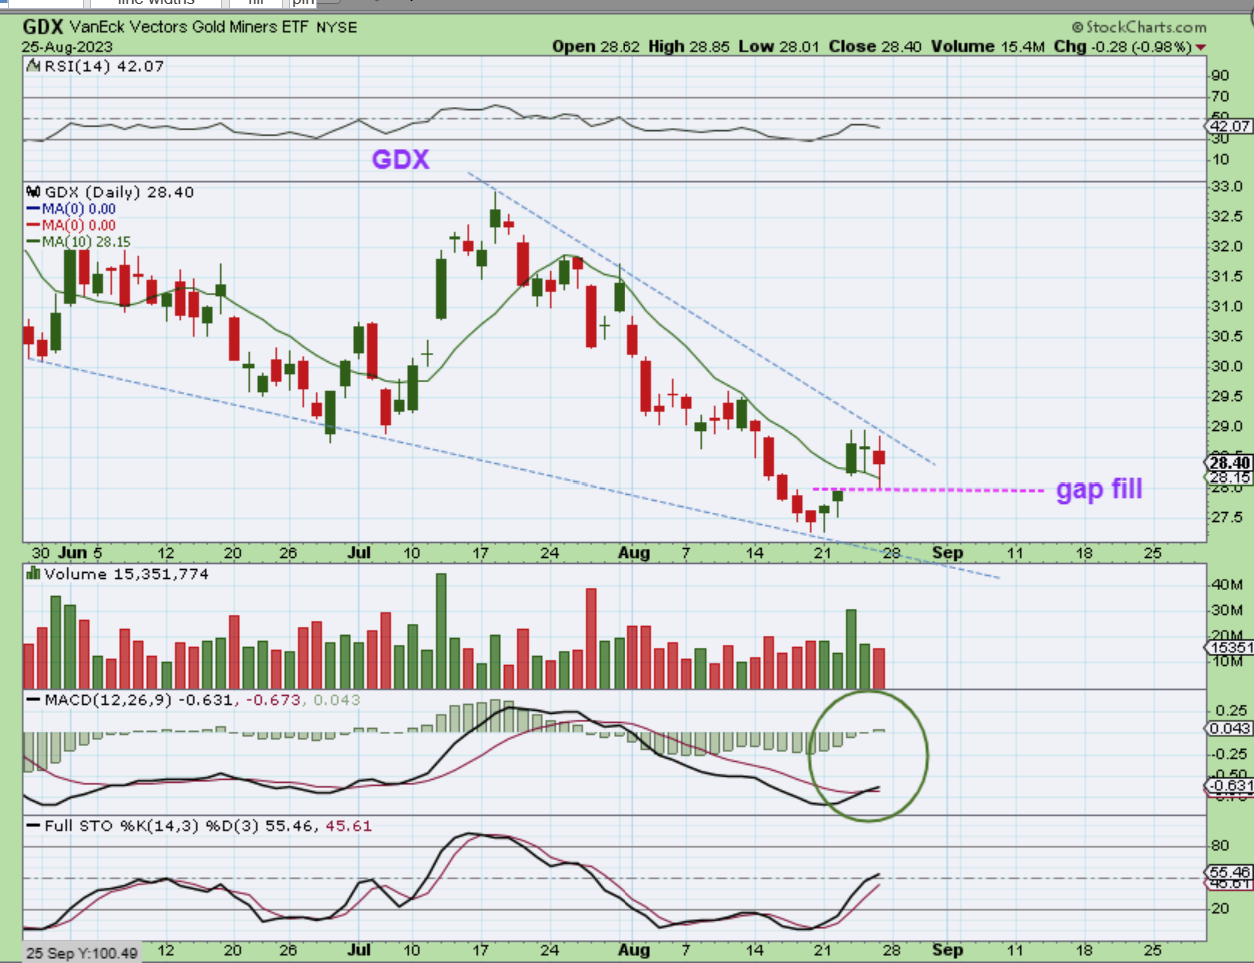
GDX DAILY– GDX sold off on Friday with the Jackson Hole speech and then bounced right back above the 10sma. It is pushing on a downtrend line and
.
GDX pretty much did a gap fill with the Jackson Hole speech on Friday. That MACD is crossing higher and we are on day 5 for Miners, so we have to expect this to continue to push higher soon.
.
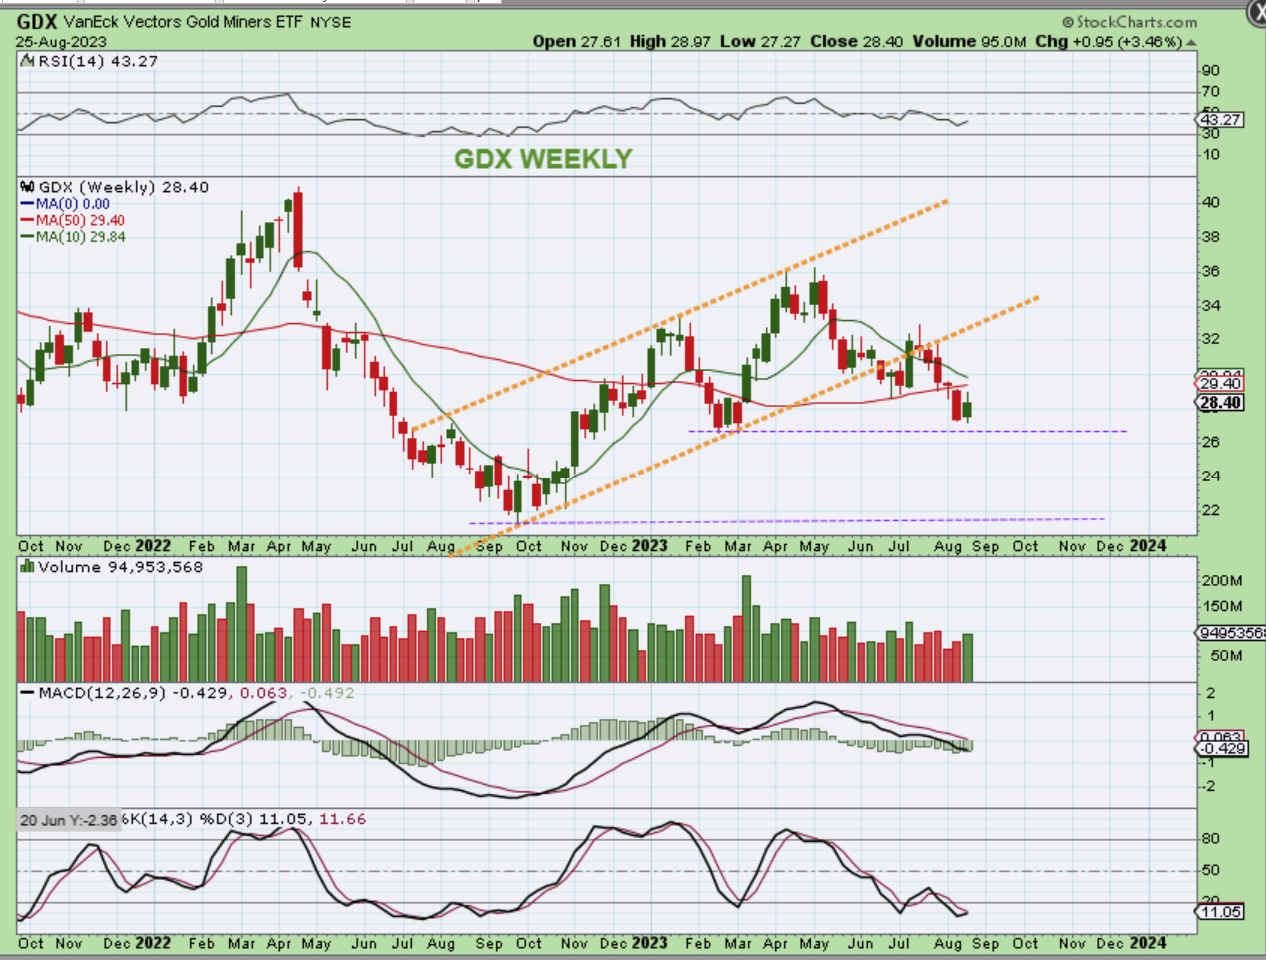
GDX WEEKLY– The weekly chart broke down from an upward trend sloping channel, but the recent ICL is higher than the March ICL. Notice that the September/October 2022 ICL and the March 2023 ICL were both a bit choppy at the lows, but eventually took off higher. We may see that choppiness again, but it is oversold, and this should be an ICL for Gold and Silver, so the Miners should work their way higher.
.
SUMMARY:
The General Markets experienced a corrective sell off recently, and I mentioned in past reports that they should also be due for the deeper dip known as an ICL. We saw a swing low around the day 38 area, and that is within normal timing for a dcl, so we may be starting a new daily cycle. Will that break to new highs and roll over, or will it simply chop and roll over into an ICL. I think it will be the latter. That final low is usually in the form of an a-b-c style sell off and would take 2 daily cycles, with 1 done and 1 to go, so that ICL may not be in place until September or so. Right now the General Markets are choppy until the pick a direction (rally to the highs or sell off to an ICL).
.
Oil is trying to put in a higher low and Oil stocks have been bullish.
.
The USD is tricky, since it was NOT due for a 3 yr cycle low until roughly Jan 2024. The recent strength may be a result of the Fed Rate hikes, inflation, and other factors, so it does make me wonder if we got a 3 yr cycle low 6 months early? That could be the result of such manipulation. It is possible, we’ll need more time to know for sure, and the USD is due to fall into a dcl any time now too. That can help Gold and the good news is that we have also noticed that even the recent strength in the USD has not hindered Silver or Gold.
.
last week I said in my weekend report that I thought The Precious Metals would have a good week and they did. This is because Silver and Gold both look to have their ICL in place and the strength in the USD did not hinder that, so that is encouraging. I guess that I would expect the precious metals sector to have a good week again, but sometimes the lows can be choppy, so we’ll have to wait and see. I do think that a basket of Miners bought when I mentioned it (or now) will still push higher over time and become profitable. I look forward to seeing how next week plays out!
.
Enjoy our weekend and thank you for being here with me at Chartfreak!
.
~ALEX
.
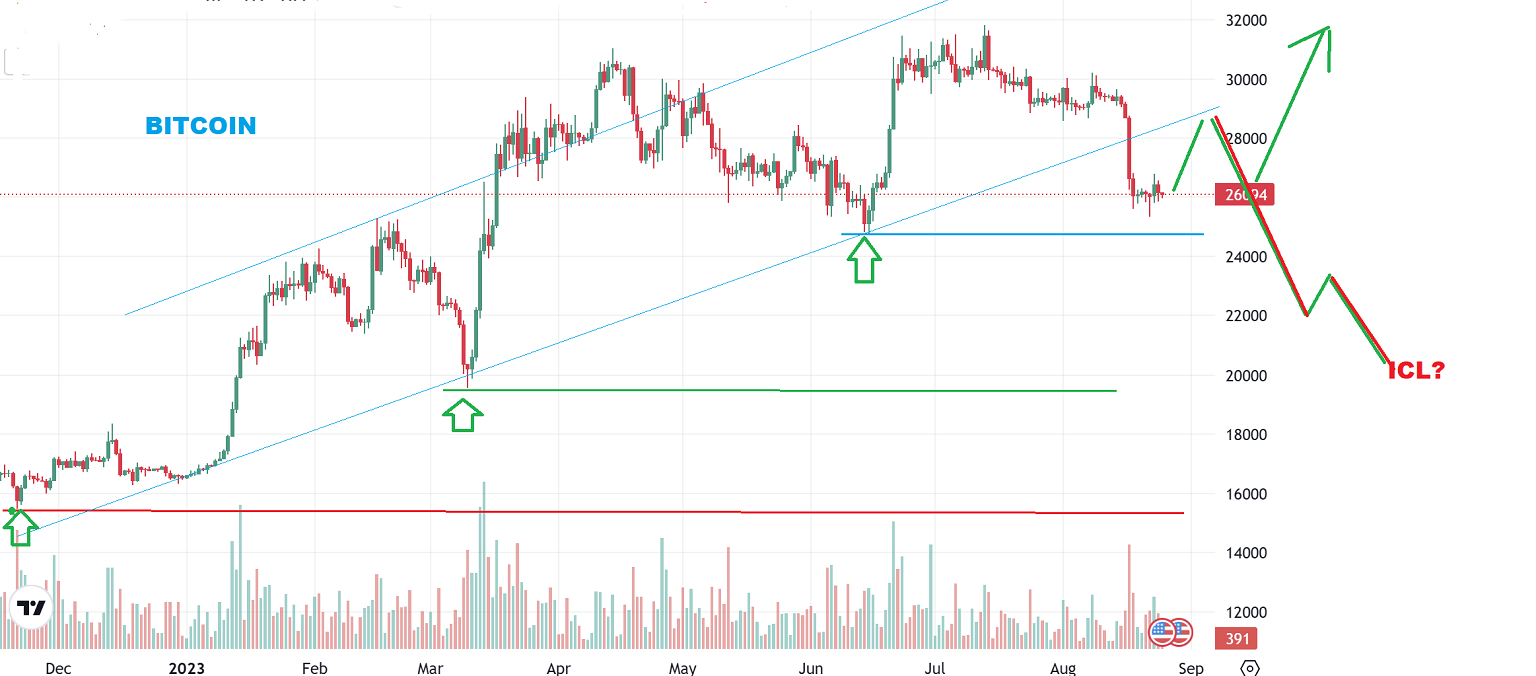
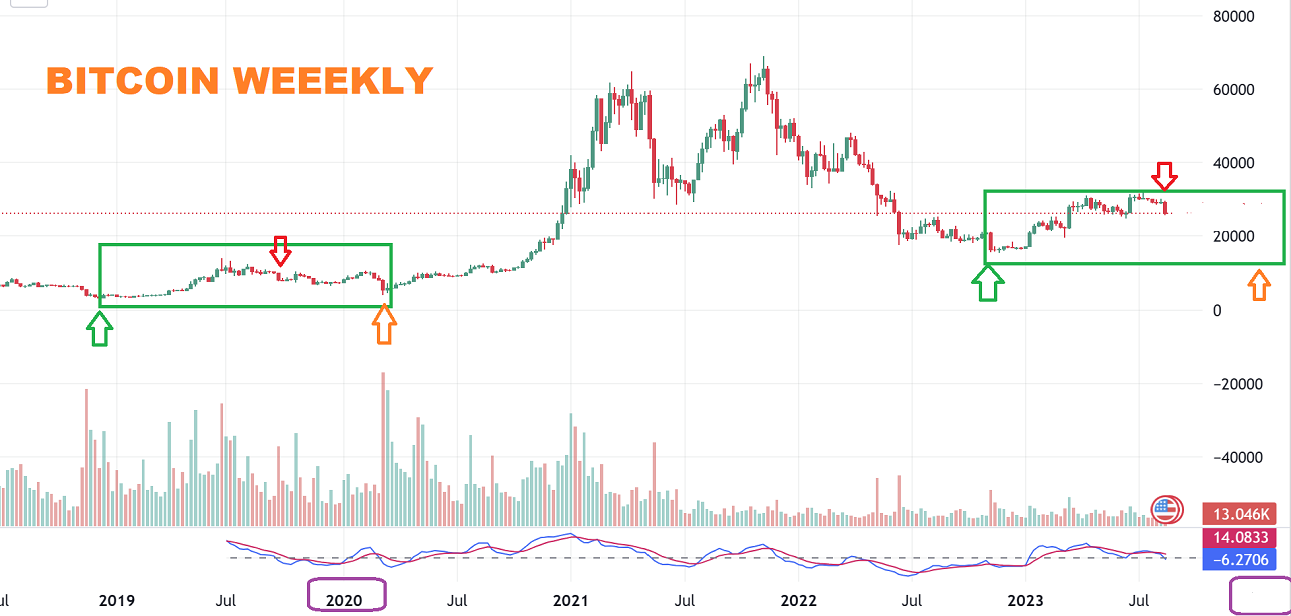
BITCOIN WEEKLY LAST WEEK – Last week I showed this chart and mentioned that Bitcoin could be in a choppy phase before the real ramp up into the halving year of 2024. The green boxes pointed out what I thought could be just a choppy ending to the 2023 year.
.
BITCOIN DAILY – Bitcoin then dropped this week so sharply that it even broke the uptrend. That can lead to a longer choppy sideways consolidation, as expected & mentioned last week. Could bounce first(?)and then drop again? Yes, but like I mentioned last week, I think that Bitcoin may just become a sideways choppy chart for a while. And it is also possible for Crypto stocks to possibly rally and drop and rally and drop, but they would still likely become very hard to trade. RIOT & MARA have both fallen from roughly $20 to $10 in a choppy manner.