
Thursday August 24th – At the Bottom
Today could certainly be a market mover with NVDA’s Bullish earnings ( Up 7% after hrs Wednesday), The 8:30 am ET Initial Jobless Claims, and then we will see a ‘Fed Officials interviews from Jackson Hole at 10 a.m’. I am not 100% sure if that is 10 am Eastern Time or 10 am at Jackson Hole. At this point I have been using the Title of each report to mention that I think we have a bottom in place in the Precious Metals sector. Now we’ll see if the upside gets tested and pushed a little lower after this initial surge, or will the run continue to accelerate? Let’s review our markets…
.
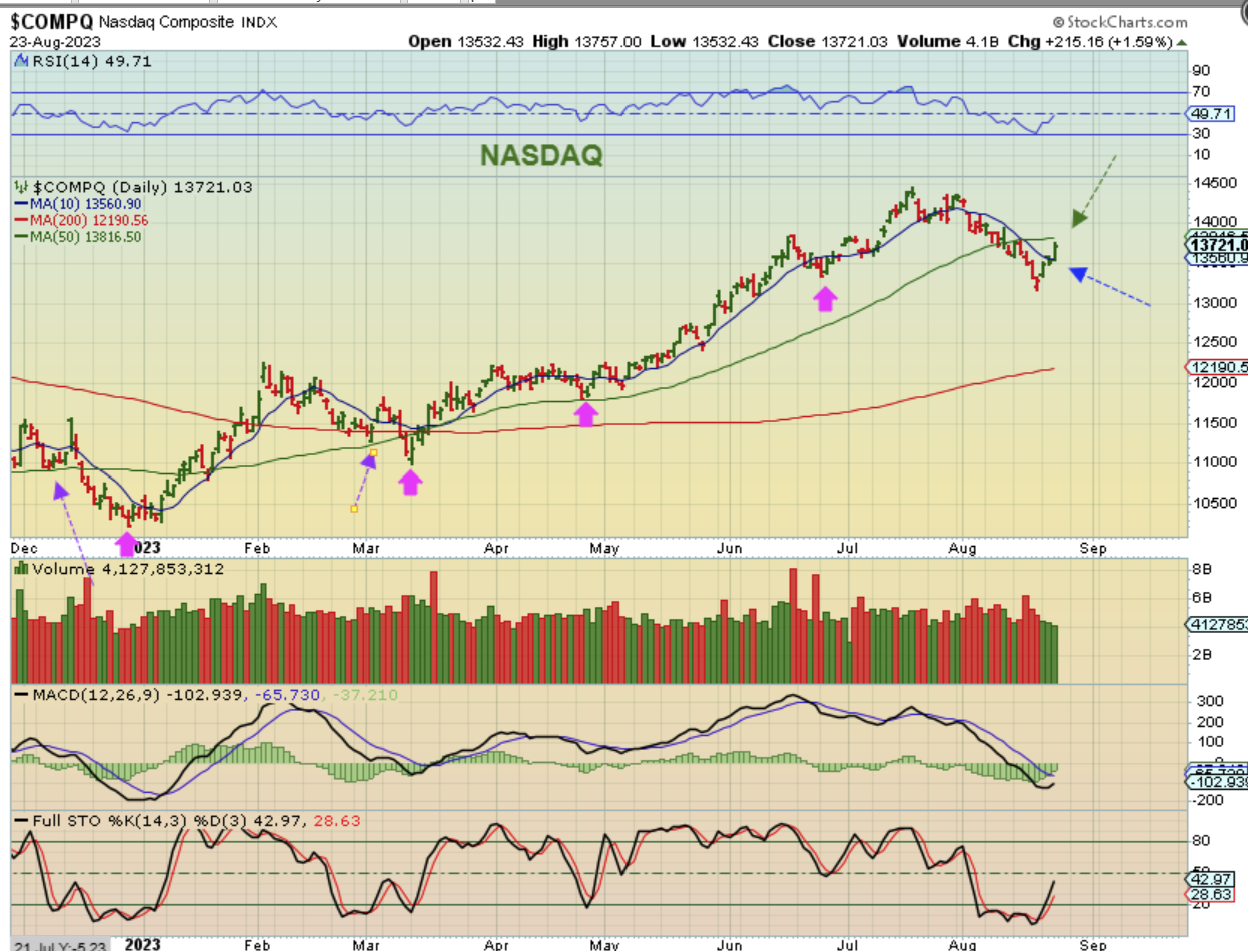
THE NASDAQ had a strong move on Wednesday and again, futures were up further on Wednesday night when NVDA released a strong earnings report. With a solid close above the 10sma, it does look to be day 3 of the new daily cycle. Let’s see if it gaps over ( & can hold) The 50sma. If you bought the reversal lows, gradually raise stops as it climbs.
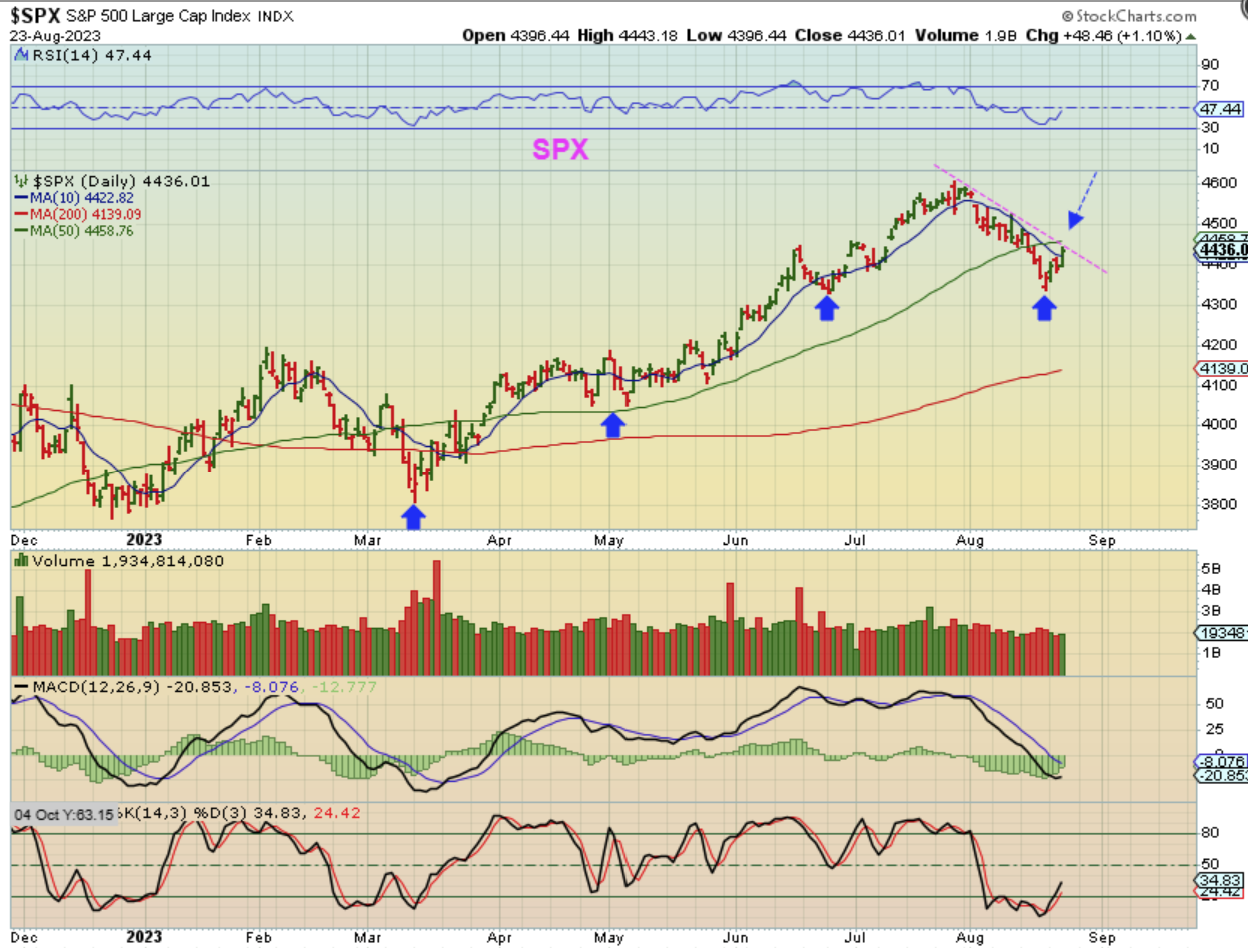
The SPX is right at the downtrend and 50sma, but it also closed easily above the 10sma and looks to be on day 3 of a new daily cycle. Once this gets above the 50sma, you could raise a stop there.
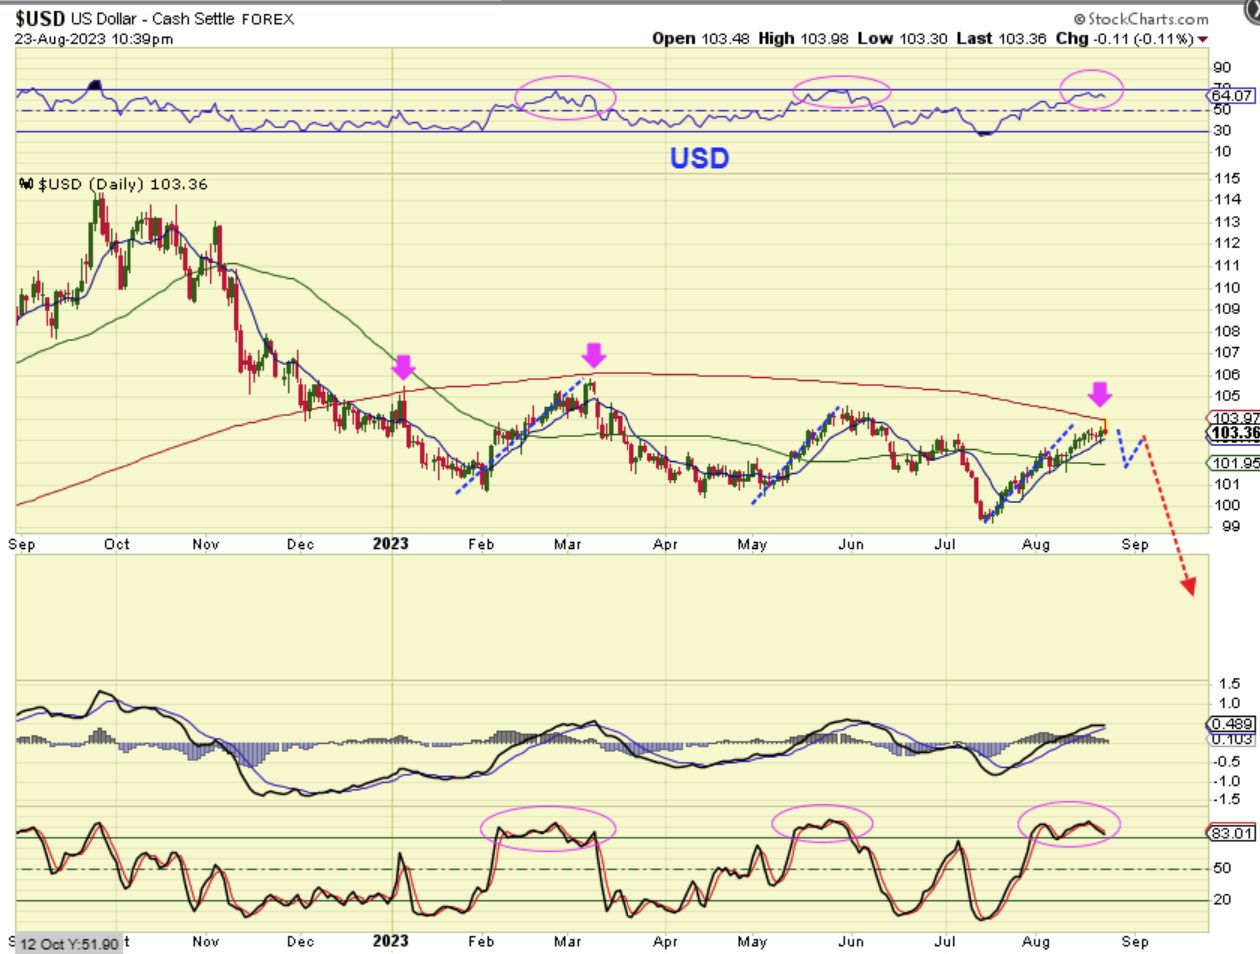
THE USD did continue higher but was rejected and pulled back. Please study the various areas of the chart that I have pointed out in past charts. I see this as a logical area to expect a dip into a dcl, but we’ll have to see if the Jackson Hole interview hurts or helps the USD. NOTE: WITH THE USE RUNNING HIGHER EARLY IN THE DAY, GOLD & SILVER RAN HIGHER TOO.
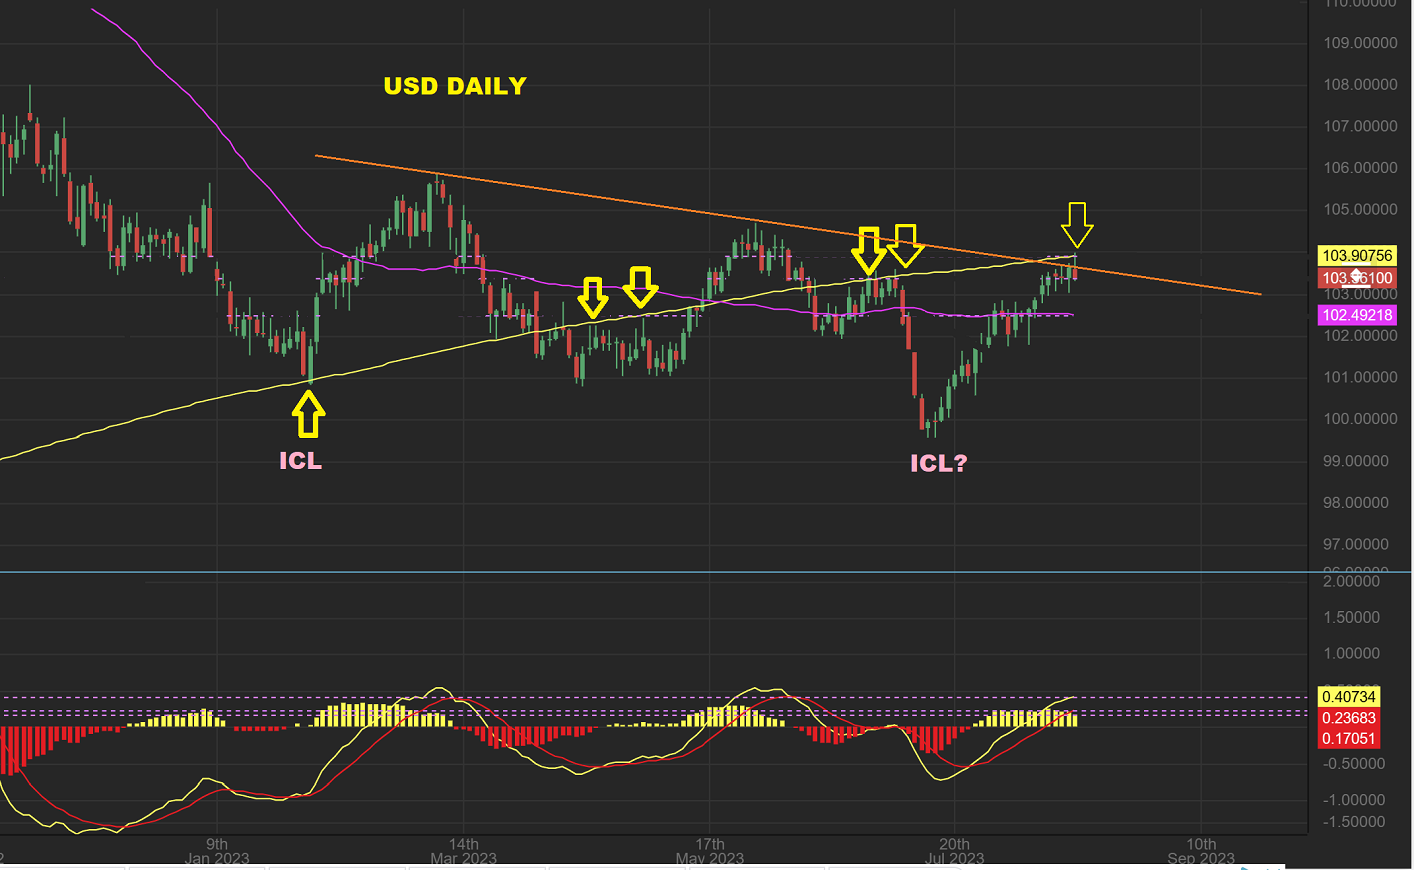
I was also using a commonly touched moving average for The USD in the past and it was tagged overhead yesterday too. I’m not ‘worried’ that we could have an ICL in place, because the first one shown on this chart ran the same as this one and then rolled over and died.
.
As mentioned, The USD ran higher on Wednesday and Gold & Silver ignored it. Gold and Silver ran higher and the Miners also were not up only 1-2% like they were on Tuesday. Instead they pushed higher out of their lows.
.
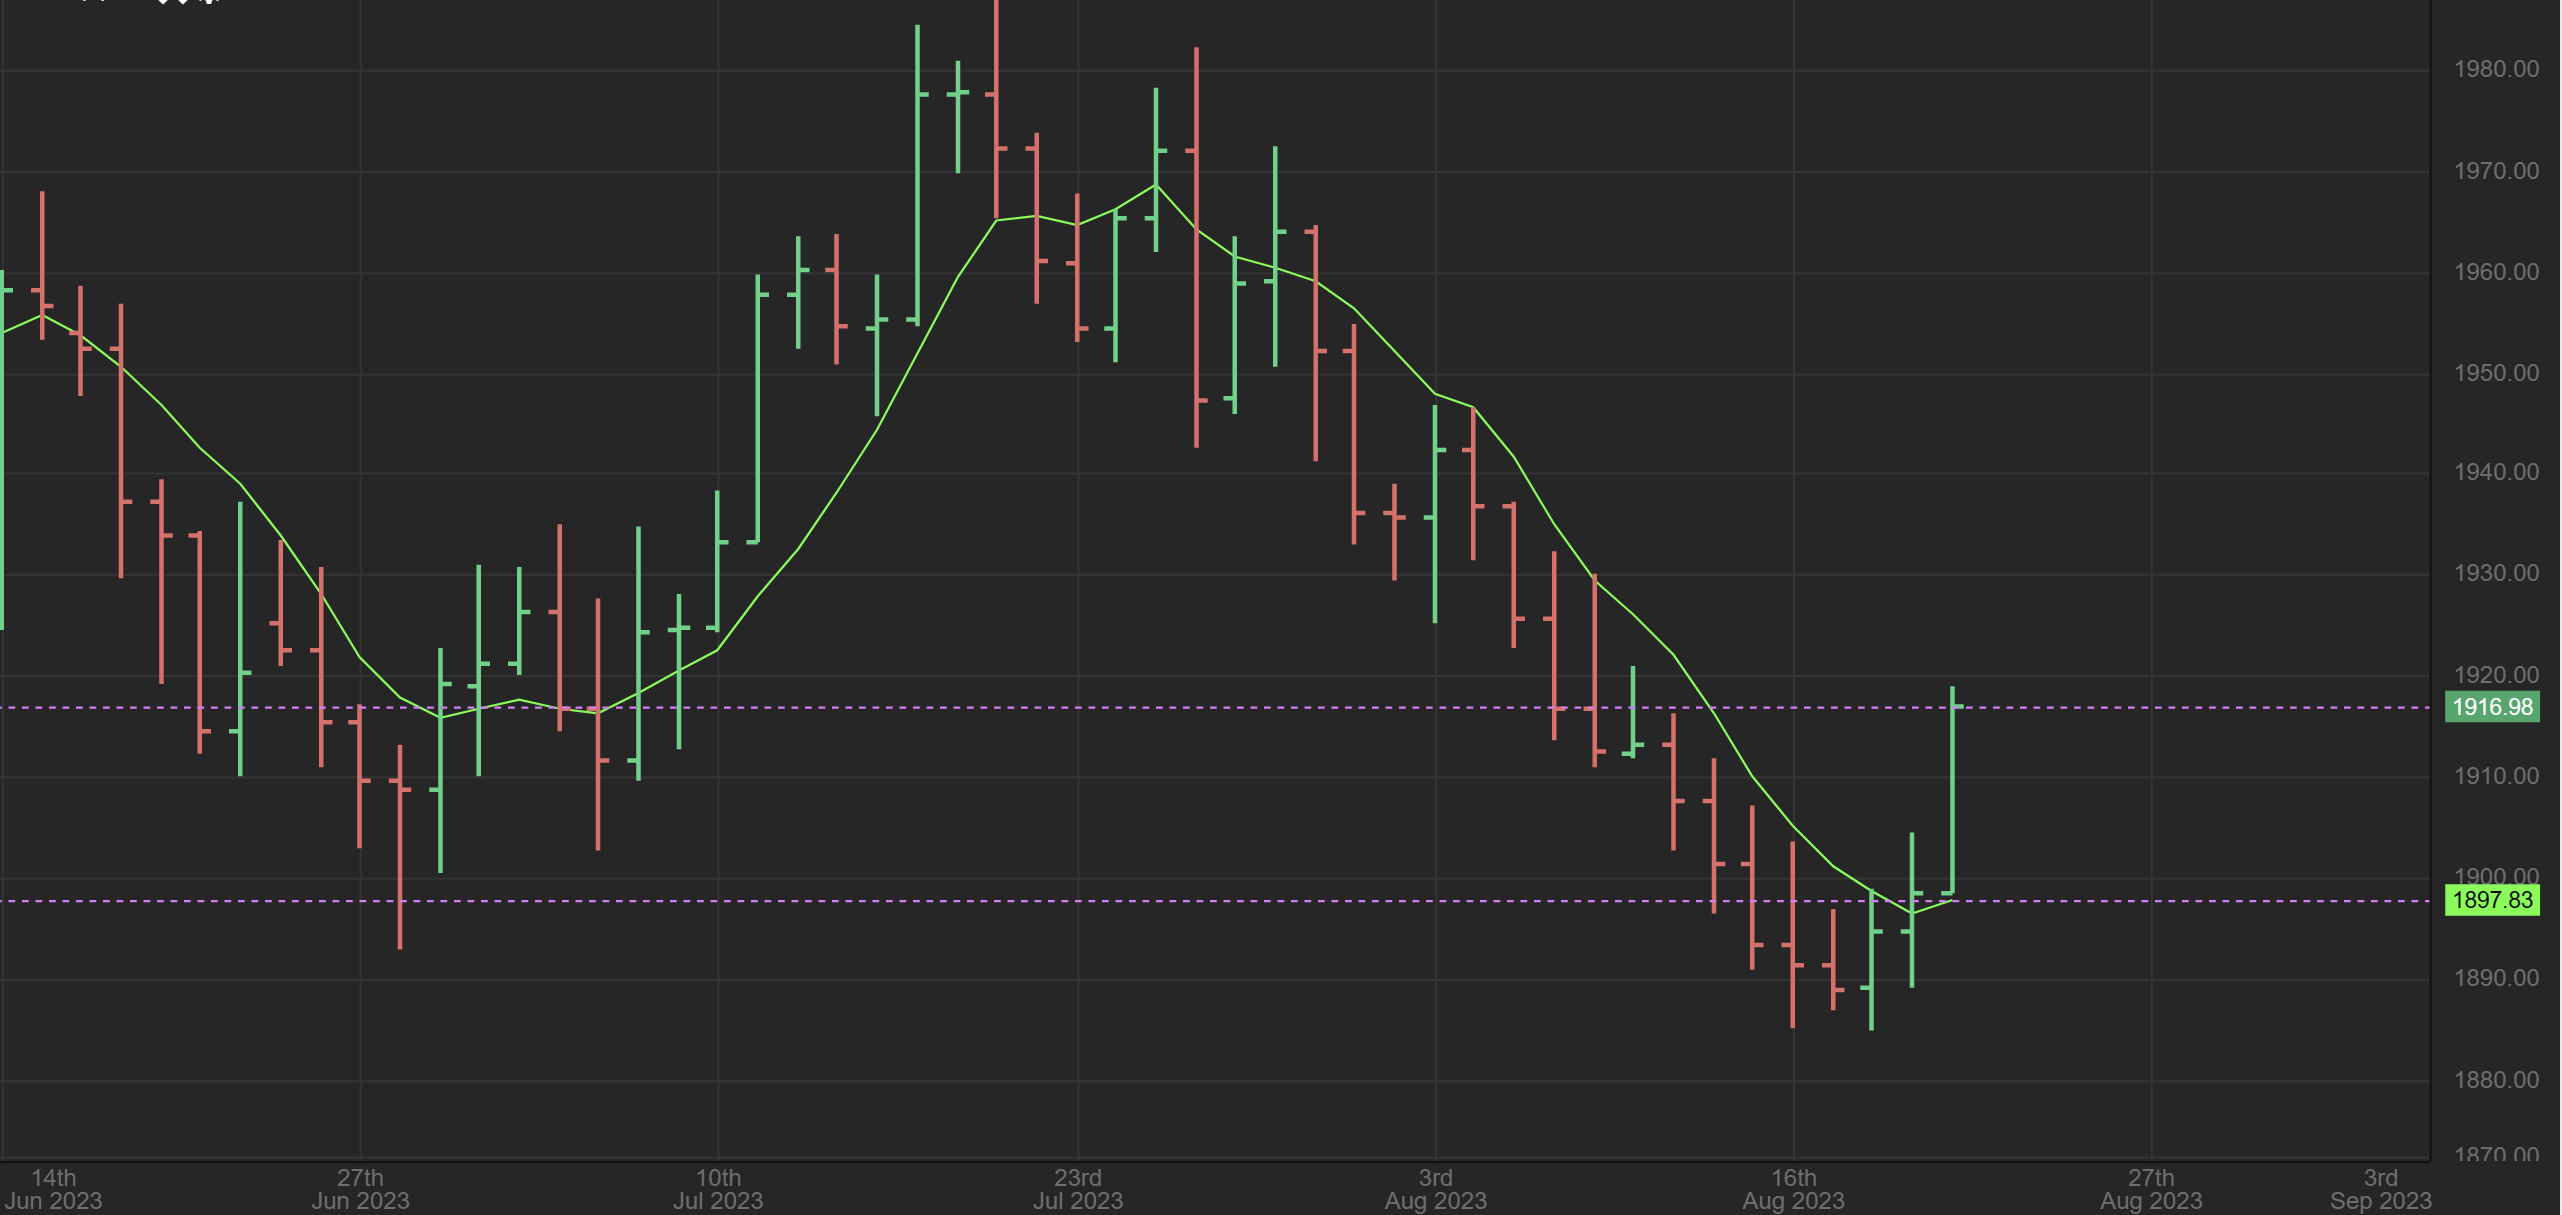
GOLD surged in the morning pre-market and did not pull back by 10 a.m., so I grabbed this chart and posted it. Why? We had been seeing Silver surge like this despite the USD strength, but Gold was delaying, so THIS was an important sign that the Precious Metals sector was bottoming.
.
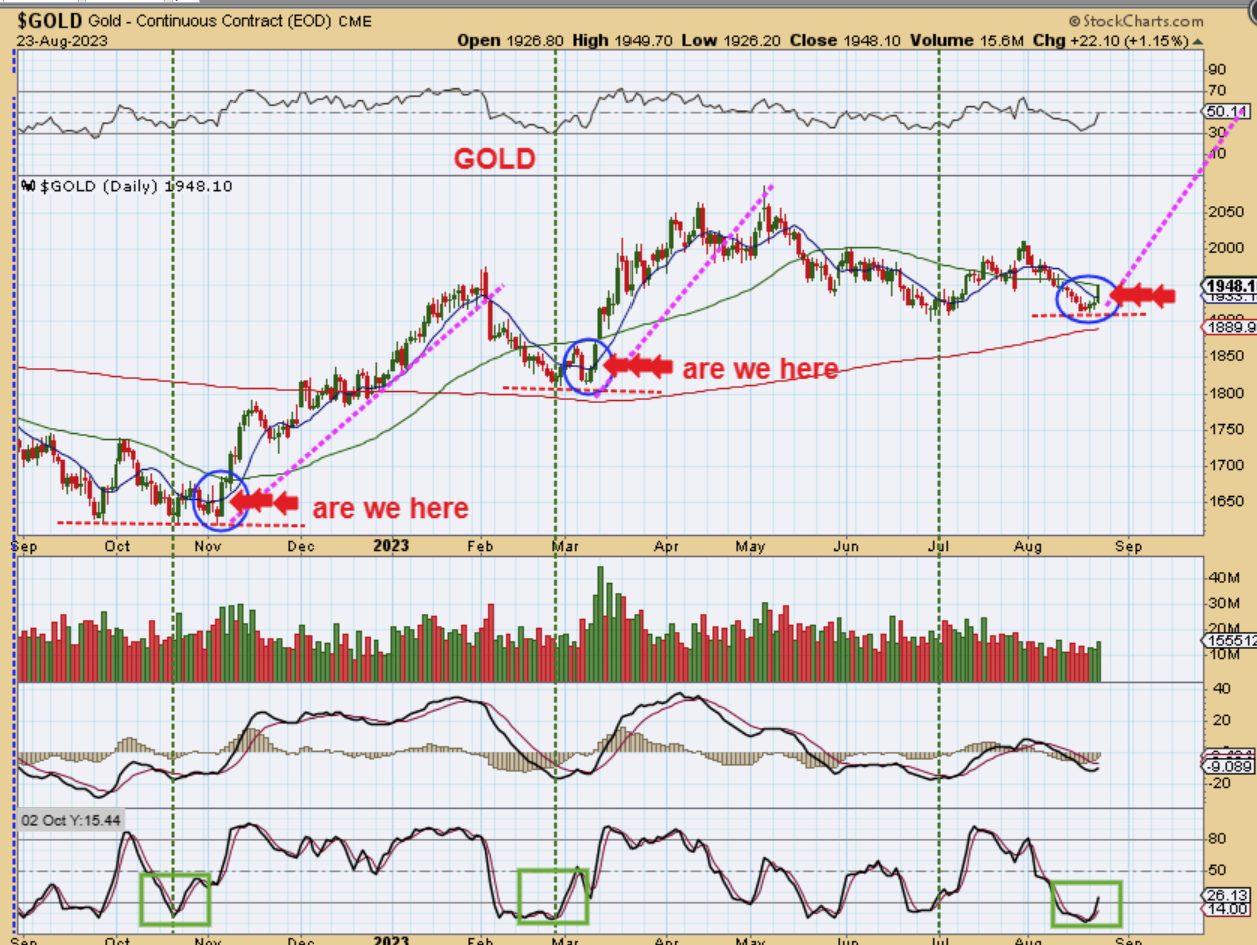
Looking at GOLD in the bigger picture, you want to view todays surge in the proper perspective. It can be a little choppy at the lows and we can get dips, but this is a buy and hold area for the most part, with the chance that this becomes a massive rally in Gold. Remember that…
.
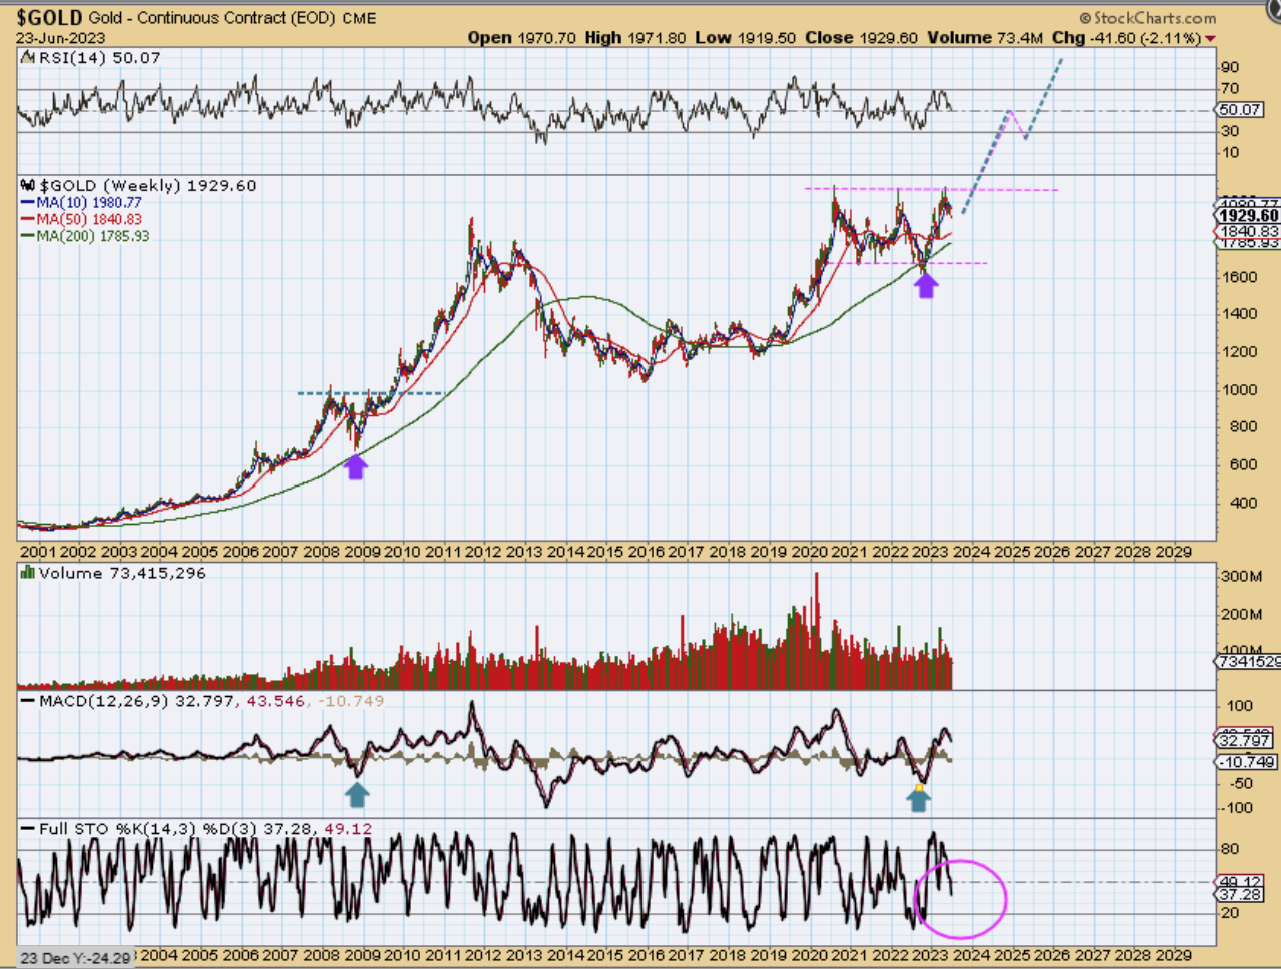
Remember that back in June I posted this chart to show that we were expecting this drop and then a massive rally starting with a run back to all-time highs, a breakout and then a continuation. If Gold does this, Miners should double and triple, so any choppiness now will be minor in the rear-view mirror later. I compared this run to the one out of 2008 lows.
.
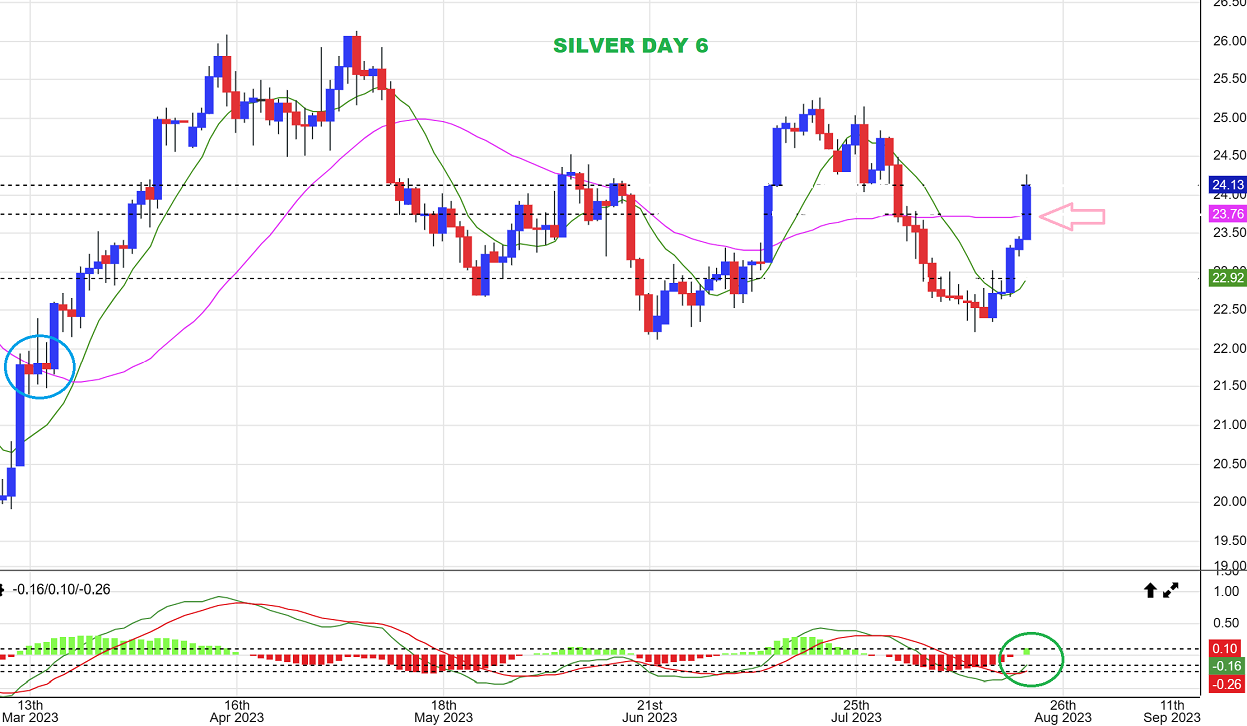
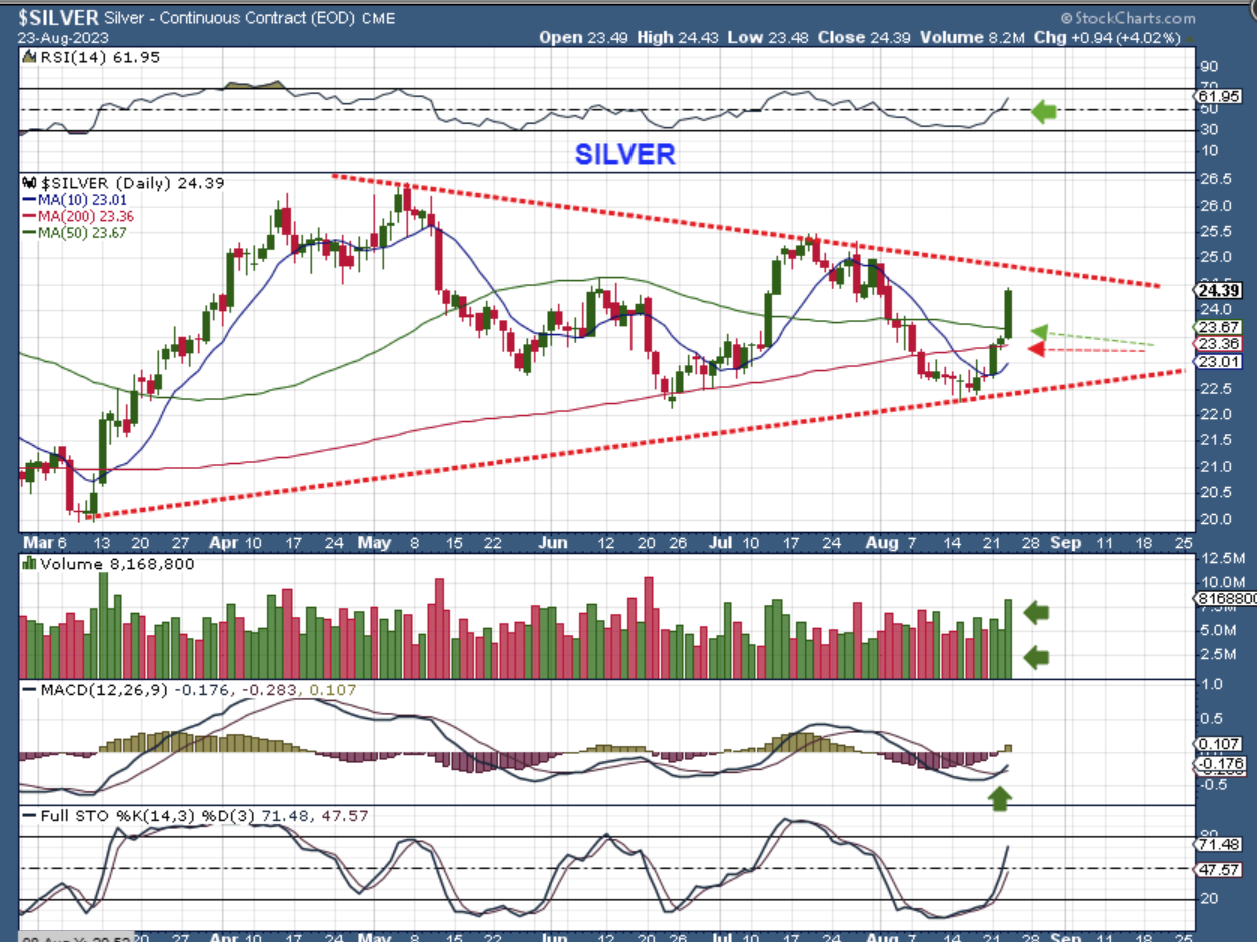
SILVER surged right through the 50sma, instead of the normal pause at resistance (see the blue circle too).
.
SILVER– If silver runs in a similar manner as it did in March, and so far it is running higher sharply, you do not want to be on the sidelines ‘afraid to trade’, or the risk is that this runs higher without you invested. At THAT point, it can get harder to enter a position too, with the thought that you’ll jump in and have to ride a pullback down.
,
This is the part that we all love & hate
.
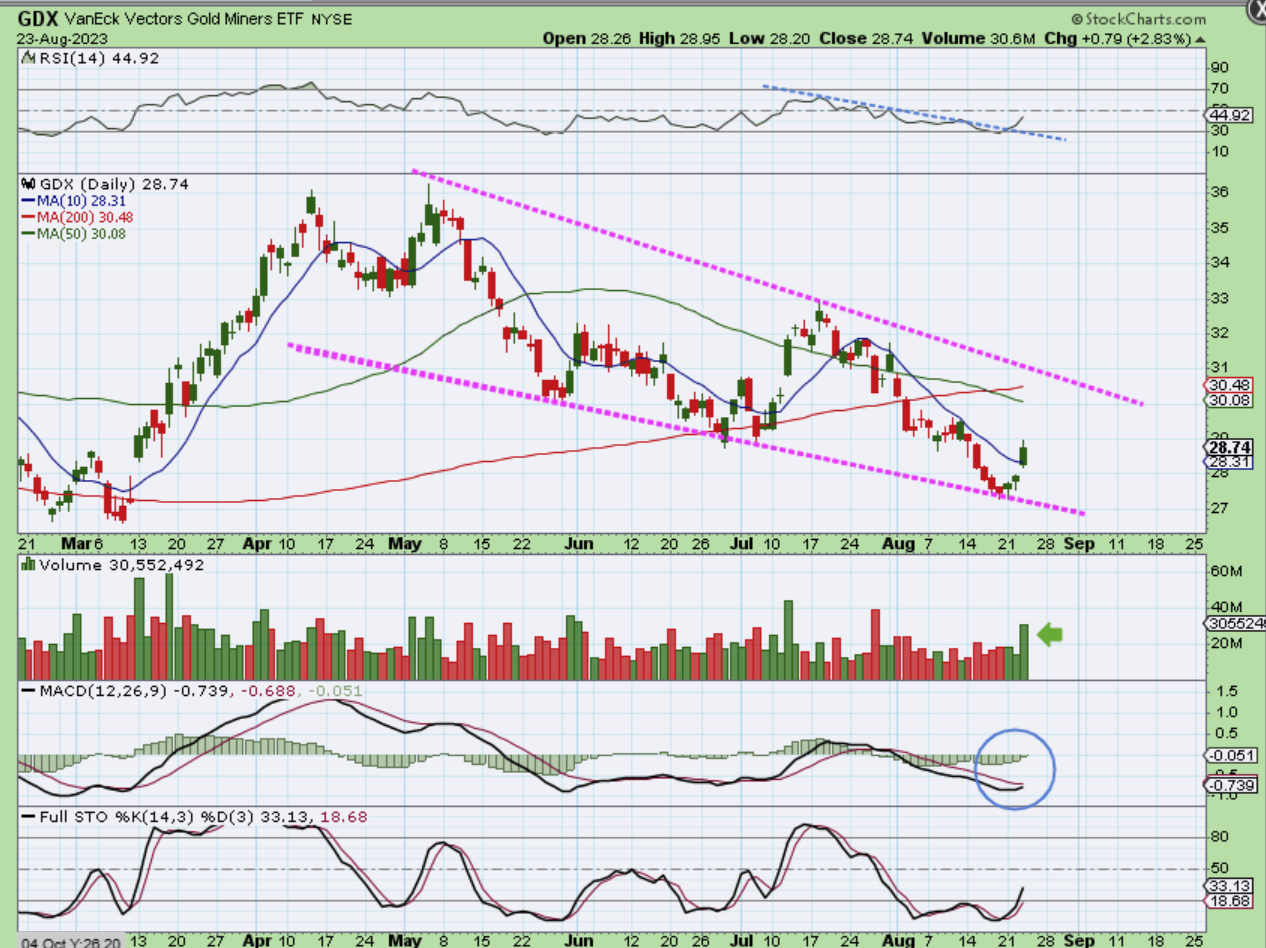
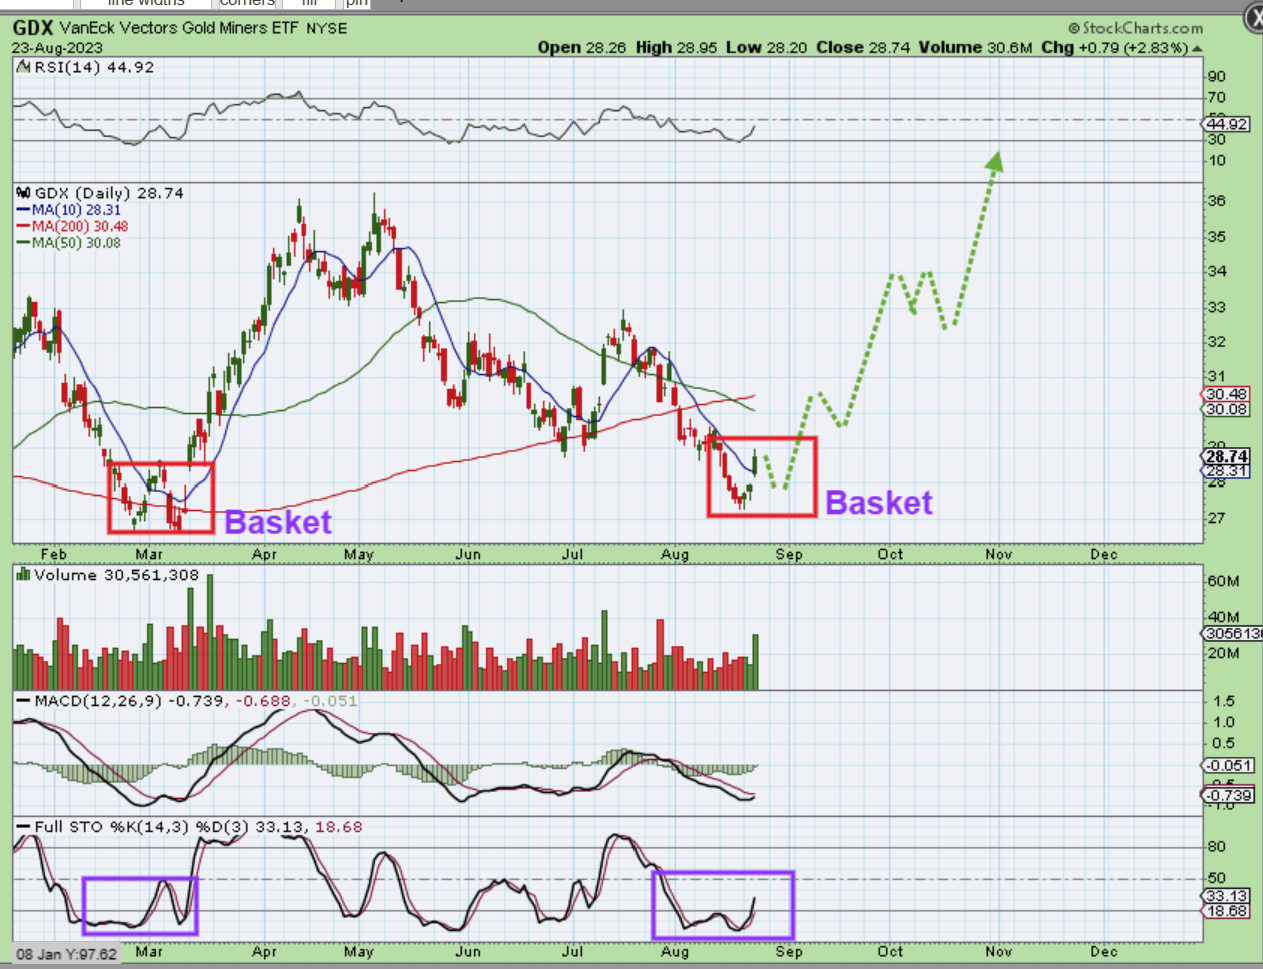
GDX joined the run higher, we Love that! GDX gapped open over the 10sma, and we Hate that! 🙂
.
When I look back at prior lows and I saw gaps in 2008, gaps in 2016, even gaps last March, I see that they never filled until later, so for now I am going to ignore that gap. That said, the answer to the $10,000 question is: “Yes Jimmy, that gap could fill if the Jackson Hole speech spooks the precious metals market.” – but again, that might not ever fill on this next run. The lows should be in place.
.
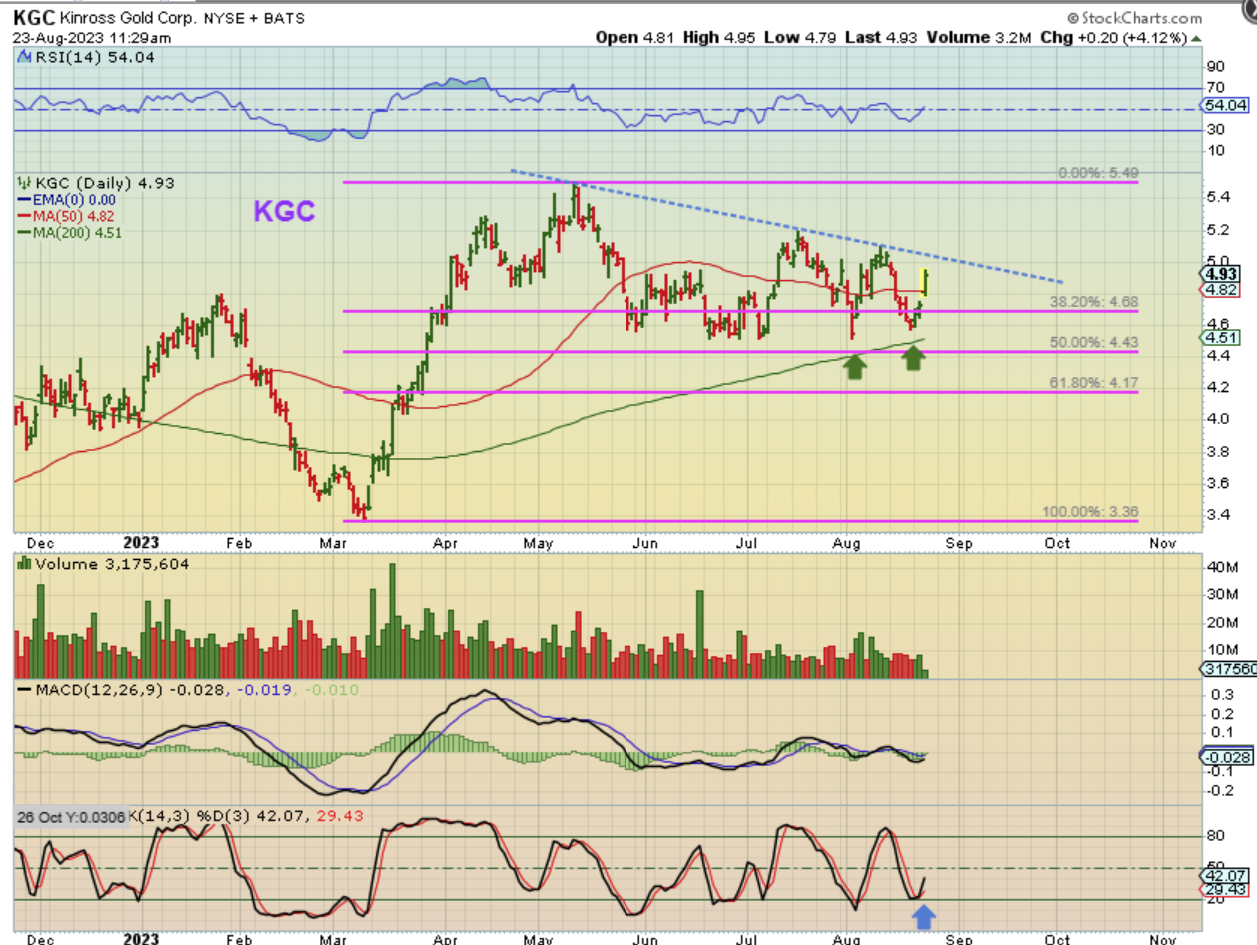
I was looking over the Miners and they are still at the lows, so the surge in Gold & Silver has given us a buying opportunity. Take a look at KGC as just one example:
.
KGC – The daily chart shows us a fairly organized drop during the recent sell off. It couldn’t reach the 200sma or the 50% fib level, so it showed strength in my opinion, during the recent selling that was pretty strong (ICL). What about the weekly chart?…
.
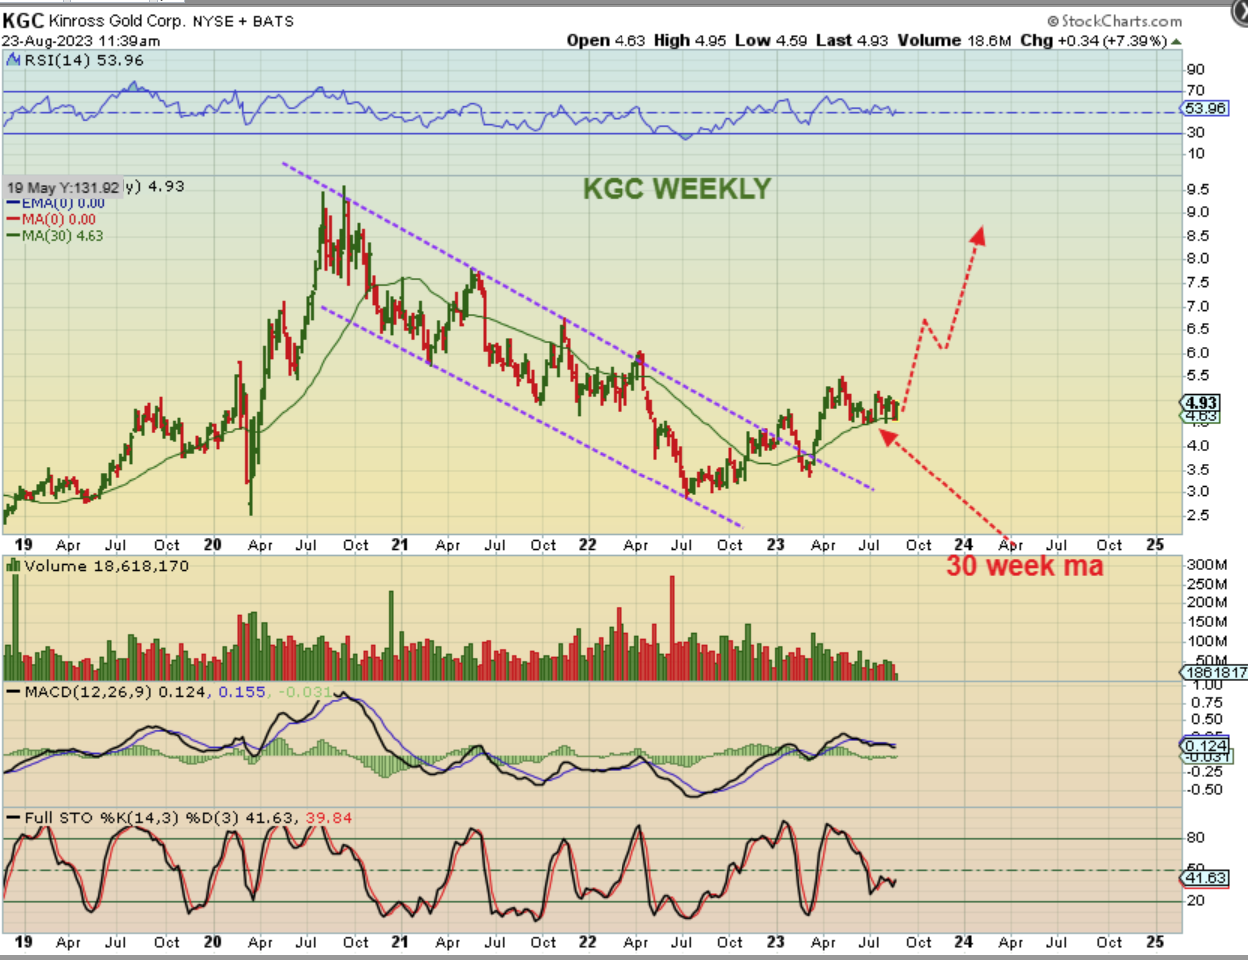
THE KGC WEEKLY price dropped and chopped along the 30 week ma, and that is considered bullish by technicians. It shows strength during a bull run, because the sellers didn’t all ‘bail out’ during the pull back. Stocks that have done this can be considered buy & hold candidates fairly safely.
.
At this point we have very bullish price action in the precious metals sector, especially with that surge in Silver. Now we are seeing Gold join in and the miners started to push higher this week too. We’ll see if the Data hinders this run at all, but we should, at this point, be seeing dips as ‘Buy the dip’ opportunities. Buying the dip will get easier over time, once this starts to run and people have more confidence in the lows, but we do want to be AT LEAST holding a small basket of miners here near the lows. Looking back later, we are often glad that we did.
.
Enjoy your Thursday trading!
.

