August 19th Weekend Report
I am leaving for the day and I do not have time to proofread this report if I want to release it Sunday morning, so please excuse any typos. I will proof read this later and if I find anything that didn’t seem clear, I will fix it. If you see something that isn’t quite clear, feel free to ask me in the comments or by email. Thanks!
.
SPX DAILY – I believe that the drop into the ICL has started. After losing the 50sma, we could see a dcl, a bounce, and another drop to the 200sma area for the ICL. This would take 1 more daily cycle to the next lower low. Note: If we just capitulate lower and flush straight down to the 200sma area, that could in itself be the ICL.
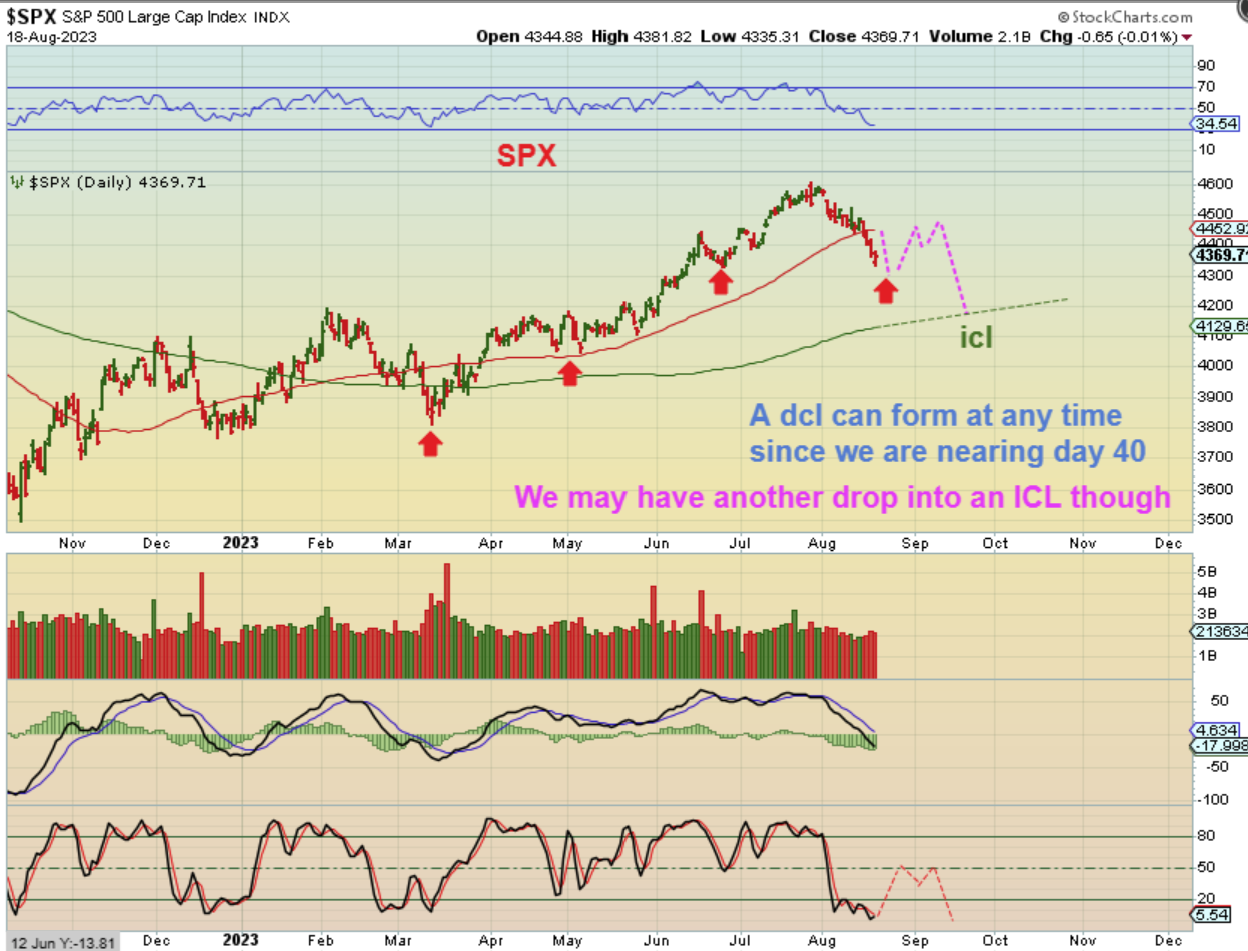
SPX DAILY – Take a look at the drop that we had in February into March in the Orange Box. That is an a-b-c style drop and I’m thinking that this is the kind of choppy drop that we may see here. THIS IS A DIIFERENT TAKE on it though. Here I am saying that with the daily cycle on day 38, and some lasting 50 days long, we could bounce and drop into day 50 as 1 large a-b-c style drop.
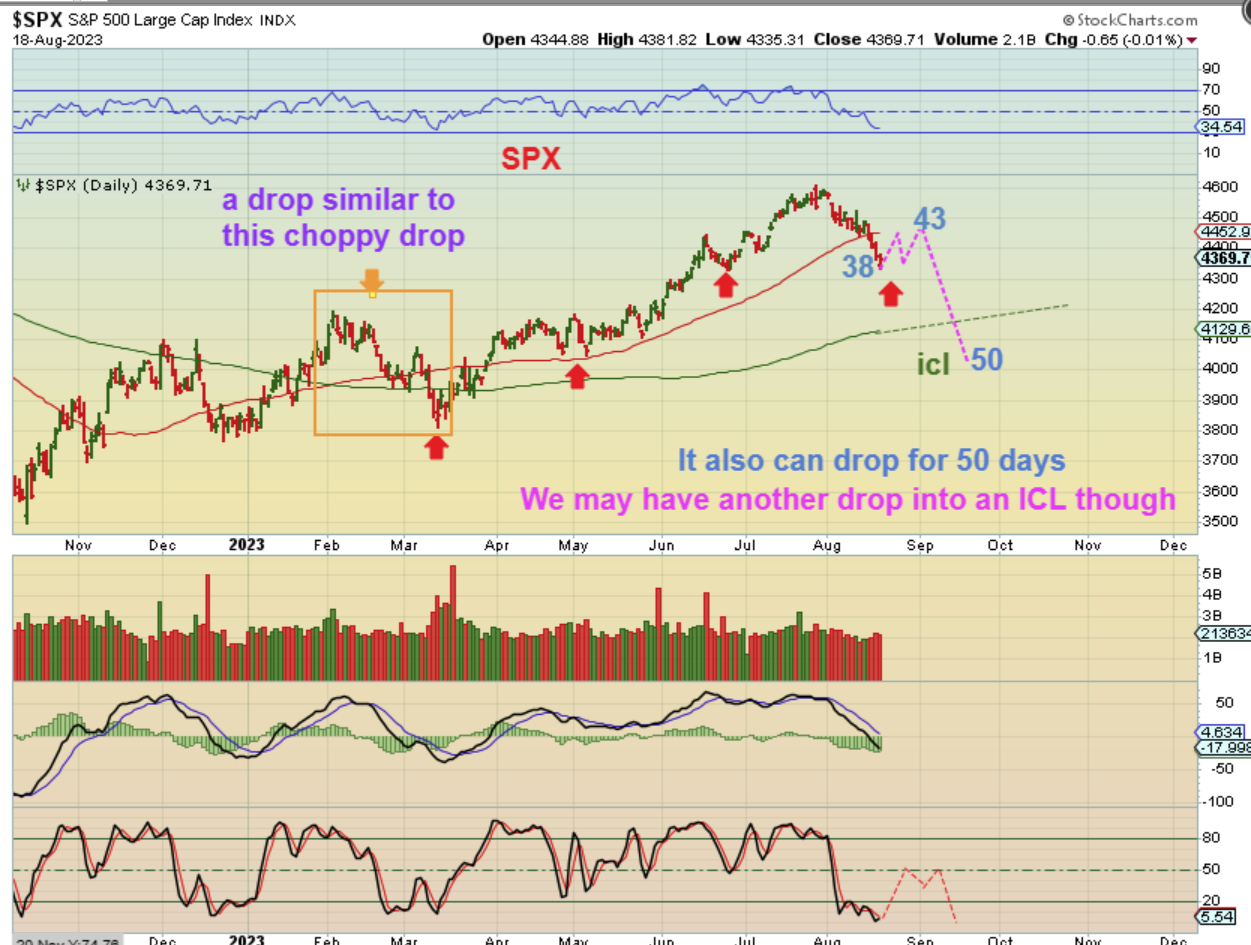
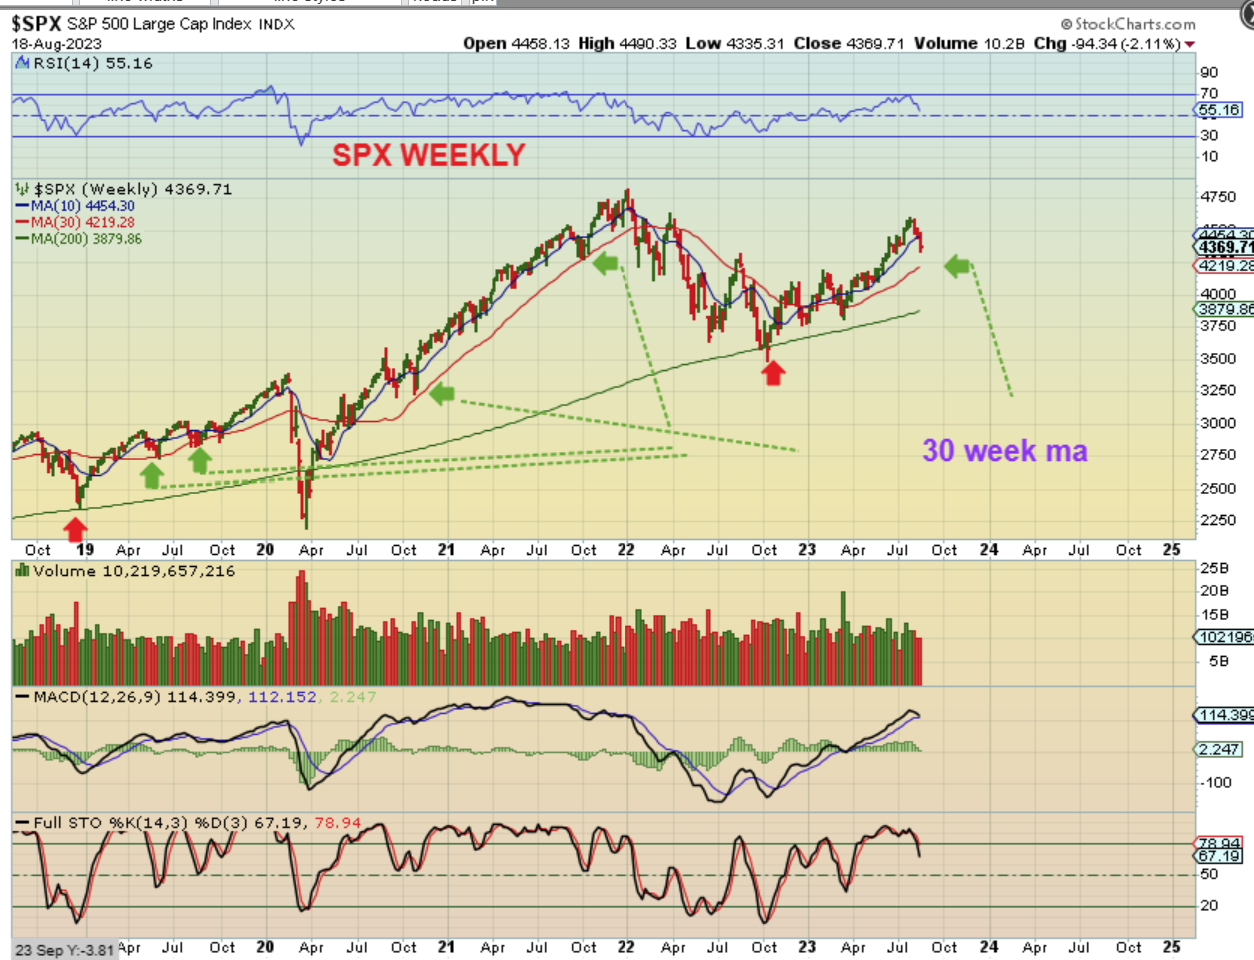
So with The SPX WEEKLY we see that it is possible to drop to the weekly red 30 week ma line. This happens often in a bull market pullback, as seen with the green arrows. It also can just flush straight down in a week or so, so keep that in mind.
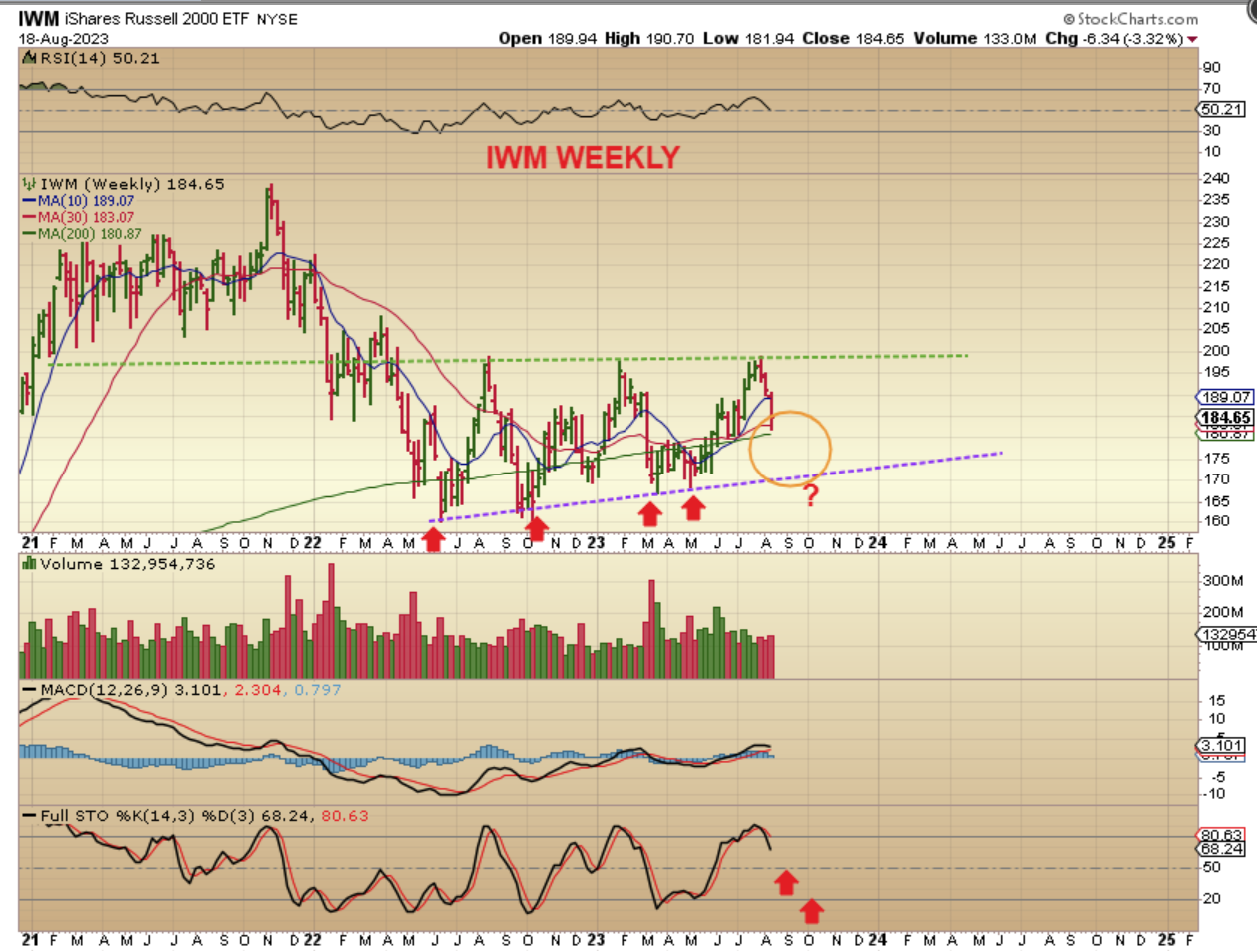
I just wanted to re-visit The IWM WEEKLY Chart, because it did not break out as hoped for. It remains rangebound and it seems likely that as the general markets seek out their ICL, the IWM could bounce and then drop to the lower upward sloping trend line. It was overbought on a weekly basis and the stochastics could fall to the 50% area or the lower range over time. Some of the early leaders and stocks that we watched that became strong runners like NKLA, JOBY, XPEV, and so on could set up for a nice price buy point in time.
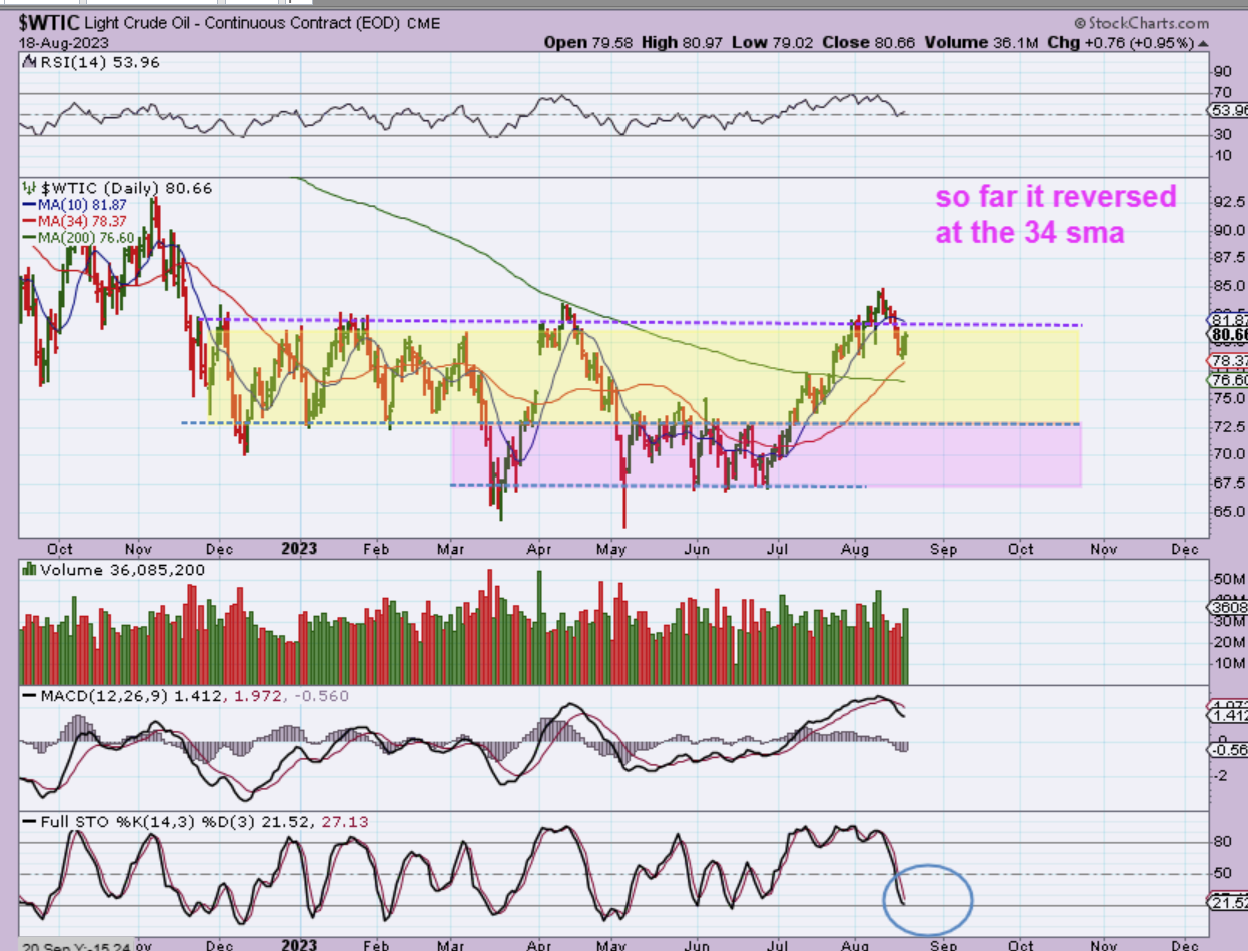
OIL DAILY – Oil was climbing up along that 10 or 13 sma, but when it lost it I called for a possible drop to the 50sma as a dcl. At this point Oil has reversed at the 34 sma, and that can become a support area in shallow pullbacks too. We are approaching oversold. Let me show you something else on the daily chart…
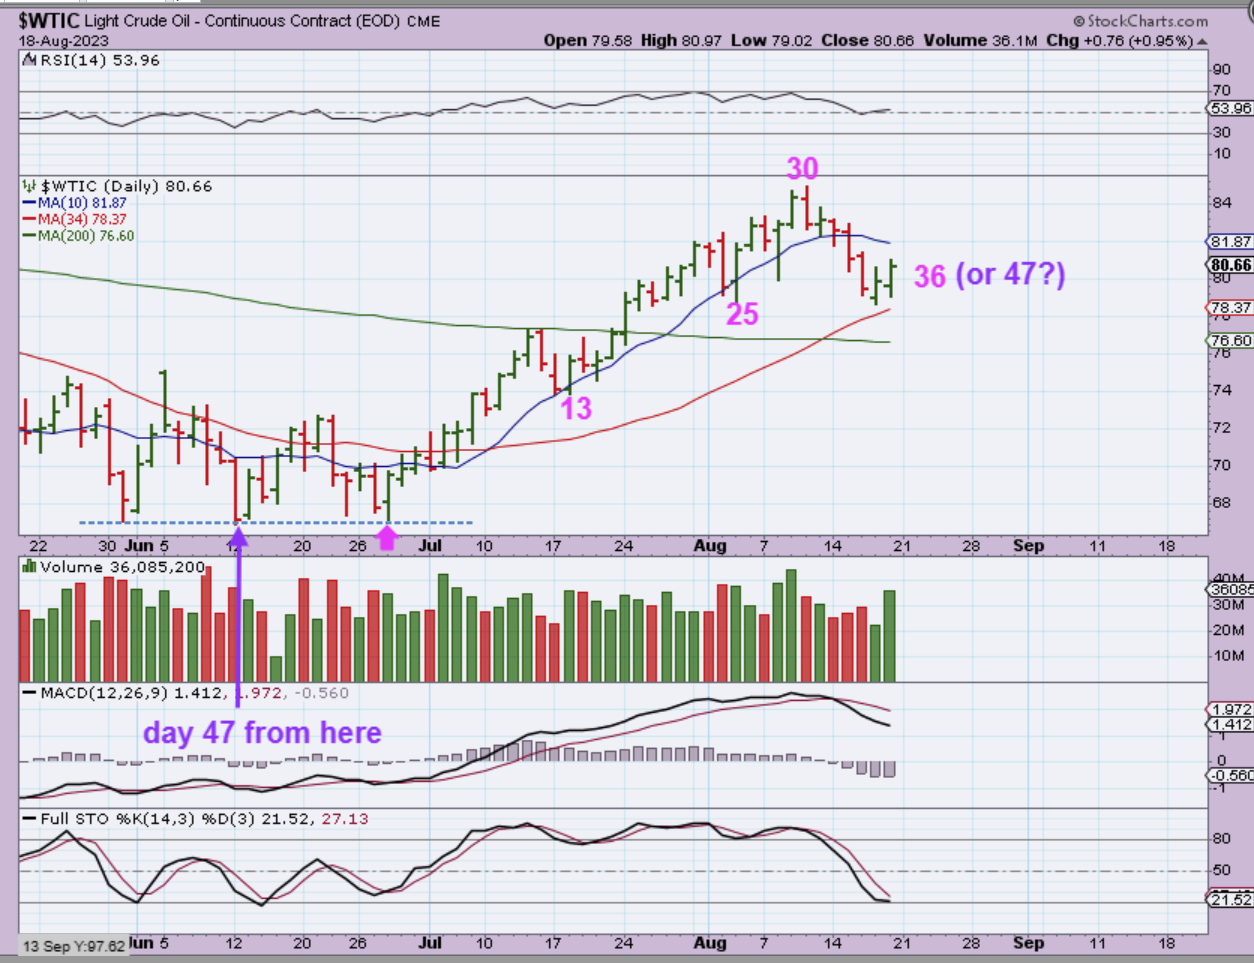
OIL DAILY – I actually think that this is day 47 (perfect timing for an Oil dcl) because I think that the last dcl was at the PURPLE ARROW, and not the MAGENTA ARROW. So this could very well be the dcl and a push above the 10sma will help us to confirm that.
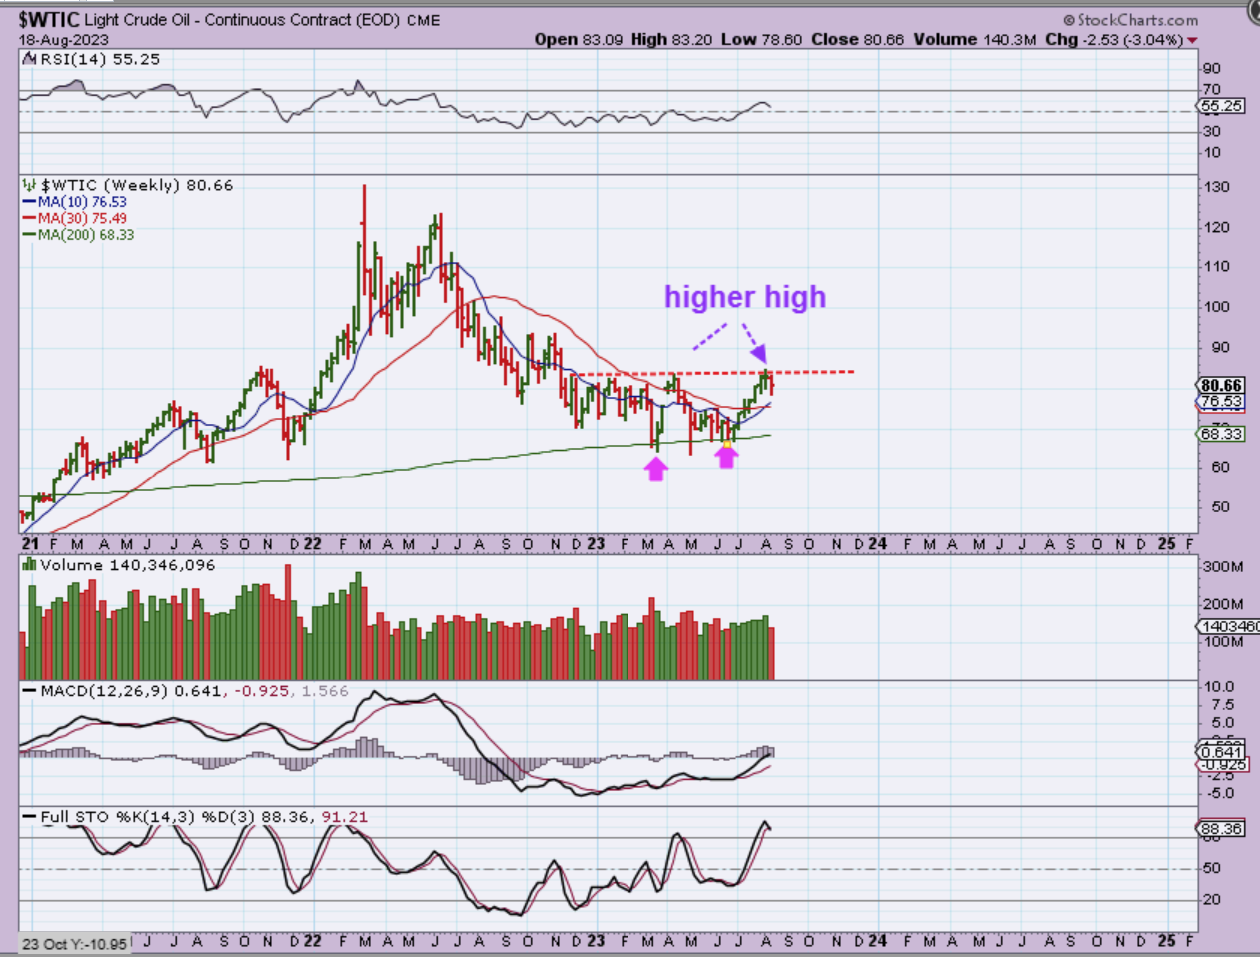
OIL WEEKLY – Oil was rejected at the overhead resistance. What concerns me here is 2 things:
1. We are at resistance and rolled back, and
2. This is overbought on a weekly basis and looks like it could drop further over time.
A breakout higher is a buy, but this may just chop and drift lower before it breaks out.
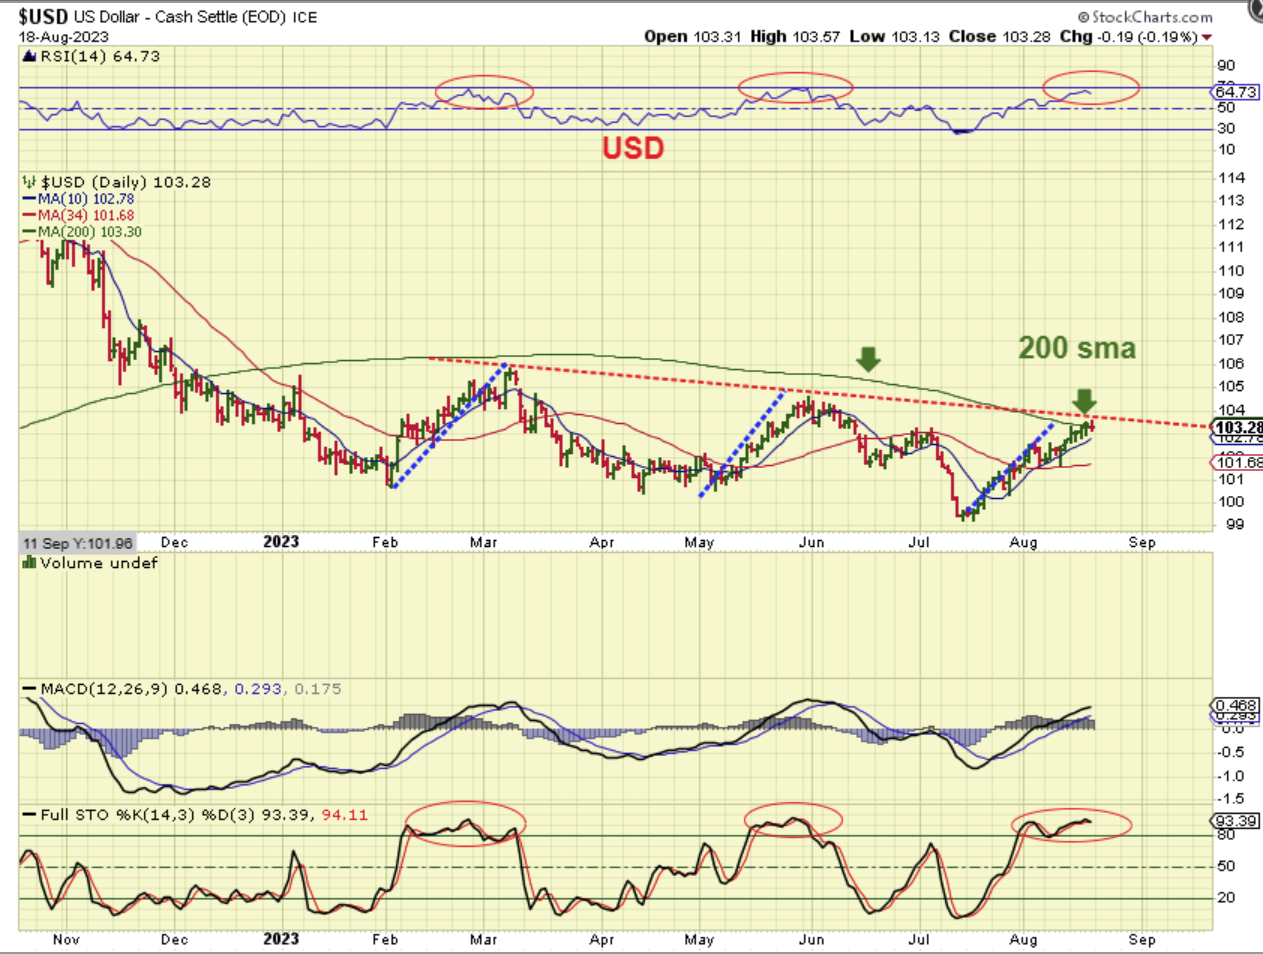
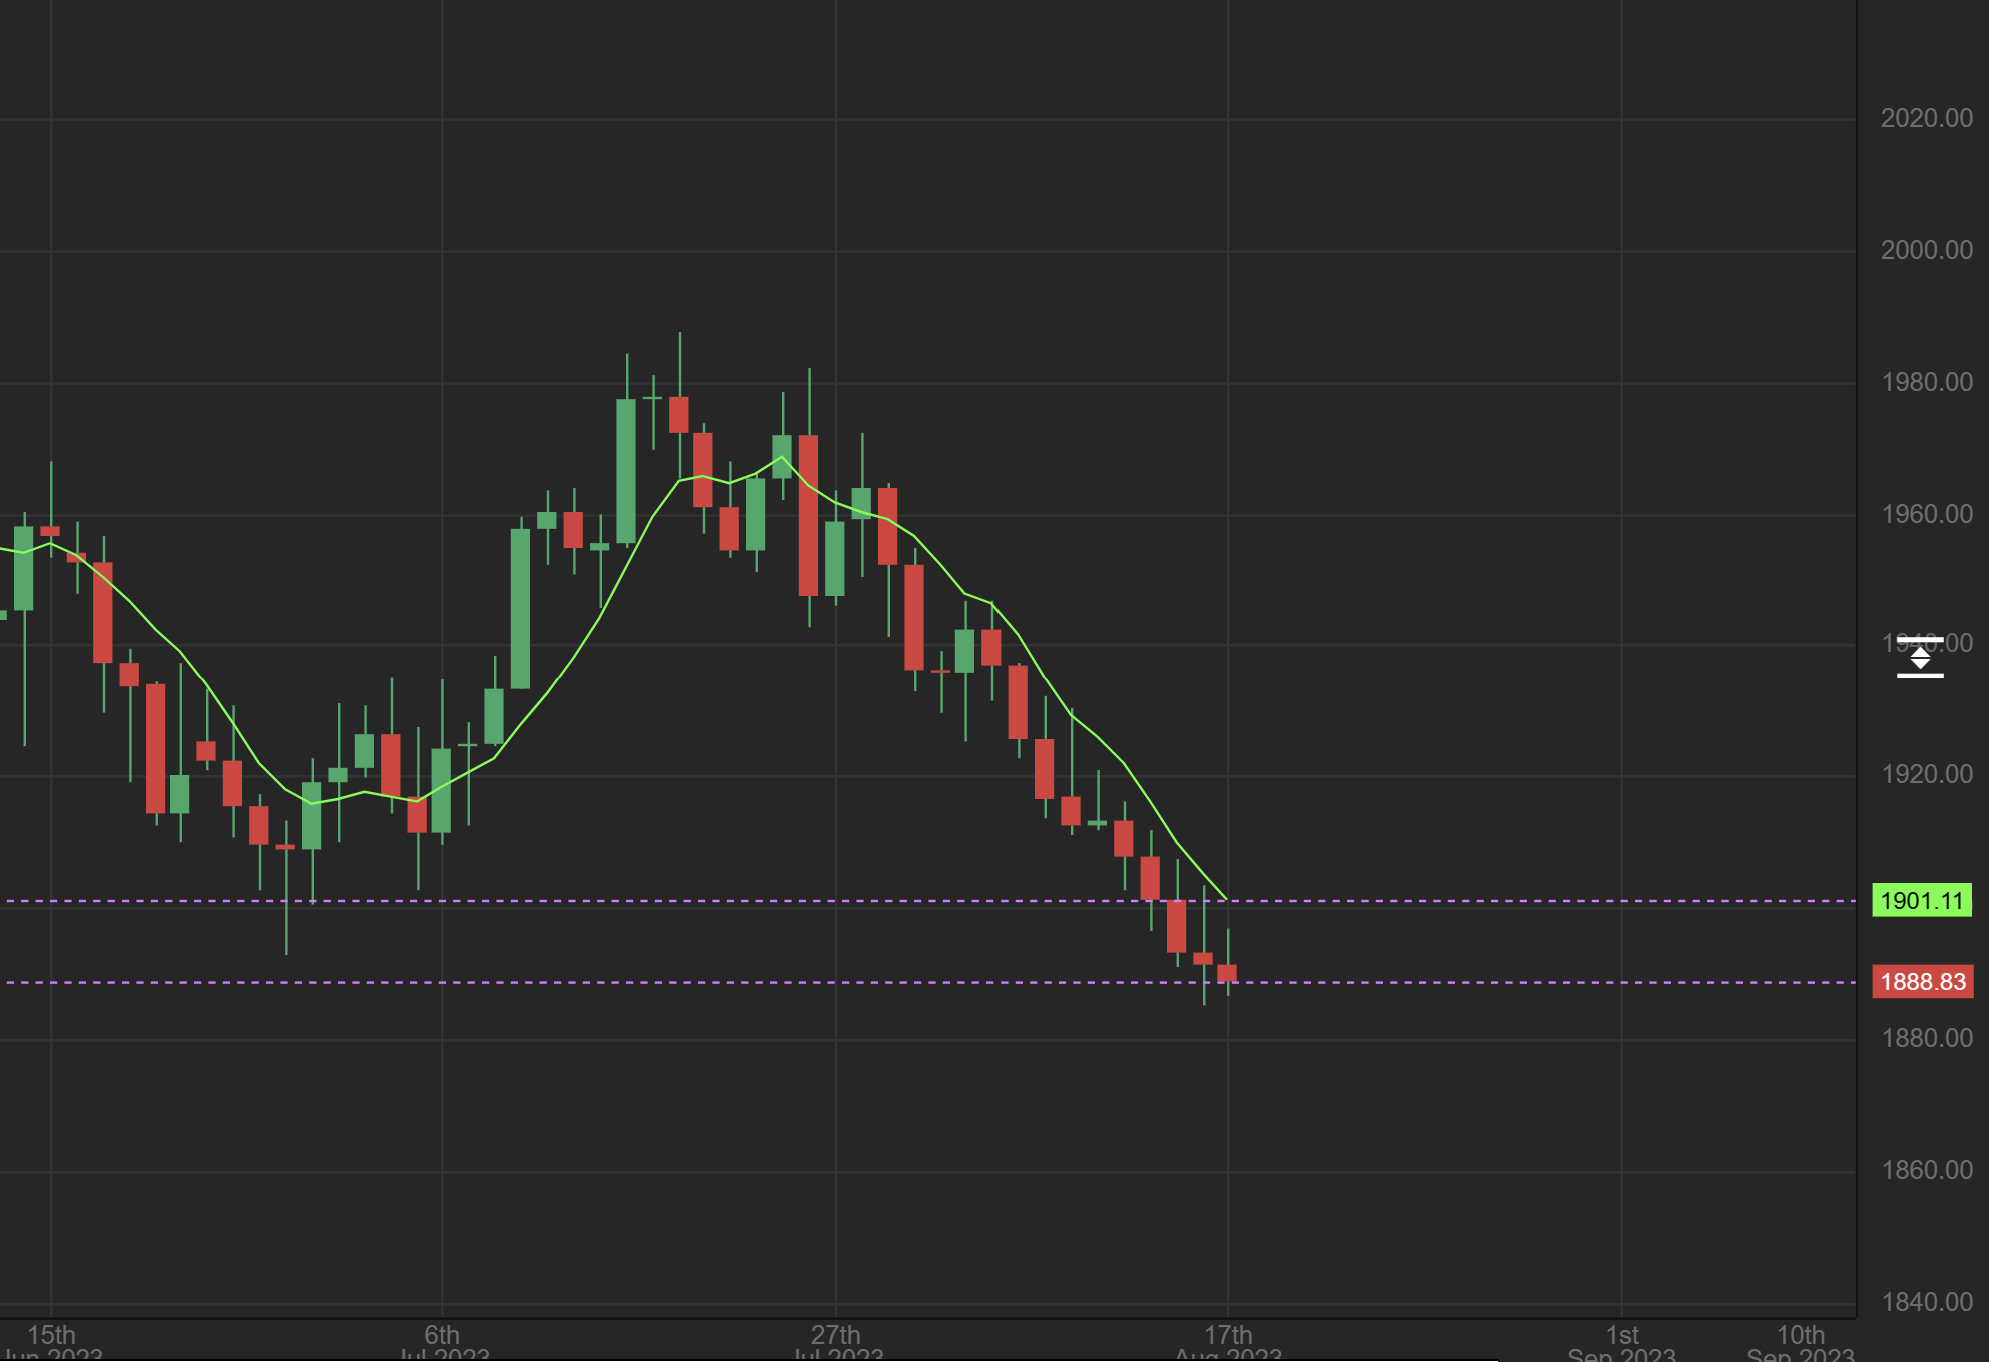
USD DAILY – The USD hit resistance, stalled, and has made a 3rd run to this area of about equal length. The RSI is also up near the prior highs. This is overbought and we are just hoping that this is ready to roll over from here for the 3rd time. We also know that Gold & Silver are well within the timing for a dcl.
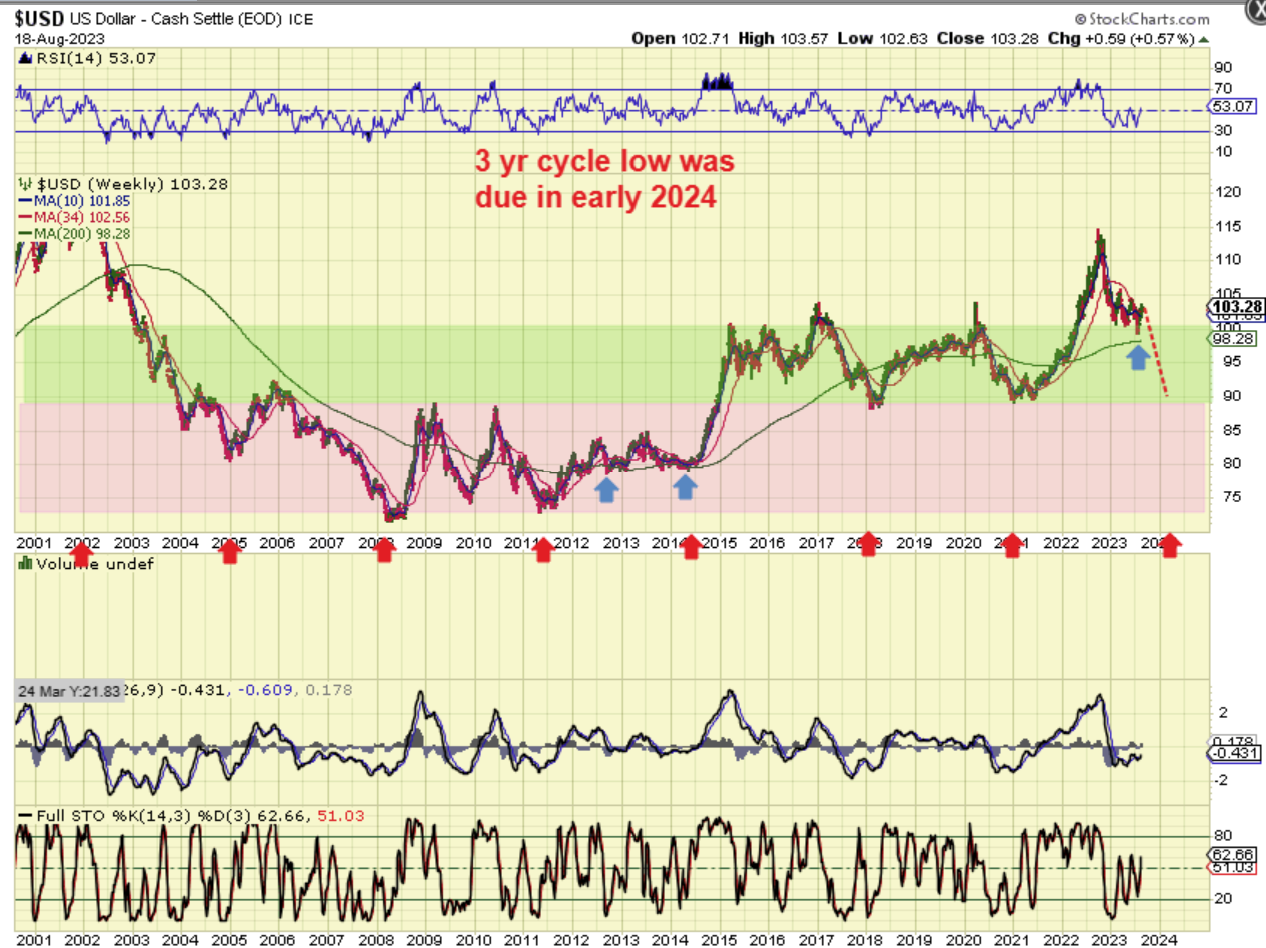
USD 3 YR CYCLE LOW – I have pointed out the reliability of the 3 yr cycle low and I pointed to this even before it started, so that is how reliable it can be. We should have 1 more leg down. That would send Gold higher. Could the USD have put in a reversal at the 200 weekly ma 6 months earlier than expected? I doubt it, but with all of the Fed rate hikes and intervention, I cannot rule it out completely. We need to just see how this plays out.
.
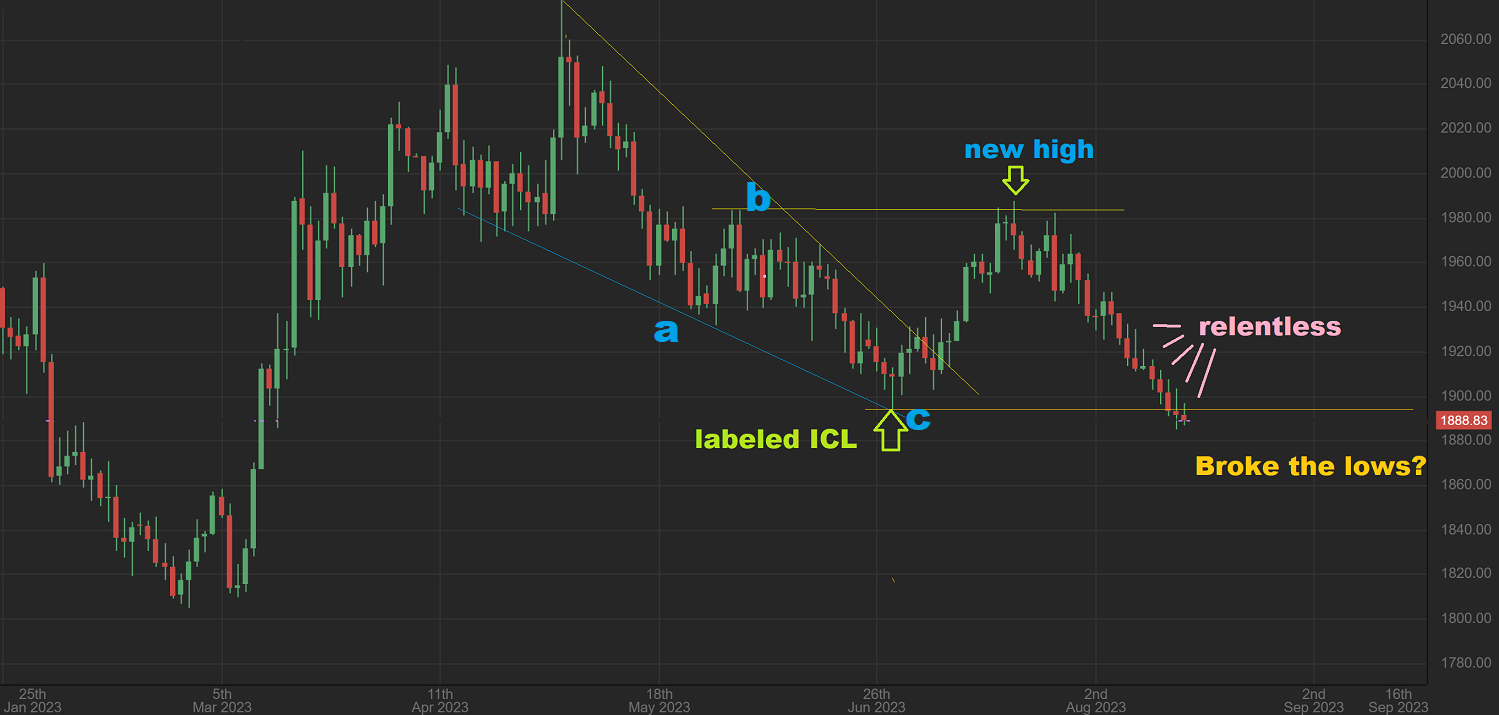
This is a tricky call so I wanted to go to the daily chart. Gold is selling off day after day after day relentlessly. That is often what we see in an ICL sell off. Didn’t we already have the ICL in June? Well, we had all of the characteristics of an ICL, so it would seem so, but this may be a shake out. Let’s discuss the appearance of a June ICL…
.
GOLD :
1. We would look for an a-b-c type of a sell off. We had it.
2. We look for a trendline break and move to a new high above the May highs (b). We had it
3. That was a move over the 50sma (not shown) , so it was a bullish move out of the lows.
4. However now we have a break of those lows IN THE FIRST DAILY CYCLE? Is that due to too much Fed Rate hike and a strengthening of the USD? Maybe.
.
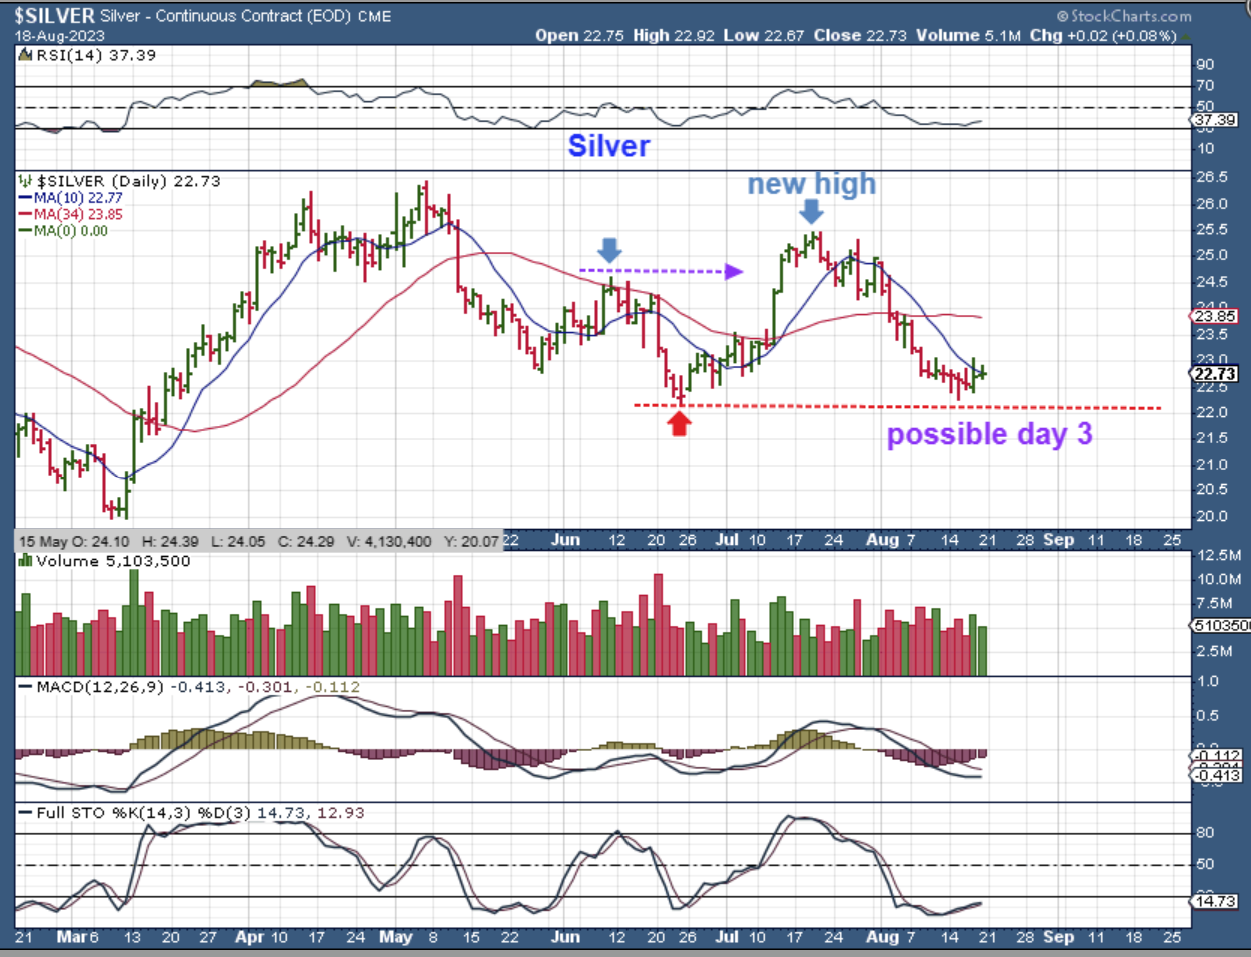
GOLD (Same Chart) – Right now Silver has not broken the June lows and looks like it may not. last year you may recall that Silver bottomed first on late August 31, and Gold bottomed 1 month later. Did that just happen again? Maybe, or we may have had the June ICL in Gold and now a shake out. It is very hard to say, but …
.
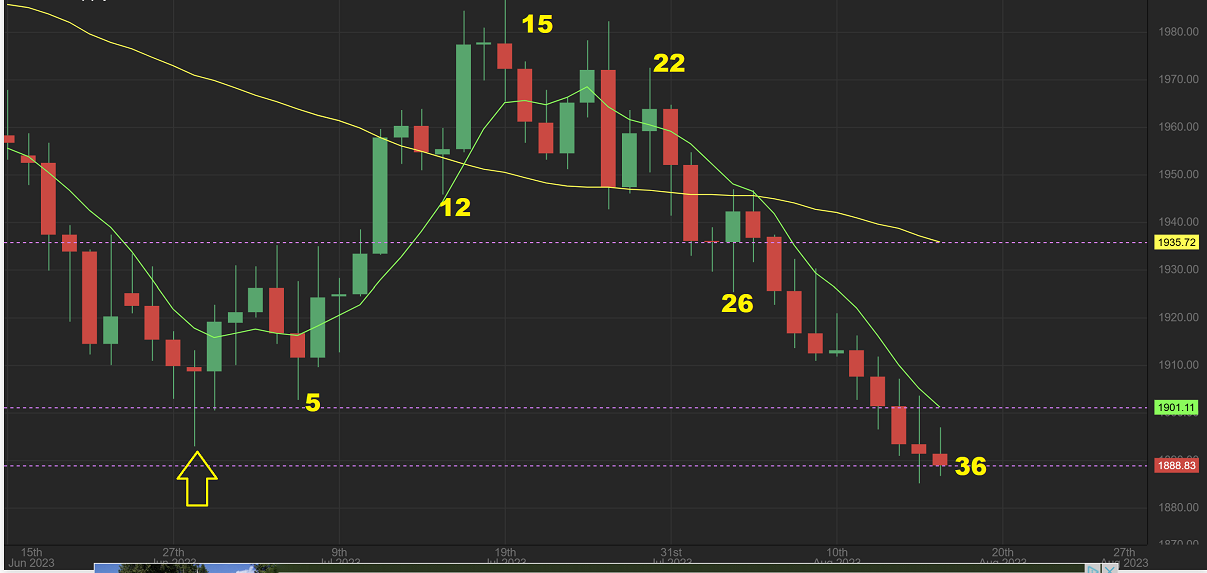
As you can see, this is now late in the daily cycle on day 36 and we are due for a dcl immediately. If Gold rises it should be viewed as a buy for Miners and Silver does still look like it will enter the 2nd daily cycle, so I would watch Gold at the 50sma (yellow line) in the coming weeks and see how it acts there. Again, at this point I feel that we have an ICL ( either counted at June or here), and we have to then let this unfold an see how that takes place. Stepping back…
.
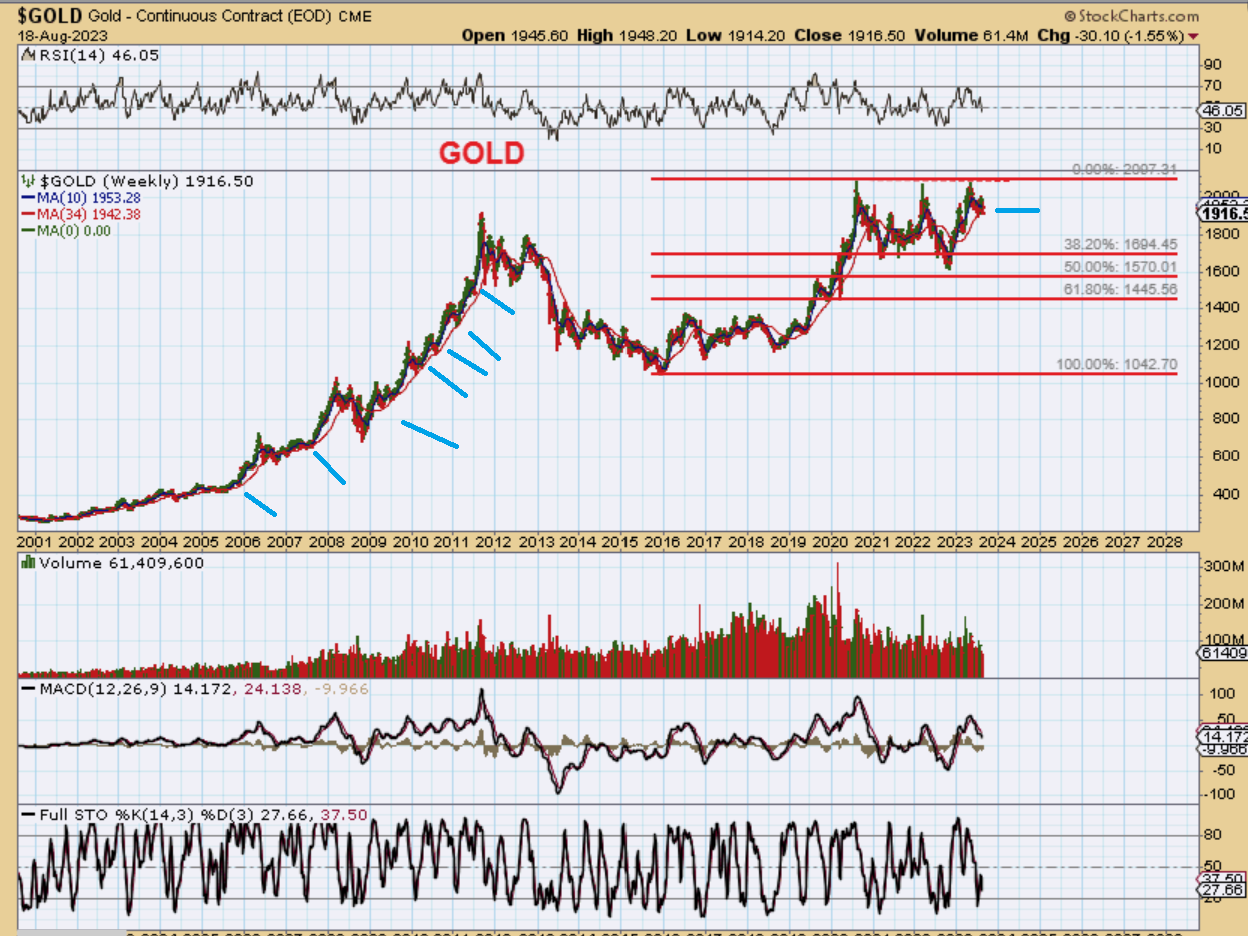
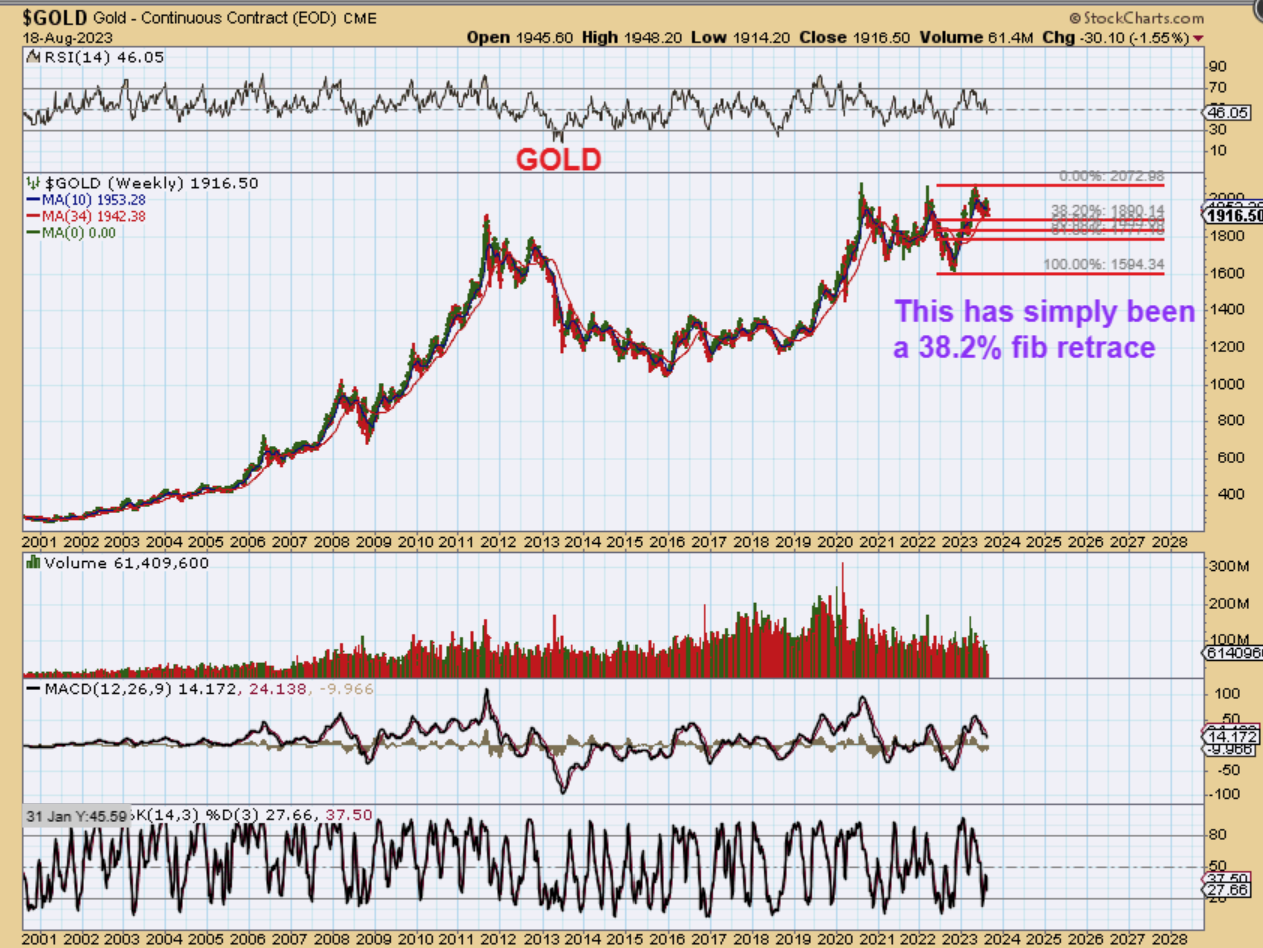
Stepping back we can see that GOLD in the big picture is still a bullish set up and this recent tag of the 34 weekly ma area is normal at ICLs.
.
GOLD has only pulled back 38.2% off of the highs and that is considered Bullish or strong (so far).
.
SILVER DAILY – As I mentioned above, Silver may have bottomed ahead of Gold again, because it refuses to break the lows so far. We are late in the count for a dcl and this is possibly already on day 3 as it hangs above the recent swing low. This chart has the same ICL characteristics that formed in June with a ‘new high’ and a ‘downtrend break’,etc. Silver DOES look set up to run higher next week.
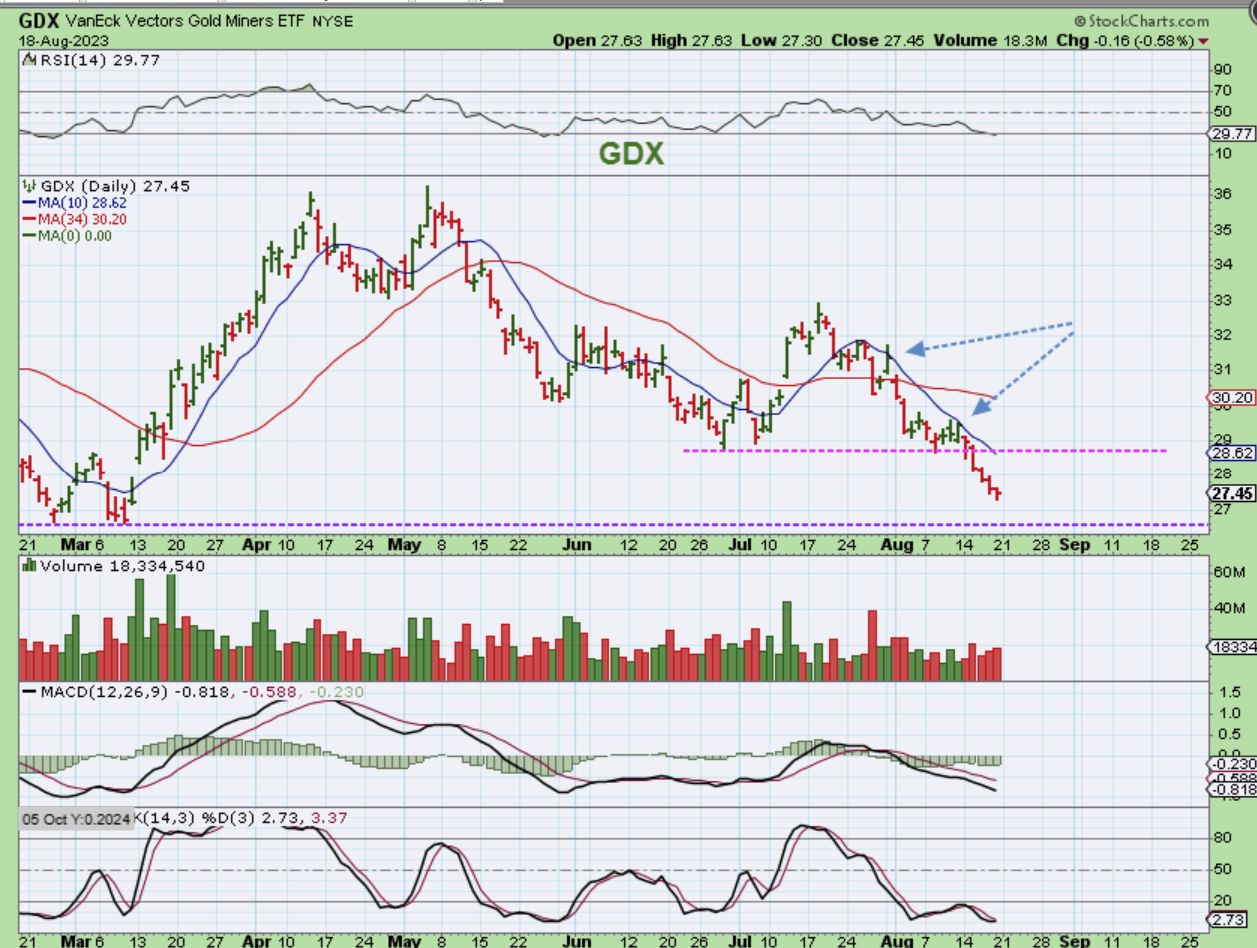
GDX is just selling off in an exaggerated manner and is very oversold. When this kind of a sell off takes place we mentally begin to think that
– This will never rise again,
– Buyers will never want this piece of junk, and
-‘There is something very wrong’,
but I have seen and had those feelings in the past and then suddenly witnessed a strong short covering rally that follows immediately after…
.
GDX – I am actually thinking that this will rally next week, so let’s wait and see how that plays out. This was day 35 and it is late in the daily cycle count and oversold. A move above the 10sma is a shake out recovery and can be viewed as a buy. I might use the 8 ema as a tighter fit and buy a break of that. I do own AG as a Silver Miner currently and EXK and HL look to possibly be bottoming with Silver last week.
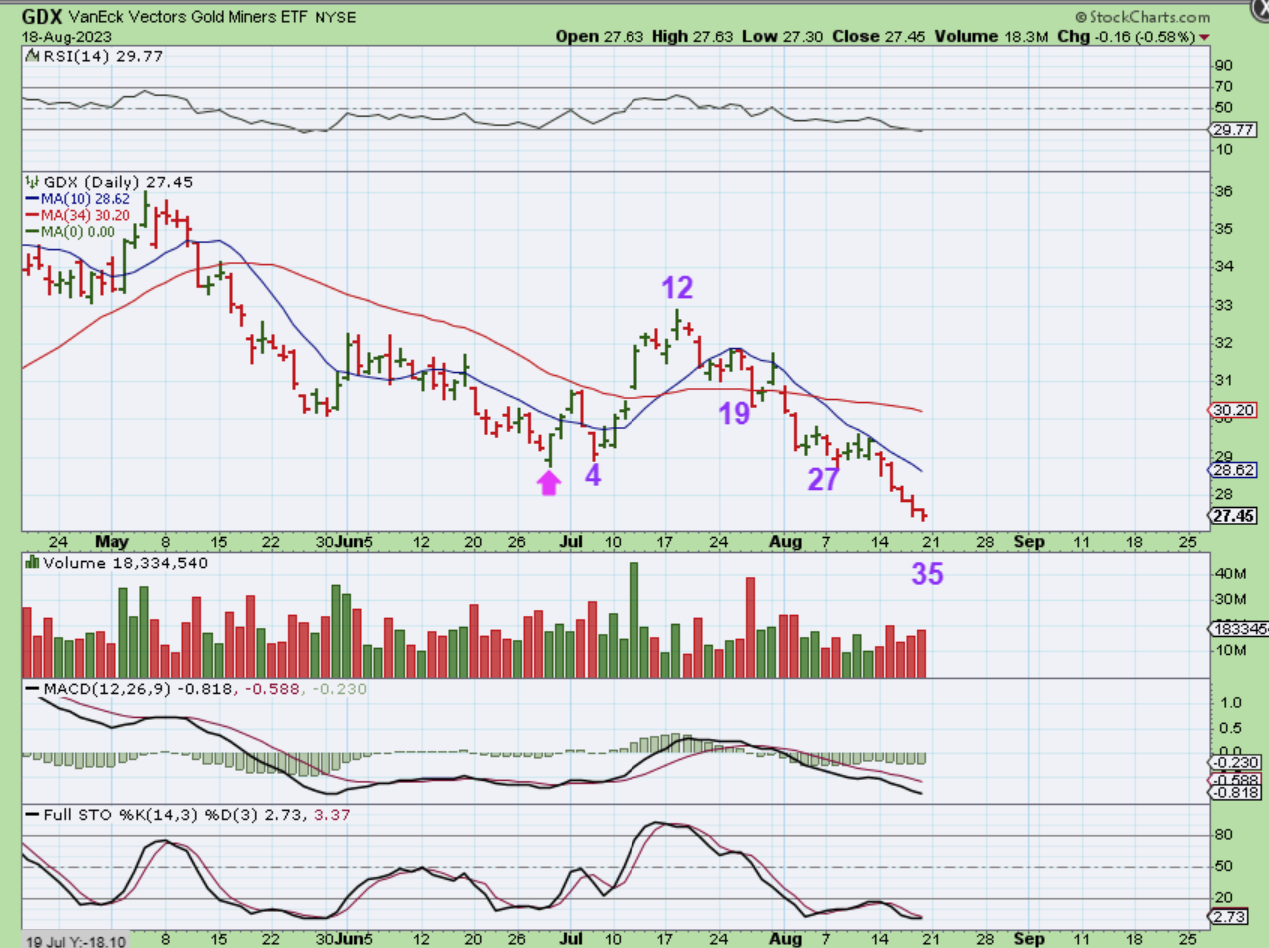
.
We just have to let this play out and then take it day by day.
.
Also as a sidenote: Jumping in on every Pop and selling every drop that follows will slowly chip away at your account, and that is extremely frustrating. That money will be made back after the lows are in place quickly if it was just small starter positions, but to avoid that frustration I always recommend waiting for a break & close above the 10sma.
Silver is trying to do that now, but I have pointed out a few times with a chart like this that GOLD is not even able to recover the 7 sma yet. Let Gold get above that 7sma or 10sma first to show that buyers are coming in.
.
I think that it was a rough trading week for the ‘Longs’ or Bulls, but next week might be si=urprisingly better, since the Precious Metals Sector is late in the cycle count and very oversold. For now…
.
Enjoy your Sunday and hang in there, better days must be just around the corner for the Bulls.
.
~ALEX
.
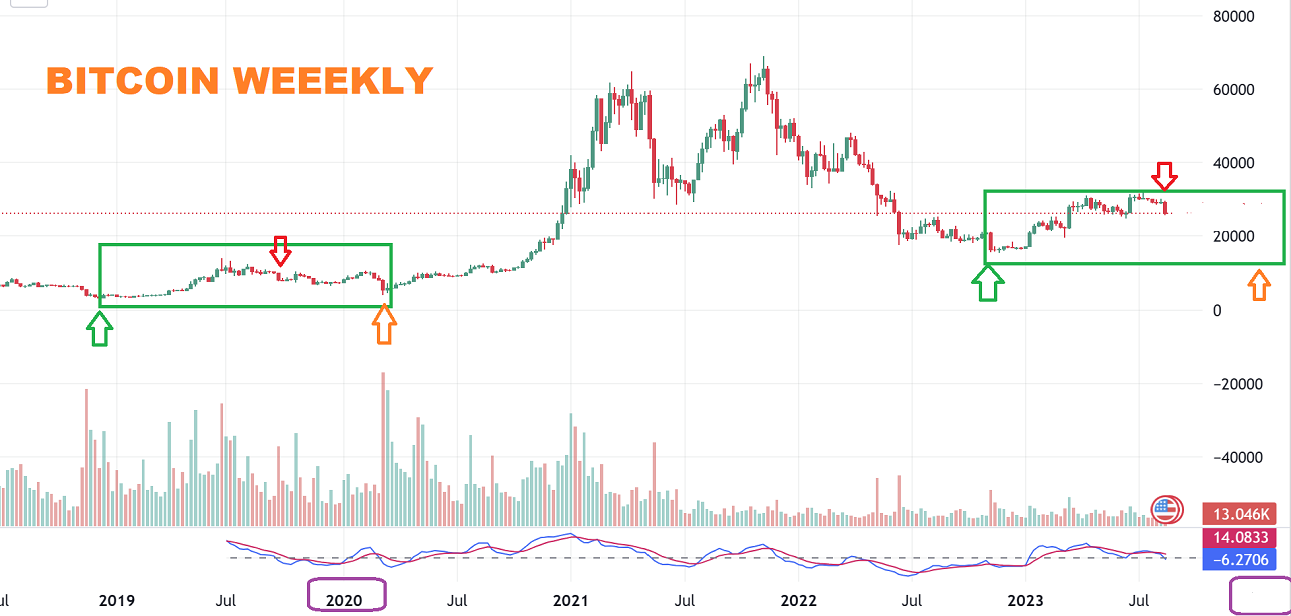
BITCOIN: I was looking for a drop into a dcl around day 60 and we certainly got one, but this was a bit more than I had hoped for since it almost broke the last dcl. I am a little more cautious and it has to do with the weekly chart and halving that takes place every 4 yrs with Bitcoin. Lets go weekly…
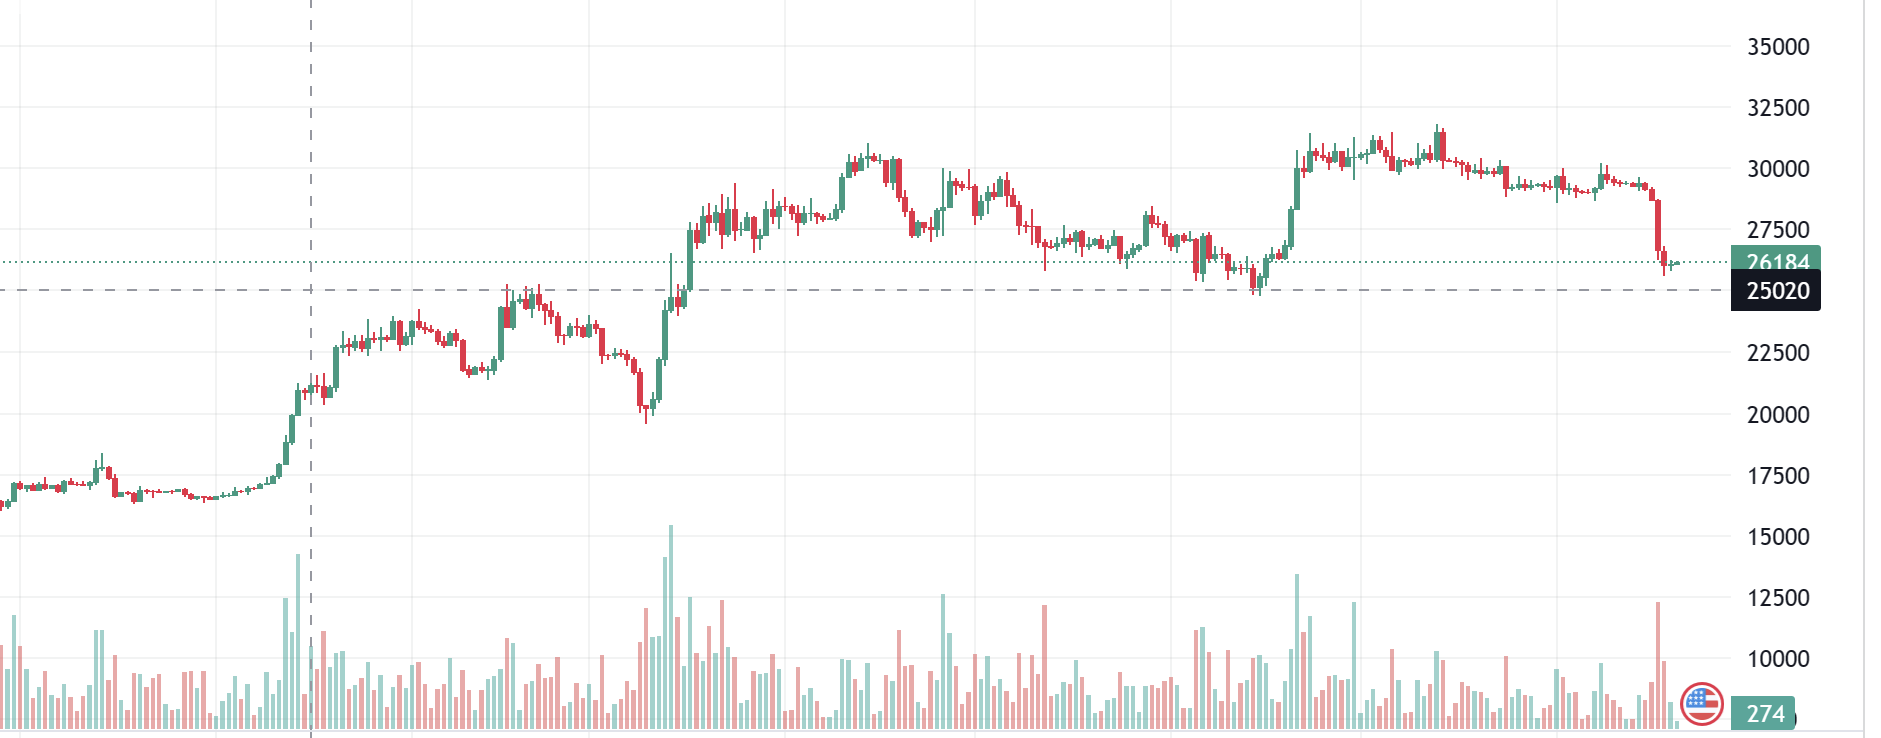
BITCOIN: Notice the 2 green boxes on this chart.
I went back and looked at prior halving years ( 2012, 2016, 2020, and now in 2024 we are due for another). I see that we do always see a rally the year before halving with a major low forming following a crash. I think we have that Major low now after the 2022 crash.
Then a rally out of that low formed , but it also puts in a bit of a deeper dip (ICL) before a major halving rally takes place. So I pointed out a similar area on this weekly chart heading into 2020 before halving took place. The rally was VERY STRONG similar to know after that final low and into the halving year, but a deeper dip is at the end of the green box. For us that would be a strong rally into 2024 after amybe a deeper dip into 2023 year end. Do we need the deeper dip first? That is what concerns me. So…