Wednesday Fed minutes
There really is a lot going on in the world that can affect our markets. Russia raised rates to 12% as the Rubles’ value continues to drop. China lowered rates, to help their weakening economy. Canada saw inflation rise more than expected in July, and today we have the release of the ‘Fed Minutes’ at 2 p.m. These variables have been known to move markets, so we’ll just have to see if The FOMC Minutes chatter does move things, and if so, how?
.
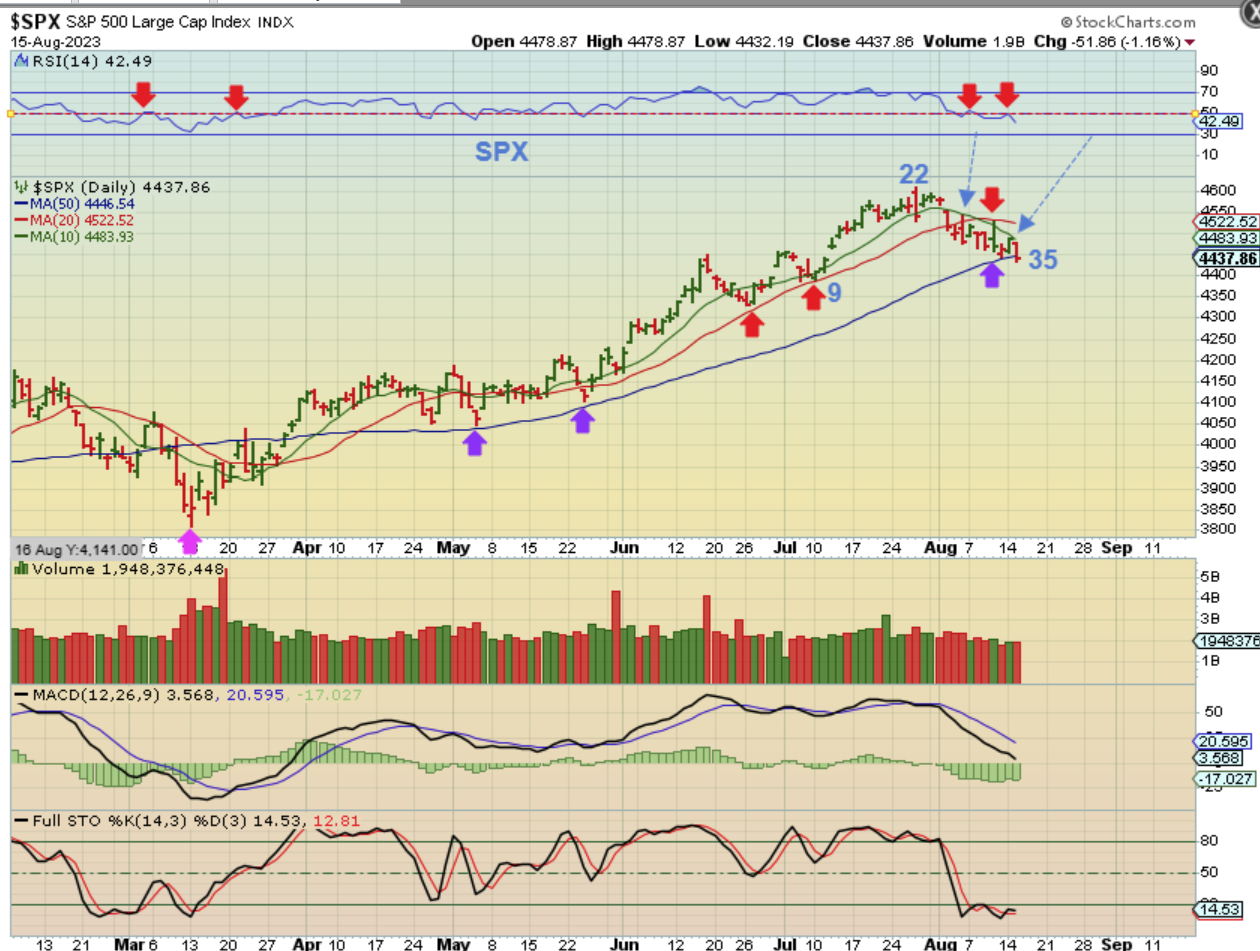
The SPX bounced off of the 50sma this week, so it looked as though buyers may step in and give us an early dcl. On Tuesday however, we started to lose that 50sma right into the close of the trading day. I have discussed this type of set up extensively. If we don’t get an early dcl near day 35, this can drop further since some daily cycles have been 40-50 days long…
.
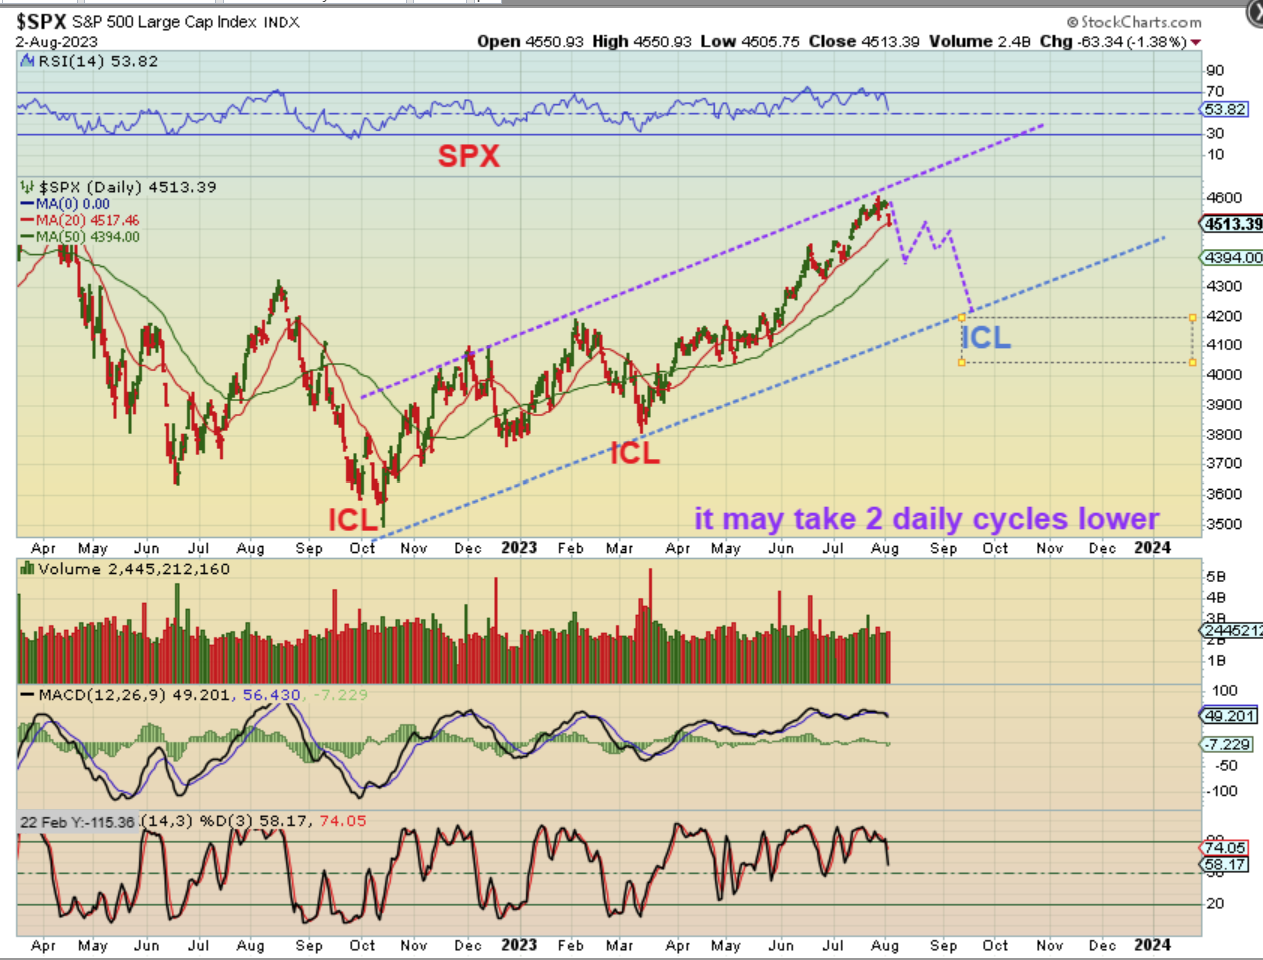
Back on Aug 2 (& other occasions), I drew the first dip to the 50sma and we are there now. I also discussed that an ICL is coming due, so we could bounce and then drop much lower, so lets keep that in mind too. For now, we’ll see what the Fed Minutes do to the Markets.
.
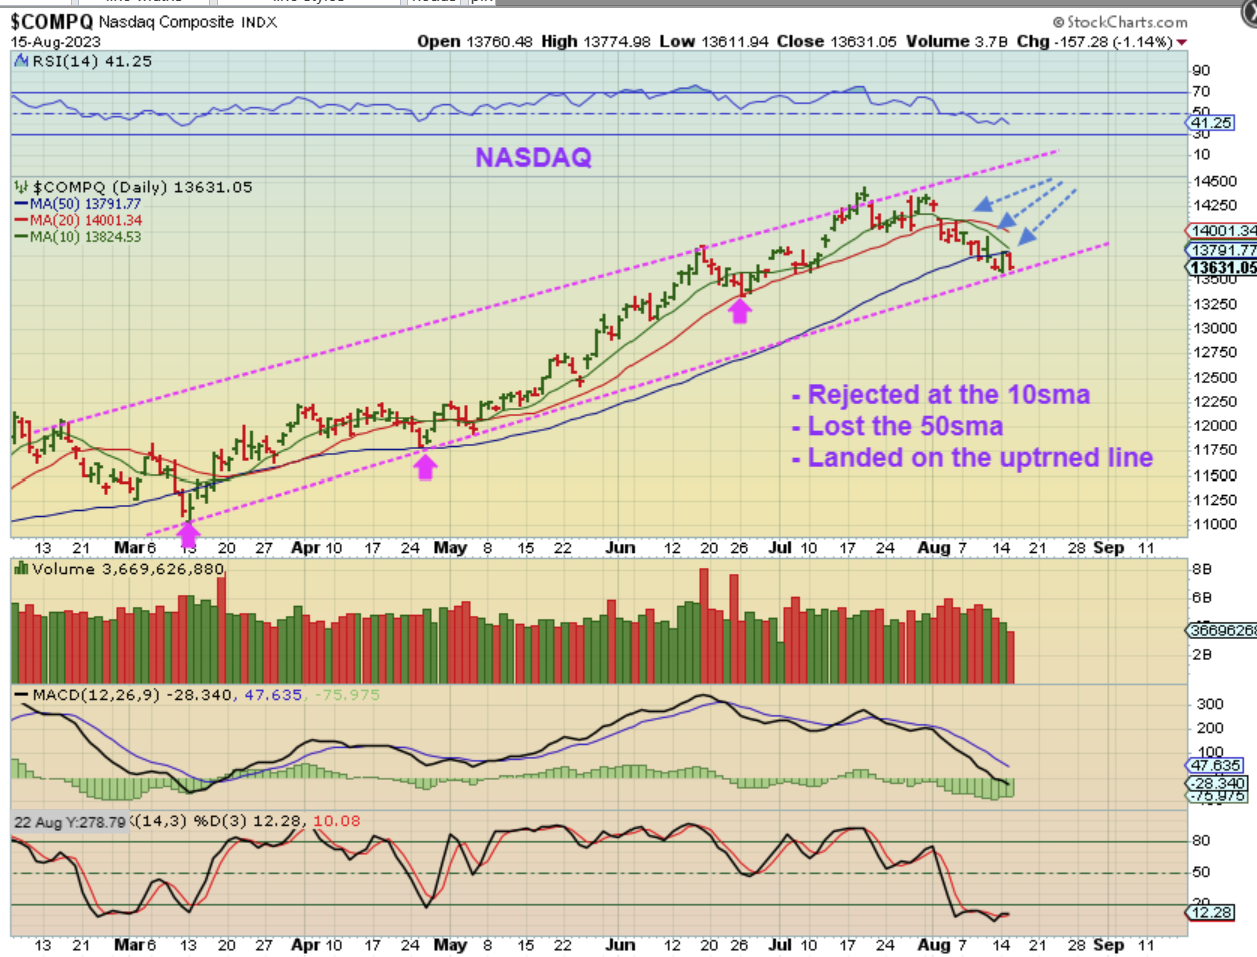
THE NASDAQ is on the Magenta Uptrened line, but notice that it did lose the 50sma, back tested it on Monday, and then sold off on Tuesday. This could still sell off for a week or 2 since we are only on day 30+.
.
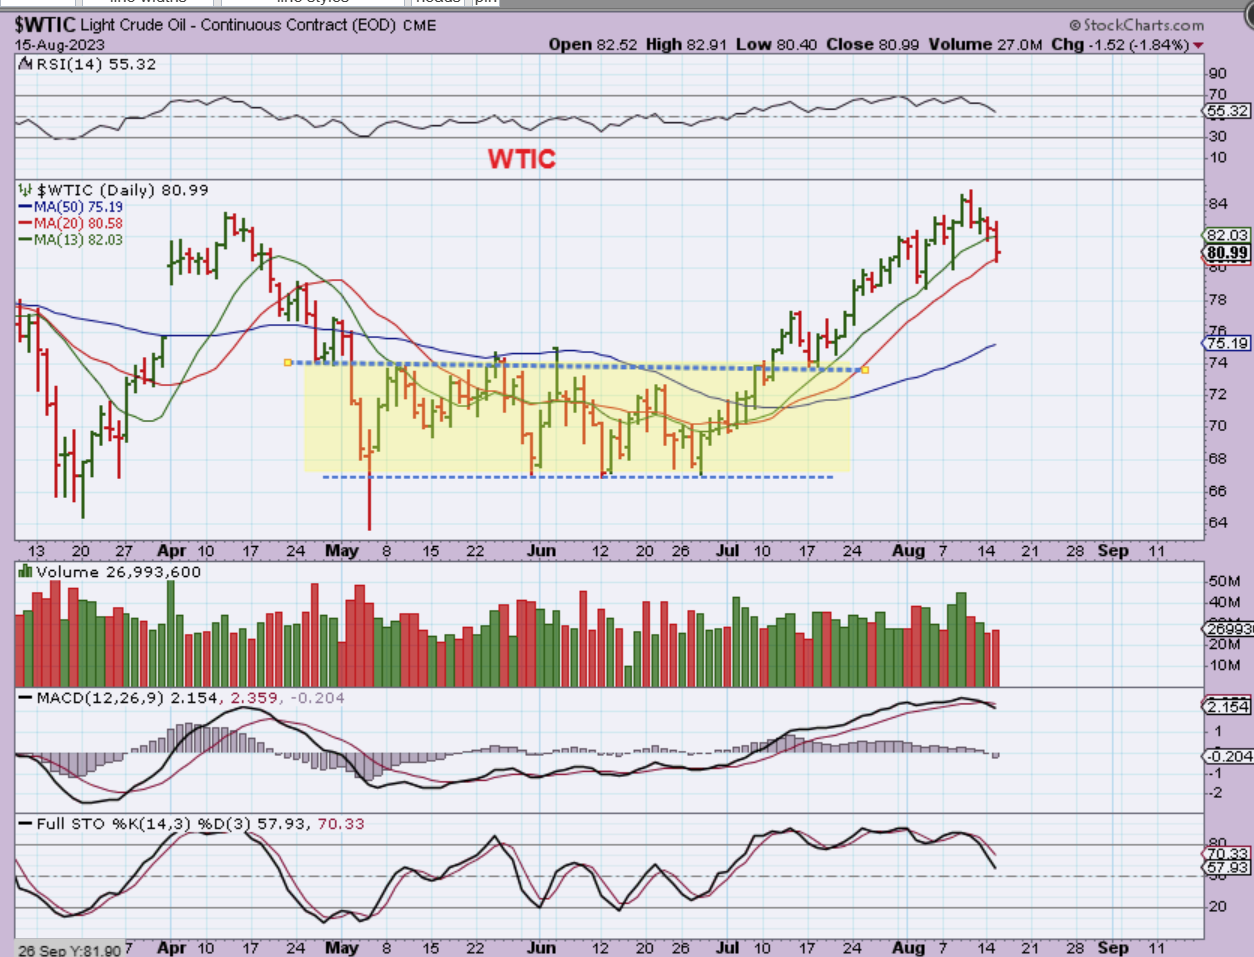
WTIC – Oil actually fell just a little bit more than it should have, so we have a slight change in character. It has been tagging the green 13 sma, but it fell to the 20sma on Tuesday & the MACD crossed lower. That may signal that a deeper dip is coming. A drop into a dcl could back test the blue 50sma and that yellow base, but that would be a nice buying opportunity for Oil Stocks ( or USO & UCO).
.
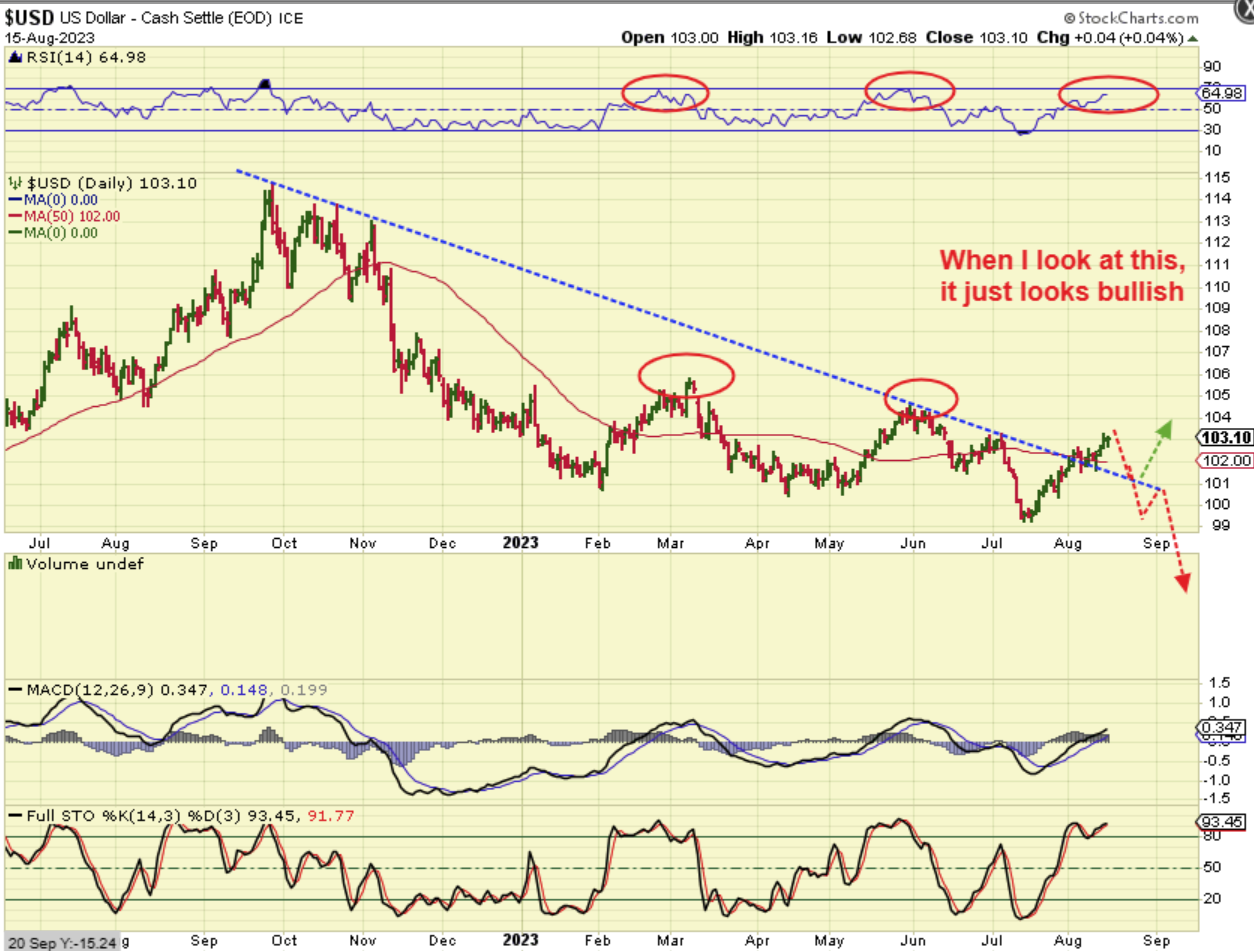
The USD is trading at $103 and has broken out from the long-term downtrend. I have to admit that this is a bullish looking chart with that breakout. It could become a false breakout and sell off again, into that 3 yr cycle low, or it may have put in a 3 yr cycle low 6 months early, as discussed in past reports.
..
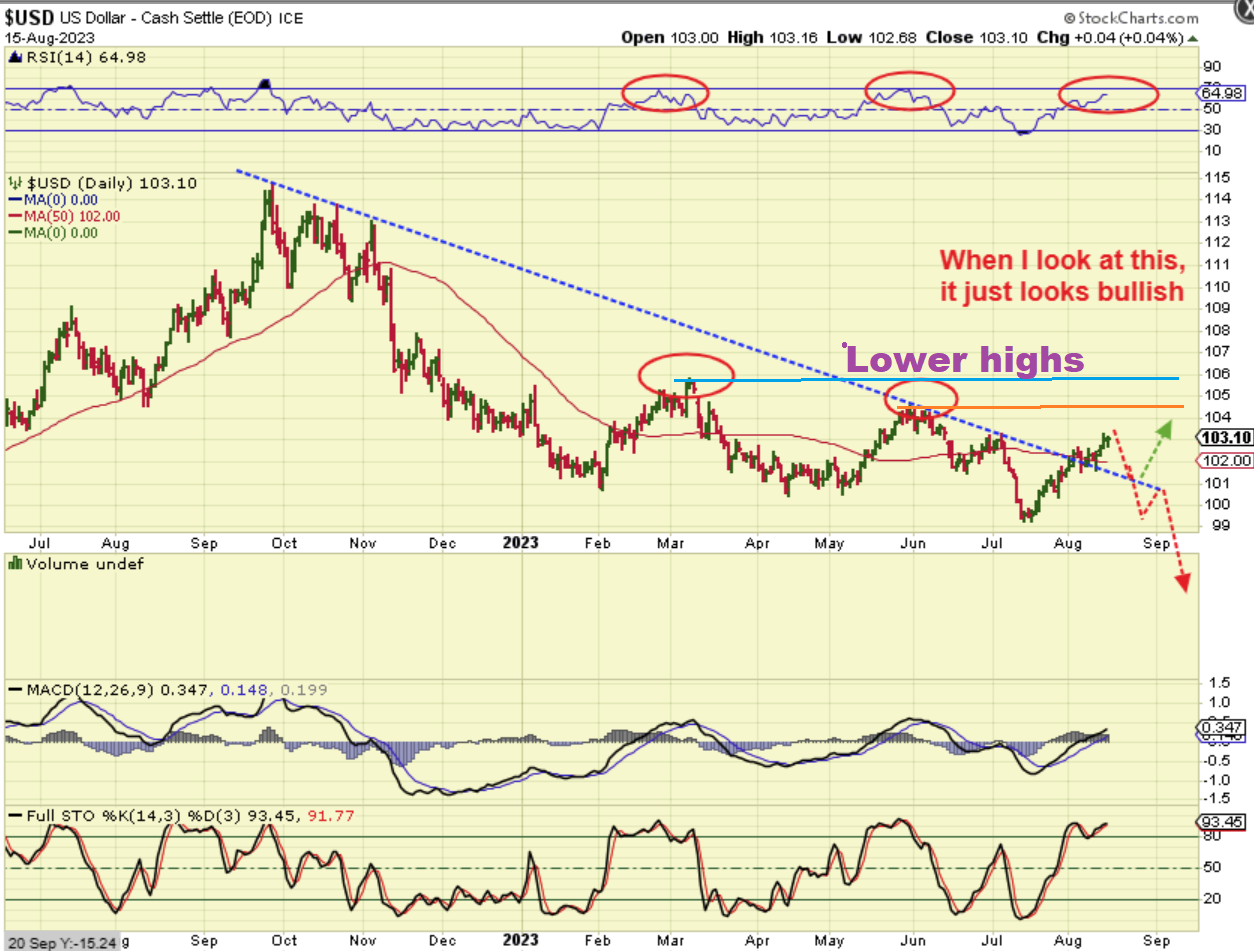
We should keep in mind that a ‘downtrend’ is lower lows and lower highs out of those lows. We DO still have lower lows and lower highs here, and the RSI has not reached the past peaks either. A trendline from those last 2 peaks and now…
.
A trendline from those last 2 peaks and this one gives us this.
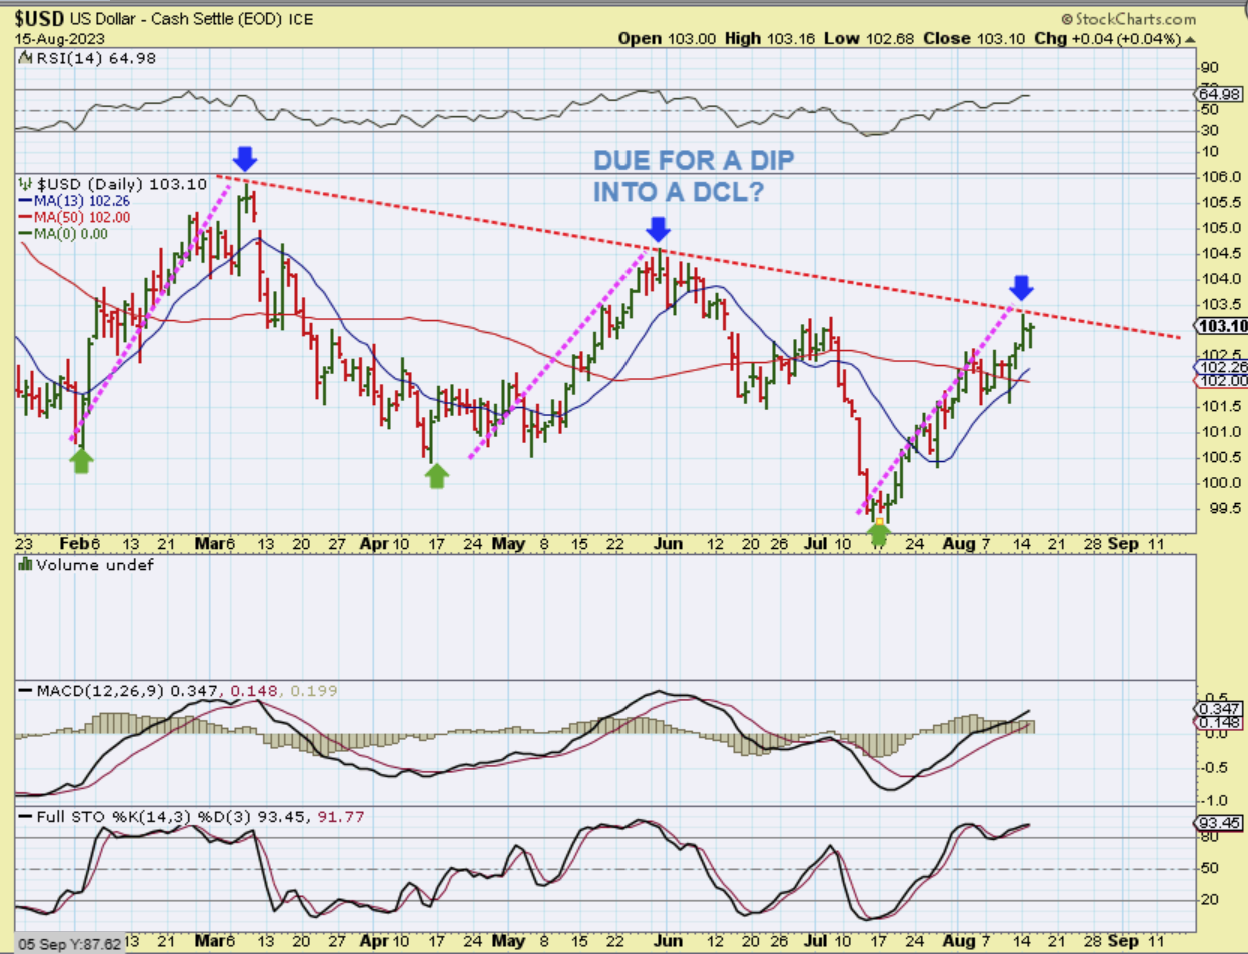
So when I zoom in on The USD, I also noticed that this run from July to now is pretty much equal to the last 2 runs prior to it. Are we about to ‘peak’ with the Fed Minutes? I sure hope so! 🙂 And we are overdue for a dip into a dcl.
.
If I use the stockcharts chart for GOLD, it shows a day 21 peak on a 32 day daily cycle. Also a break from that May-July downtrend & a peak above the June peak should indicate that we have an ICL. However this day 21 peak is from when they adjusted Golds contract…
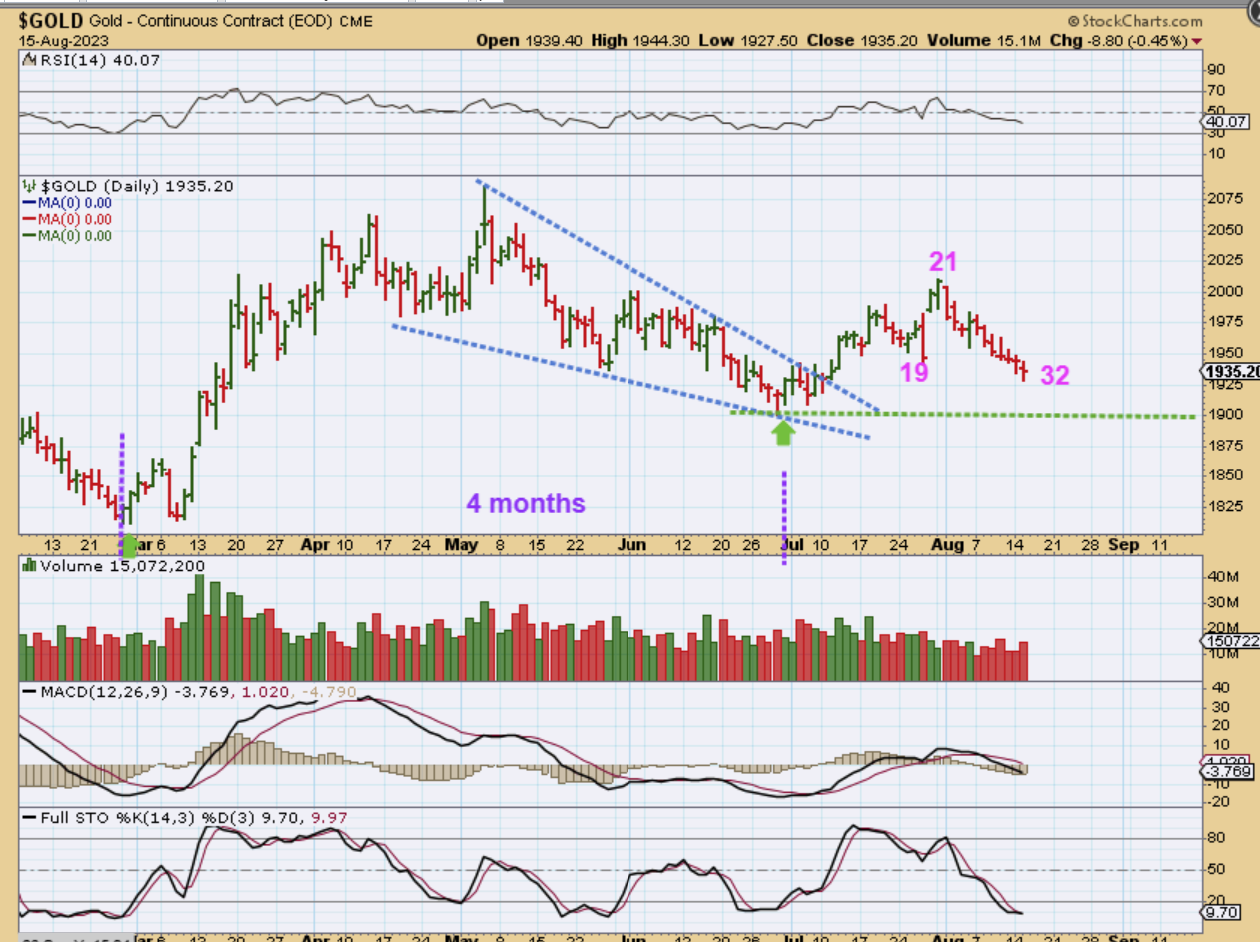
,
SPOT GOLD has a day 15 peak on a 33 day daily cycle. That is L.T.
1. We still broke the downtrend
2. And the day 15 peak is higher than the June peak,
3. It is an a-b-c style drop into those July lows, so it still should indicate that we have an ICL, but it is L.T.? I am wondering if a quick break of the lows would give us the real ICL.
.
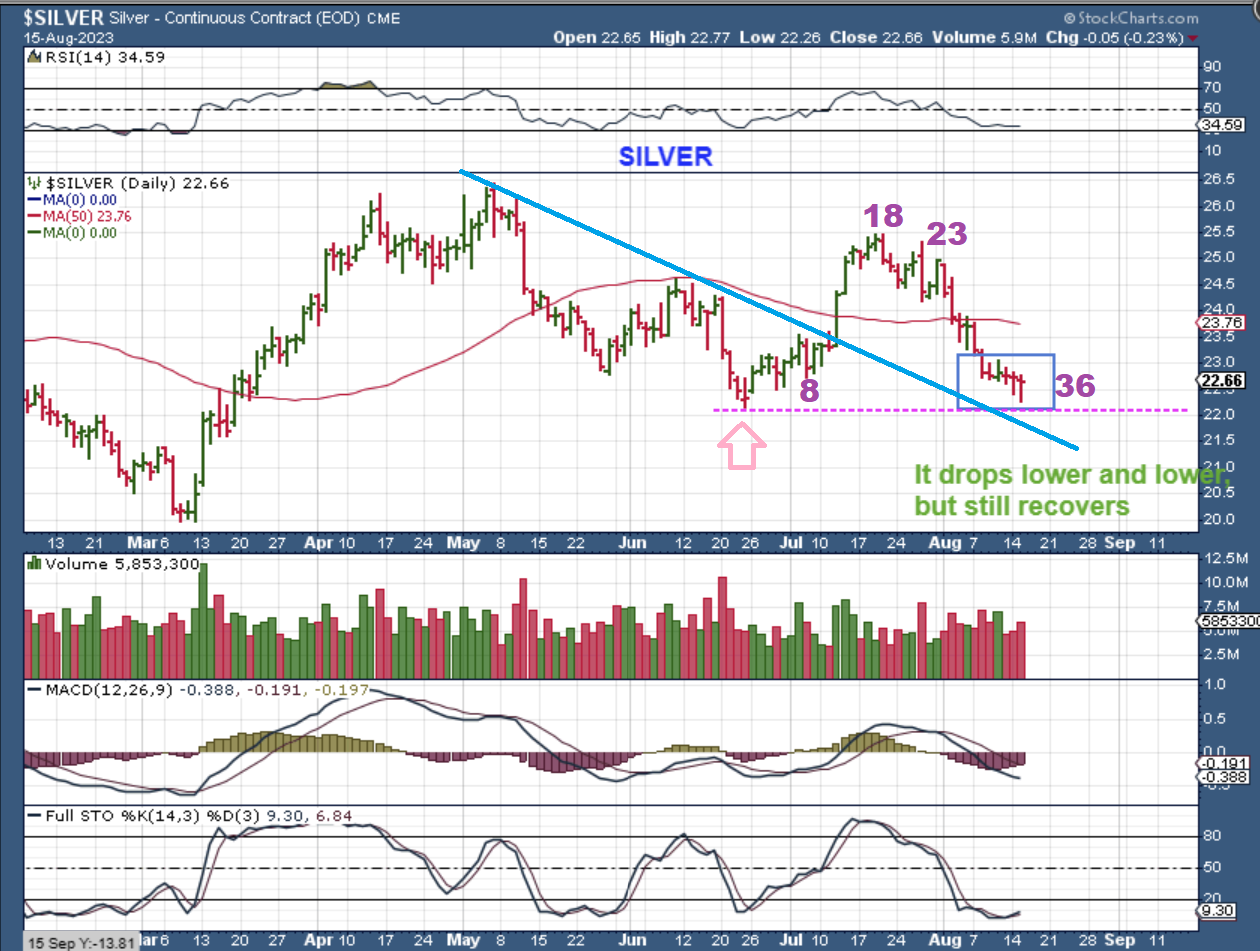
SILVER drops and almost recovers daily. It too has the hallmarks of an ICL with an a-b-c drop, a trend line breakout and a higher peak than the last June peak. It almost took out the lows yesterday, but it does still remain as a higher low. Todays fed minutes should be interesting.
.
.
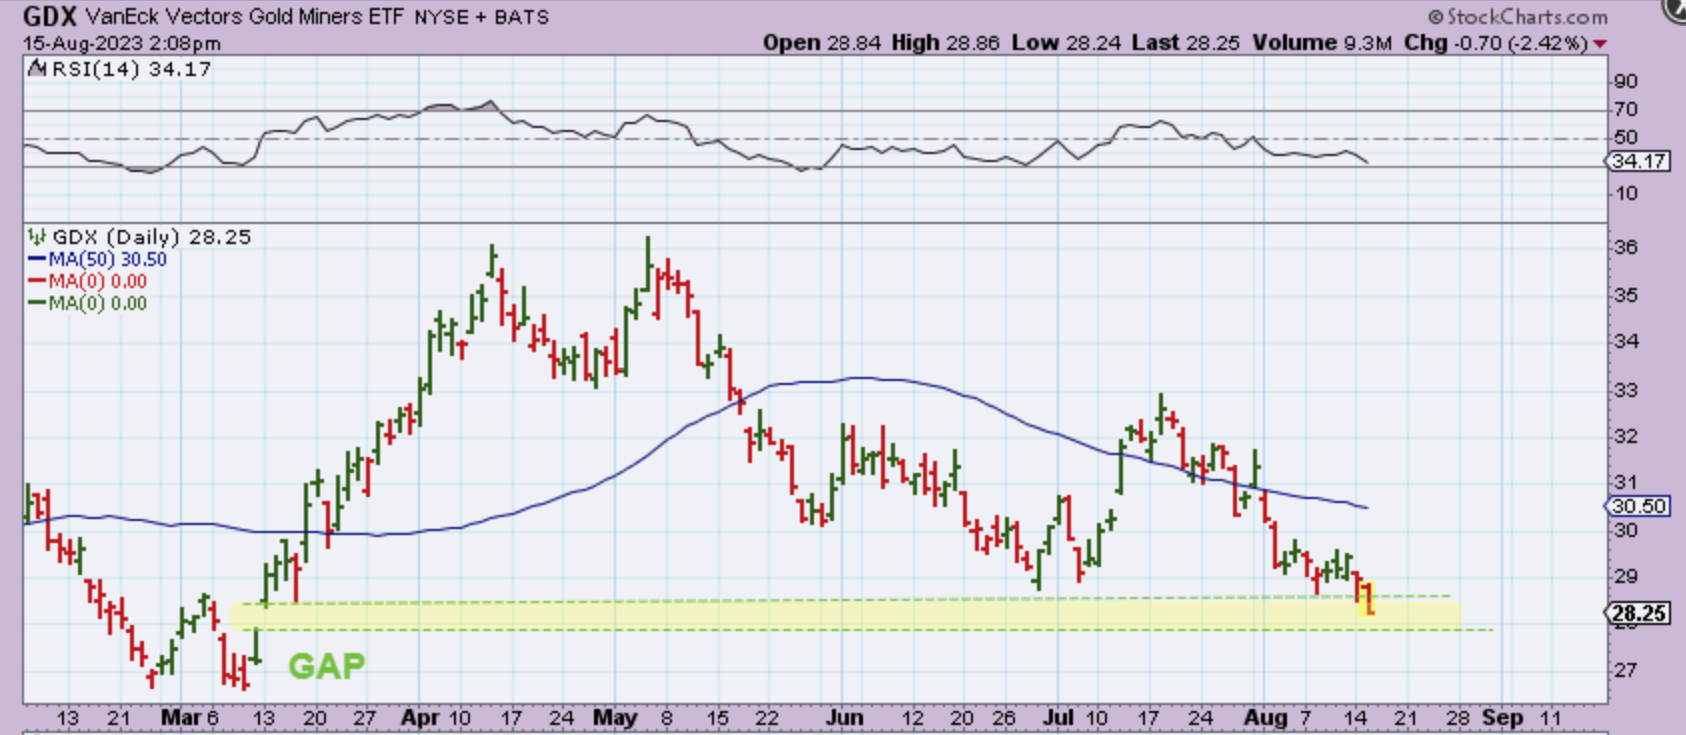
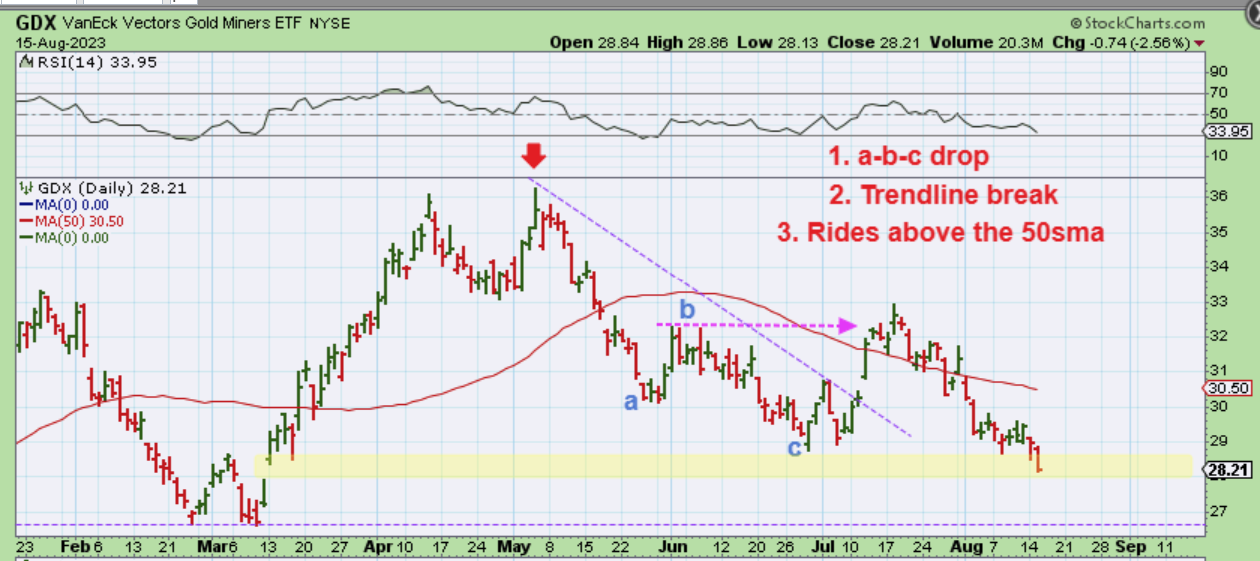
I was watching The GDX drop to new lows yesterday when I realized that an open Gap from that March banking collapse was being filled. Let’s talk about this GDX set up…
.
I also wondered if this could possibly be considered the real ICL coming into play now(?), because it is 6 months forward from that Feb-March ICL. 6 months is normal, and that strong March run was caused by a ‘Banking Collapse – Fed Rapid Rate Hike ‘ situation. This set up is tricky, because look at the quick rally out of the July lows and it looks like an ICL. Why?
1. GDX broke the downtrend of an a-b-c drop
2. It then made a higher high over the June highs or the ‘b’ point.
3. GDX rallied above the 50sma and rode along it.
4. This definitlay acted like an ICL, until recently with the relentless selling into that ‘gap’.
.
Ever since we saw the Banks collapse in March, likely due to the Fed rapidly raise rates month after month (& with large increases, not just a quarter percent), The Precious Metals Sector ran swiftly higher in March but lost its steam after May. We saw signs that an ICL was put in place in June/July after the 50sma was regained and a new short-term peak moved above the early June peak, but the weakness since that high is now causing L.T. Daily cycles. That is something different. The first daily cycle out of an ICL is not supposed to be a L.T. one, so are we really seeing that 6 month drop into an ICL now and that July rally was some kind of a fluke of strength? We could know as soon as today with the Fed Minutes. In Technical Analysis, this is all very normal, but within ‘Cycles’ some things are acting a bit strangely. All in all, We are now due for a dcl in Gold and Silver any day now, and they are both still above the June lows, so we’ll just have to watch and see how low this daily cycle goes.
.
Sidenote: If you did the ‘buy & hold’ of your entire holding in Miners from March and didn’t sell any, this has been brutal. GDX is almost at March lows again. We have had a lot of chop lately, and without a confirmed dcl, we did not get the ‘Buy’ signal yet, so if you have been buying, you may be getting chopped up. I got chopped up yesterday. I did Buy AG, SSRM, KGC as leaders recently and yesterday those broke down a bit too, so this shows the ‘safety’ or importance of buying after a confirmed dcl is in place if you do not want to chance the choppiness of a bottoming process. Ag lost the 50sma, so I cut 1/2 of my position and we’ll see if I can get back in lower once the dust settles.
.
~ALEX
.
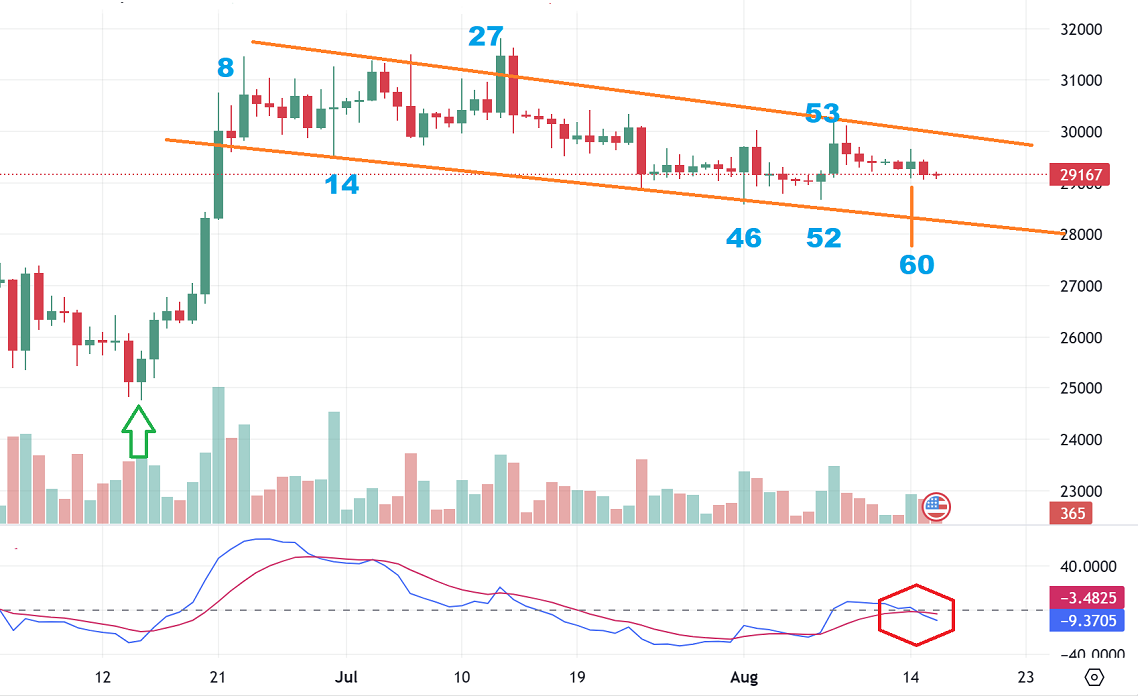
BITCOIN should be close to putting in a low (near day 60) and that lower indicator did cross lower, so is one more quick slam down in the works? It seems possible. The Crypto stocks like MARA, RIOT, CIFR, etc closed below their 50sma yesterday, possibly anticipating that more time is needed. This chart is pointing to day 60 as the green candle, but it was really Tuesday, the red candle to the right of it. Today is day 61.