
August 13 – Weekend Report
We have been discussing the cycle count in both The SPX & THE NASDAQ:
I showed this Wednesday chart on day 31 and discussed a short ( 30 day) and a long ( 50 day) Daily cycle. Either is possible, and we were on day 31…
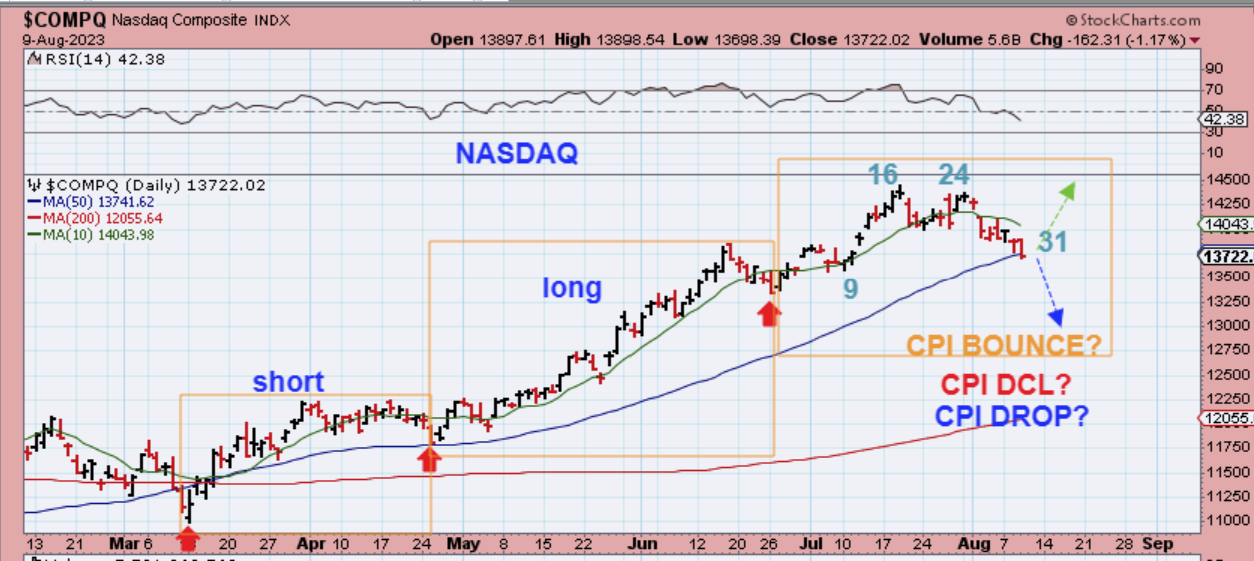
.
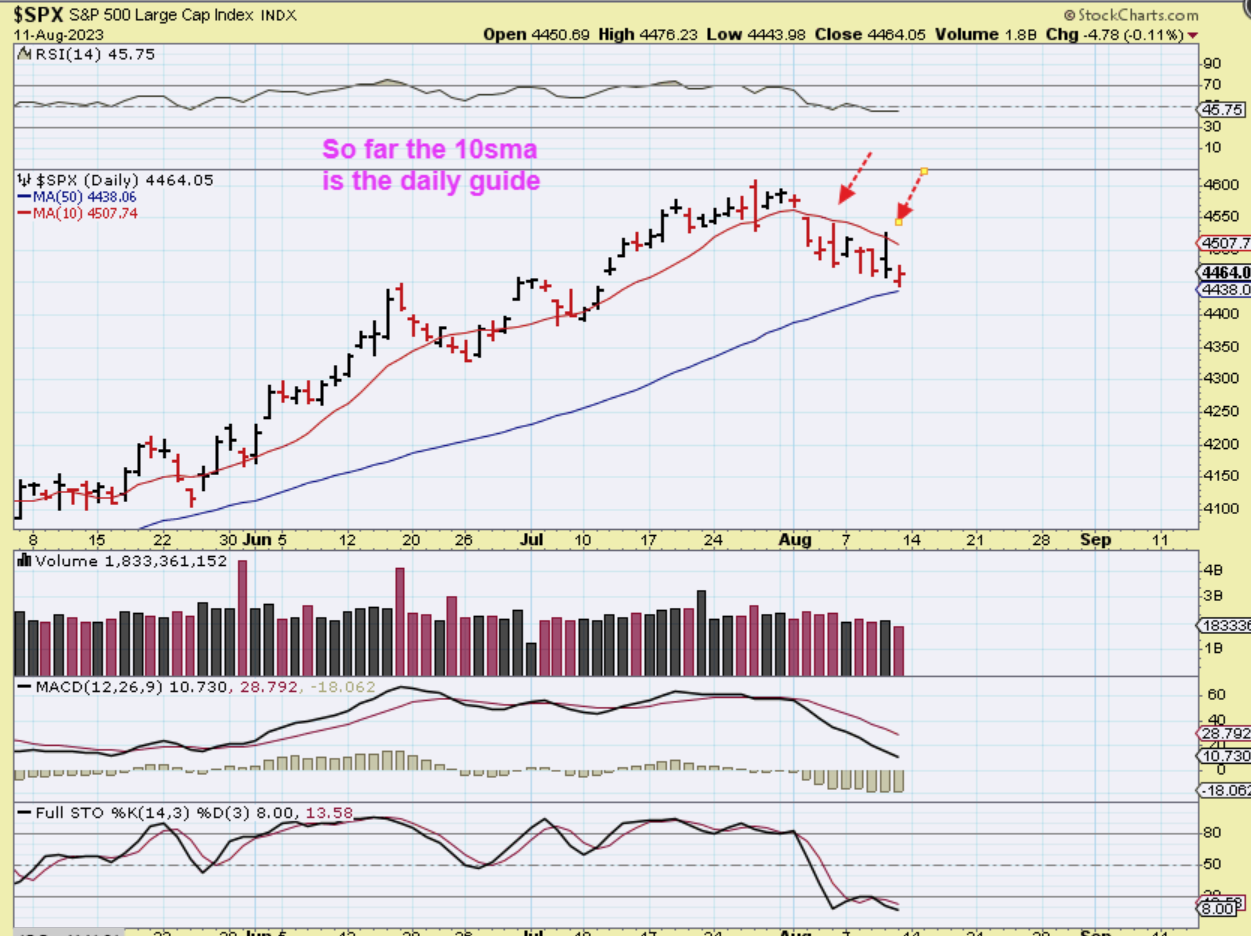
THE SPX landed at the 50 sma area on Friday and put in a small bounce.
1. We could get a dcl at any time, so we want to be aware of that, but an ICL is also coming due, so a new daily cycle would likely form as left translated.
2. This also does still have time to just break down and keep dropping lower to put in a dcl later.
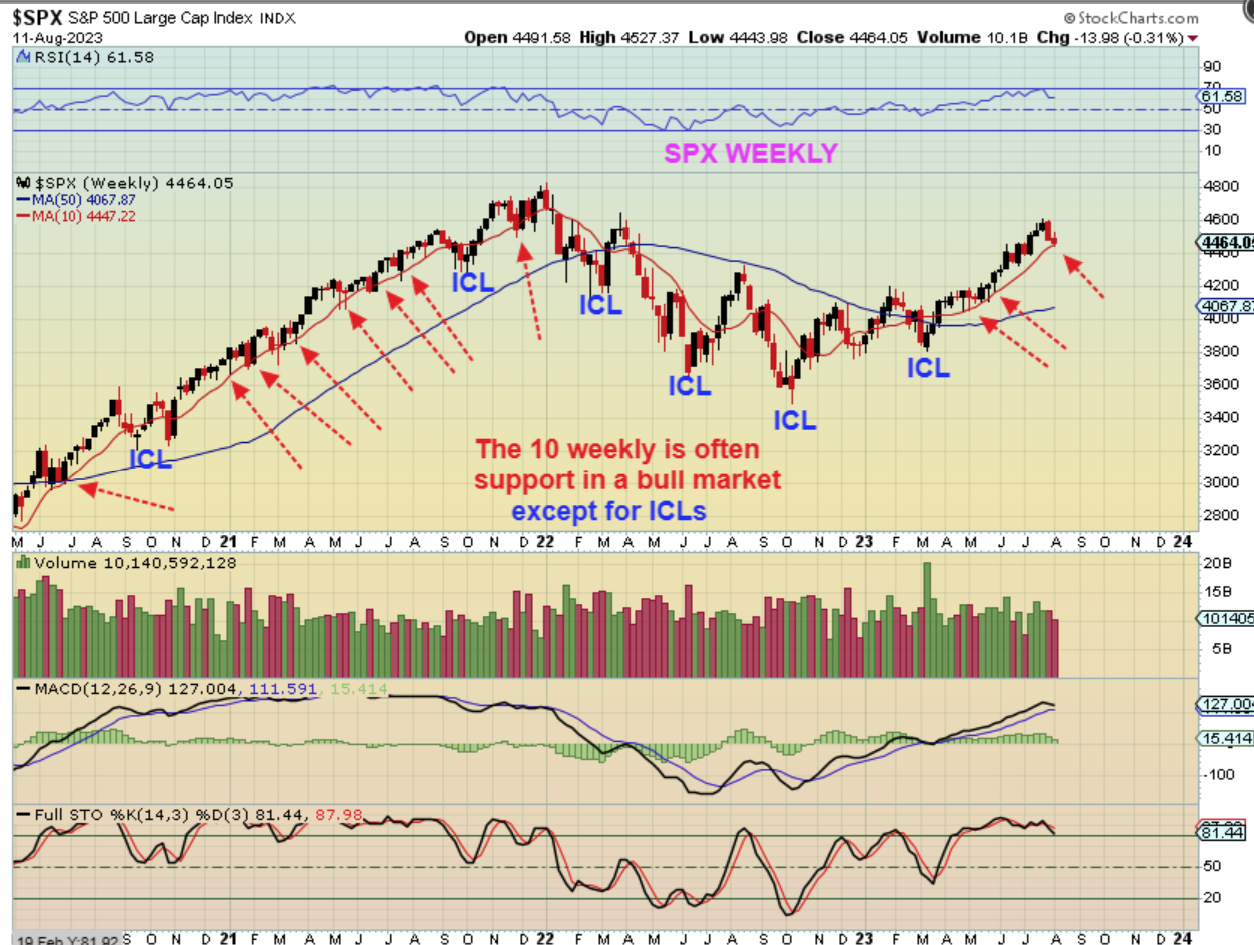
So on The SPX WEEKLY Chart, we see that during bull runs, the 10 week ma often acted as support (Red arrows), but it was the ICL that often broke below that 10sma. Right now we are at the 10 week ma, so we have to be aware of the idea that the markets can dcl here, since we are also on day 33.
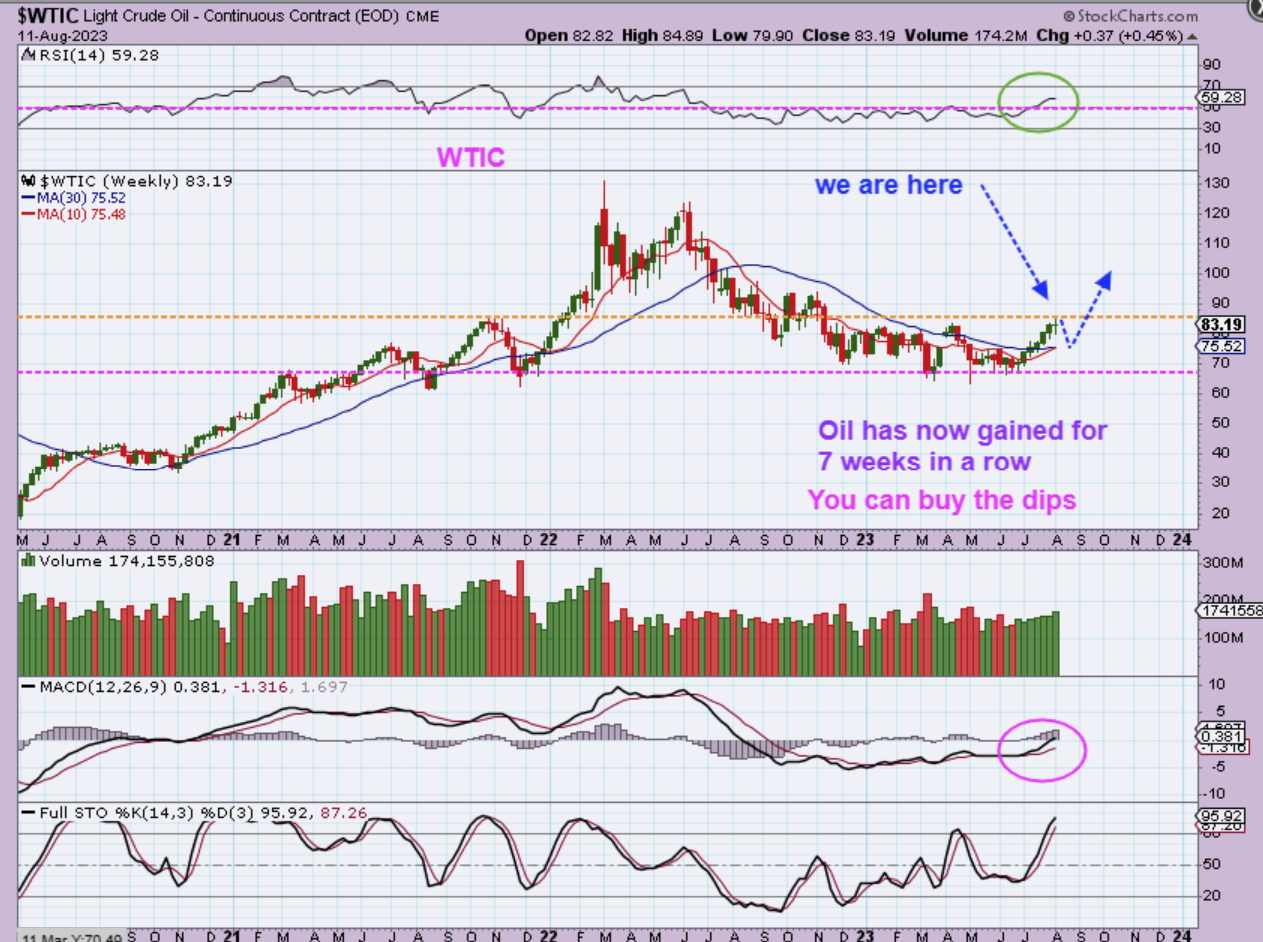
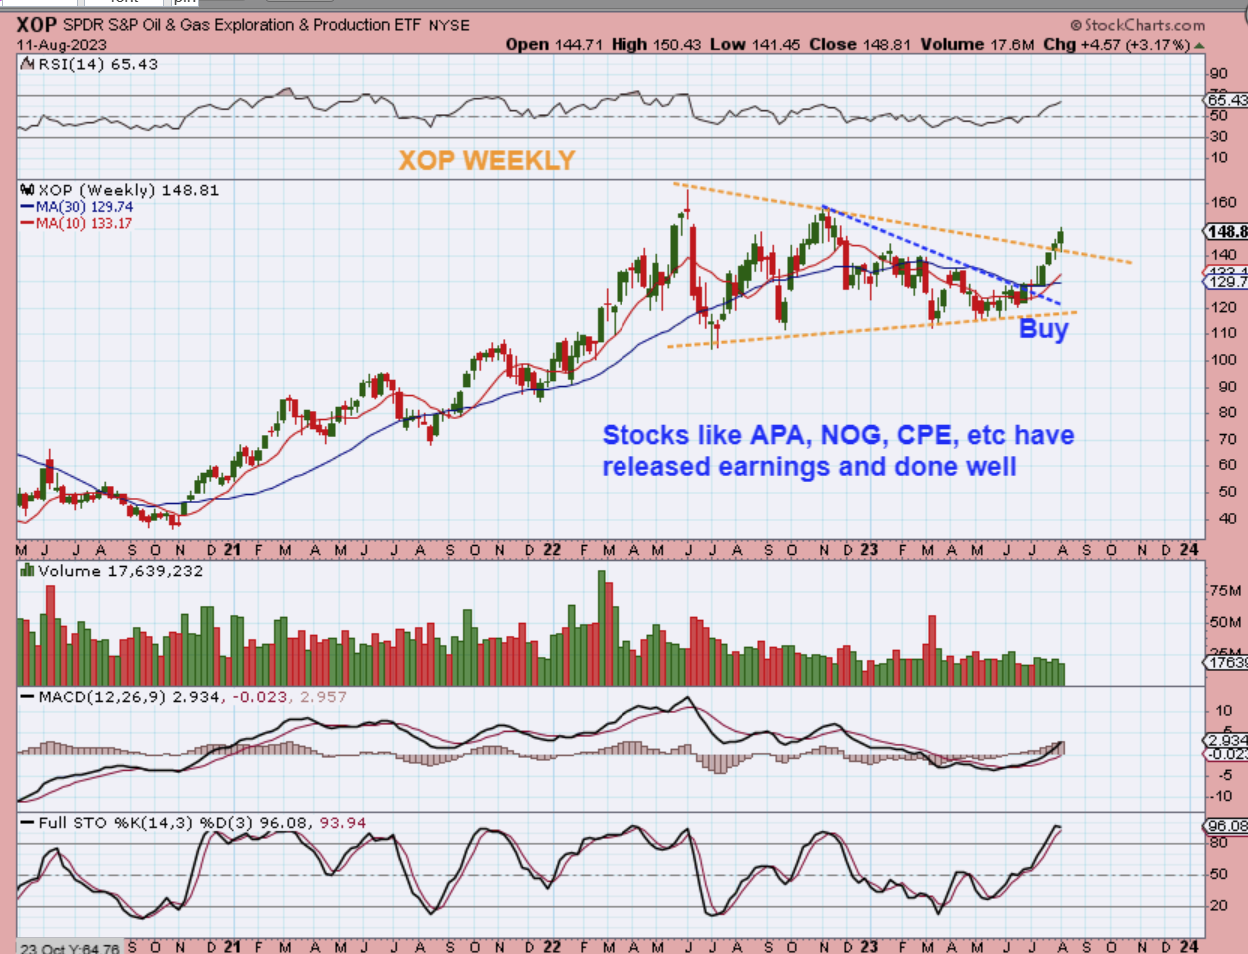
WTIC – Oil broke out a few weeks ago, and has been slowly but surely steadily running higher. The weekly RSI is almost at 60, so we have a nice run taking place here.
XOP: In May & June I mentioned that the Oil Stocks were leading Oil, because they began to put in higher lows well ahead of Oil. On some days that Oil dropped, Oil stocks were green, so this was a buy ( & Oil stocks were too), back in June. READ THE CHART.
.
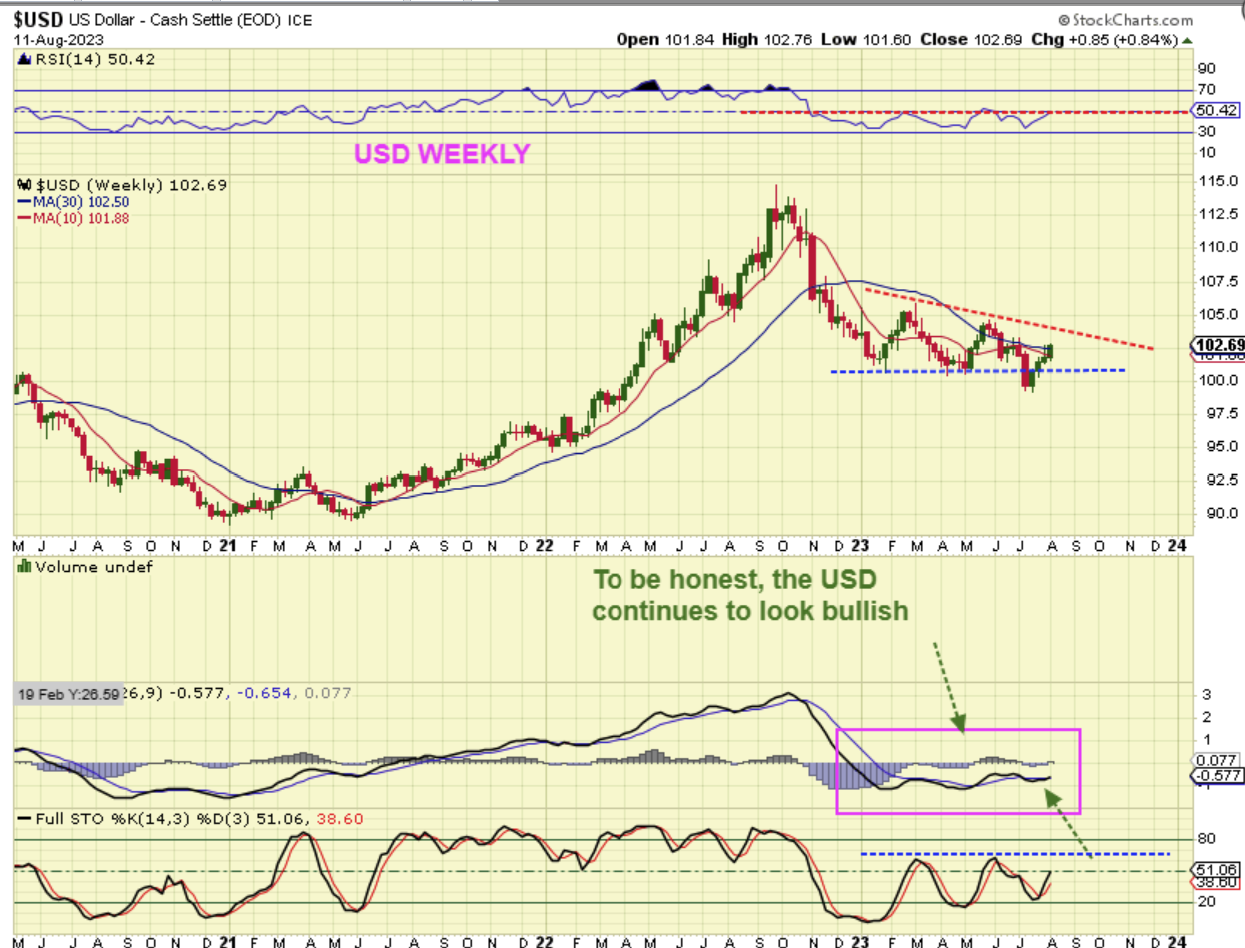
This is The Weekly chart for The USD:
I have to be honest and say that at this point, it still looks bullish. On a daily chart the USD should be due to dip down into a dcl, so this can start to weaken, but so far it PLUNGED below the prior lows, and now has recovered back to closing slightly above the 10 & 30 week ma. It looks like a bullish shakeout.
.
Before we dive into Gold & Silver, I just want to say that last week we had the CPI and PPI Numbers released (reflecting inflation). Gold and Silver dropped, but I have been noticing that some Miners already look to have bottomed, and I mentioned that (AG, KGC, SSRM for example). We are due for a DCL in Gold and Silver and they are at or beyond day 30 too. Also as of last week, THE GDX did not sell off with Gold & Silver. So let’s look at Gold, Silver, and The Miners with that in mind.
.
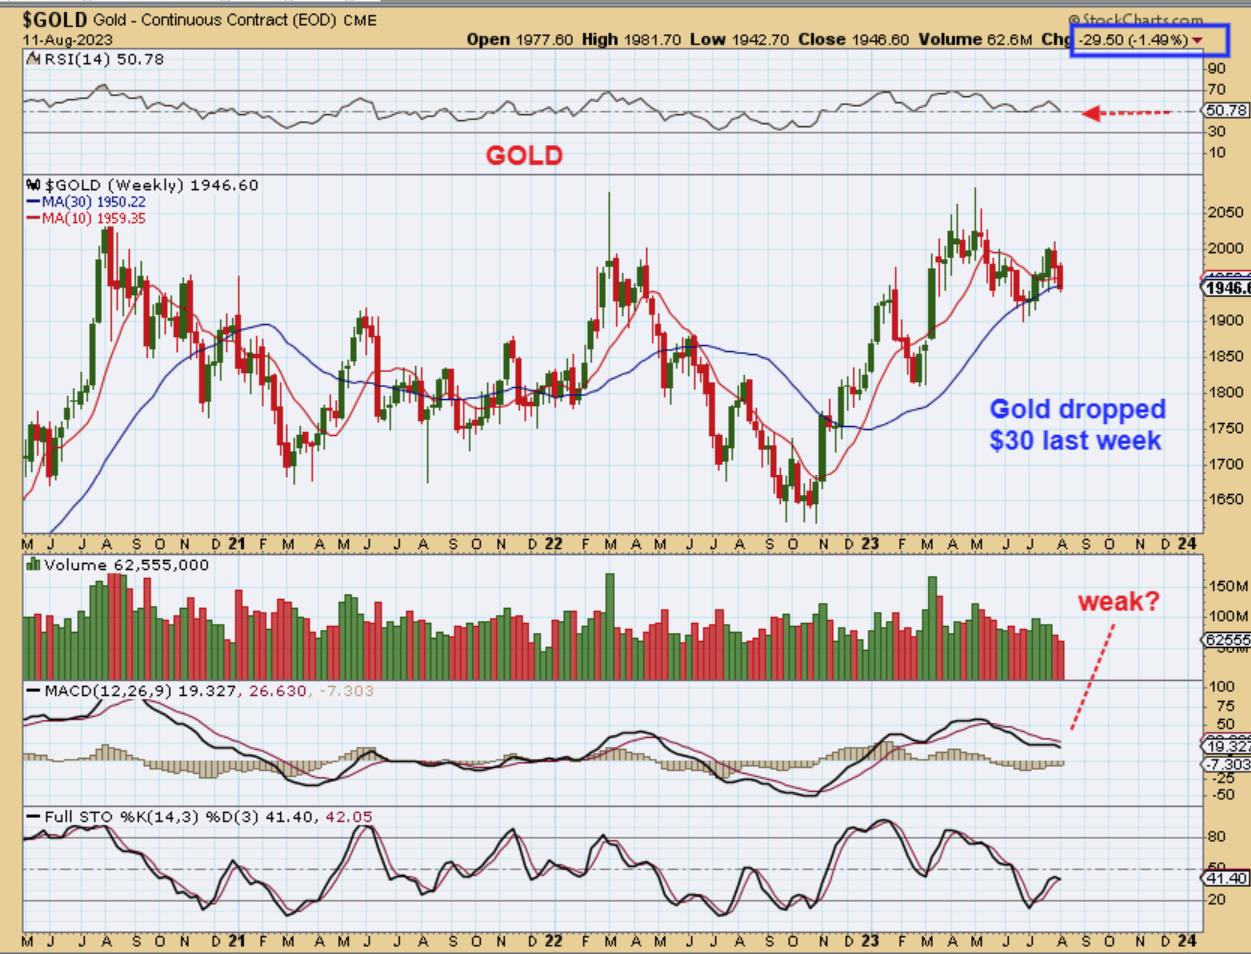
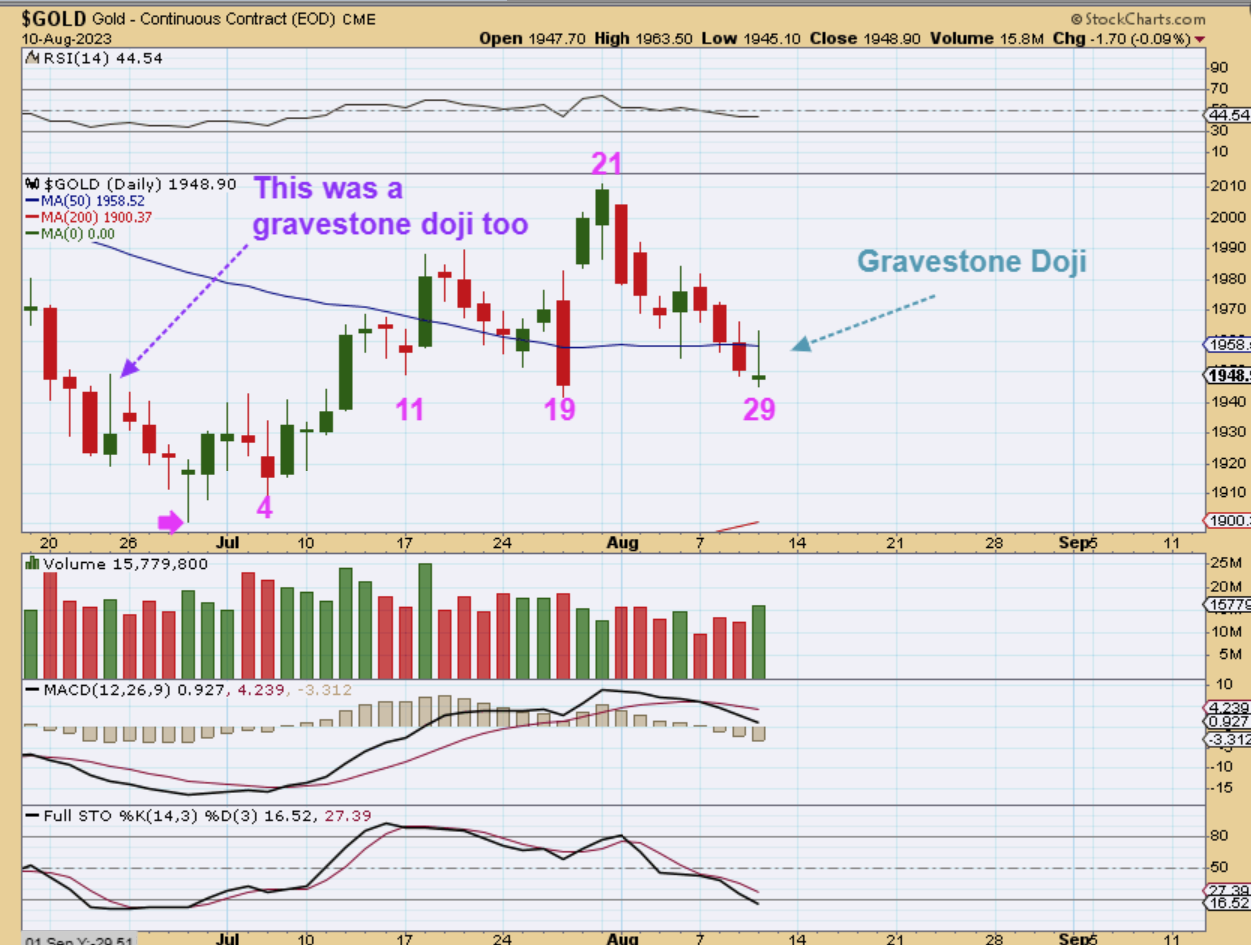
GOLD WEEKLY – Well, Gold dropped almost $30 last week, and this might normally look bad to the casual observation, but we also keep in mind that we were expecting this drop as we head down into a dcl. So, Gold dropped $30 last week, but …
.
So Gold dropped $30 last week, but I used this chart in Fridays report to show that Gold was now on day 30 as of Friday. This is within the timing that we could expect a dcl for that first daily cycle. We could get our low next week.
.
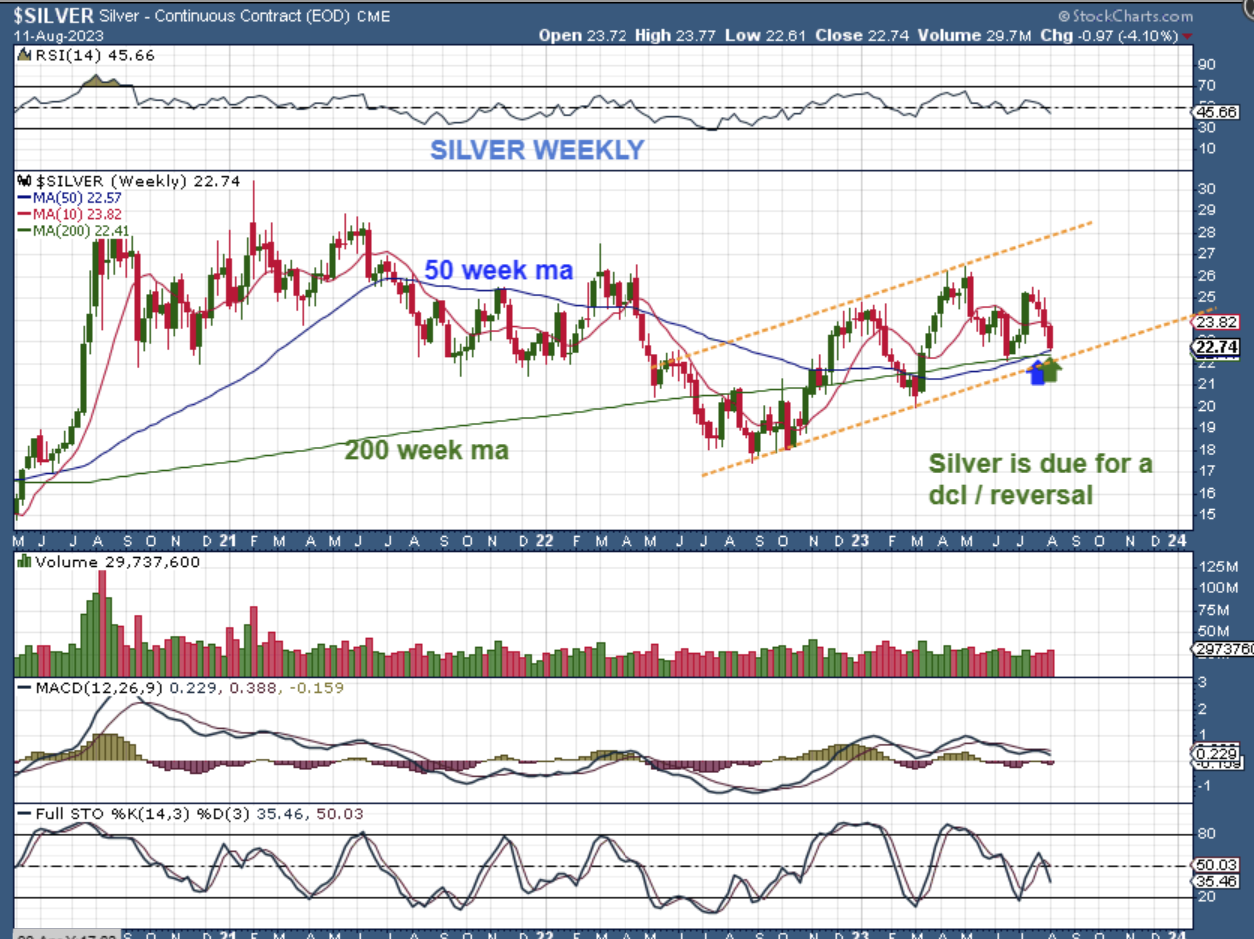
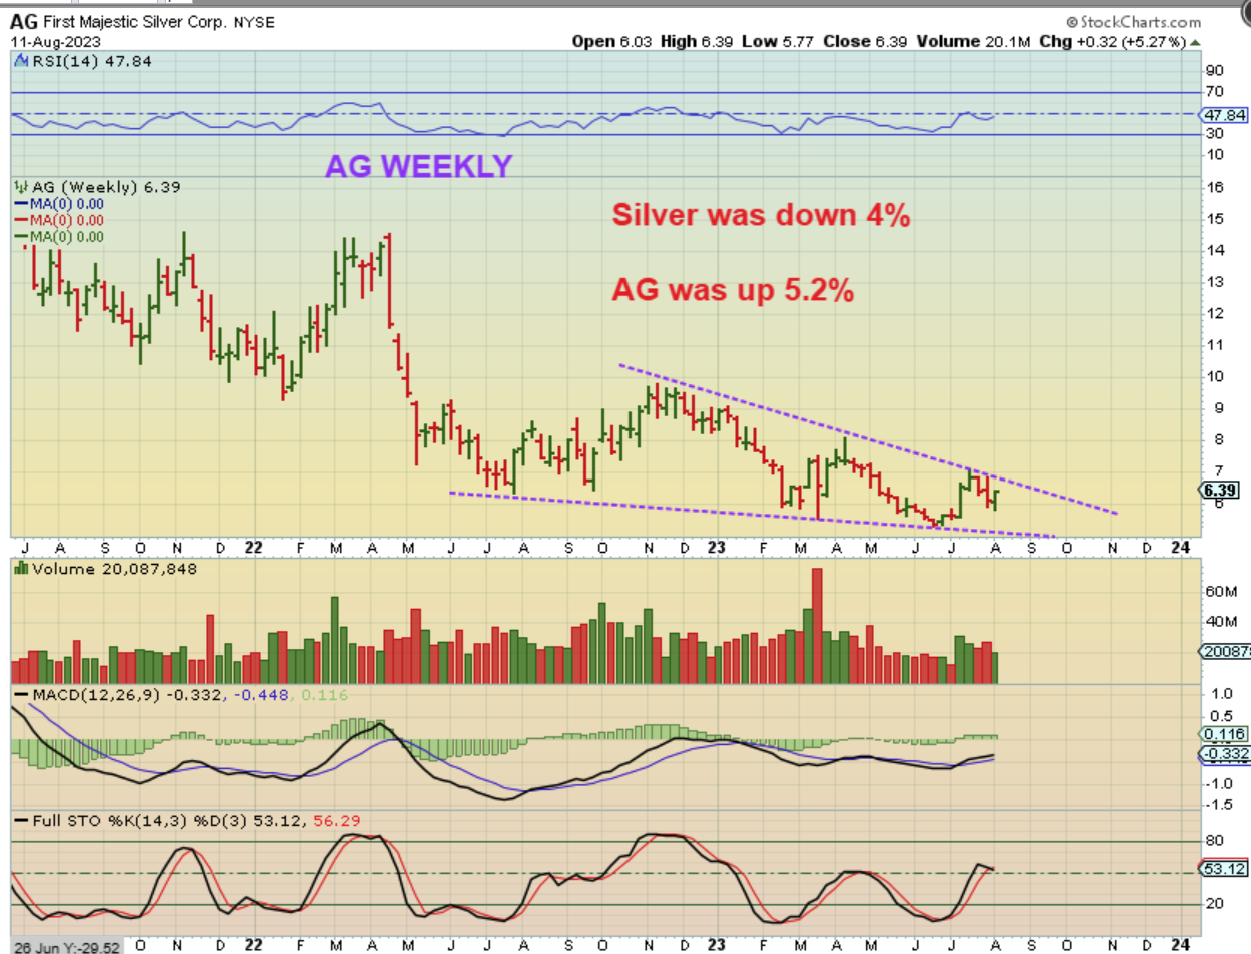
Now we get to The SILVER WEEKLY Chart and wow! Did you know that Silver actually fell 4% last week? Well, we were expecting a drop into a dcl here too and it landed right above the 50 & 200week ma. It is also now due for a dcl, since it is on day 34 Friday. So last week may look ugly to the casual glance, but this is actually just fine, and I will show you some bullishness shortly.
.
Please also notice the tightly Pinched 50 & 200 week ma. This could cause an extremely bullish burst higher when the time is right. This sideways chop over the past few years has bored people to tears and many hate the Miners, but this could unleash a massive rally in Silver stocks. They are on sale right now.
.
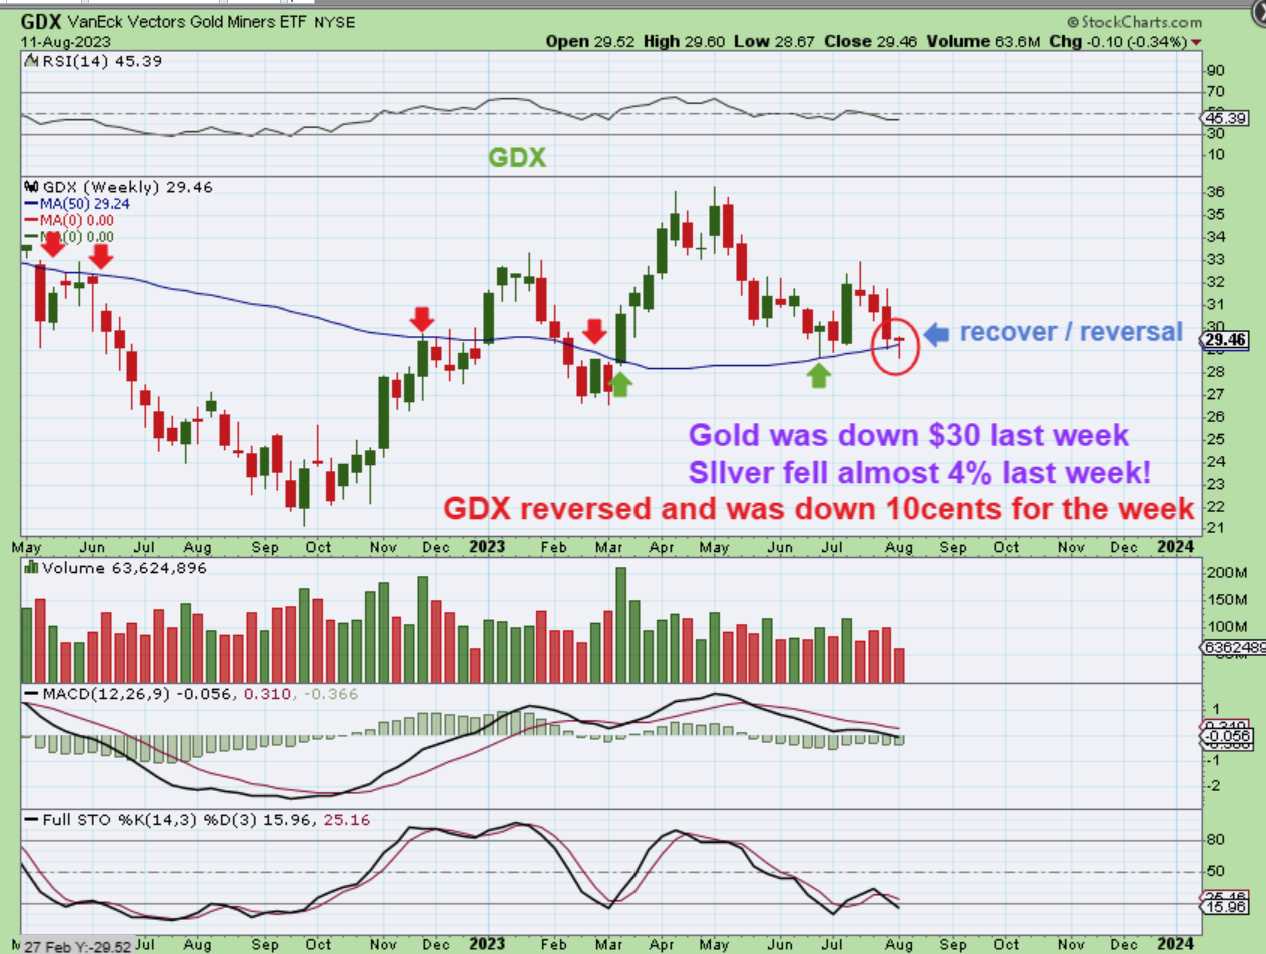
– Gold was down $30,
– Silver was down 4%, and…
GDX was….down only 10 cents for the week!
ARE MINERS LEADING GOLD & SILVER OUT OF THE LOWS? The GDX/GOLD Ratio is now curling upward. Next week may be fun.
.
We really are due for reversals in the Precious Metals next week, so I’m looking forward to seeing how this plays out. If you are a bit of a Gold Bug, then you probably liked the way this report ended, right? Gold down $30, Silver down 4%, yet the Miners were only down 10 cents with a weekly reversal candle? Yes, That is great news for a Gold Bug. And maybe you aren’t a gold bug, but you do love to trade Miners when they are running higher in their bullish phase. Then continue reading. I’m adding a couple of charts to further show the changes that I see taking place that add a little more conviction to the idea that we are ready for a dcl and the start of the 2nd and likely stronger phase of this intermediate cycle.
.
Enjoy your Sunday afternoon!
.
~ALEX
.
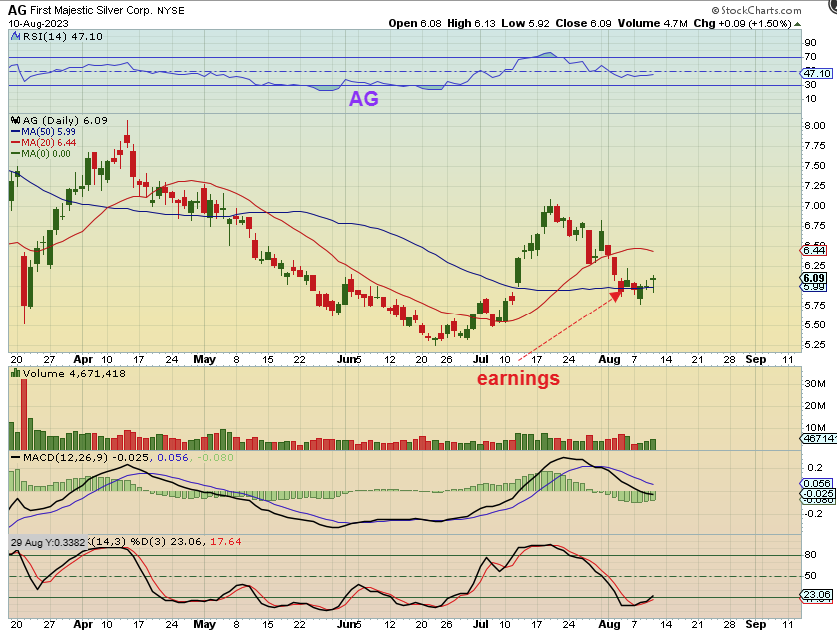
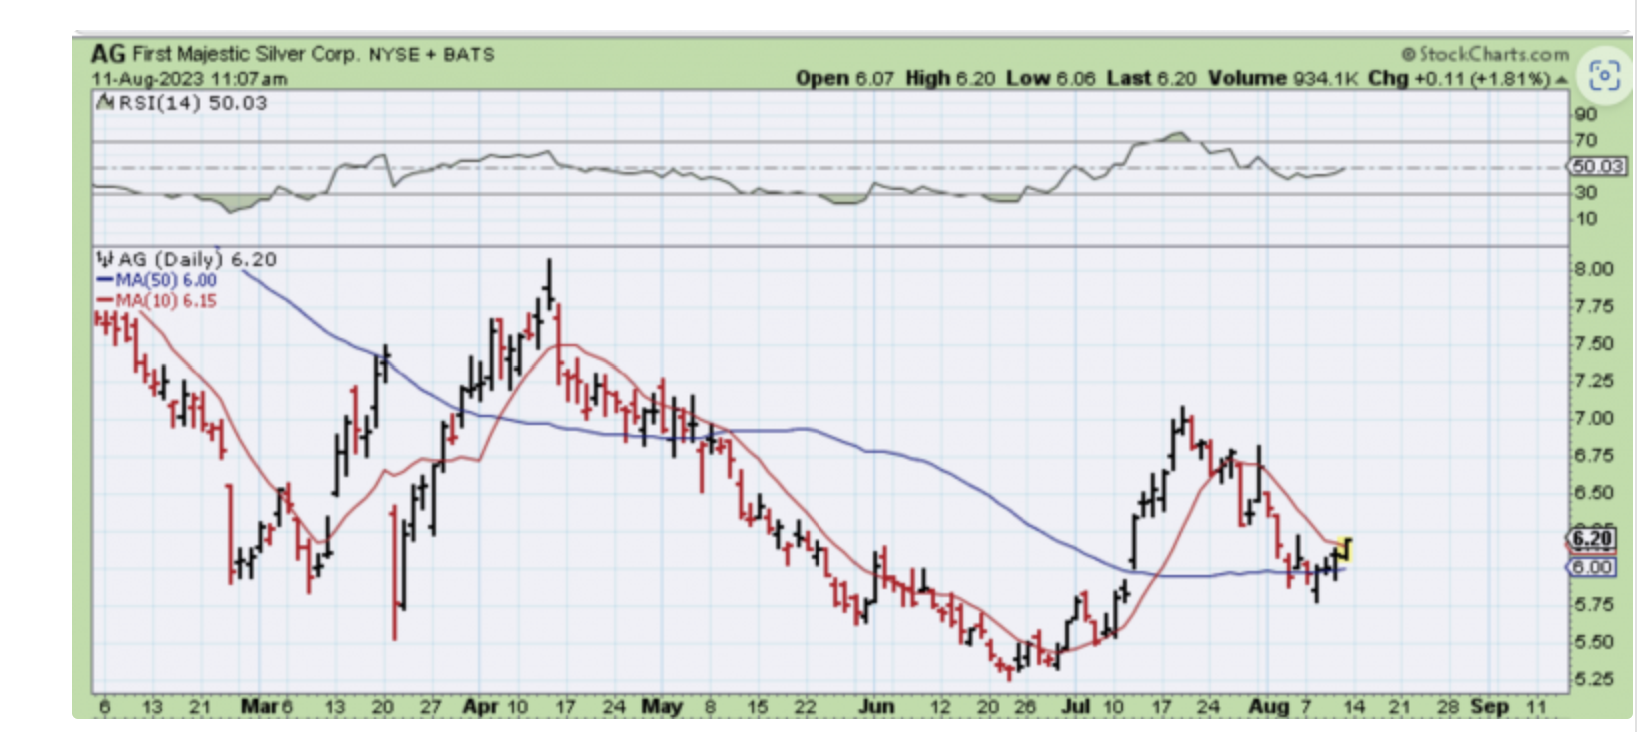
AG AUG 8: AG released earnings and dropped below the 50sma , and then recovered. I posted this as bullish, because SILVER was down 43 cents that day.
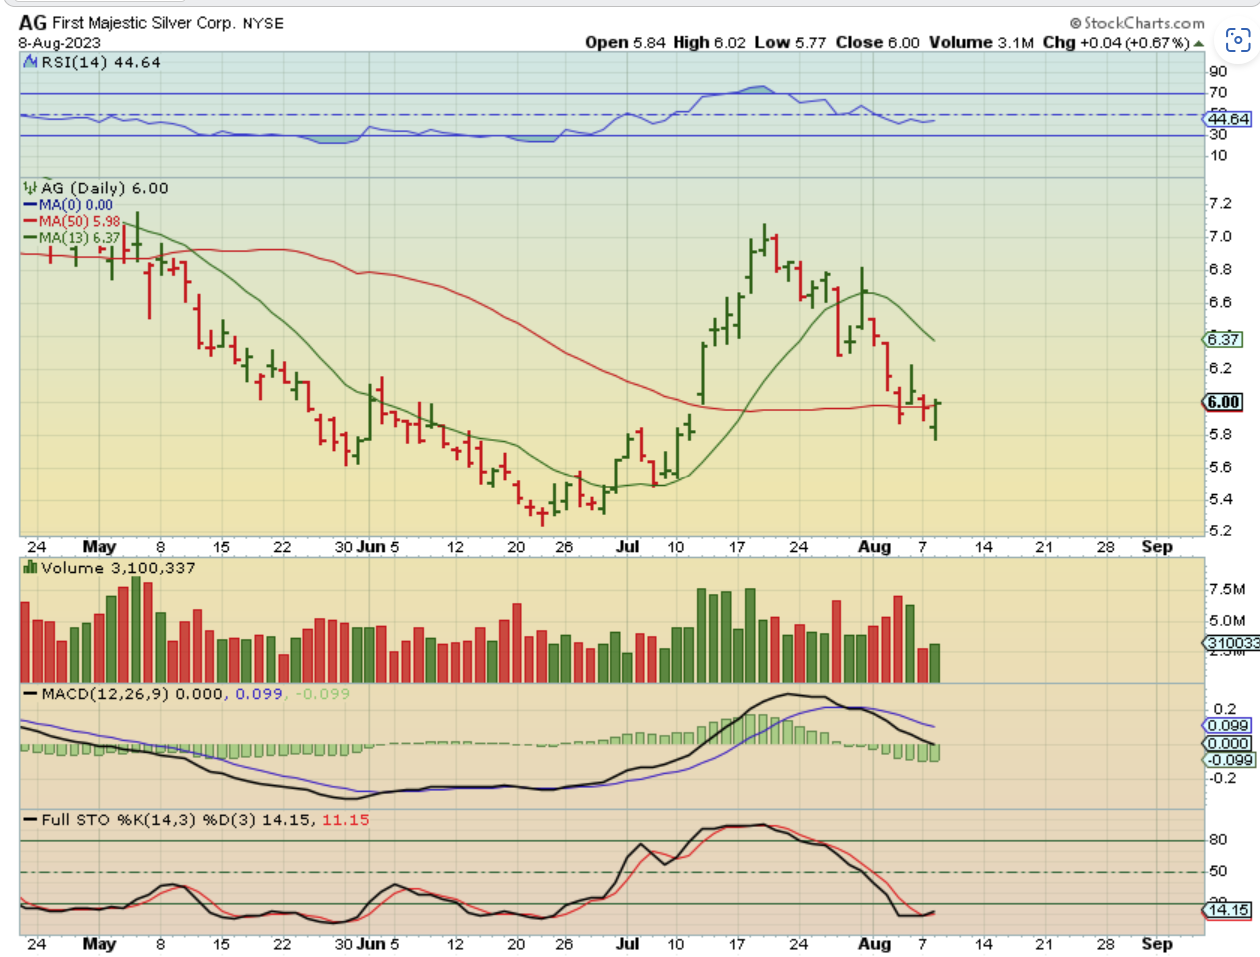
AG AUG 9: Silver was down again, but look at AG at the 50sma. This was a BUY with an easy stop under Aug 8 Lows.
.
AG on AUG 10 was still riding that 50sma, without Silver being bullish.
.
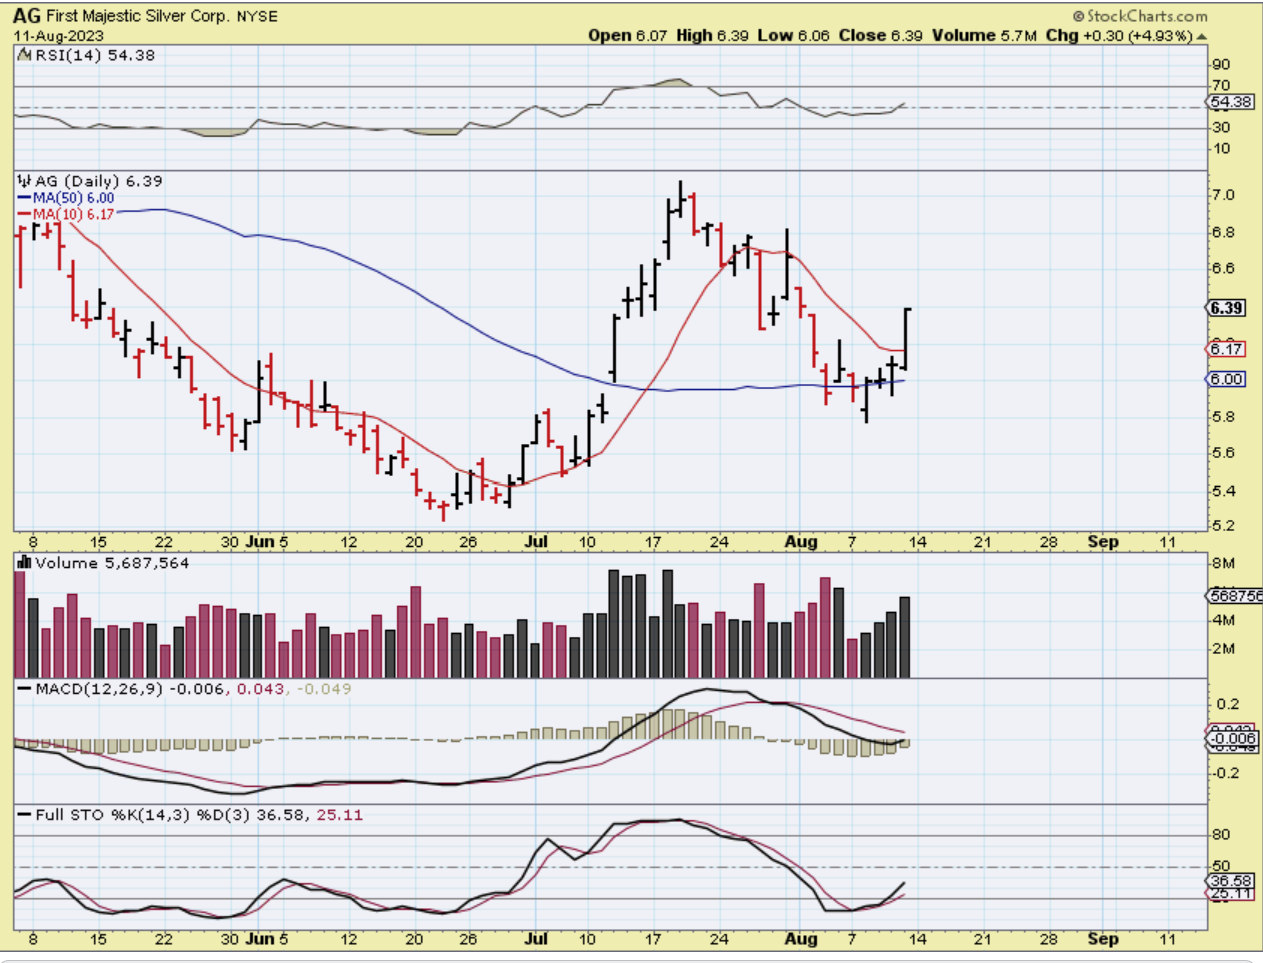
So I posted this chart of AG in the comments Friday as a reminder ( I had it in every report from Aug 8 to now), that this is bullish. This was Friday when Silver was down again, and…
.
AG steadily climbed all day and closed up nicely on Friday. When Silver puts in a bottom, AG will break to new highs.
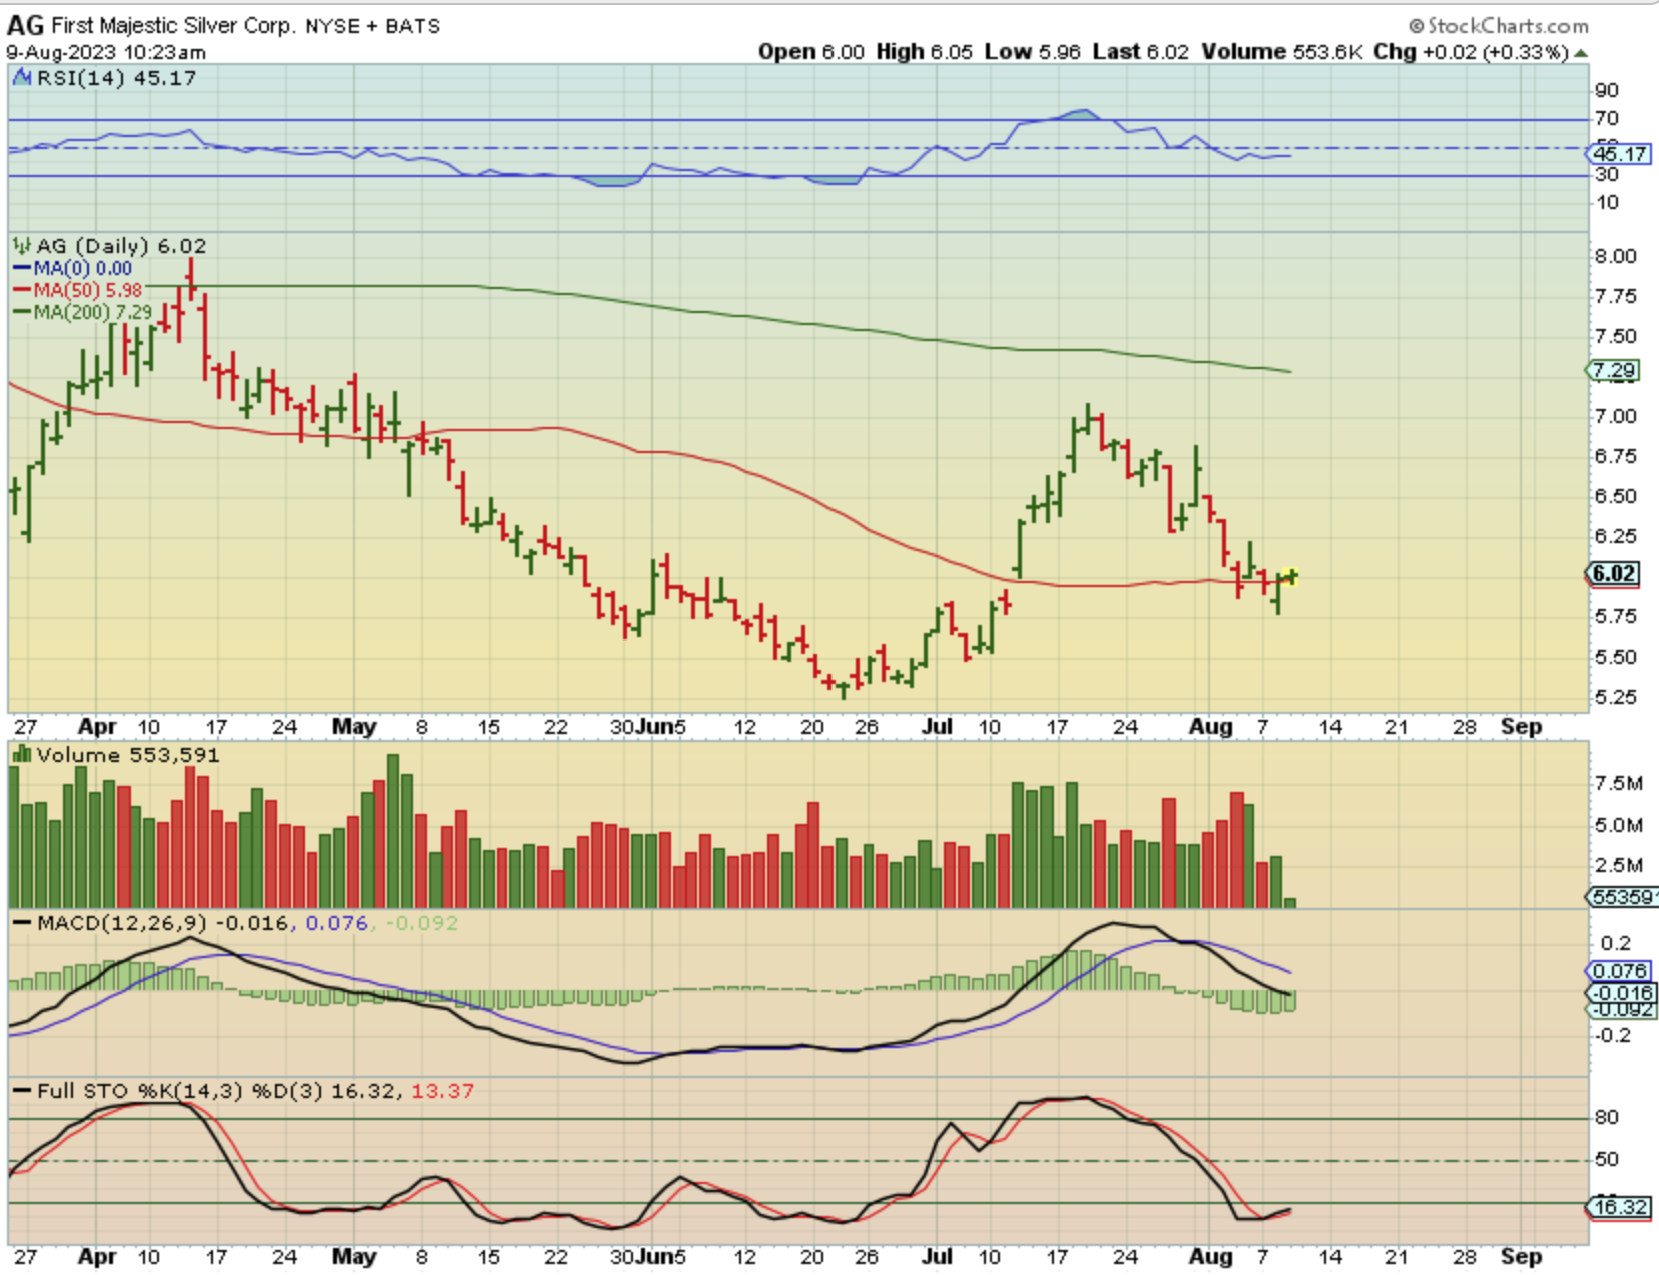
So this is the WEEKLY chart of AG: Silver was down 4% last week and AG was up over 5%. Usually, Miners CRASH HARD when Gold or Silver drops, so we are seeing bullishness ahead of Gold and Silvers dcl. This chart is a bullish wedge on the weekly basis. Ag could easily double or triple if we get a bull run in Silver.
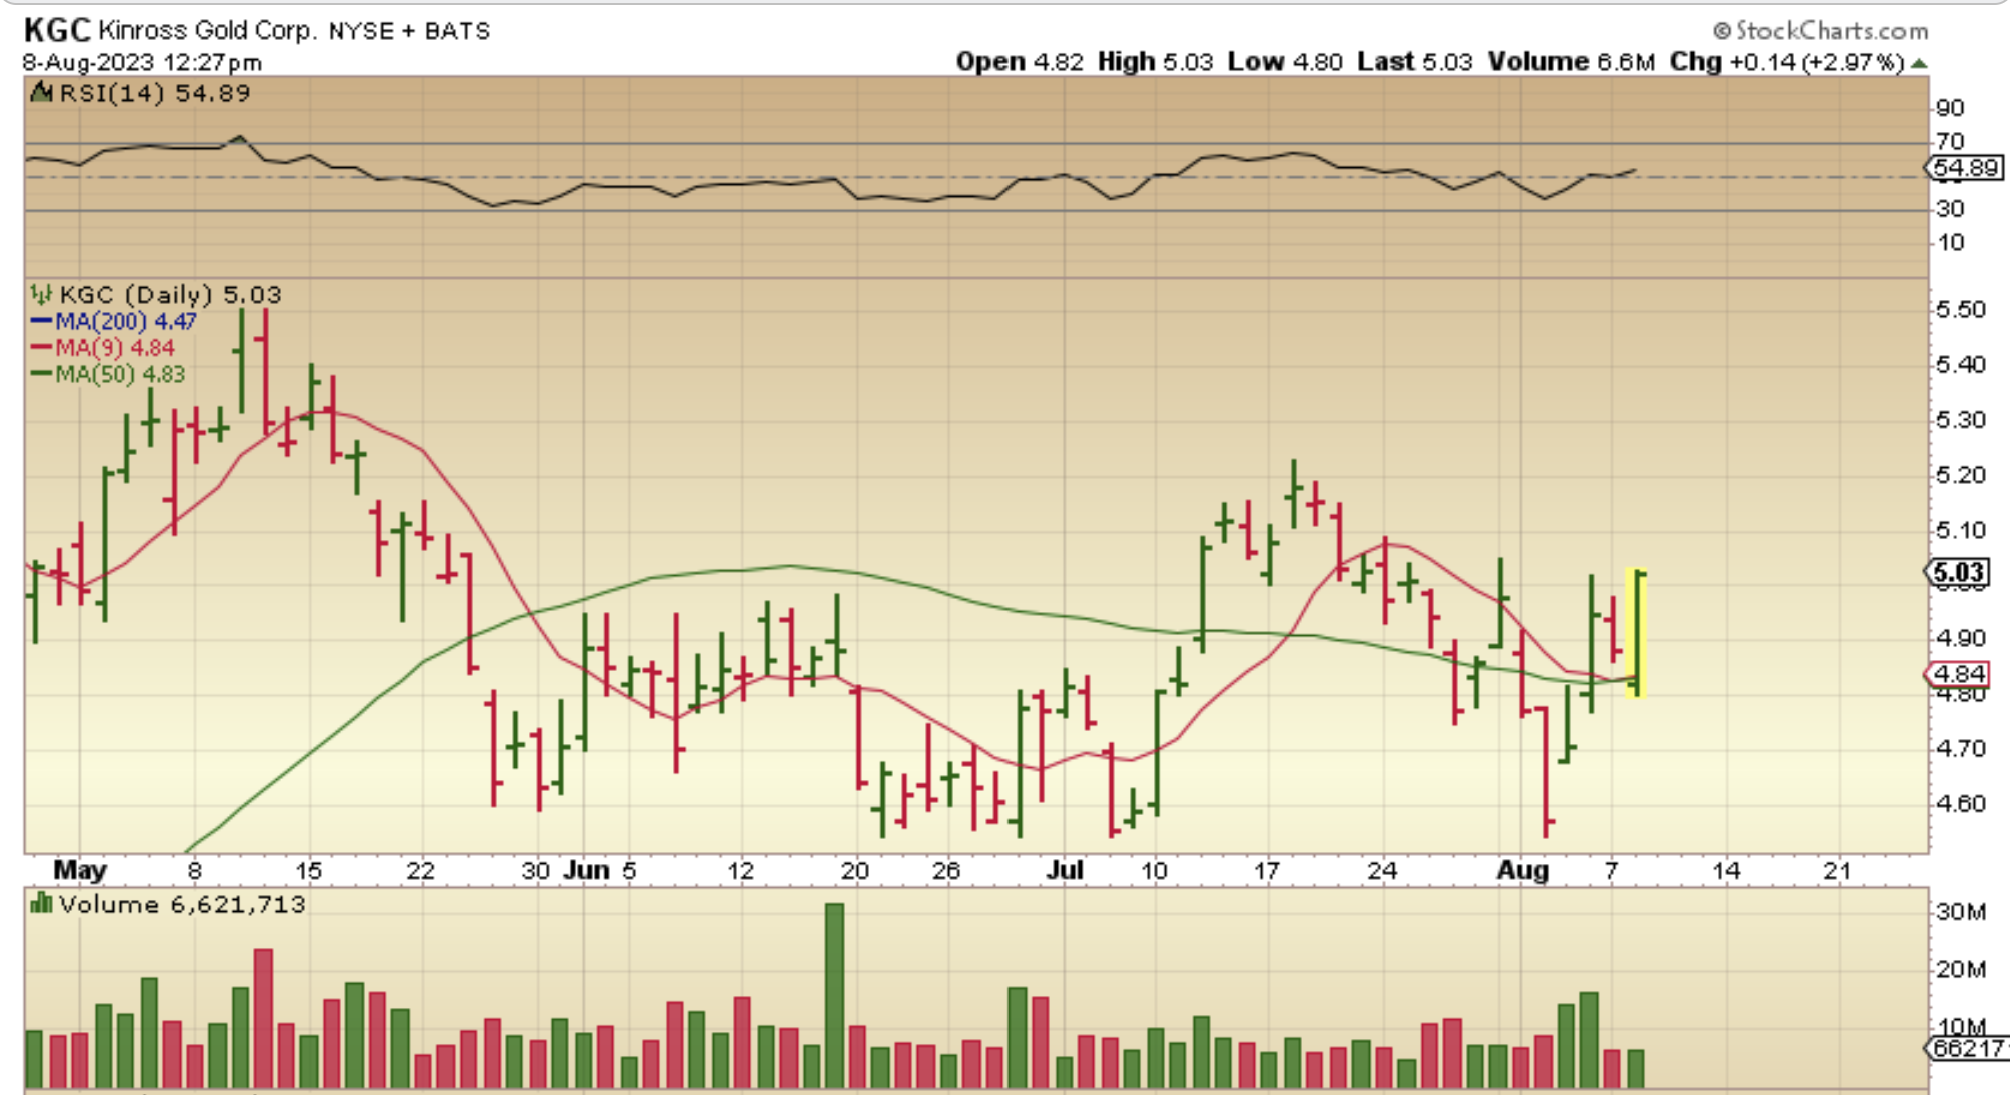
Recently I also posted charts like this one of KGC as being bullish ahead of Gold.
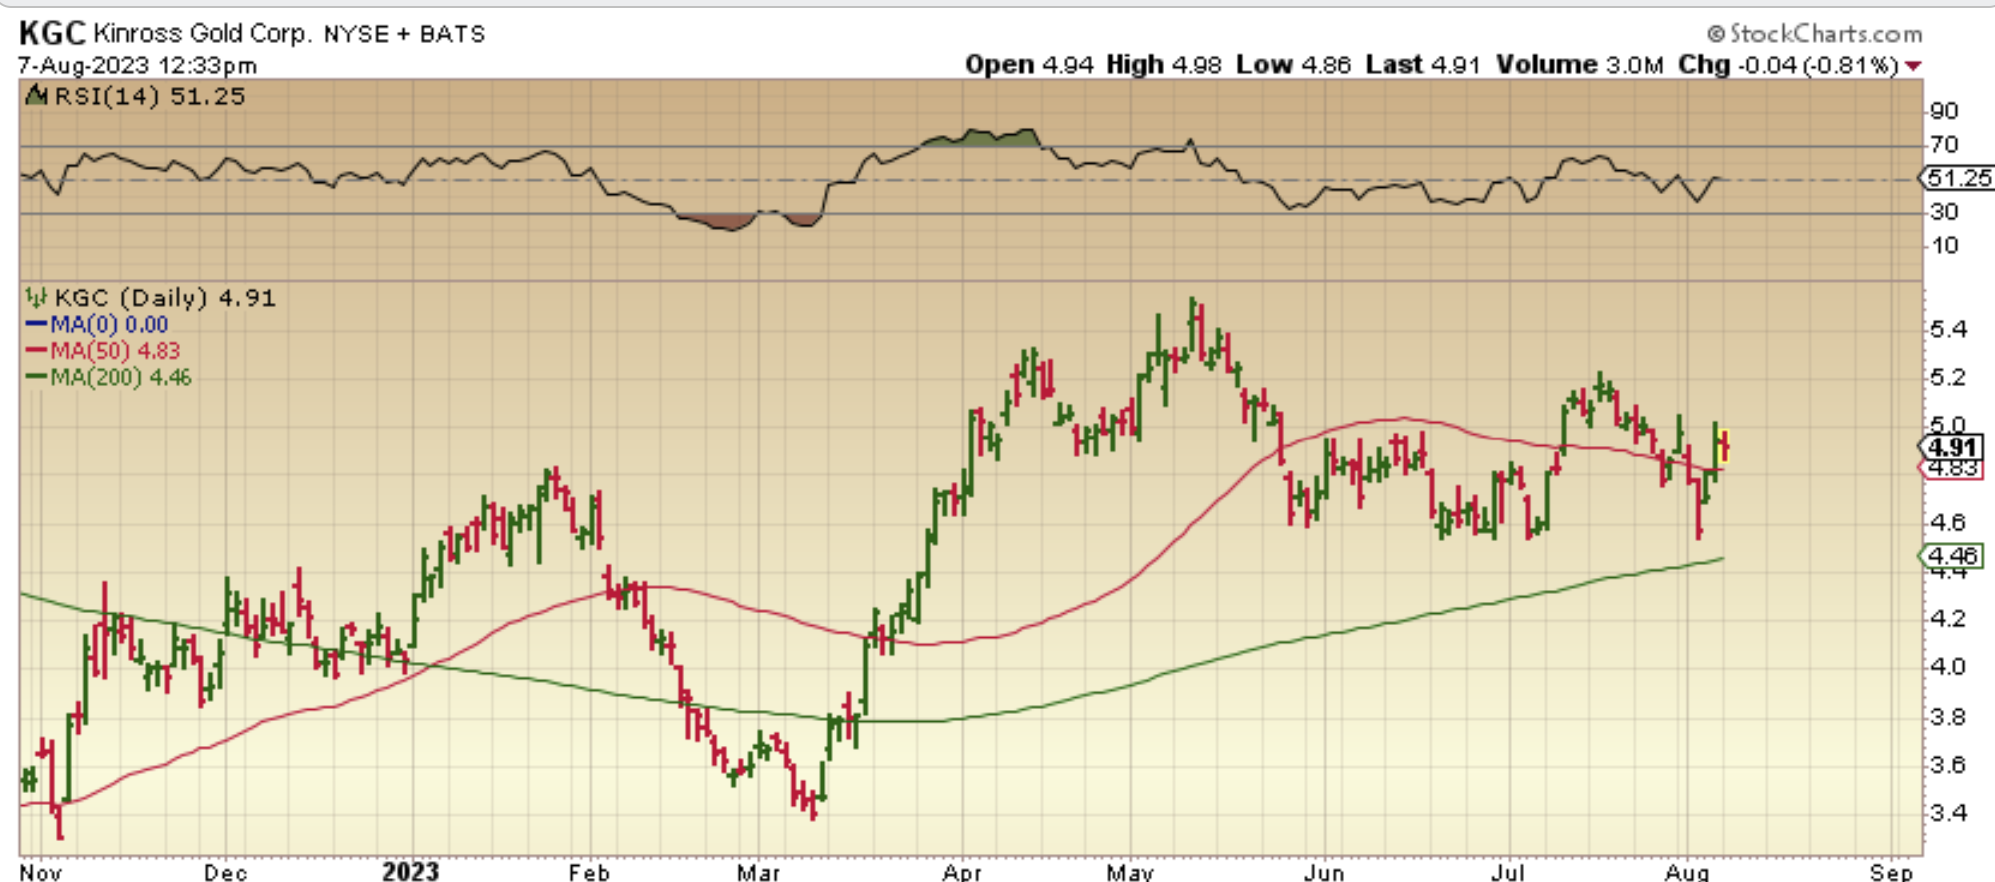
.
KGC pushed higher at the 50sma on Aug 8.
.
And the Weekly KGC Chart shows a Weekly Bullish Triangle or wedge too.
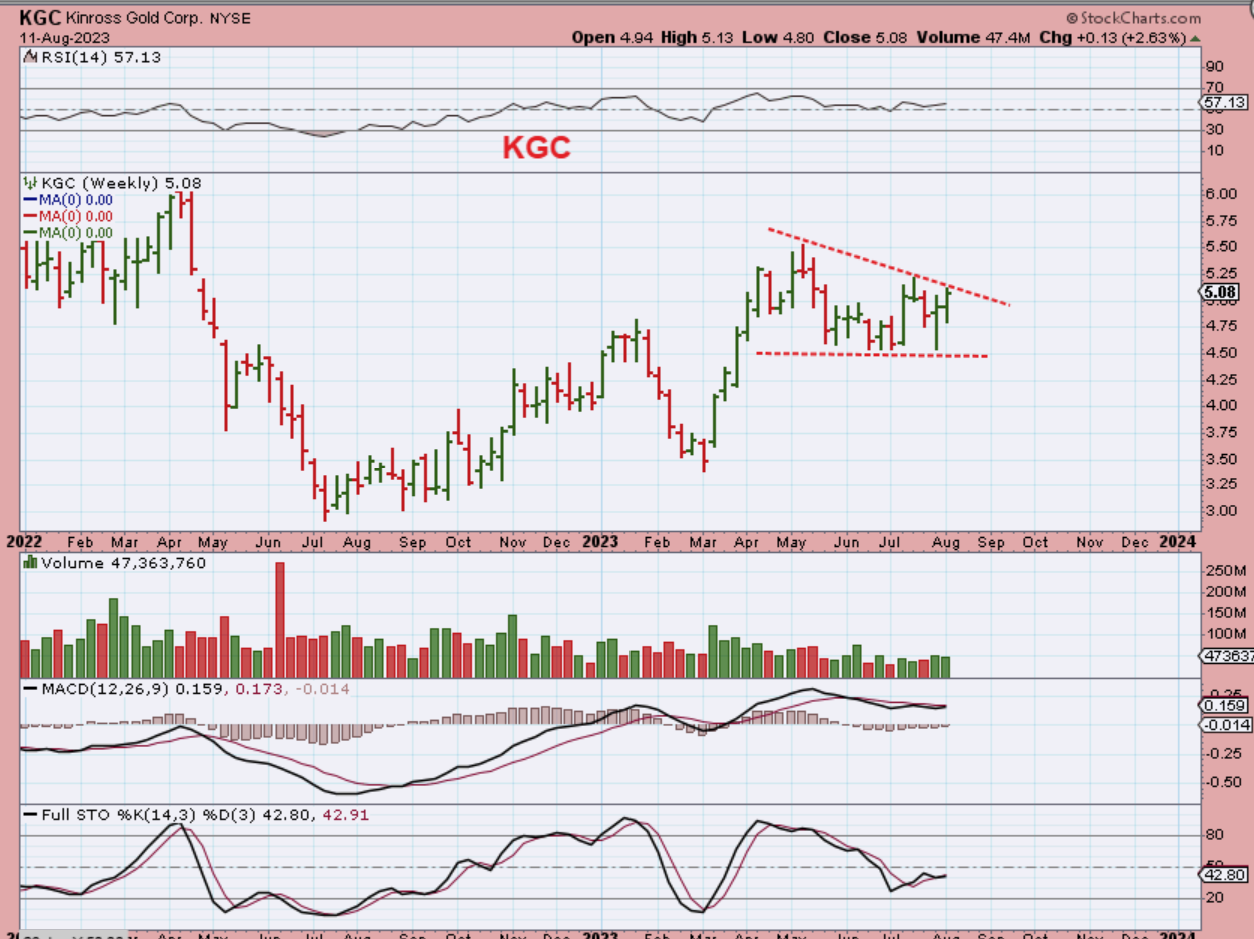
.
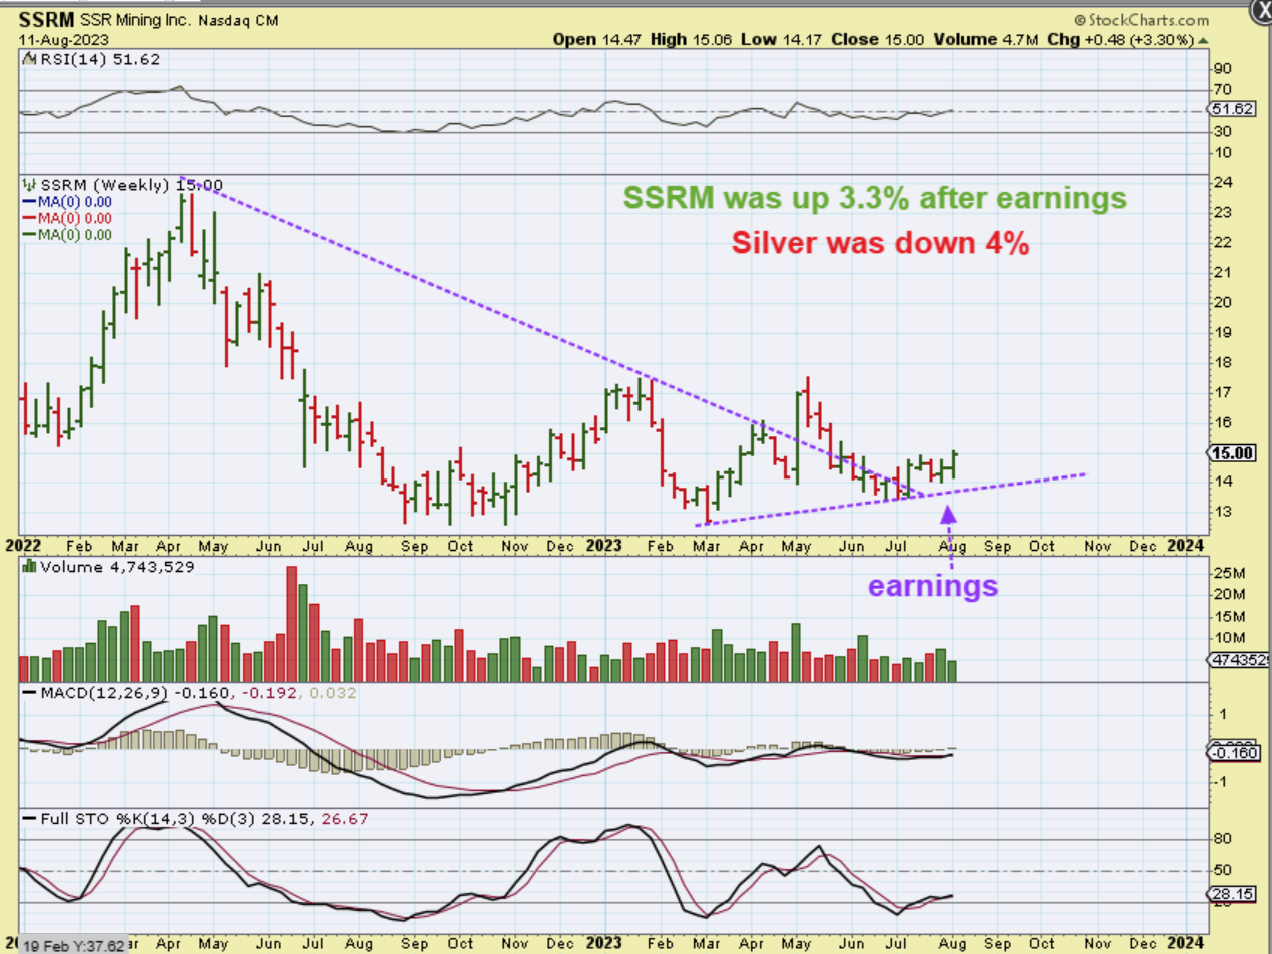
SSRM is also moving higher post earnings, even with Silver down 4% last week. These are a few of the leaders and I am looking forward to seeing how the rest follow.
.
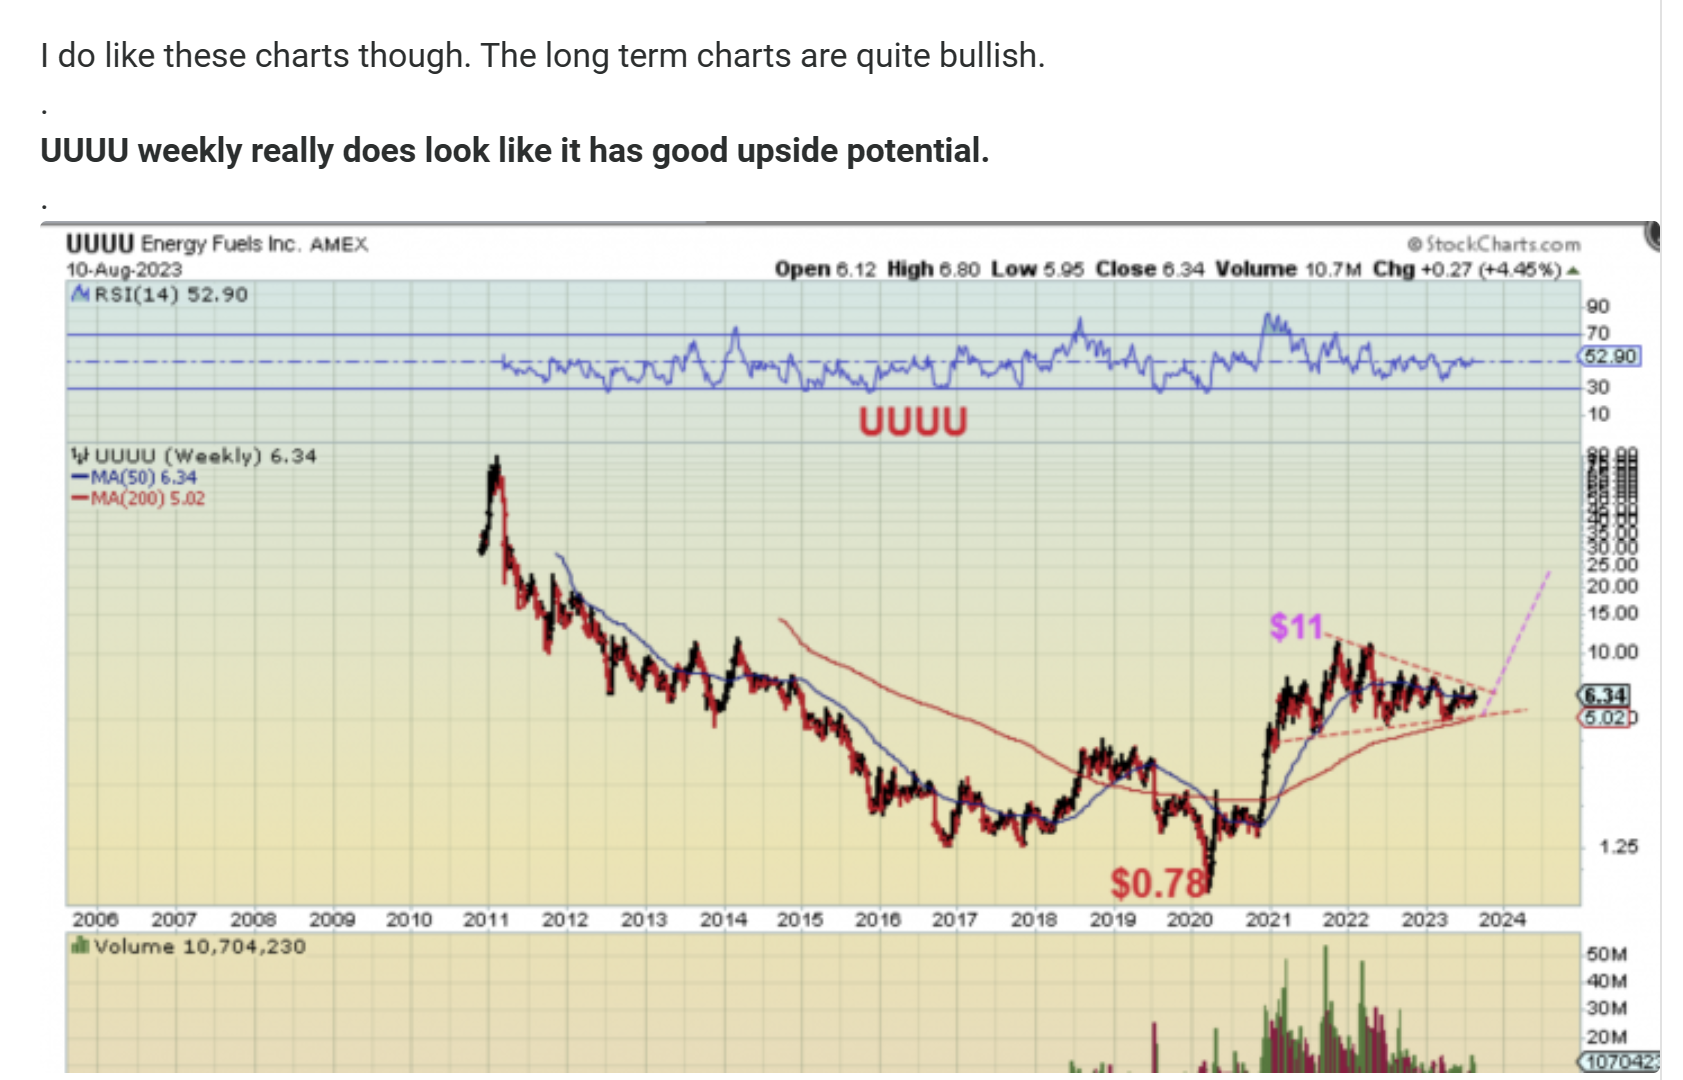
URANIUM STOCKS ARE STILL SHAPING UP: THEY MAY BE READY TO RUN WITH THE PRECIOUS METALS MINERS.
.
.
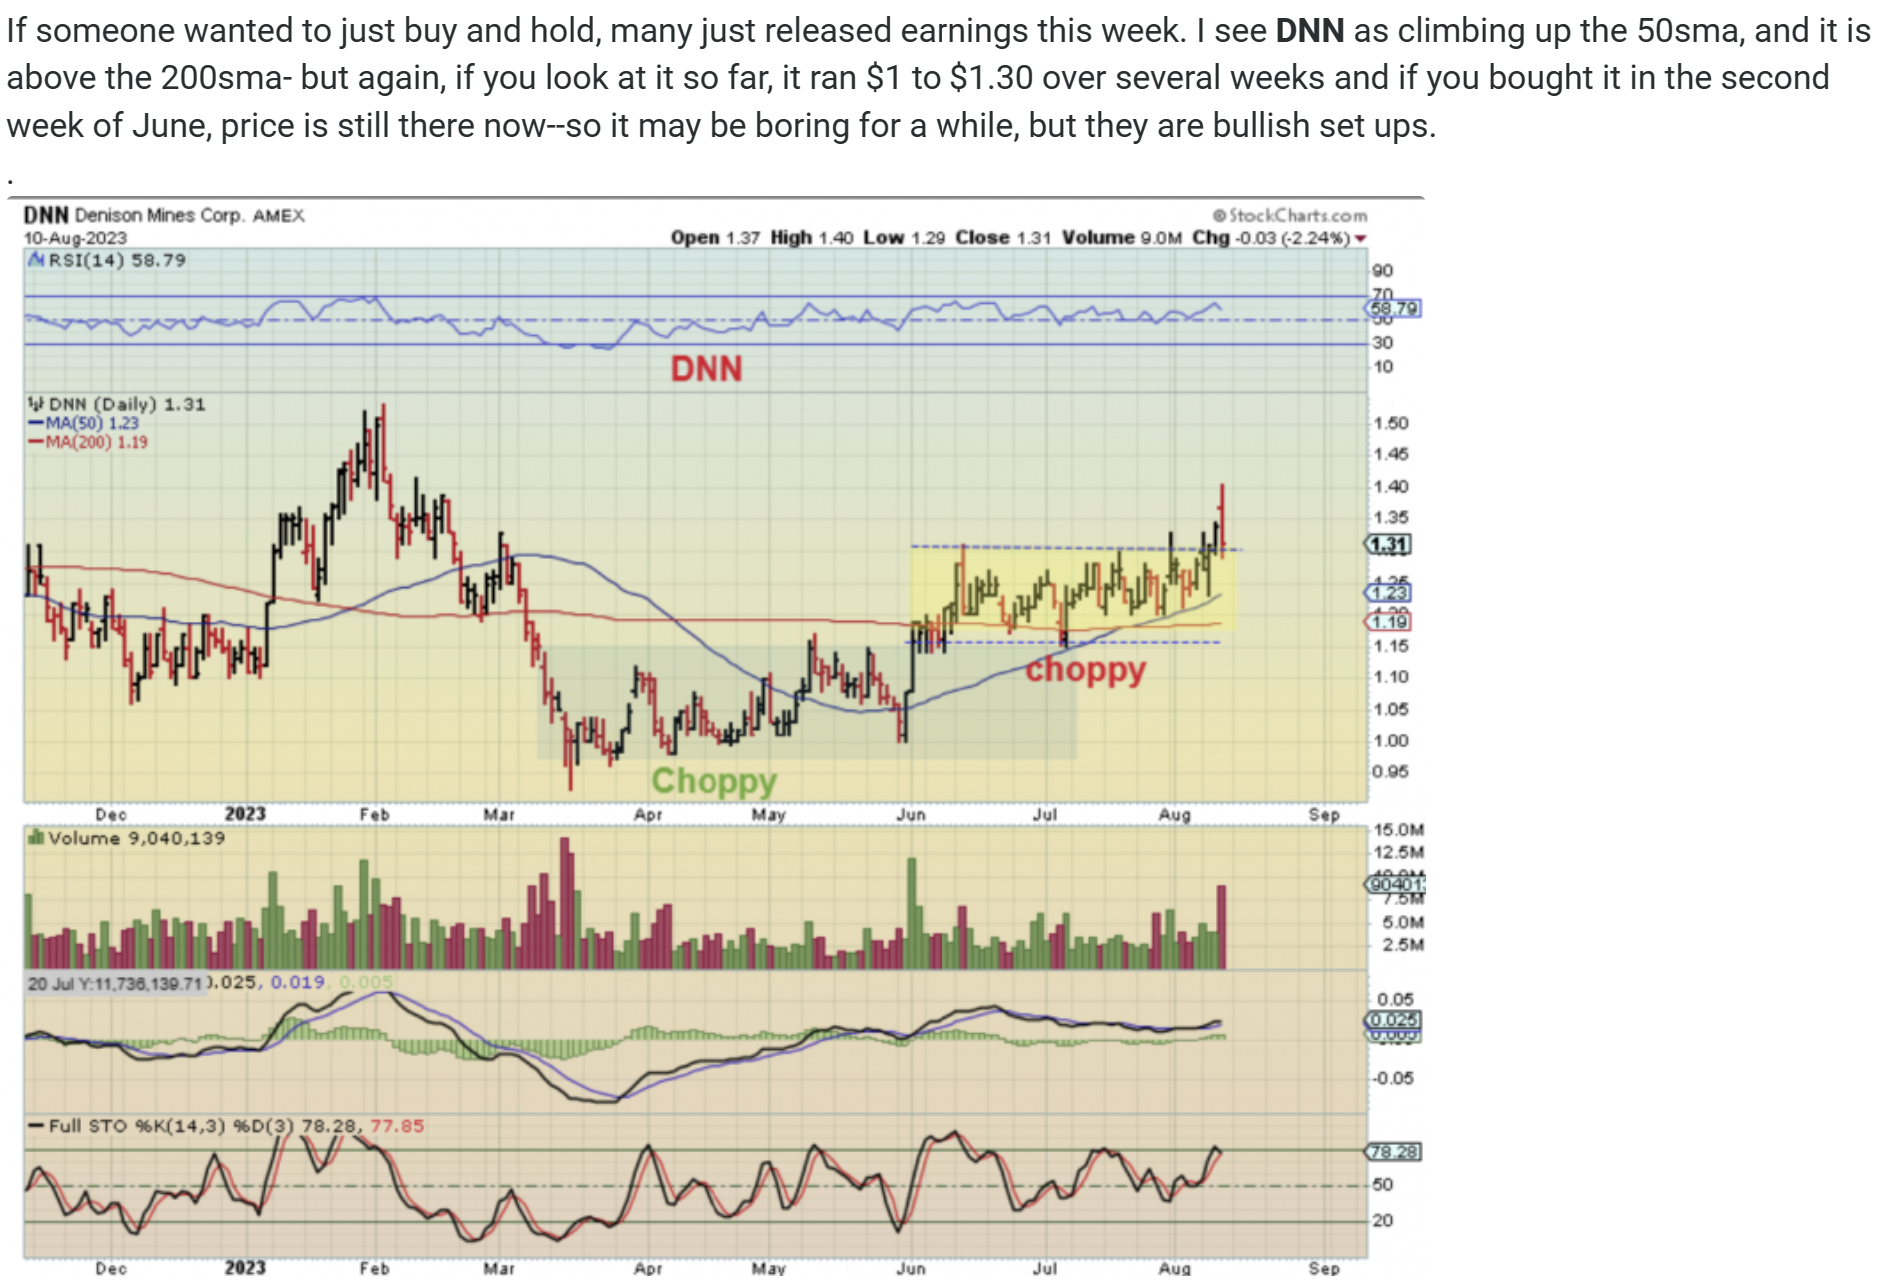
NANCY WAS ASKING ABOUT THESE URANIUM STOCKS, AND I REPLIED THAT THEY DO LOOK BULLISH (They can be quite choppy though at times) . Thanks for the reminder Nancy! I wrote in the commenting area…
.
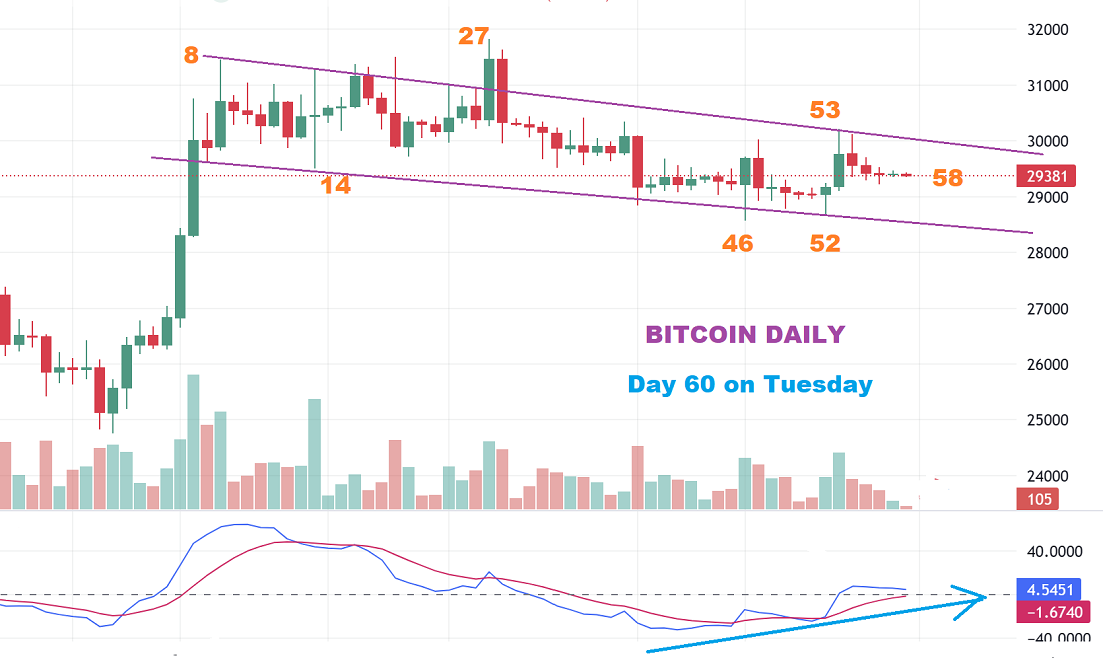
SOMETHING ELSE TO WATCH: A BITCOIN DCL IS DUE AROUND DAY 60
.
BITCOIN is on day 58 on Sunday, so officially day 60 would fall on Tuesday. It is possible that days 46 and 52 are a bottoming process, but one more slam down around day 60 is possible. With that in mind I noticed that…
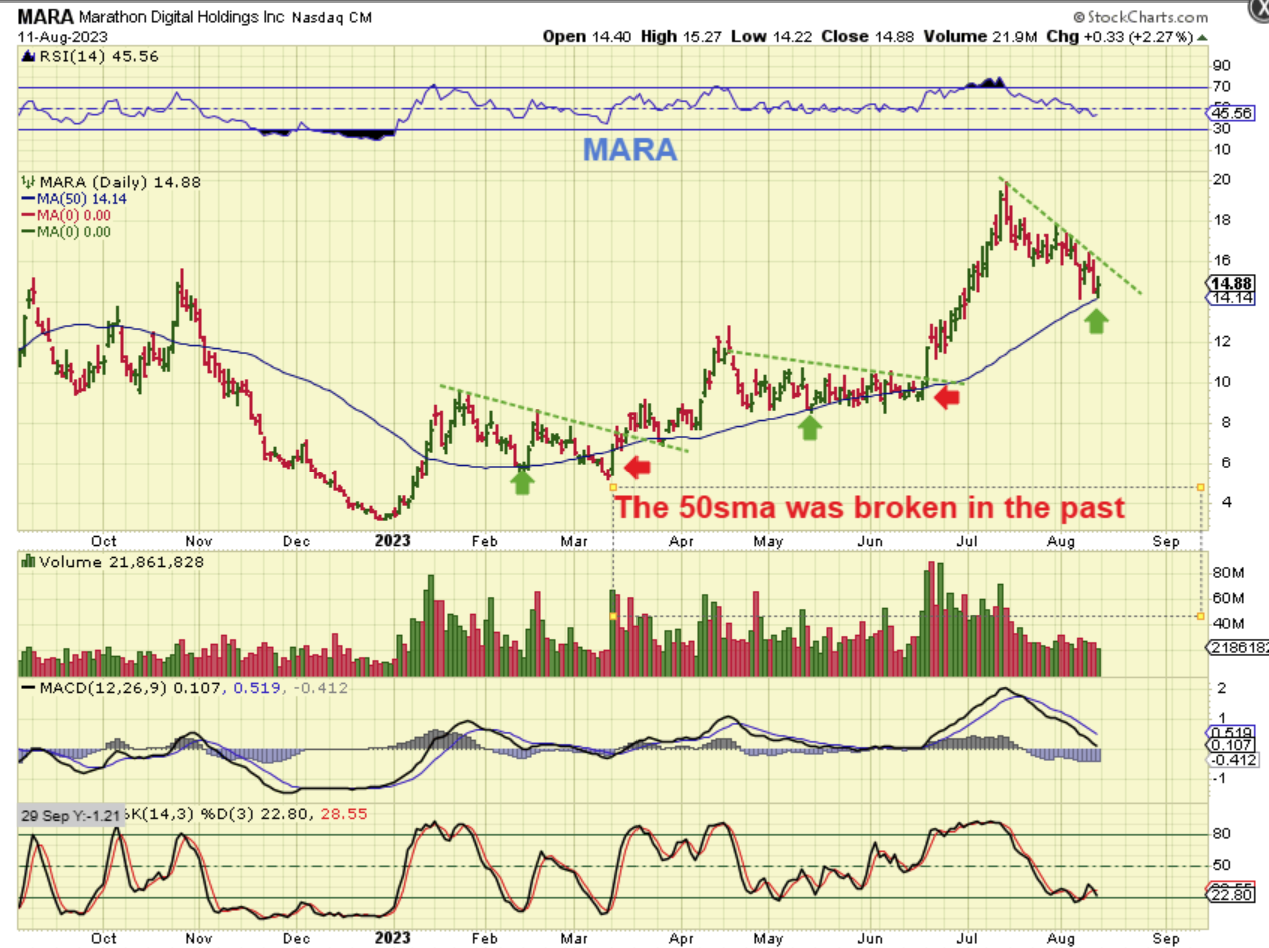
MARA – With that Bitcoin DCL in mind I noticed that many of the Crypto stocks are bouncing along the 50sma. In the past the 50sma did not exactly hold as perfect support as you can see on this chart, but MARA released earnings last week and did hold it well.
 .
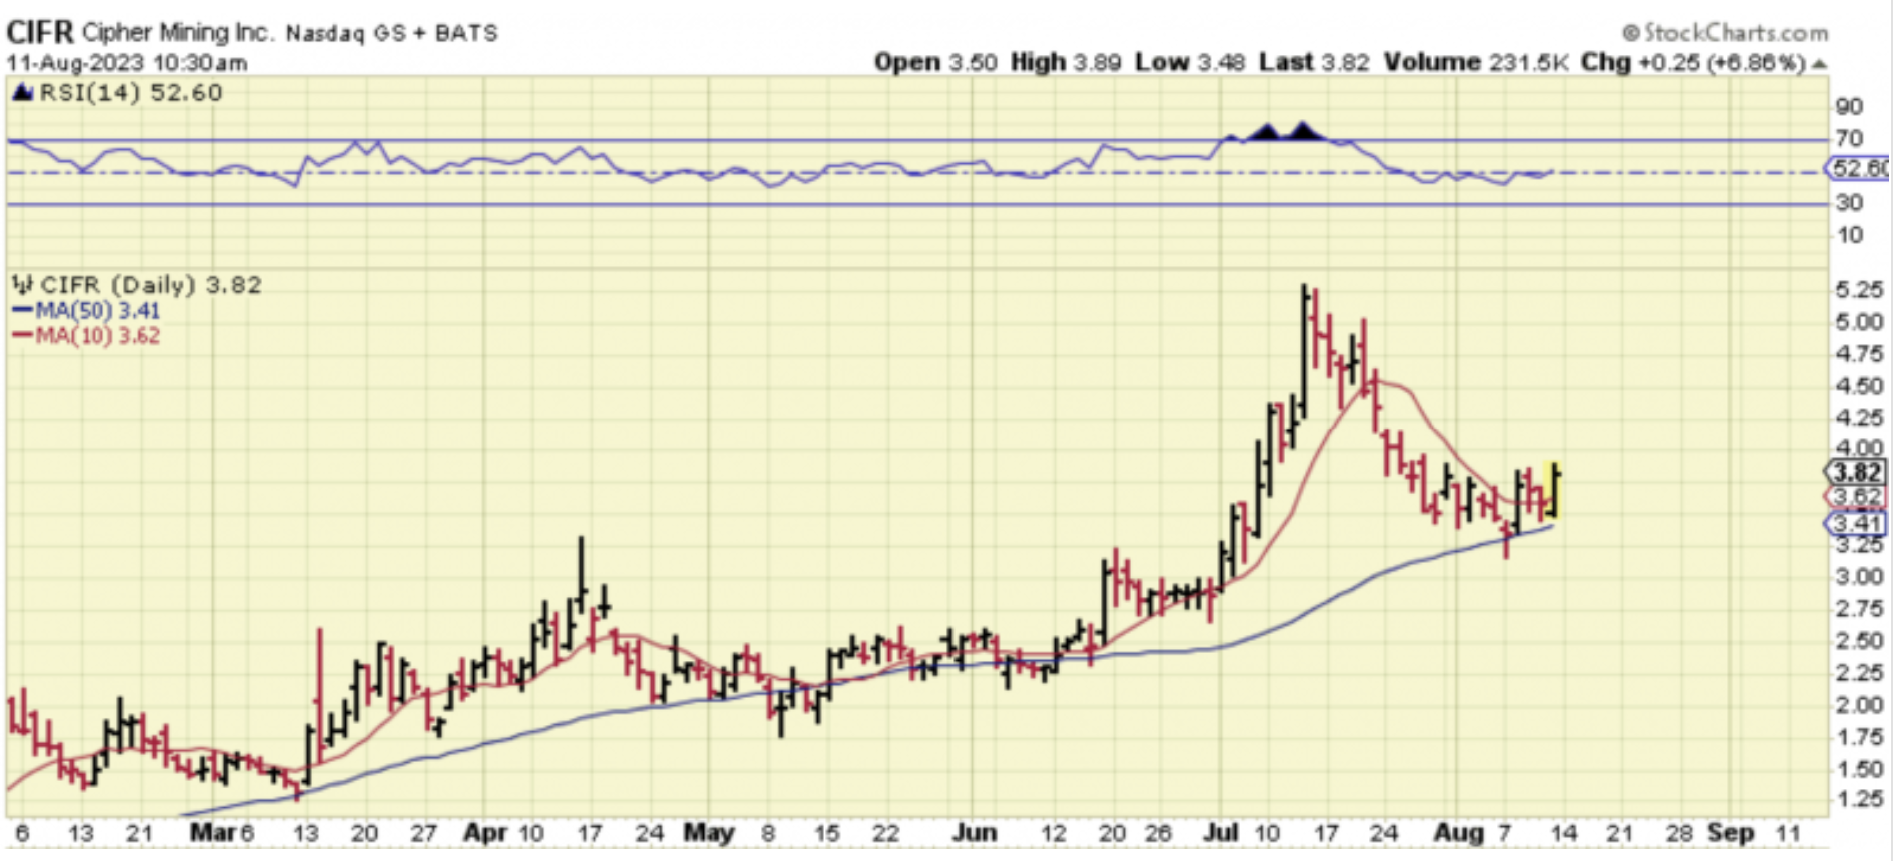
.CIFR also released earnings and bounced along the 50sma.You can also see that in the past it lost and regained that 50sm a couple of times.
.
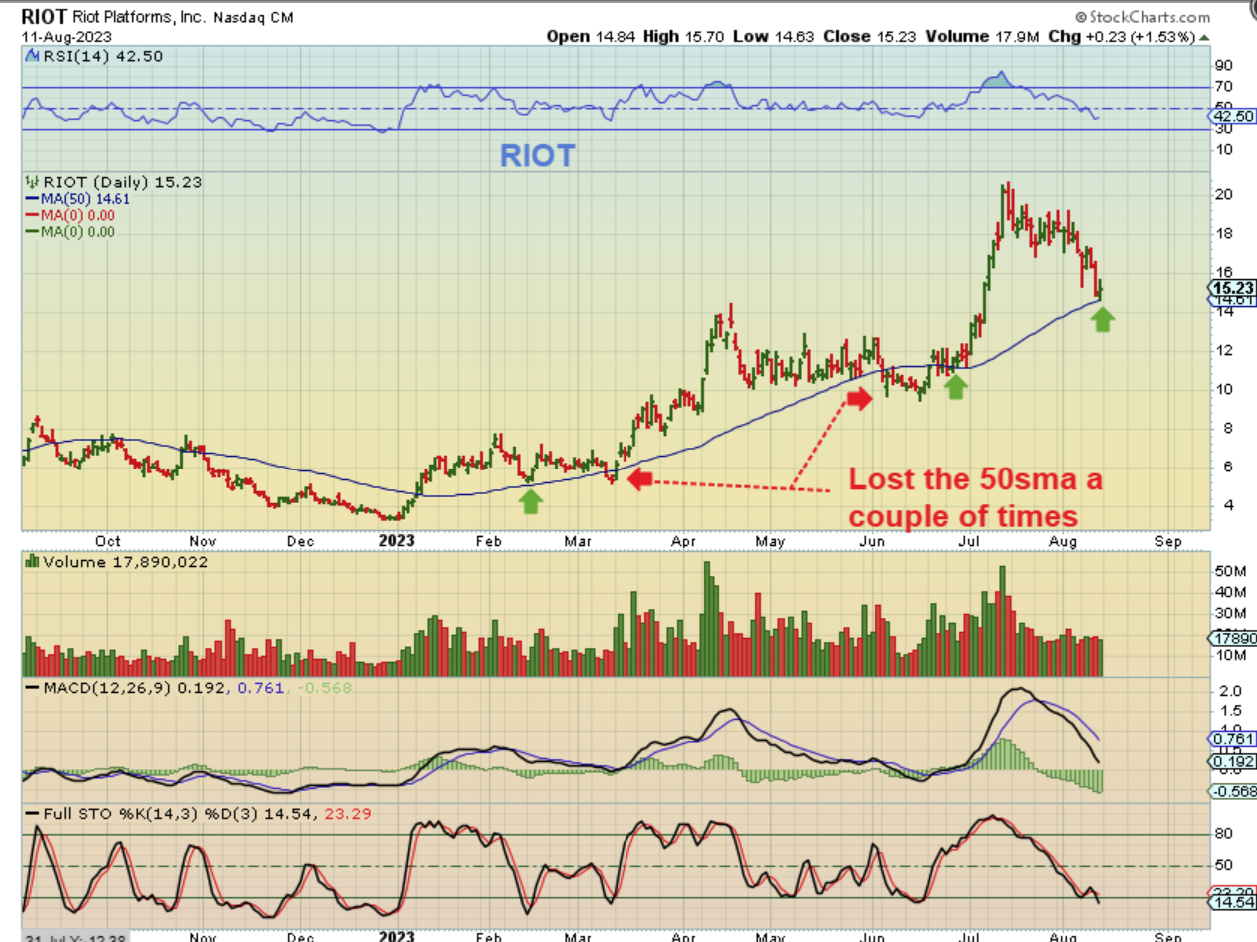
RIOT, HUT, HIVE and many others also landed at the 50sma, but also lost that 50sma in the past, so if Bitcoin drops 1 more time, they may lose and then try to regain the 50sma. So check your charts, this may be an area to watch next week too.
.

