Wednesday August 2nd
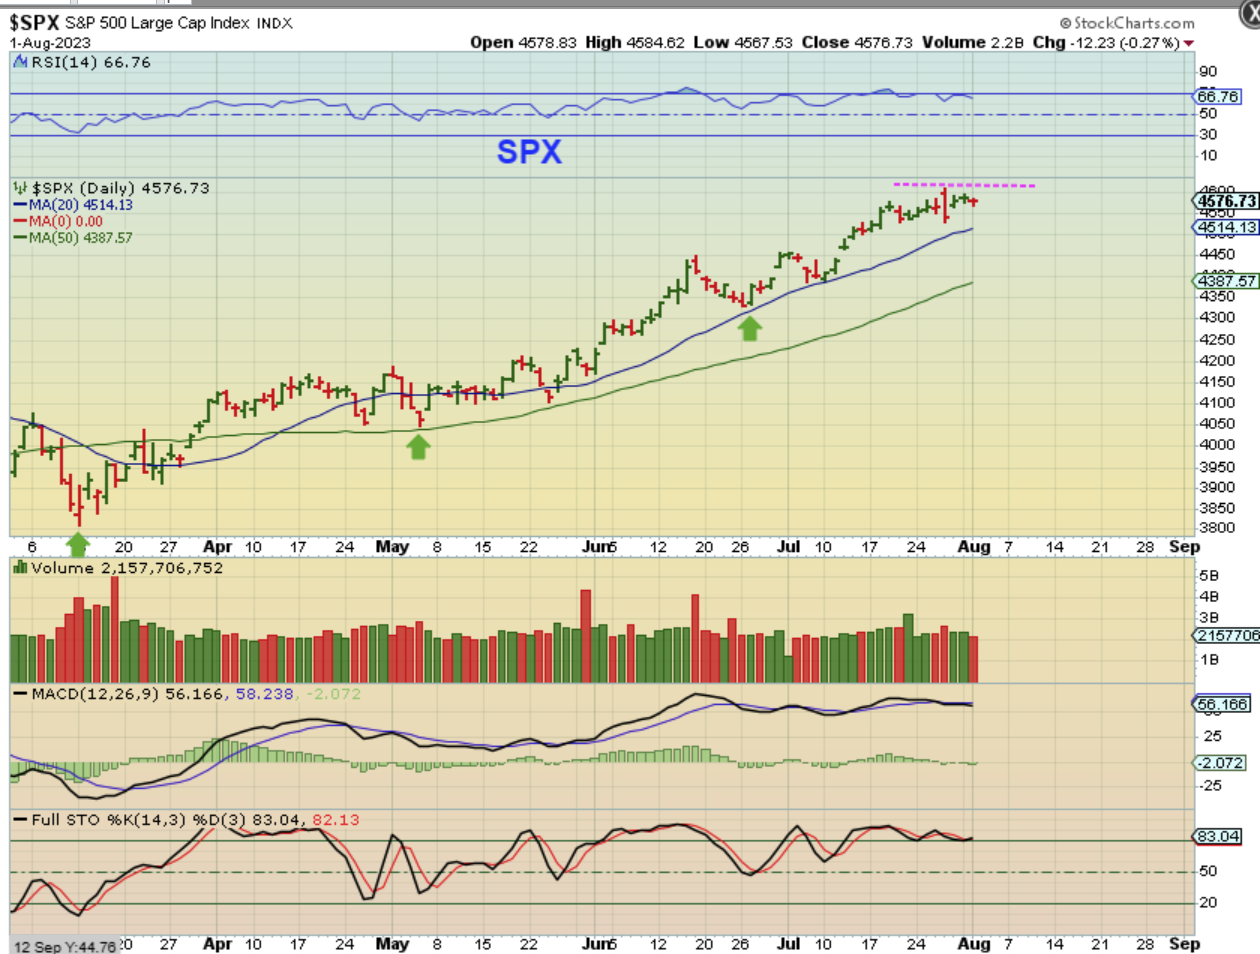
SPX – We saw a Day 22 bearish engulfing, and that has remained the ‘peak’ so far for The SPX. That makes this day 25 and it can begin to drop lower at any time. So far the bulls have been in control.
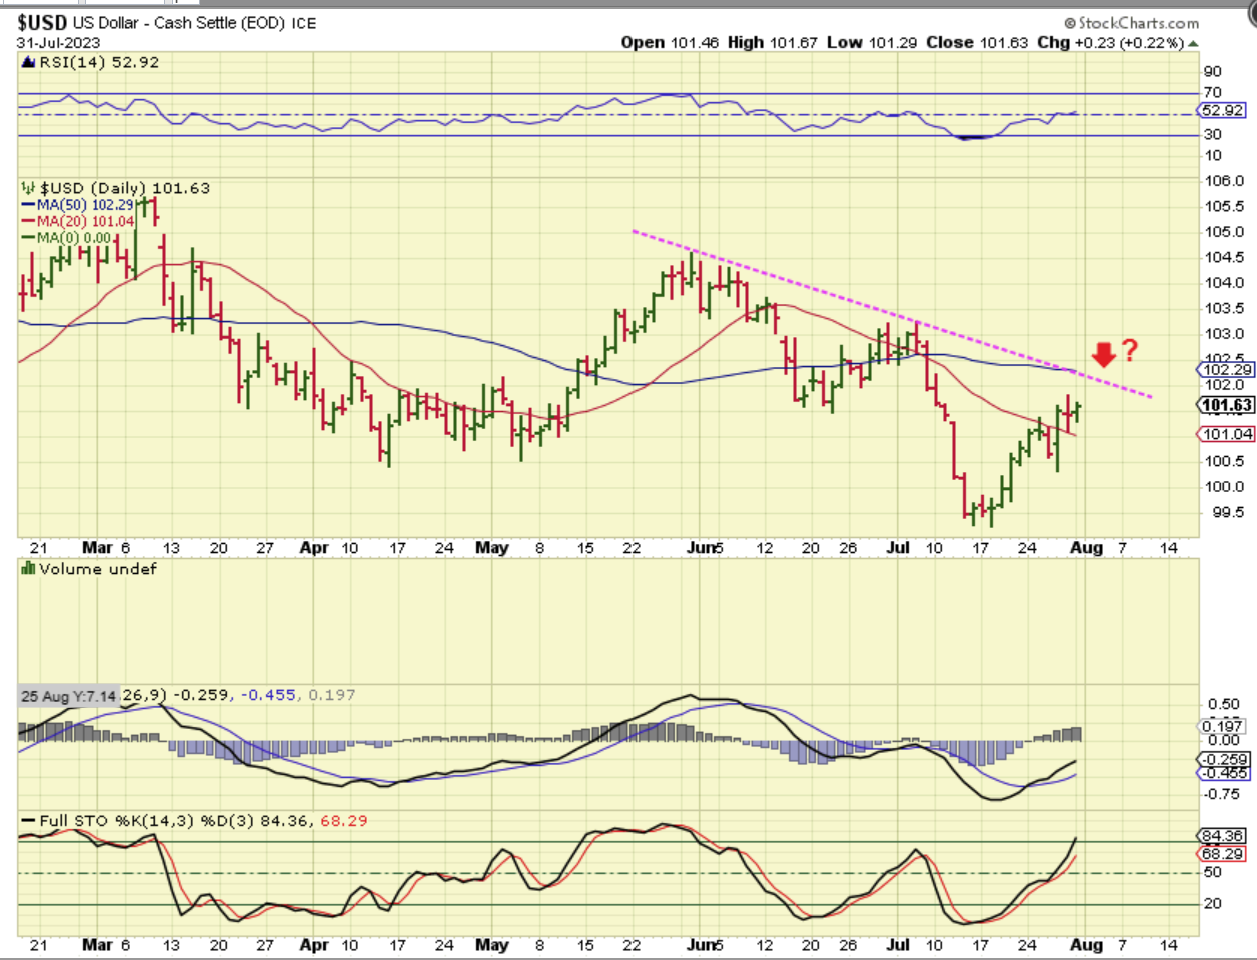
This was THE USD on Monday as it bounced toward a possible resistance area…
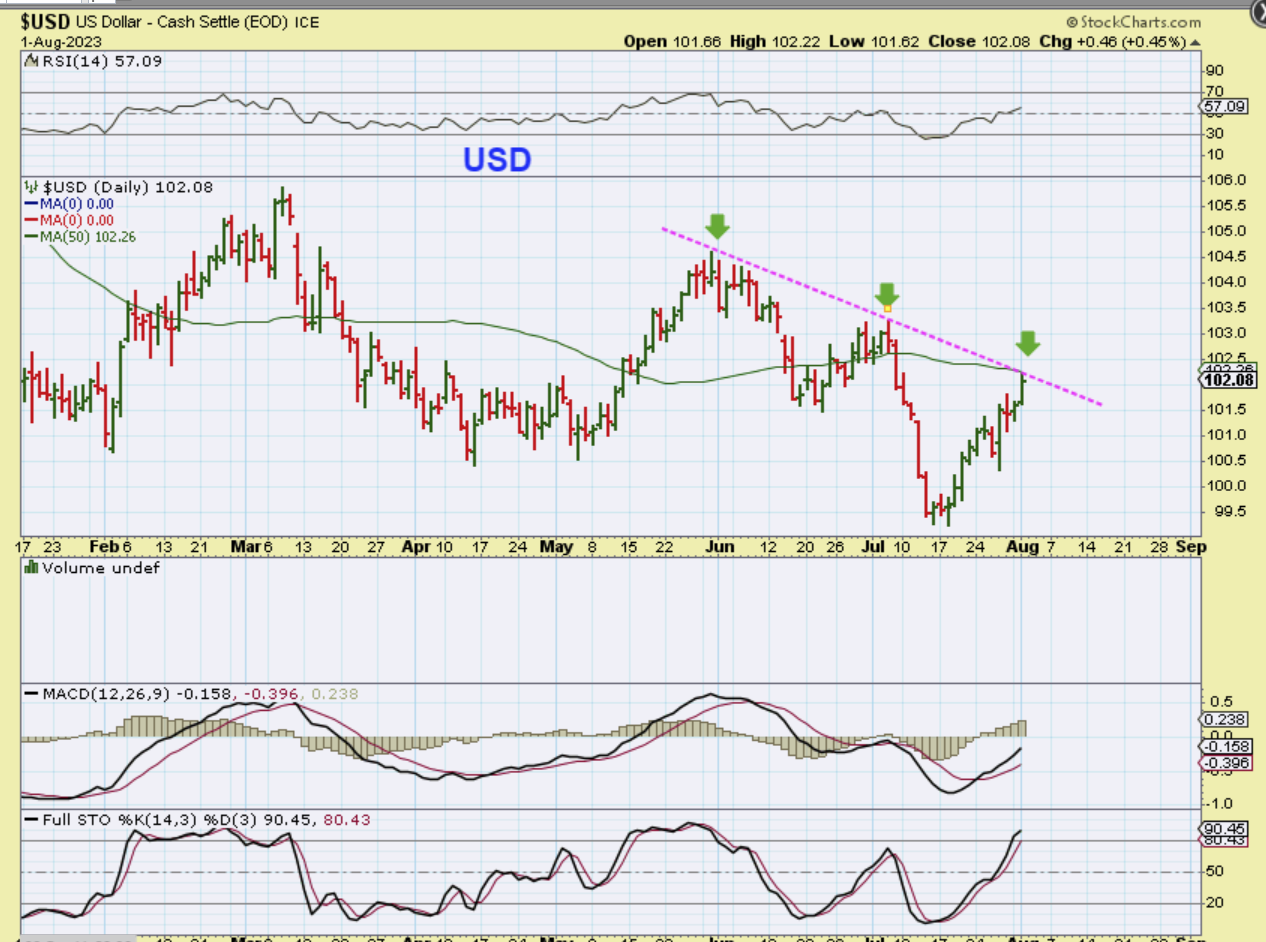
THE USD pushed higher on Tuesday, and it reached that resistance area. This pop dropped Gold, and now we’ll see if it really does act as resistance.
.
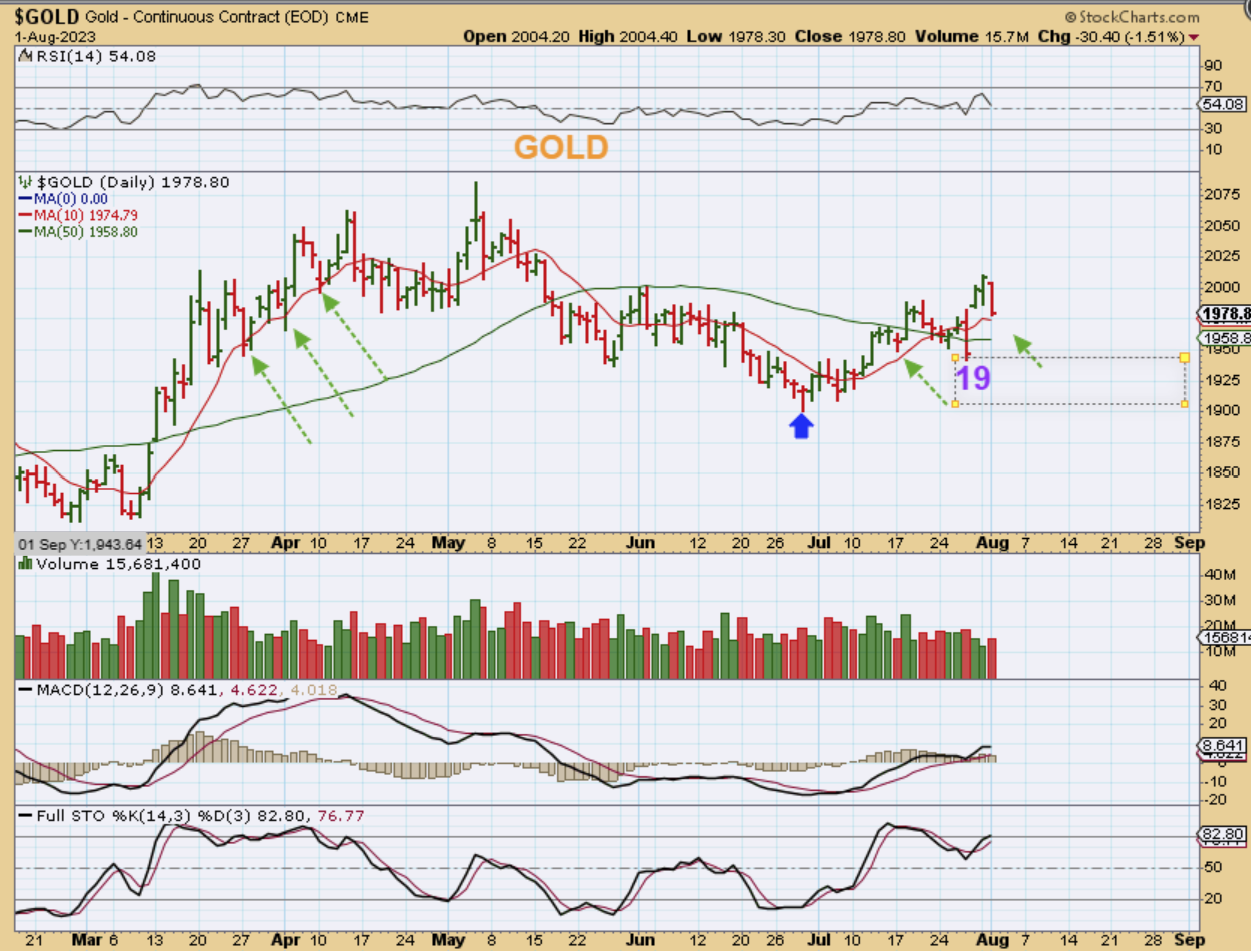
GOLD dropped almost as sharply on Tuesday as it did last Thursday. This chart is a bit deceiving, and I think that it is because of the contract change. Gold did not make a new daily cycle high on Monday, so let’s look at spot gold.
.
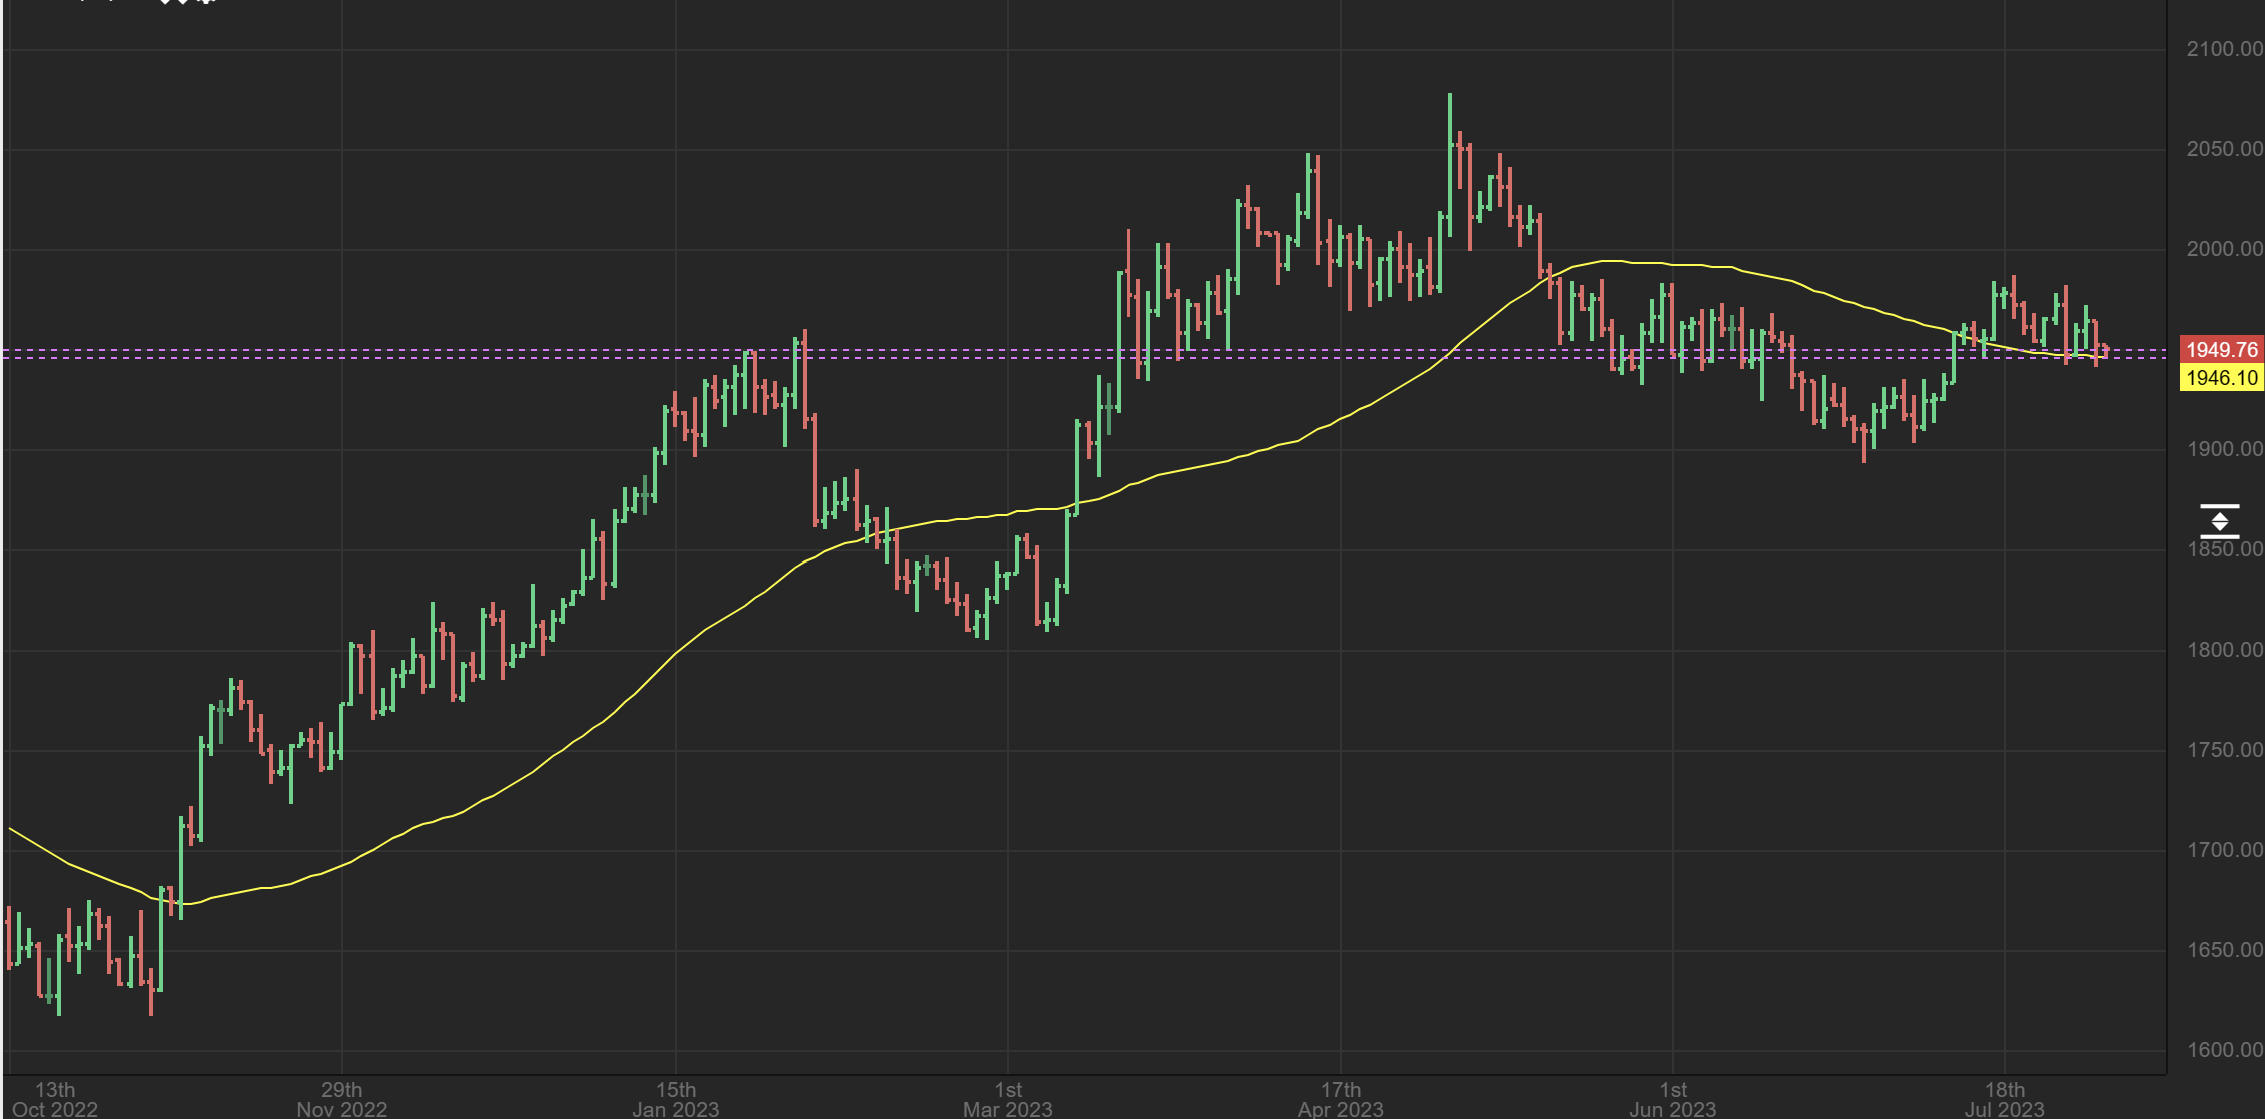
GOLD SPOT – So here you see that Gold didn’t make a new high on Monday, it has chopped along the 50sma.
.
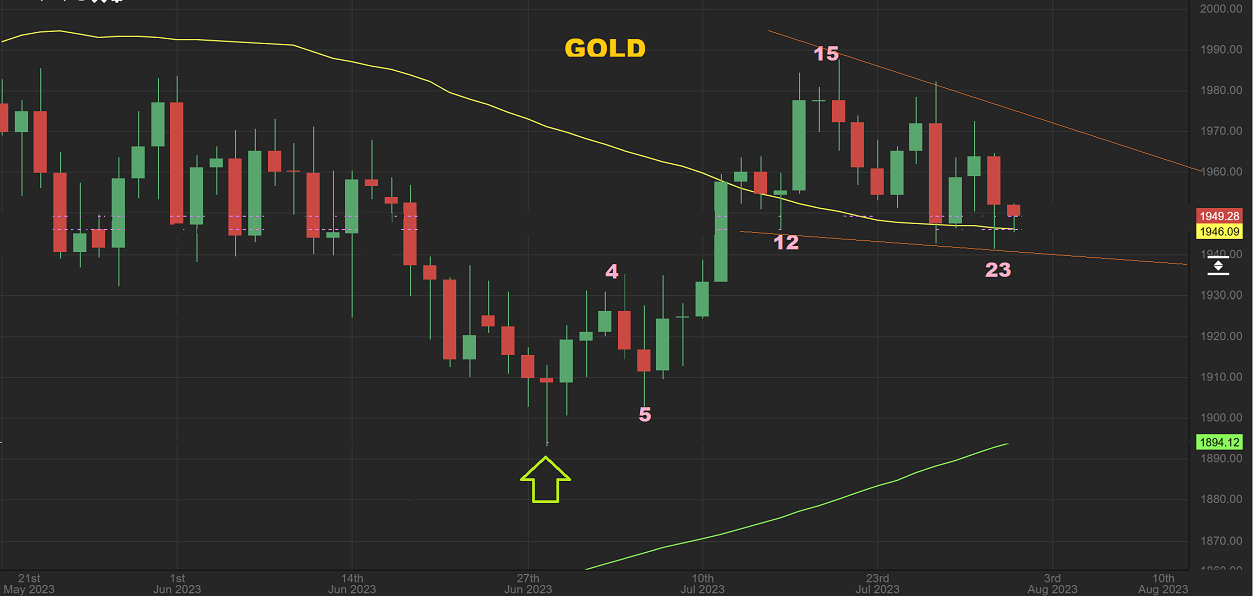
6 a.m. ET GOLD SPOT – So GOLD is on day 24 today and sits right at the 50sma. If this is seeking out a dcl, it could chop around for several more days.
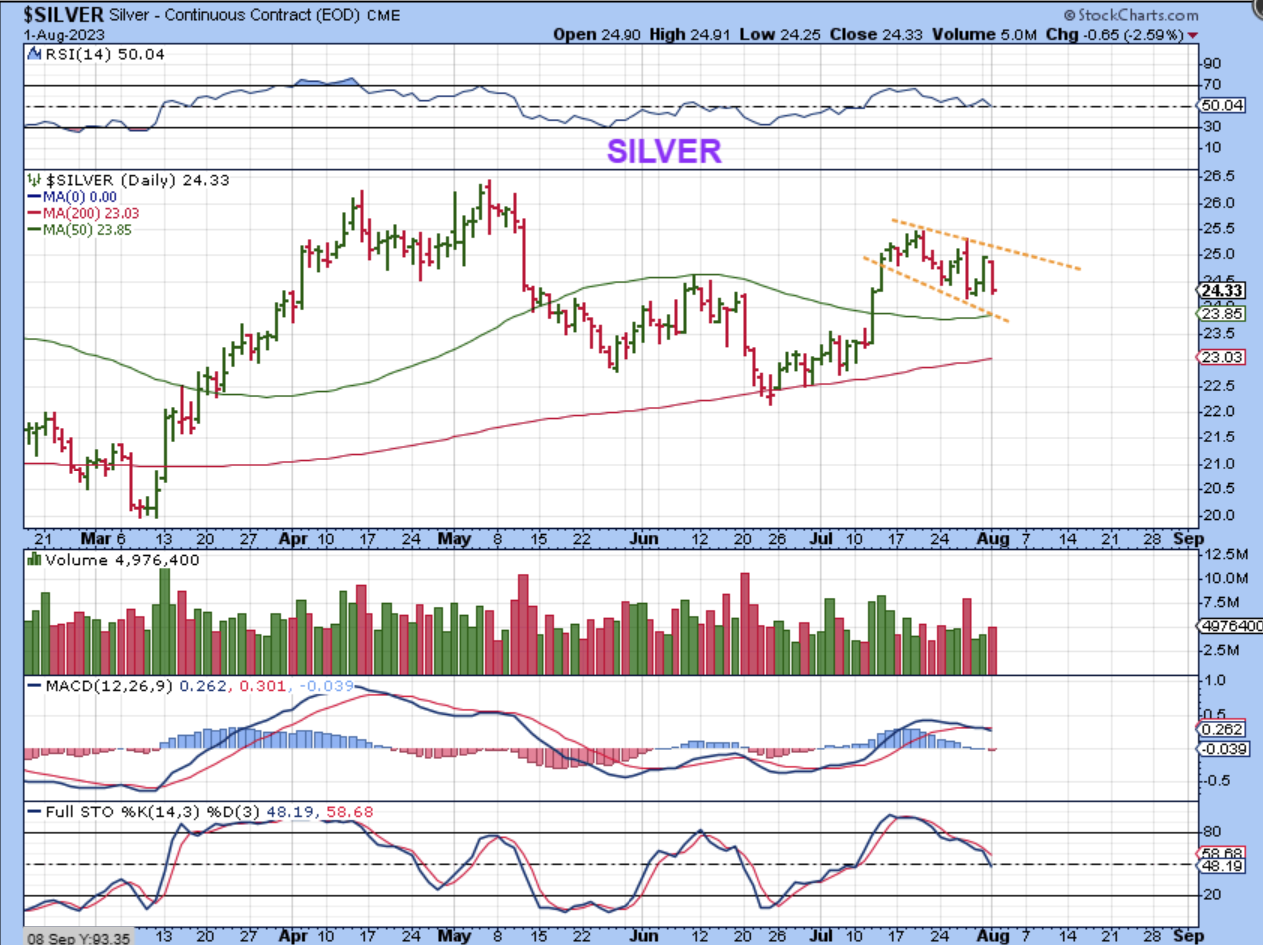
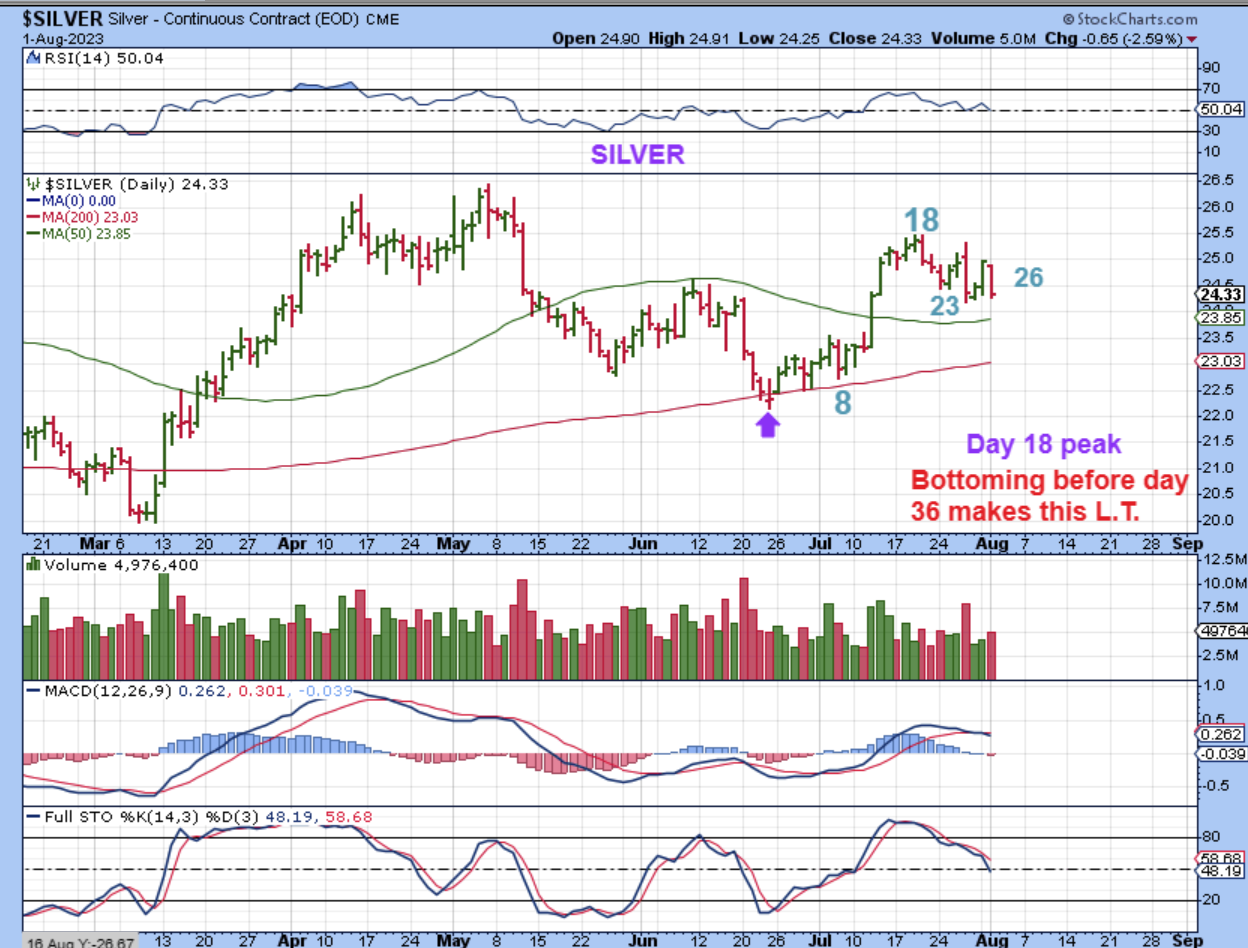
SILVER is still forming a wedge and is still above the 50sma too.
.
This is actually day 26 with a day 18 peak, so this can remain Right Translated into a day 36 low.
.
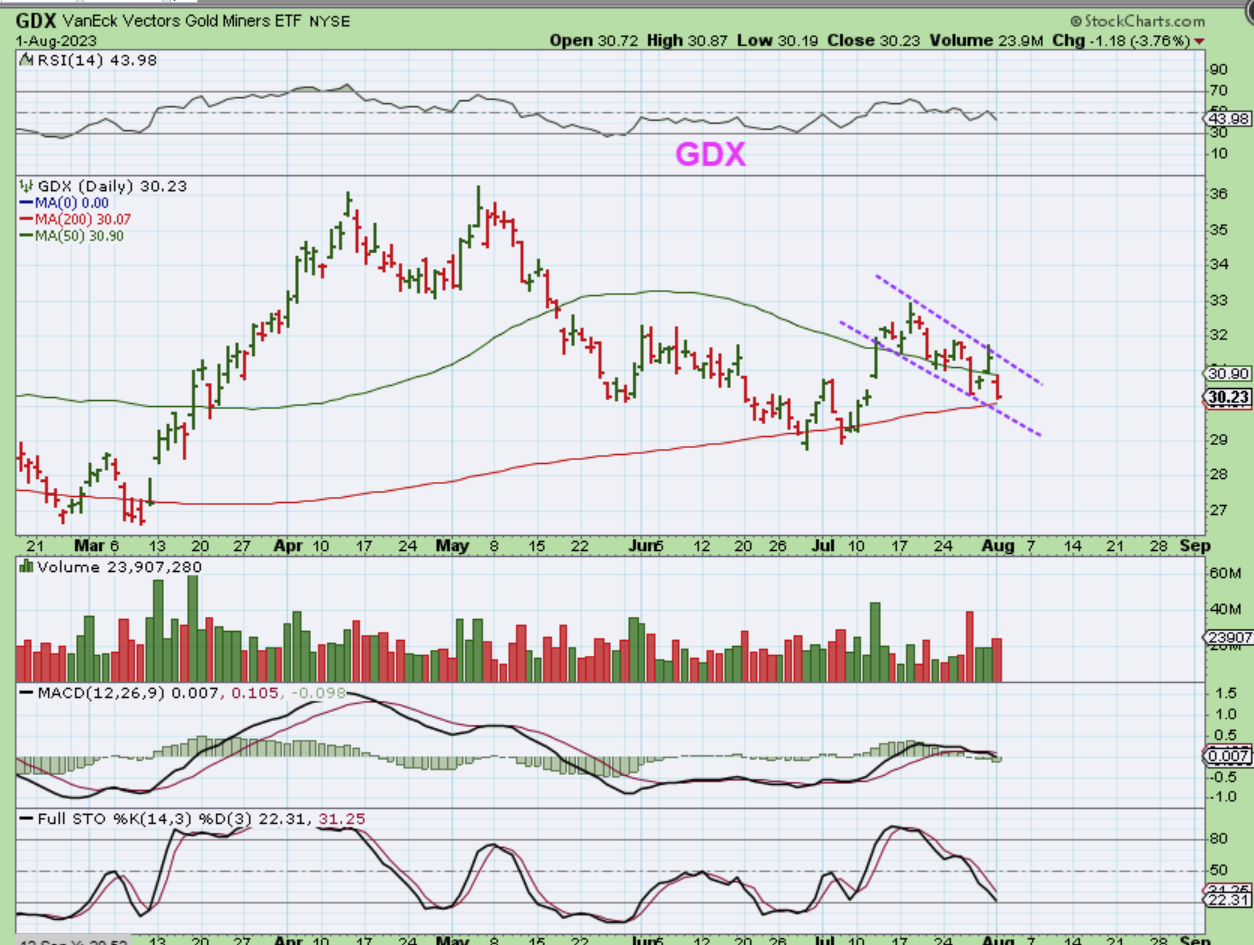
GDX has now filled that gap that was under the 50sma and price is right about at the 200sma. It is back at Thursdays lows.
.
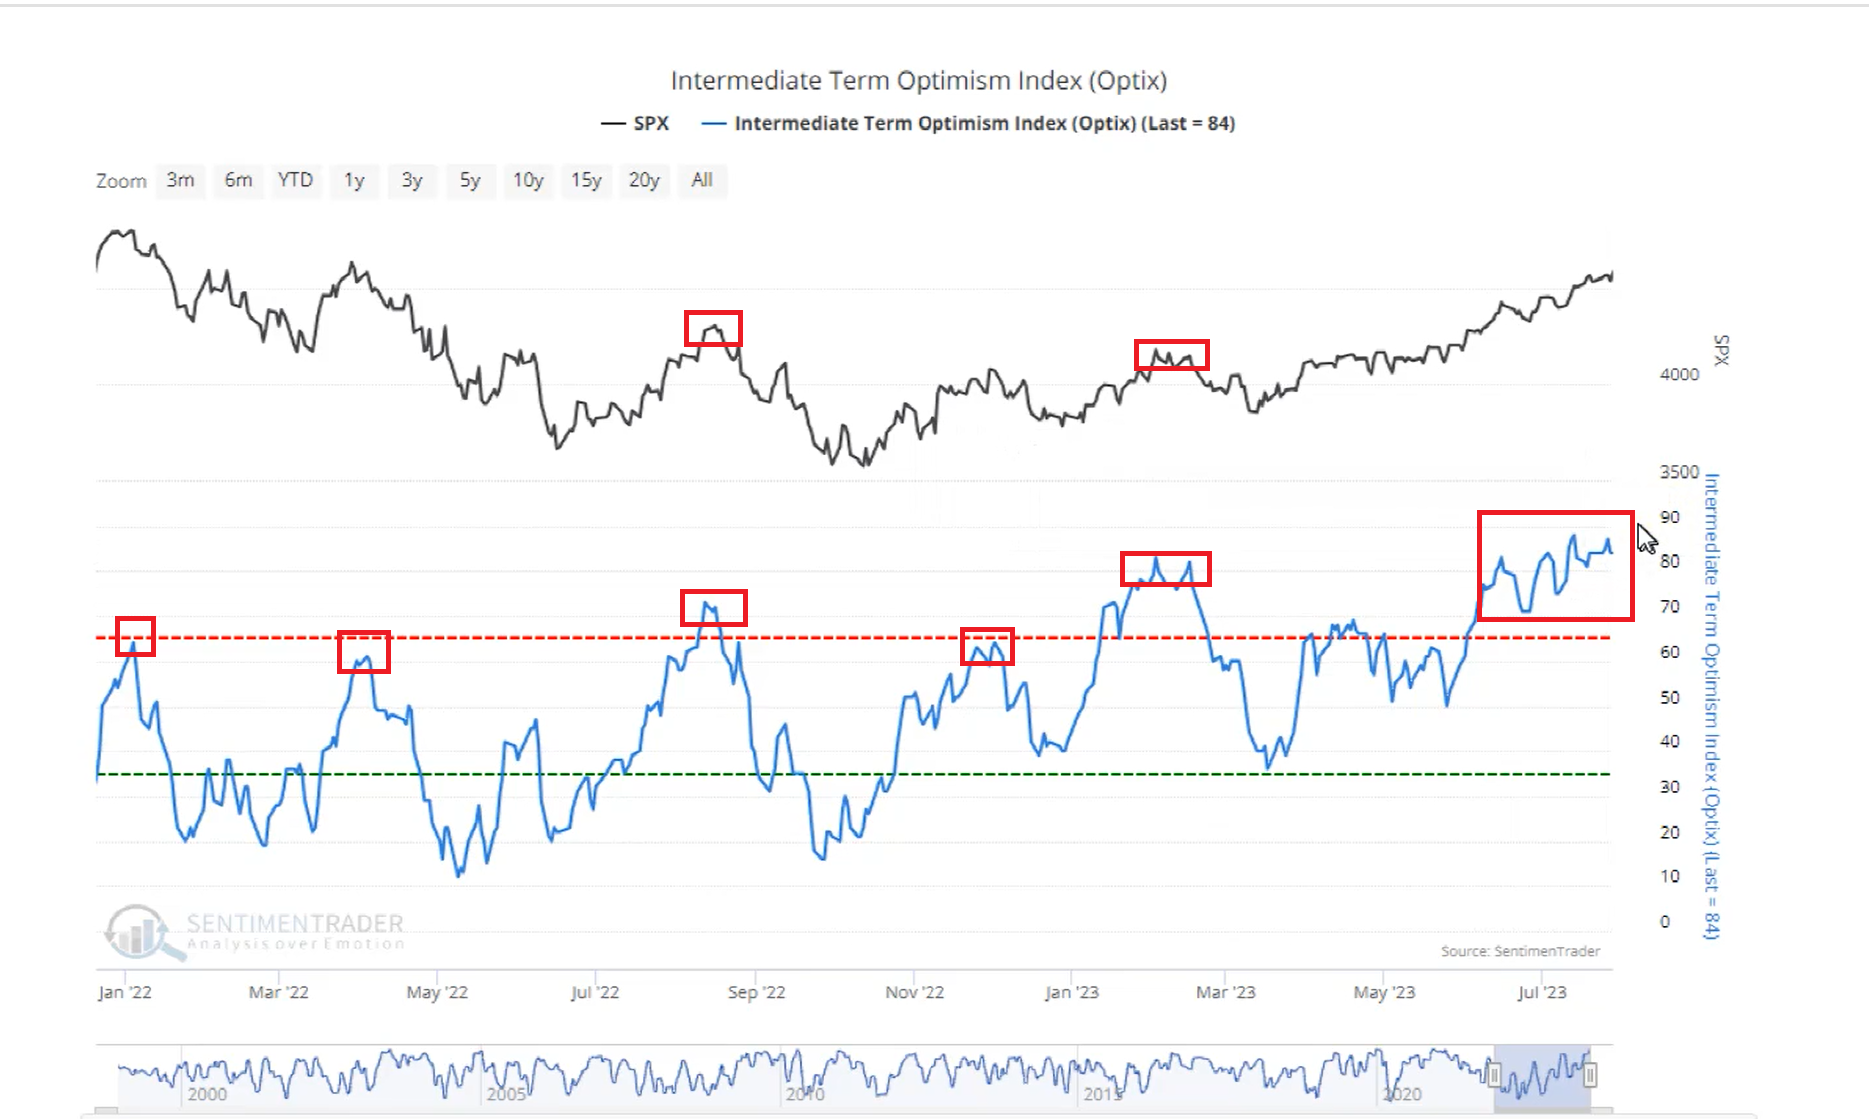
So we still have our bullish set ups in place, but you can always see a little choppiness with 1 or 2 day pull backs, and of course over time a deeper dip into a dcl comes due. The General Markets have been fighting the tendency to pull back, even though yesterday I showed that sentiment is higher than it has been in all of 2022 & 2023. That is usually when Tops form. The Put / Call ratio is calling for a pull back too, but Bull markets can become frothy as buyers continue to step in. Oil is continuing higher too, but unfortunately the Precious Metals are being pushed lower by the USD bounce.
We have seen some nice set ups in the EV and Clean Energy sector, with major moves by JOBY, NKLA, XPEV, and more. I’m wondering if we will get sector rotation, with money flowing into this sector when the Tech Sector finally dips lower? Or will everything dip lower and offer buying opportunities as it does? That remains to be seen, but I put quite a few interesting chart set ups in yesterdays report. You may want to review those Bullish charts if the markets continue to dip. For now, Let’s see what Wednesday gives us in these areas.
.
~ALEX
.
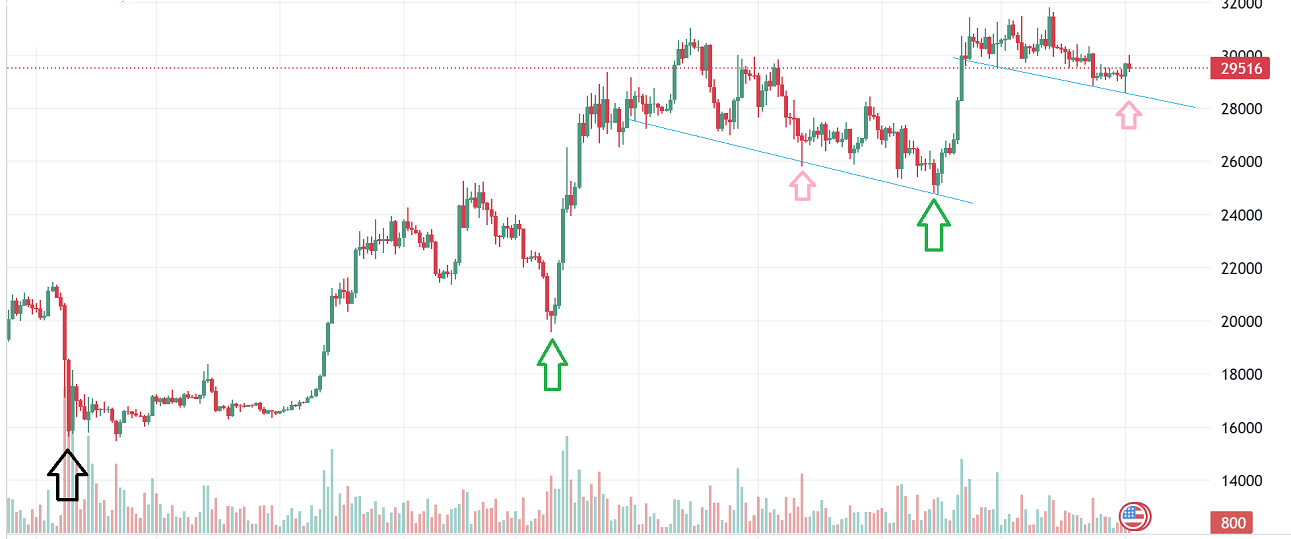
I have stated that I feel that BITCOIN may have entered a period of sideways consolidation that will lead into a dcl eventually, and then a rally higher.
This is day 47 and dcls often come around day 60, so this may be too early for a dcl. Last night I saw a Bitcoin drop & reversal, but I’ve seen this before ( see the other pink arrow) and as mentioned, it does seem about 2 weeks early for a dcl, but you never know when buyers might step in and push this higher. Crypto stocks could bounce for few days too, but I tend not to think that this will lead to a late daily cycle rally. That said, anyone can buy a reversal with a stop and try a trade. The last pink arrow simply chopped sideways.
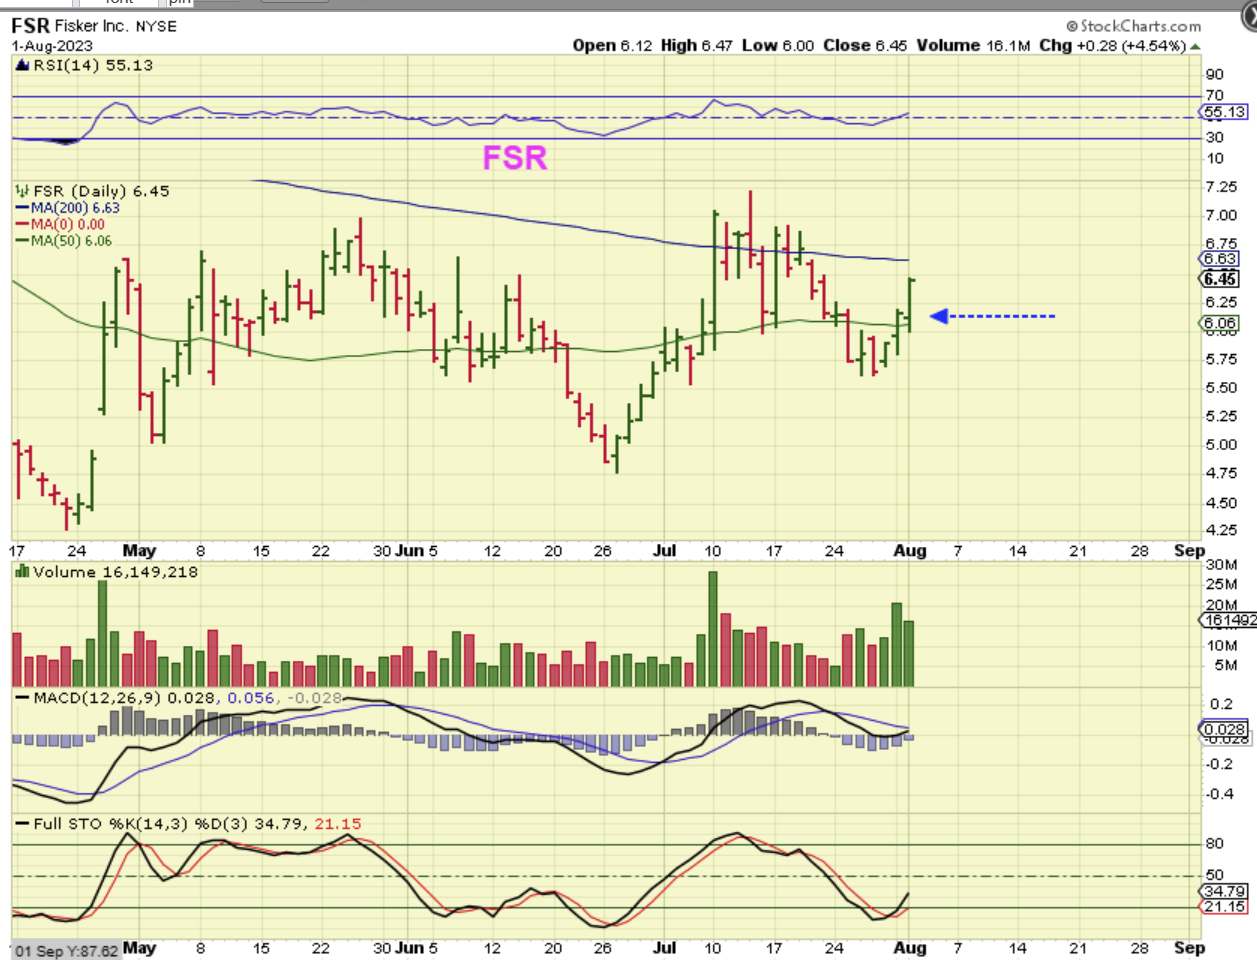
FSR dropped in the morning, but by the end of the day it was up almost 5%. This is an example of buyers stepping in despite the overall selling. So…
.
They certainly didn’t all bounce back in the EV Sector, but several did. I posted this in the comments yesterday in the final hour of trading.

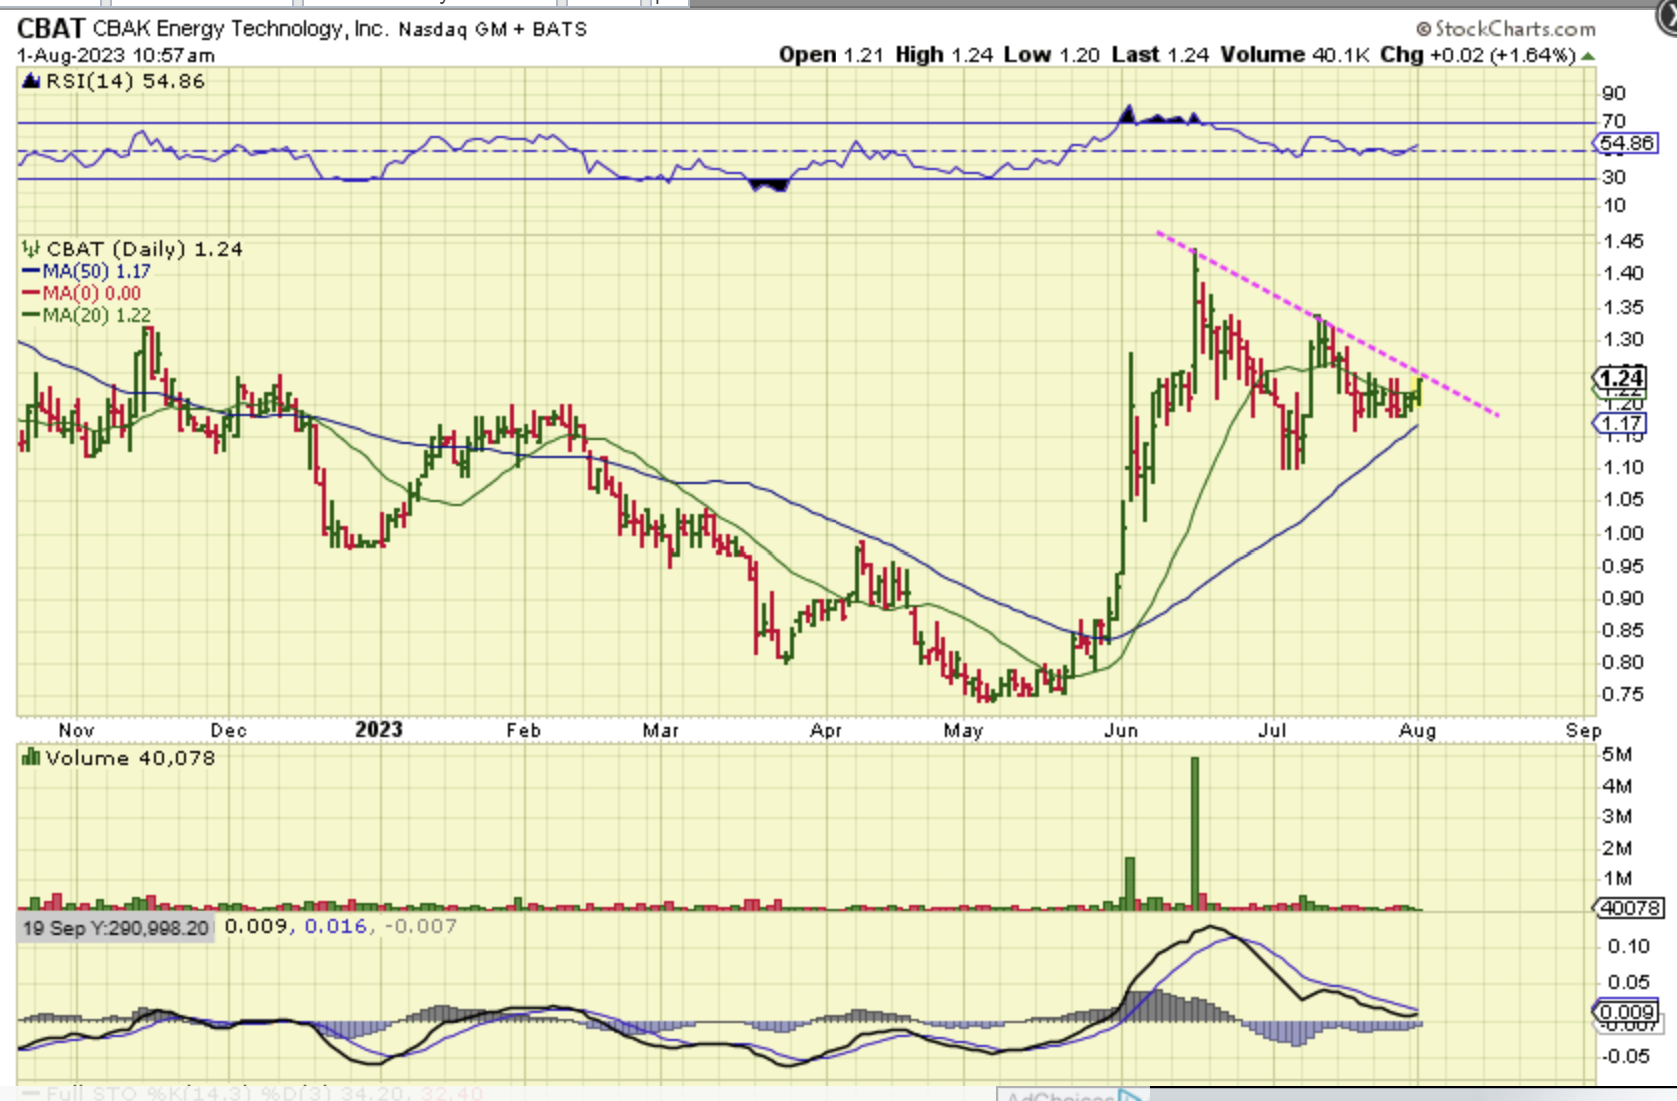
In the morning I noticed that CBAT went from Red to Green and as pushing on a downtrend line, so I posted this chart as it seems to be reversing above the 50sma. By the end of the day …
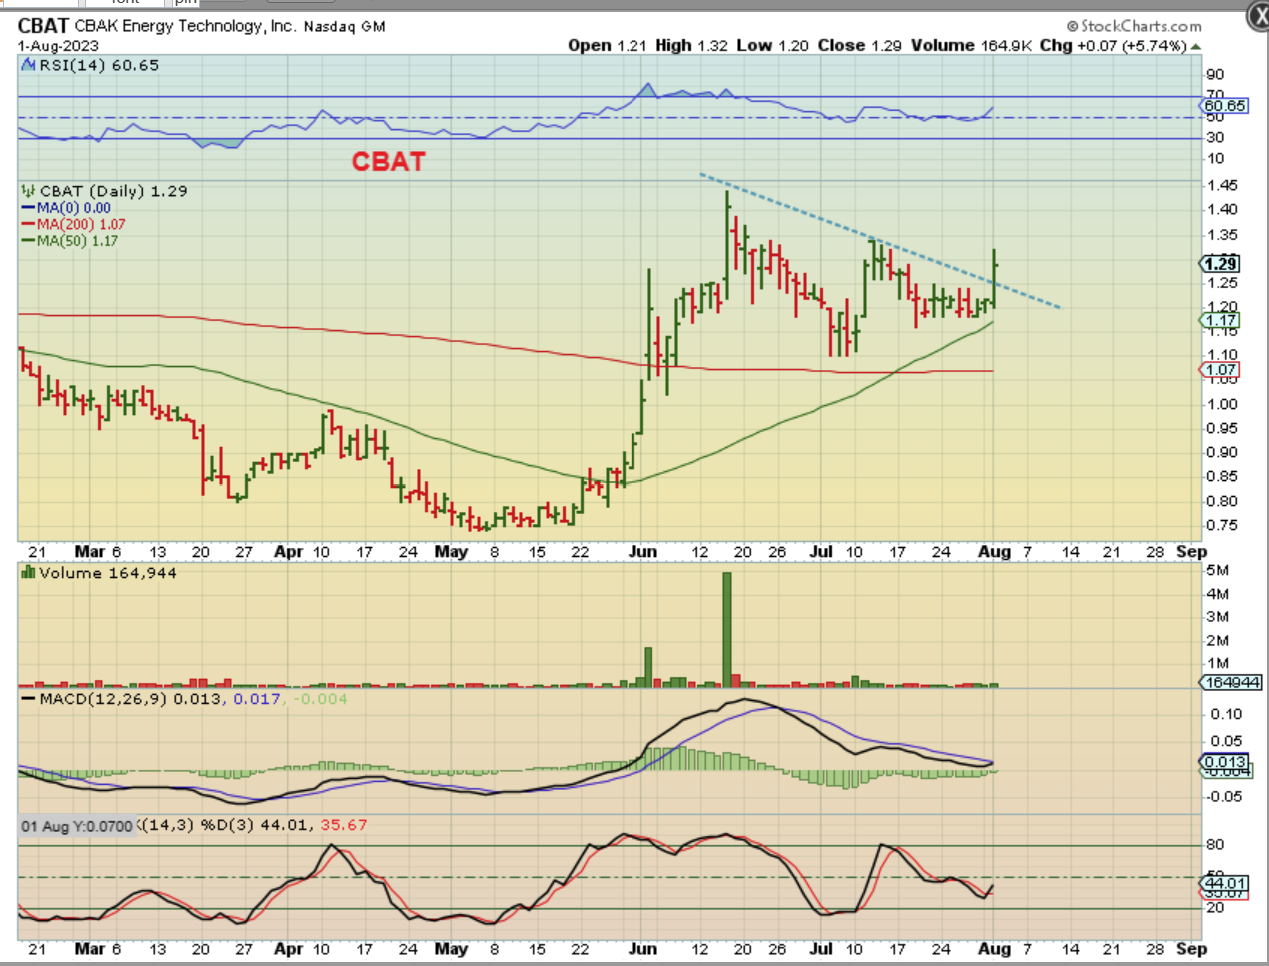
By the end of the day CBAT was up almost 6% and it did break that downtrend, so despite the overall market selling, this area does seem to still show that buyers are interested. It is worth keeping an eye on.
.
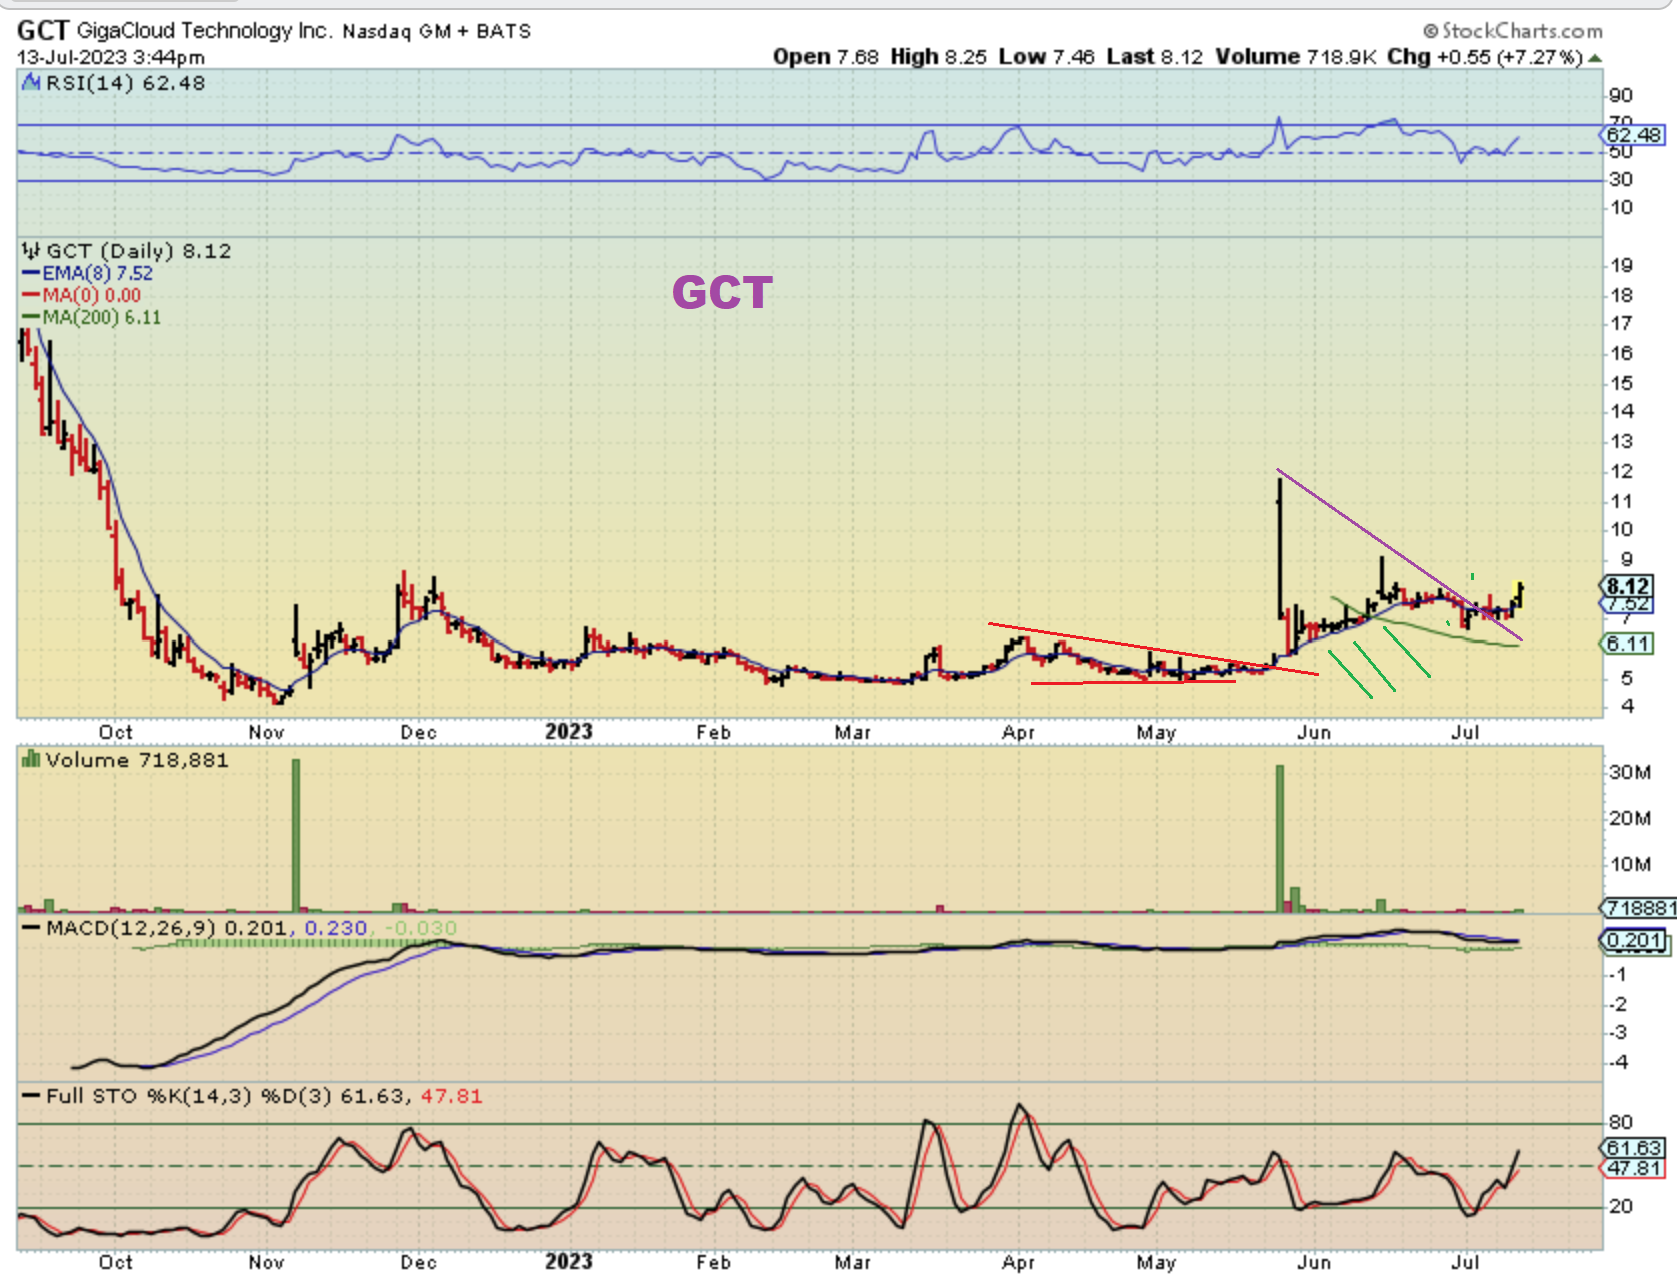
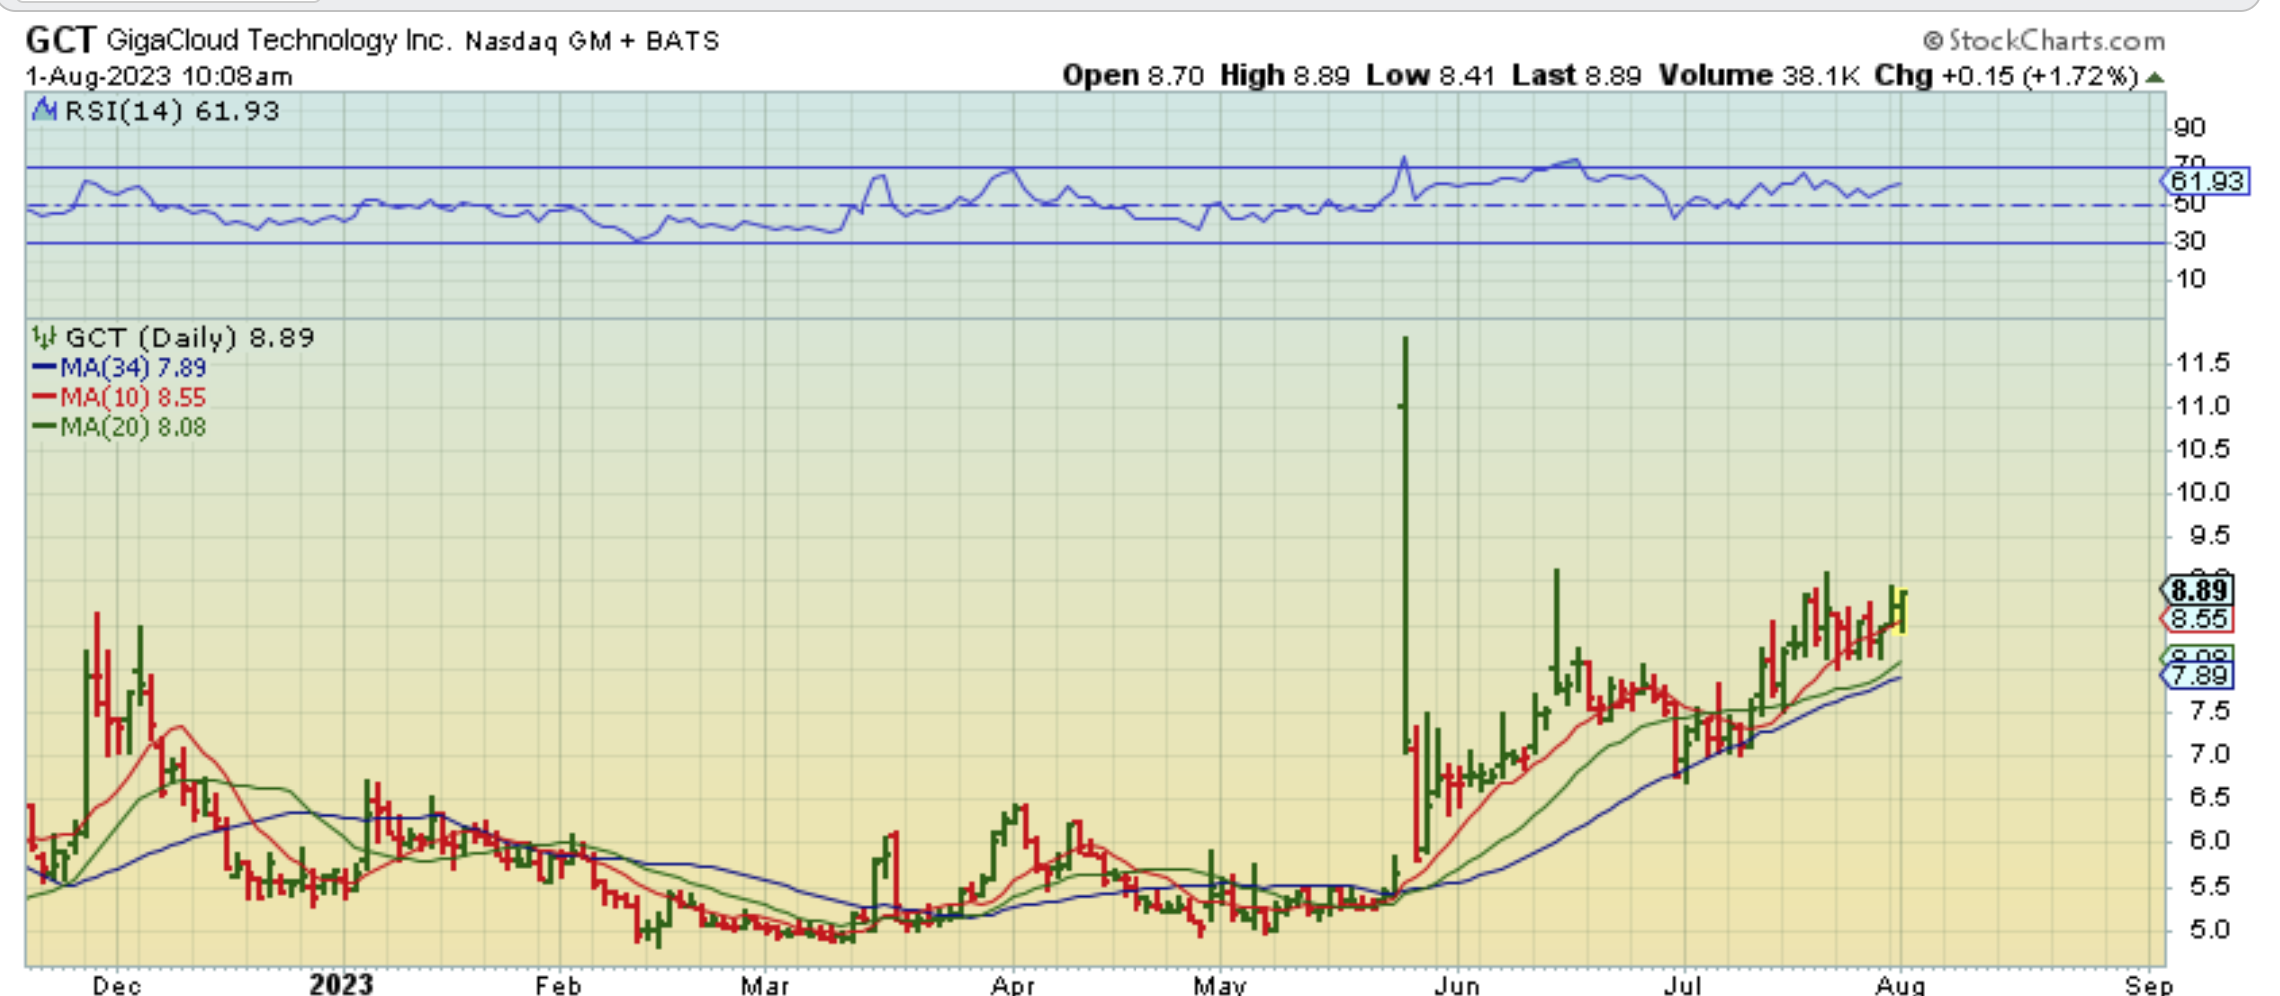
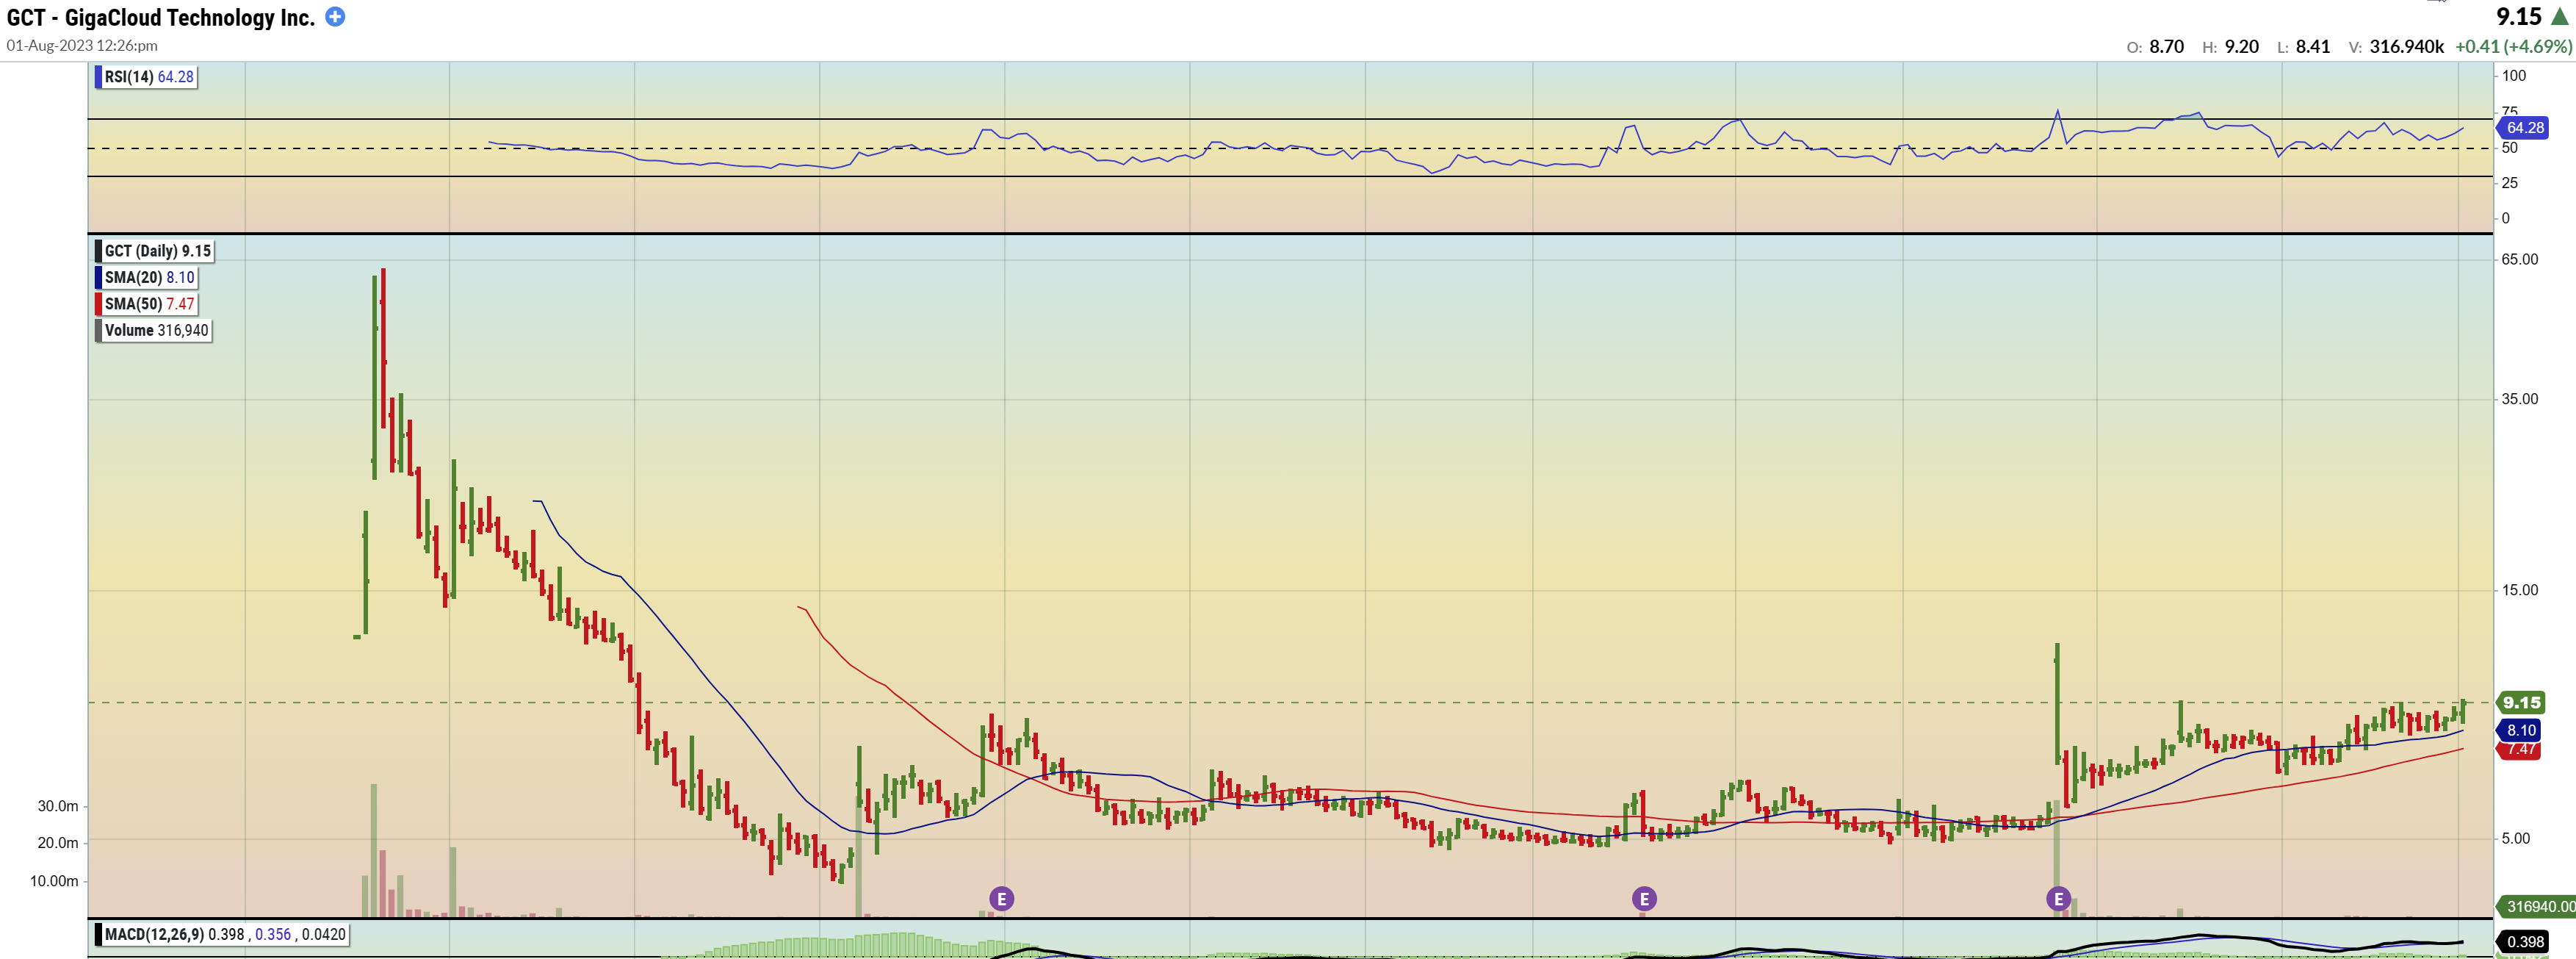
GCT: On July 13 I posted one of these long bases that I said I like over time. It has a lot of upside potential, so I wanted to keep an eye on it as it pushed higher.
.
GCT is almost $9 now, and I grabbed this chart in the first hr of trading, because the general markets were dipping lower but GCT went from Red to Green.
..
GCT reached $9.20 as the day went on and then dipped back down to $9, so…
.
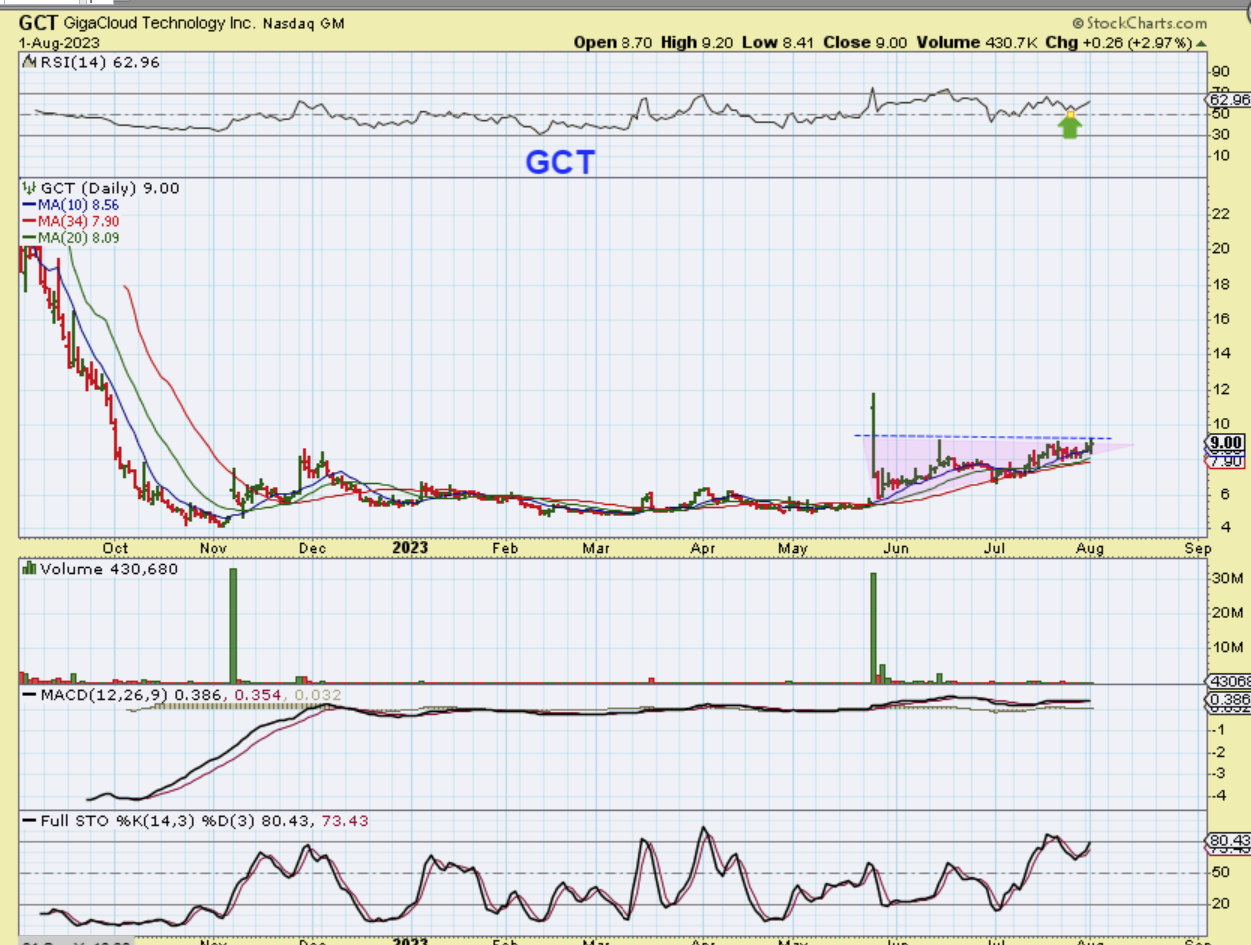
GCT seems to be forming a bullish flat wedge in that base that has now climbed the 34 sma from $6 to $9. That large 95% POP to $12 in May was actually a rection to earnings, so I still like this chart set up and over time it could do well. Buy a break out? Start a small position now and add if it dips during a dcl sell down? Put it on the watch list and buy when you think it is ready? Its up to you. GCT is down 25 cents to $8.75 in Premarket at 6 a.m.
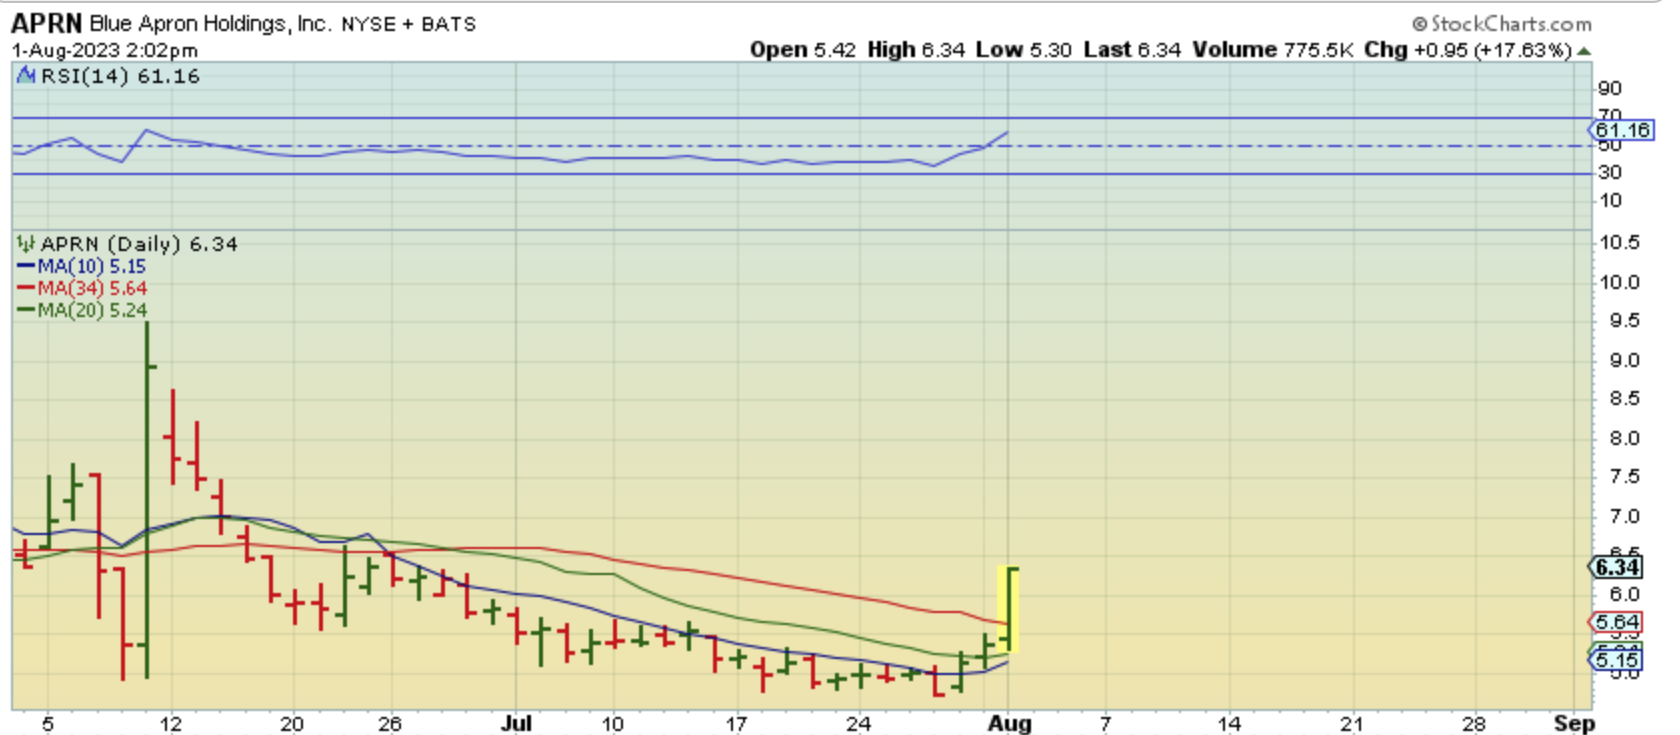
APRN used to be a ‘Runner’ with strong short covering as it popped, so in the first hr of trading I pointed out that APRN was pushing higher during yesterdays selling. It was pushing against the 34 & 50sma. APRN is in my watchlists…
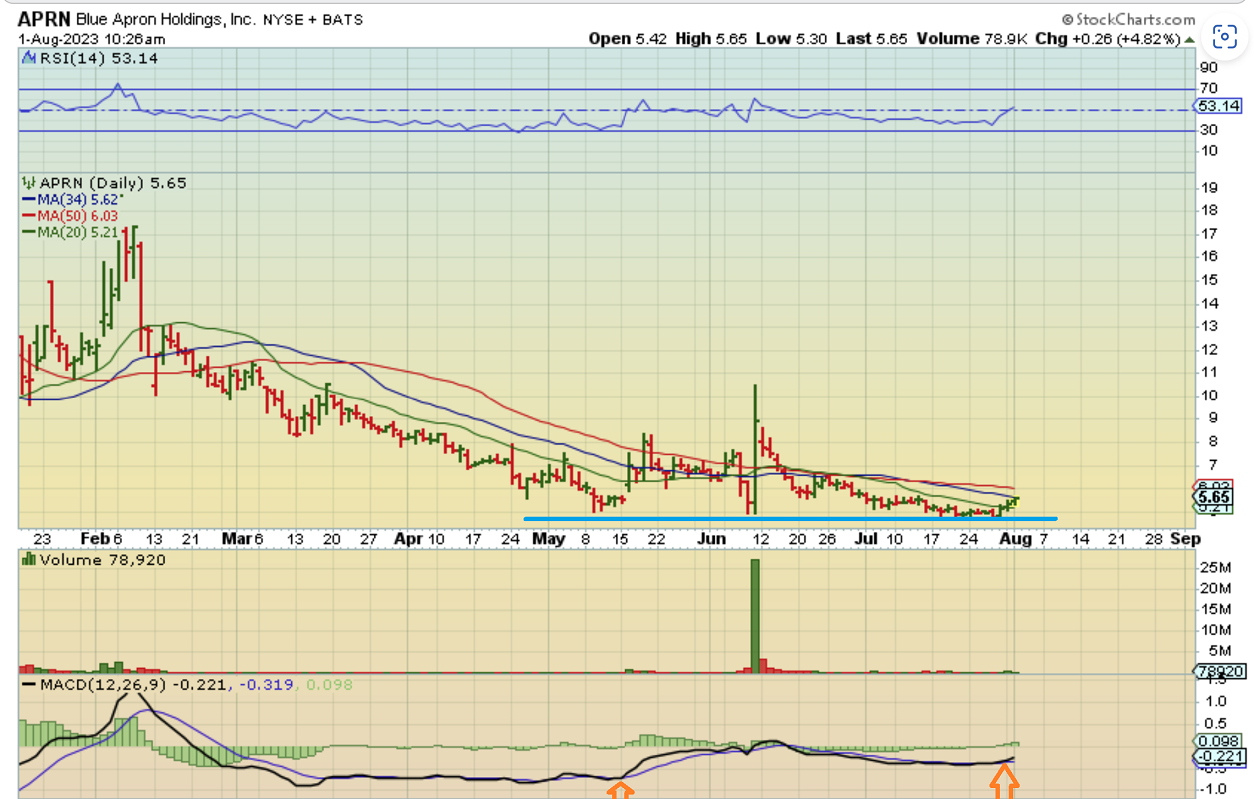
By midday APRN was up 13%

And then it actually ran up 20%, so I sold mine and will watch it, ARQQ, QBTS, and a few other runners from yesterday to see if they pull back or continue higher.