July 23 Weekend Review
I am leaving for the day soon. I really wanted to get this report out by Sunday morning and not Sunday evening, so I have written it, but will not have time to proofread it. Please excuse any typos and if you have any questions you can put them in the comments below. I will be home later to answer them 🙂 Thanks!
.
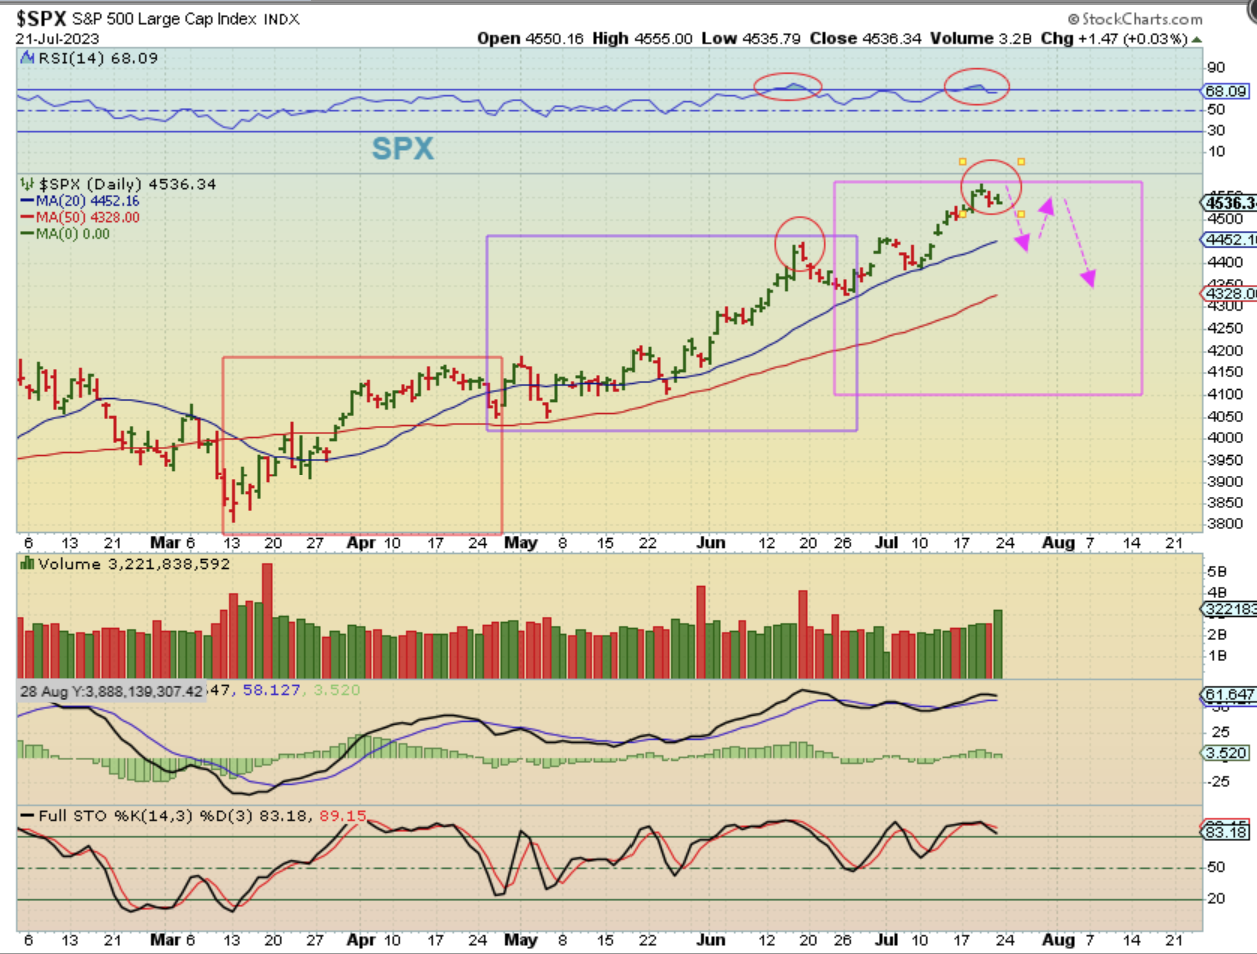
SPX DAILY – The SPX looked a bit toppy and has started to pullback. The 20 sma seems like a good first target where we may see a reversal. What we can’t quite know yet is will this drop and bounce and drop as drawn here (a-b-c drop), to a deeper dcl? Or…
.
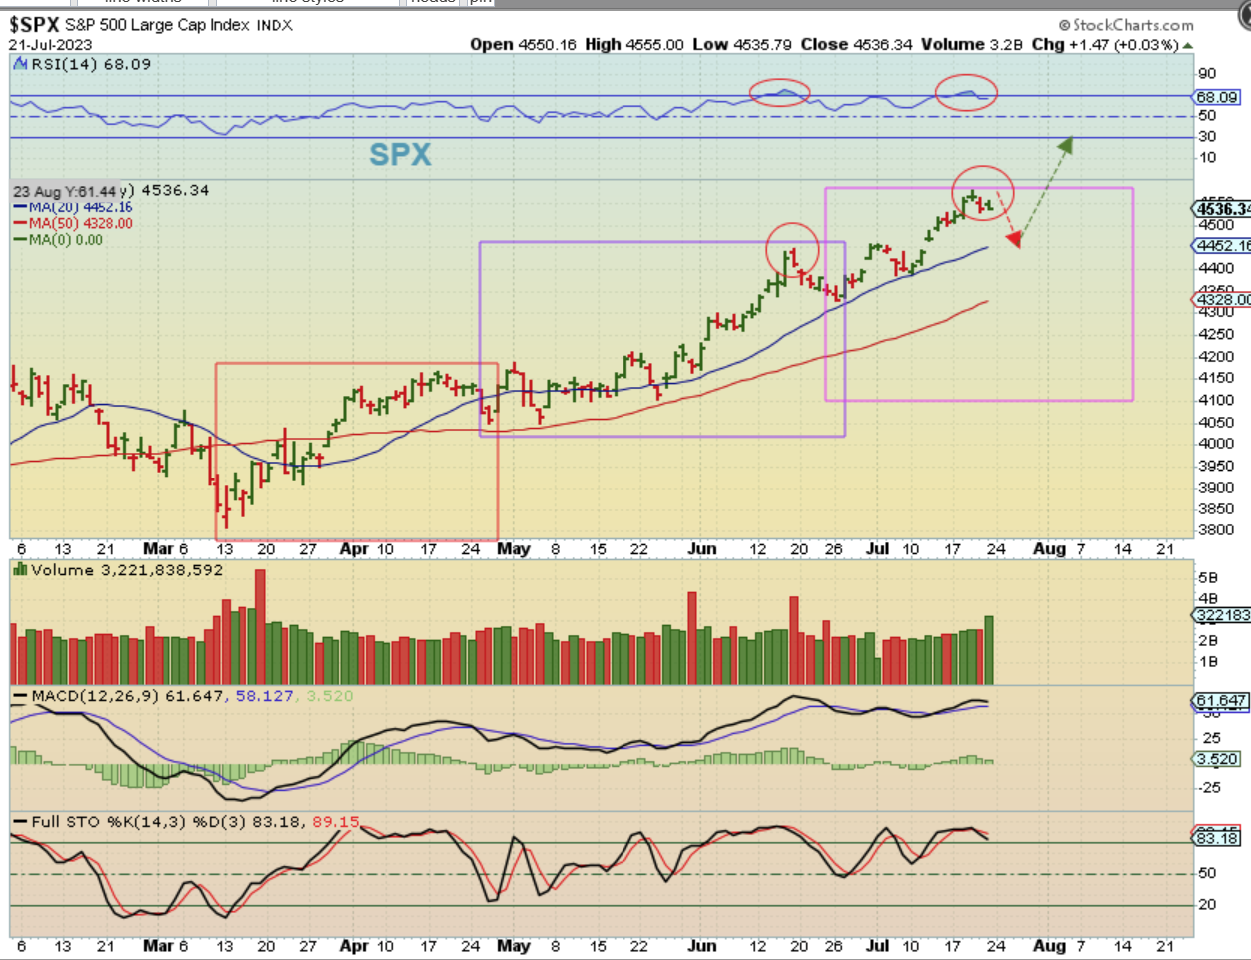
Will the bullish ‘buy the dip’ prevail and just give us a reversal to new highs? A reversal ta the 20sma could be bought with a tight stop if the selling is light. The weekly charts look toppy too though…
.
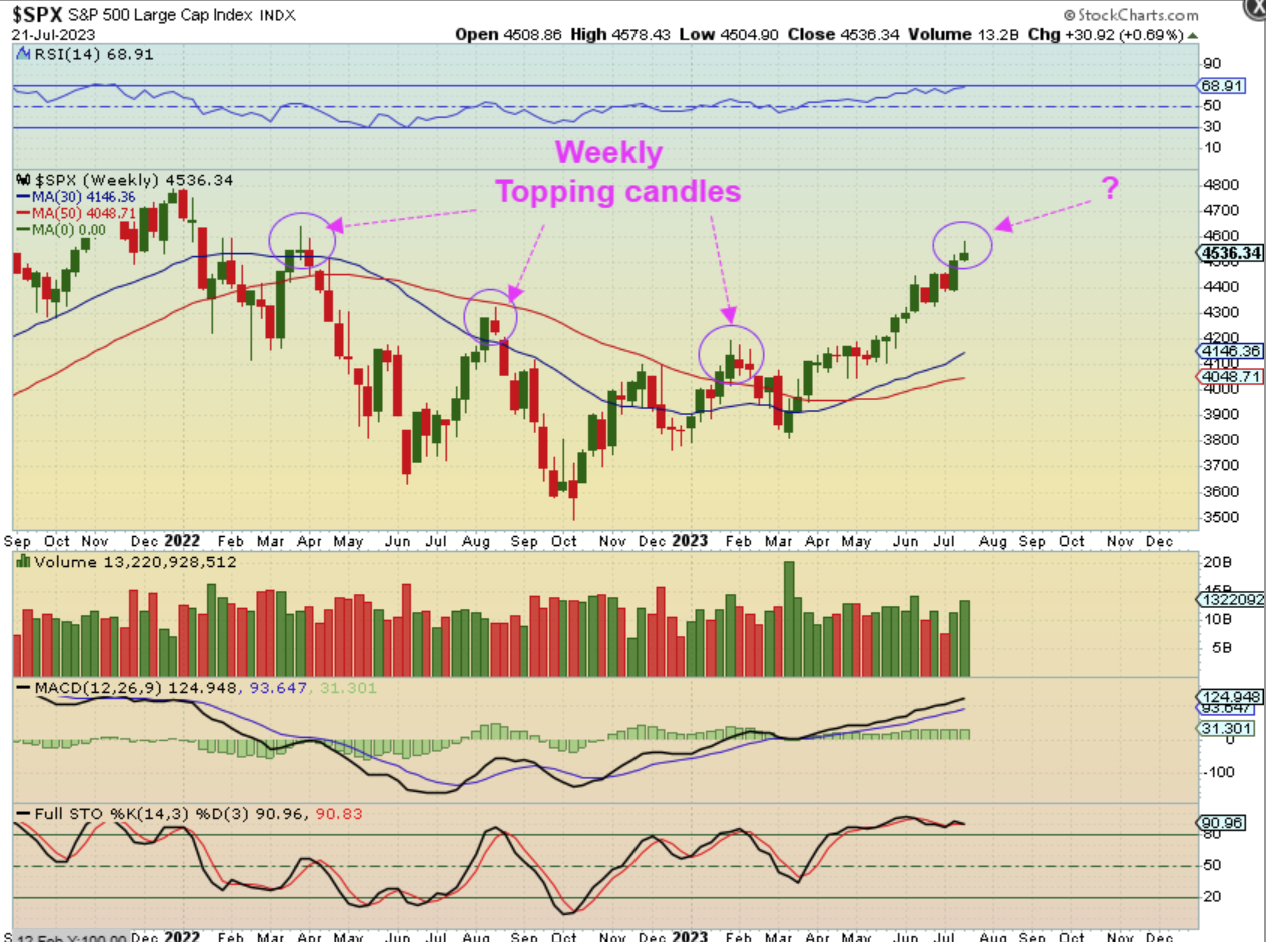
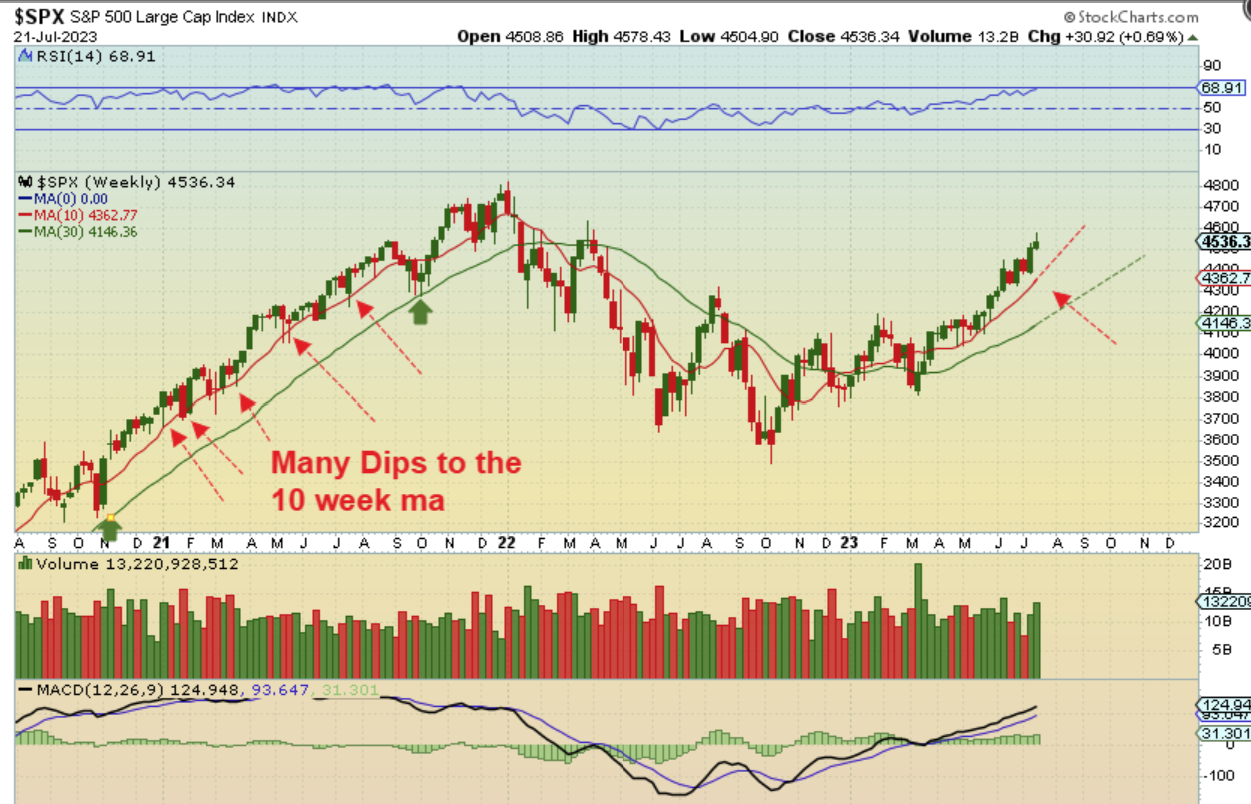
I wanted to zoom in a bit on the SPX Weekly Chart to show that it has formed a topping candle too…
.
SPX WEEKLY – In Bull markets we focus mainly on the 10 week ma for milder pullbacks and the 30 week ma for deeper pullbacks, and they can overshoot that 10 week ma with a ‘tail’ or ‘wick’ too.
.
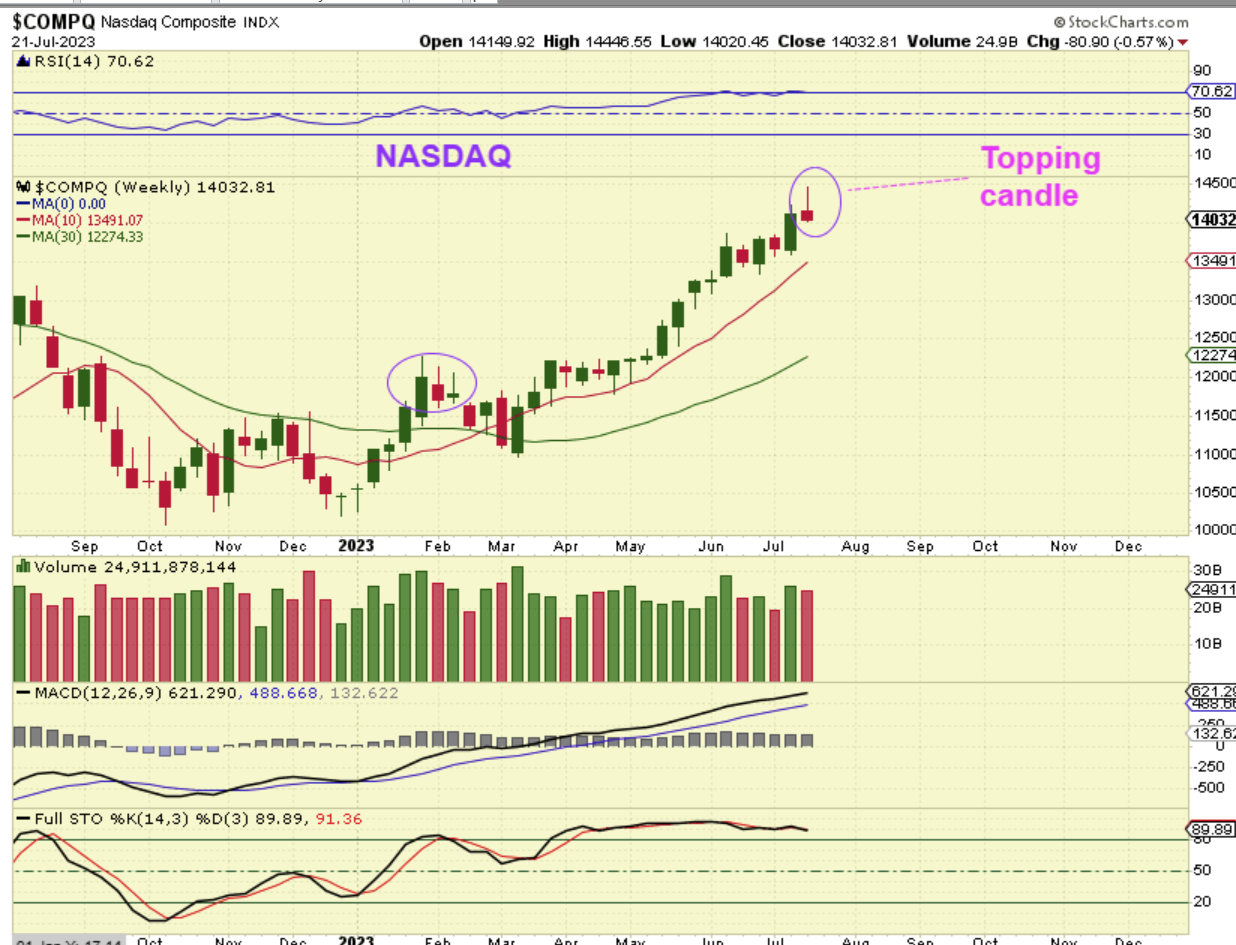
THE NASDAQ WEEKLY is also showing a reversal candle at this point, after a solid run higher out of the base.
And even The IWM WEEKLY, which I was hoping would breakout and run sooner than later, appears ready to dip lower first. I have to expect a pullback next week, and it may be a choppy one with a day or two lower, a bounce, then a drop, etc.
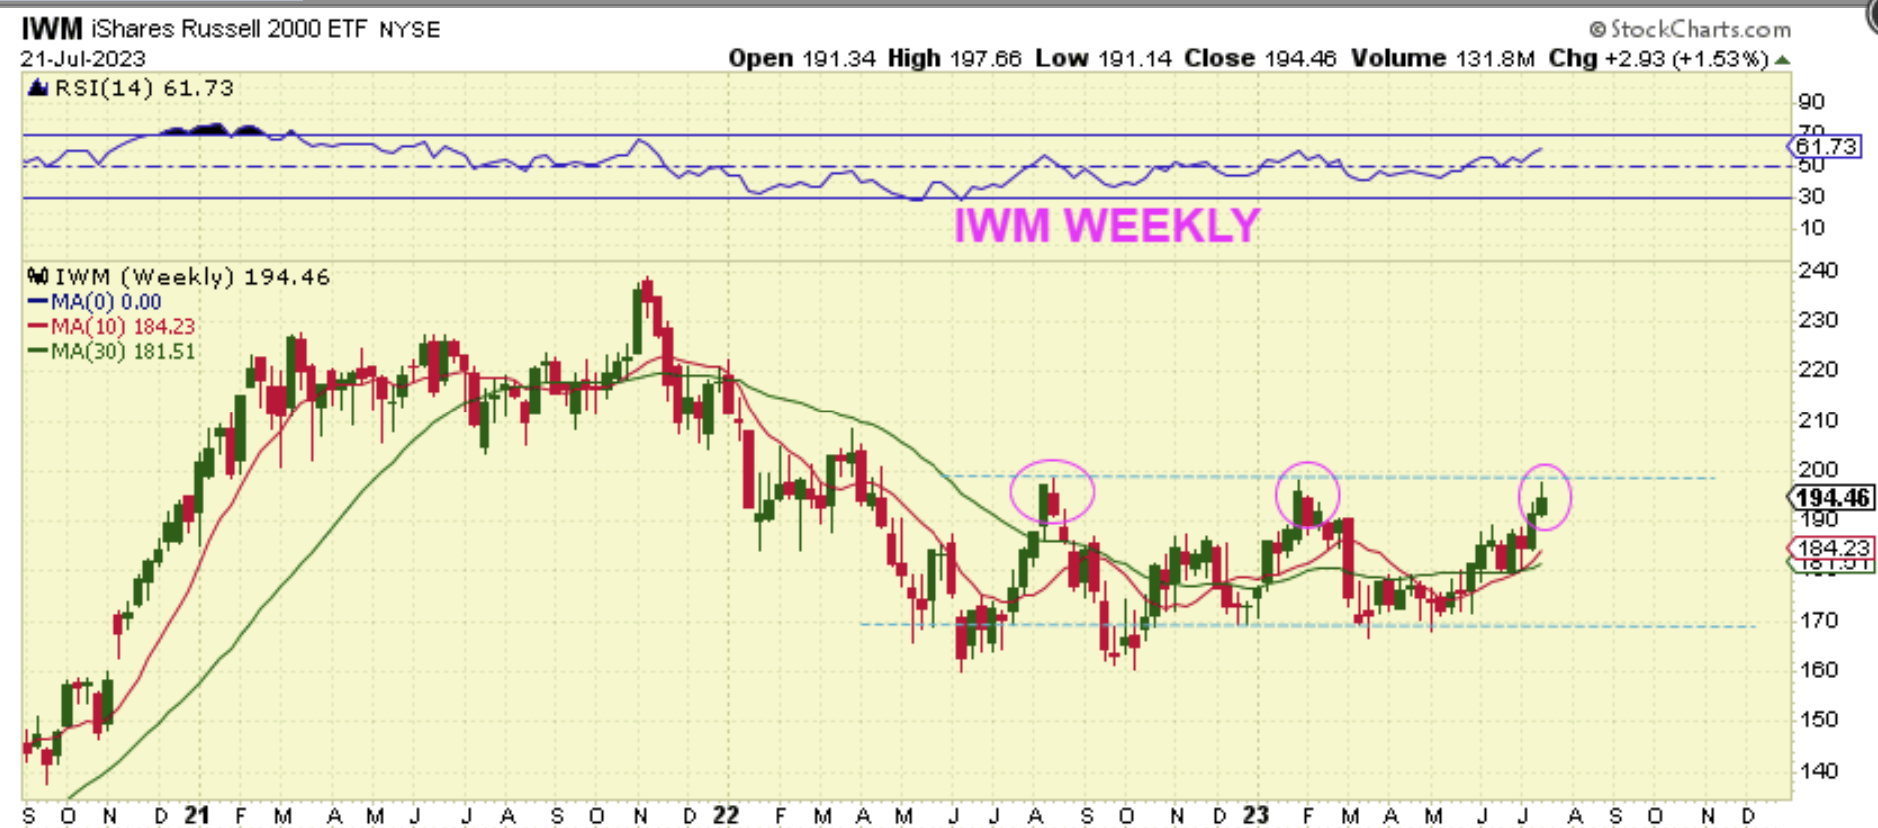
So I am expecting a pullback in the General Markets. It may not be straight down, there may be bounces along the way and it may seem choppy, but we’ll look for reversals at support over time and see how deep it goes.
.
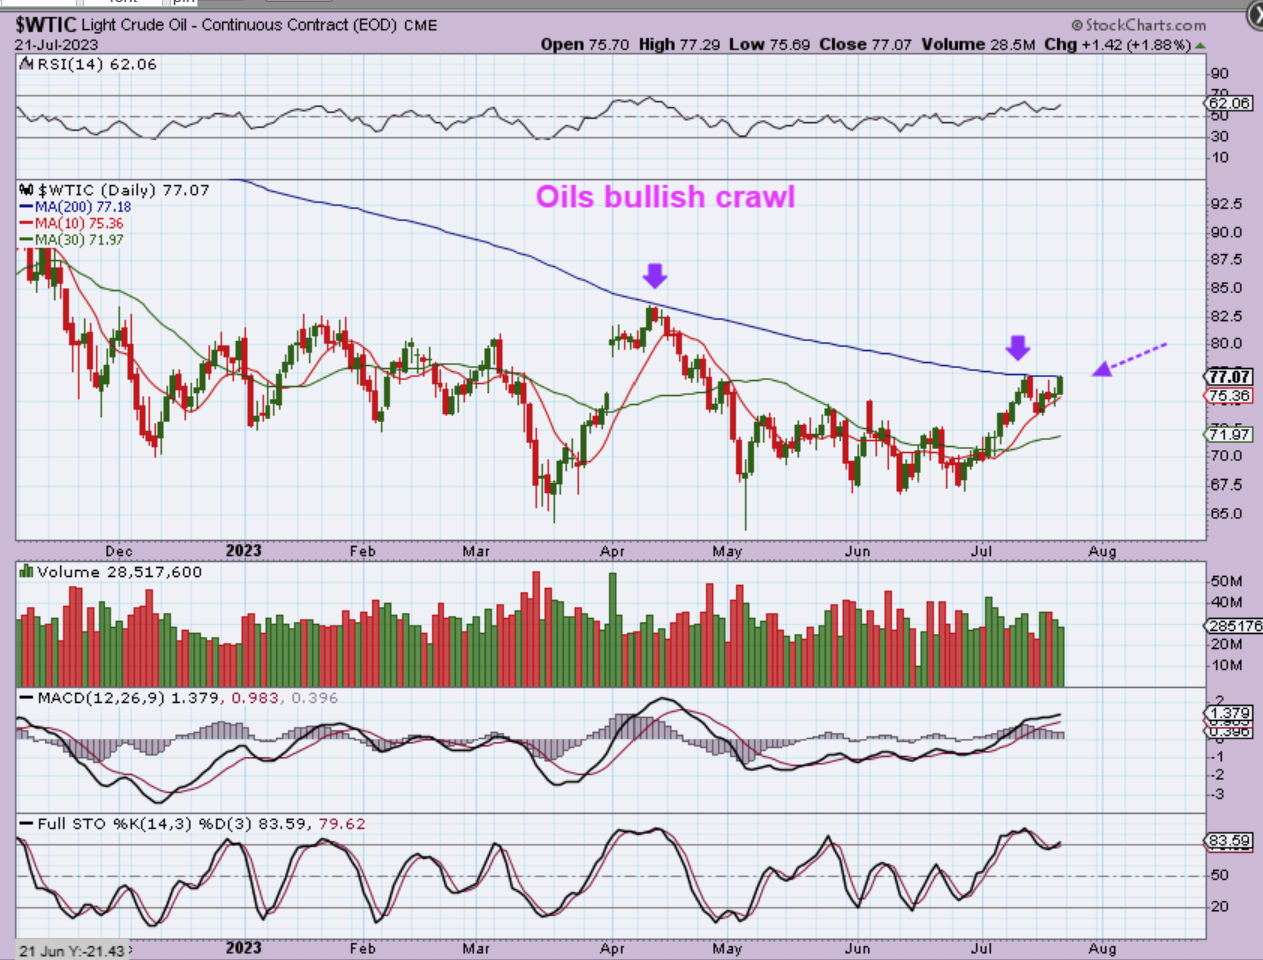
WTIC DAILY – Oil actually pushed higher on Friday and we have been watching a bullish crawl along the underside of the 200sma and the 10sma has also been holding as support last week. I expected a drop to the 50sma or 34 sma as a quick dcl, but this may break out next week. Oil can be bought in this area and Oil stocks have been choppy yet they’re acting bullishly too.
.
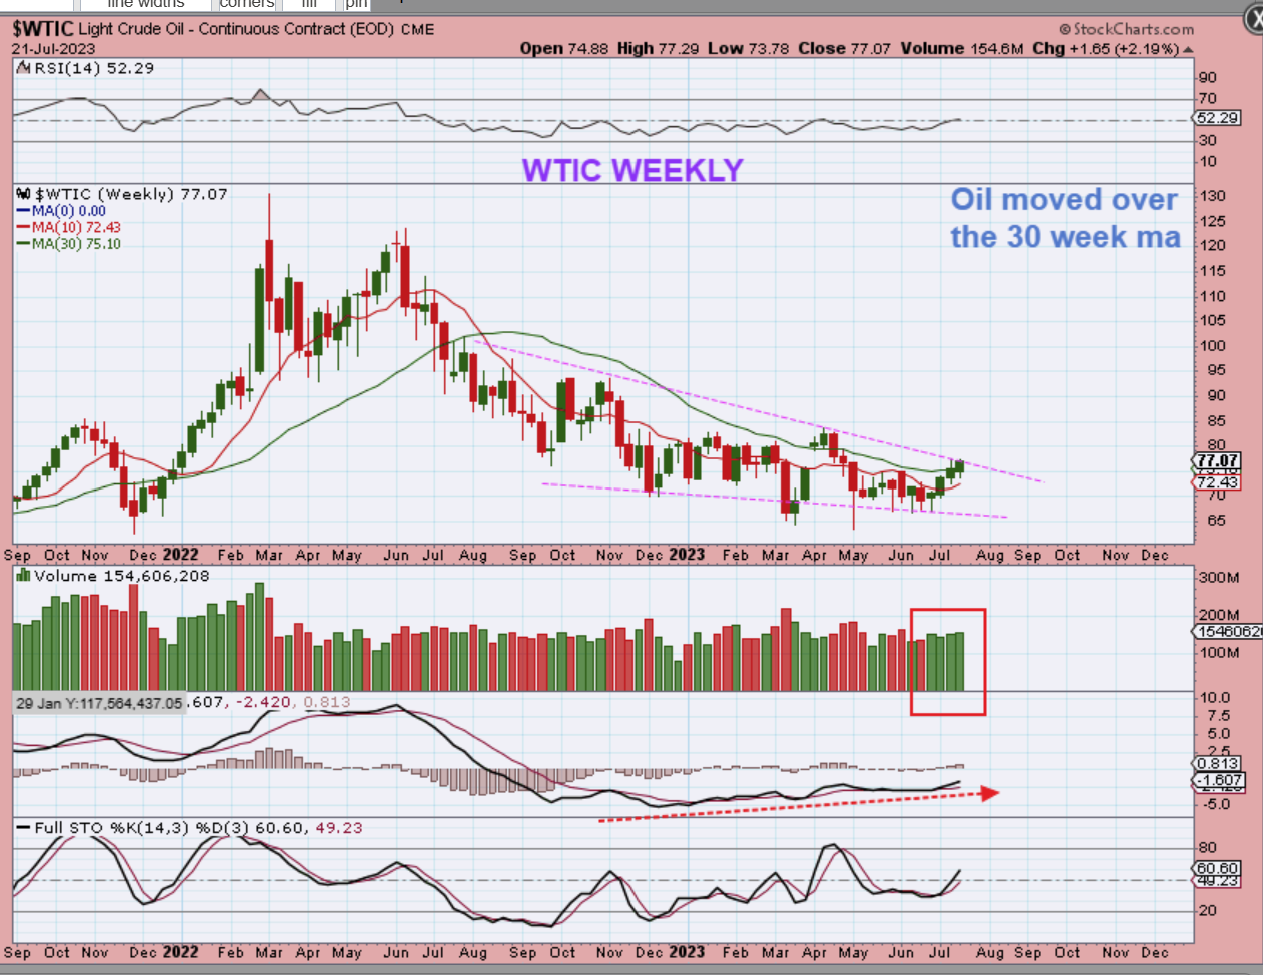
WTIC WEEKLY – The weekly looks ready to break from a bull wedge too.
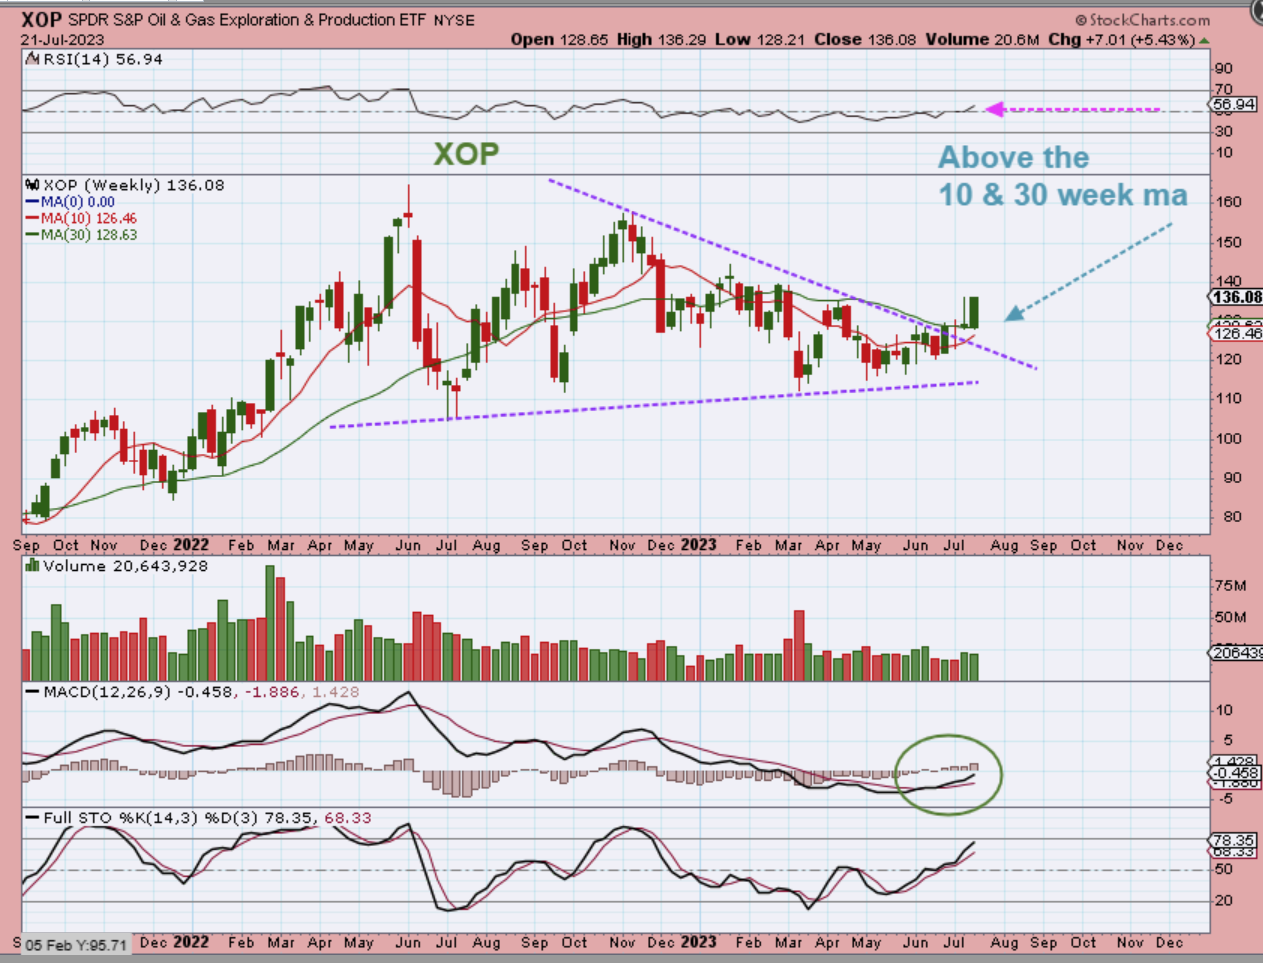
XOP WEEKLY – Oil stocks have been leading Oil and the XOP had a nice 5% gainer this week. The week before that was a ‘pop & drop’, but this push higher closed at the highs, above both the 10 & 30 week ma. Oil stocks have been a ‘Buy’ over the past couple of weeks too. I’ve mentioned APA, VET, VLO, MRO, ERF, WTI, etc as possible buy & hold candidates.
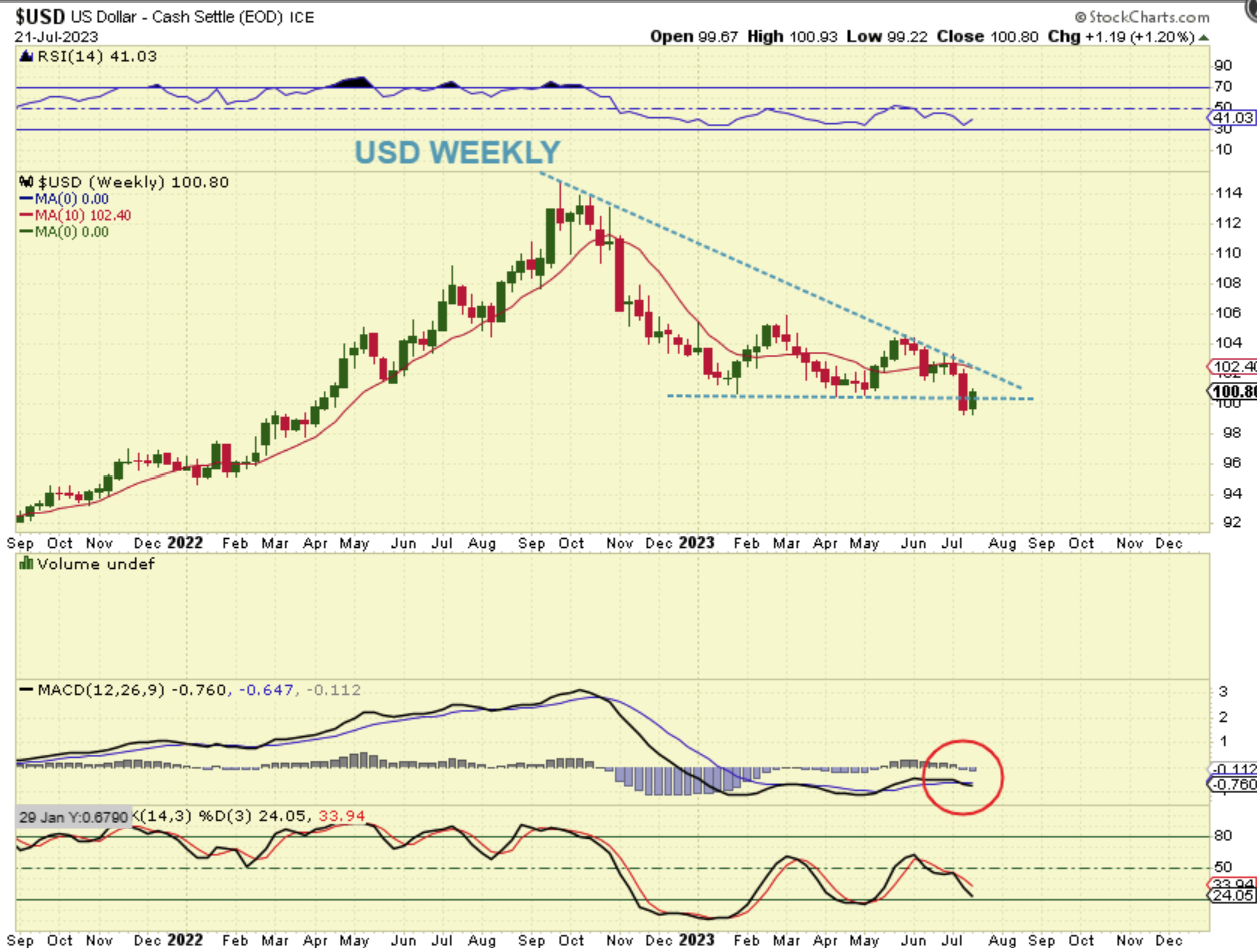
USD WEEKLY – The USD broke down and is now bouncing now. On a daily chart that drop seemed to land too early to be a dcl and it is a failed daily cycle, so I would expect more downside after this bounce. This bounce should not move higher than the red 10 week ma or wedge downtrend line.
.
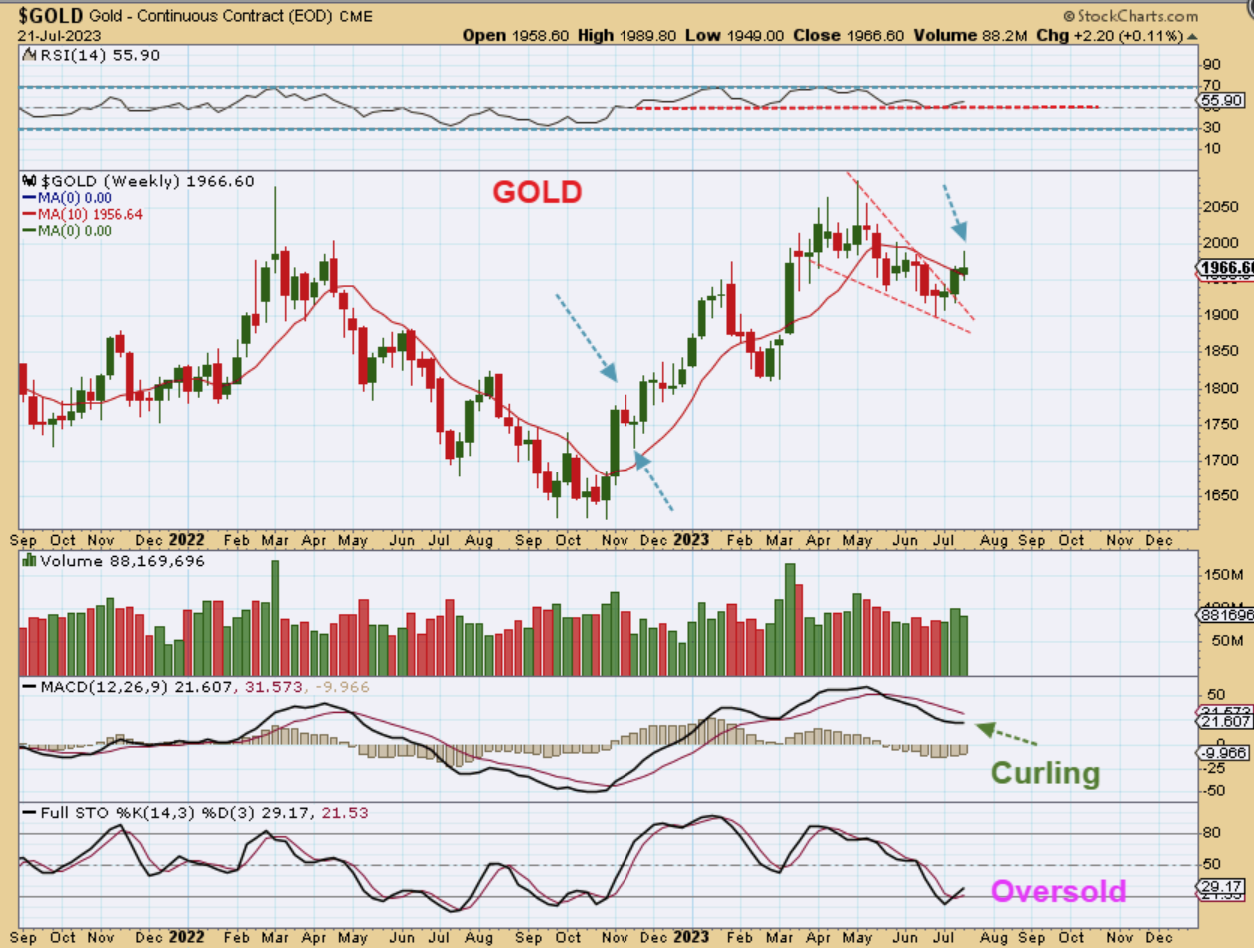
GOLD WEEKLY – Gold broke from a Bullish Descending Wedge and broke above the 10 week ma, but it did also give us a reversal candle when that USD reversed higher. I am pointing out a reversal candle that formed after the October ICL simply to show that the ‘reversal’ was a 2 week experience. The next week dropped and then actually closed green by Friday. Gold is bullish, but may dip lower next week.
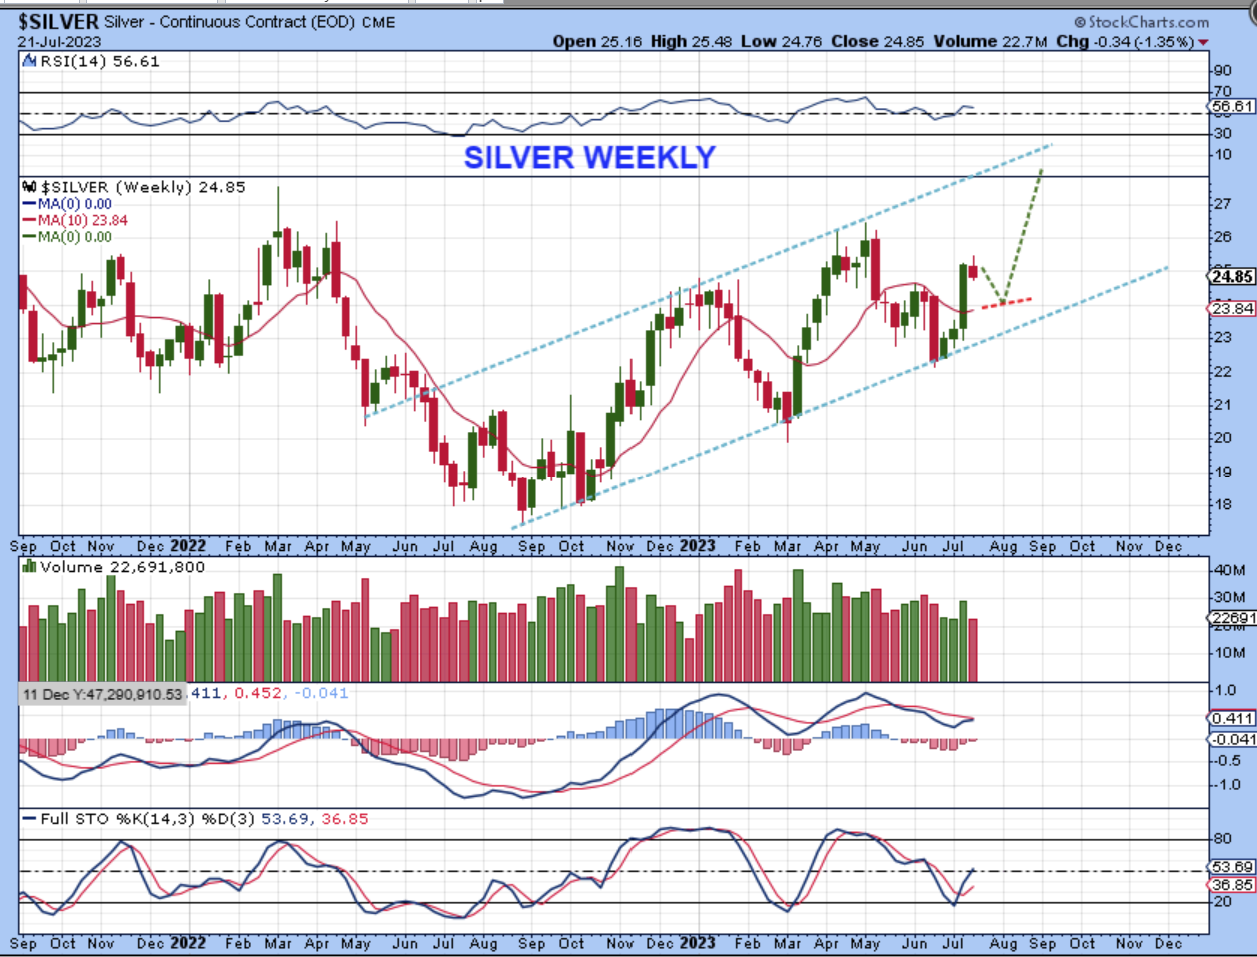
SILVER WEEKLY – Silver is also a very bullish big picture chart, but it also may dip lower next week as the USD bounces.
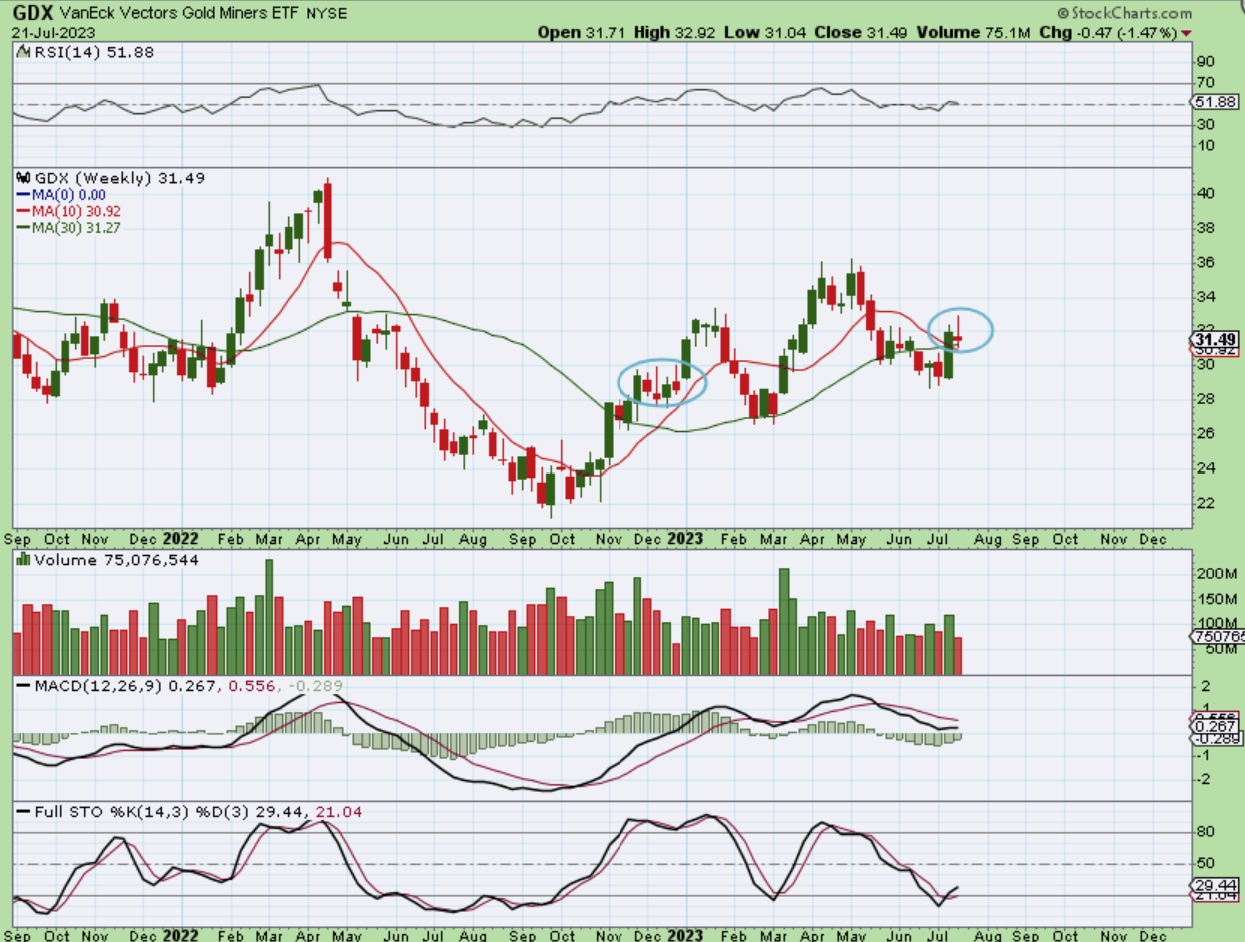
GDX was only down $0.47 for the entire week, but the pop and drop made it seem difficult.
We see a similar set up with The GDX Weekly Chart. I drew a circle at the midpoint consolidation at the end of 2022 to highlight that the dip doesn’t have to be deep, it may chop sideways. I expect the current dip to be shorter lived than that one too, since Gold and Silver should only dip short term with the USD bounce.
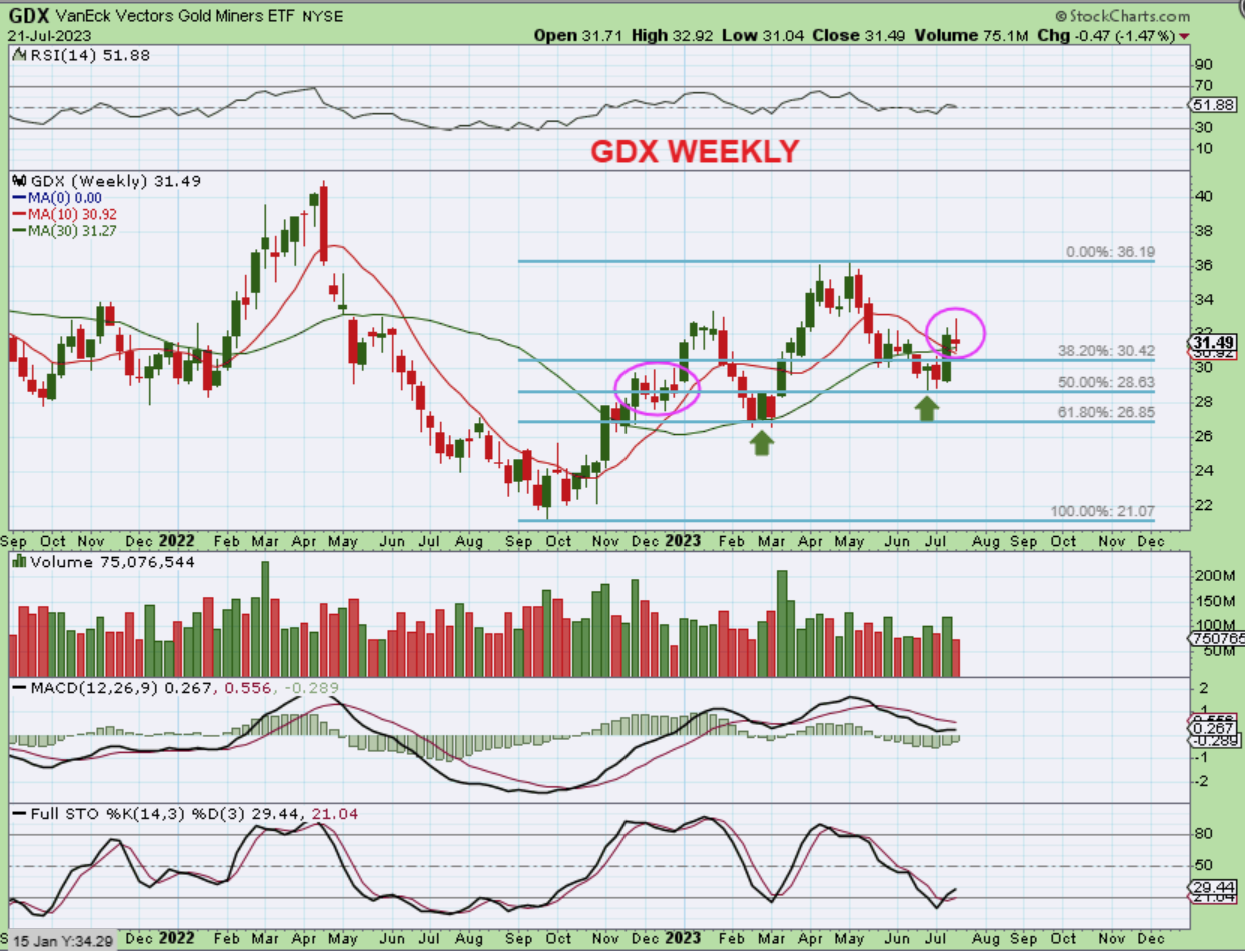
Also, when using the Fib Levels as a guide, The GDX ETF shows that this was a perfect 50% retrace from the September ICL and it is now above the 10 week and 30 week ma. The set up is bullish.
.
This past week was a bit choppy and with the USD bounce taking place, I’m expecting more choppiness or even a continuation of the reversals and pullbacks next week in the General Markets and Precious Metals. Oil may push higher. We have an ICL in place for the Miners, so I am viewing this dip to be a ‘buy the dip’ opportunity, which is a gift for those that may be more lightly invested than they wanted to be. .
.
Enjoy your Sunday and thanks for being here at Chartfreak with me!
.
~ALEX
.
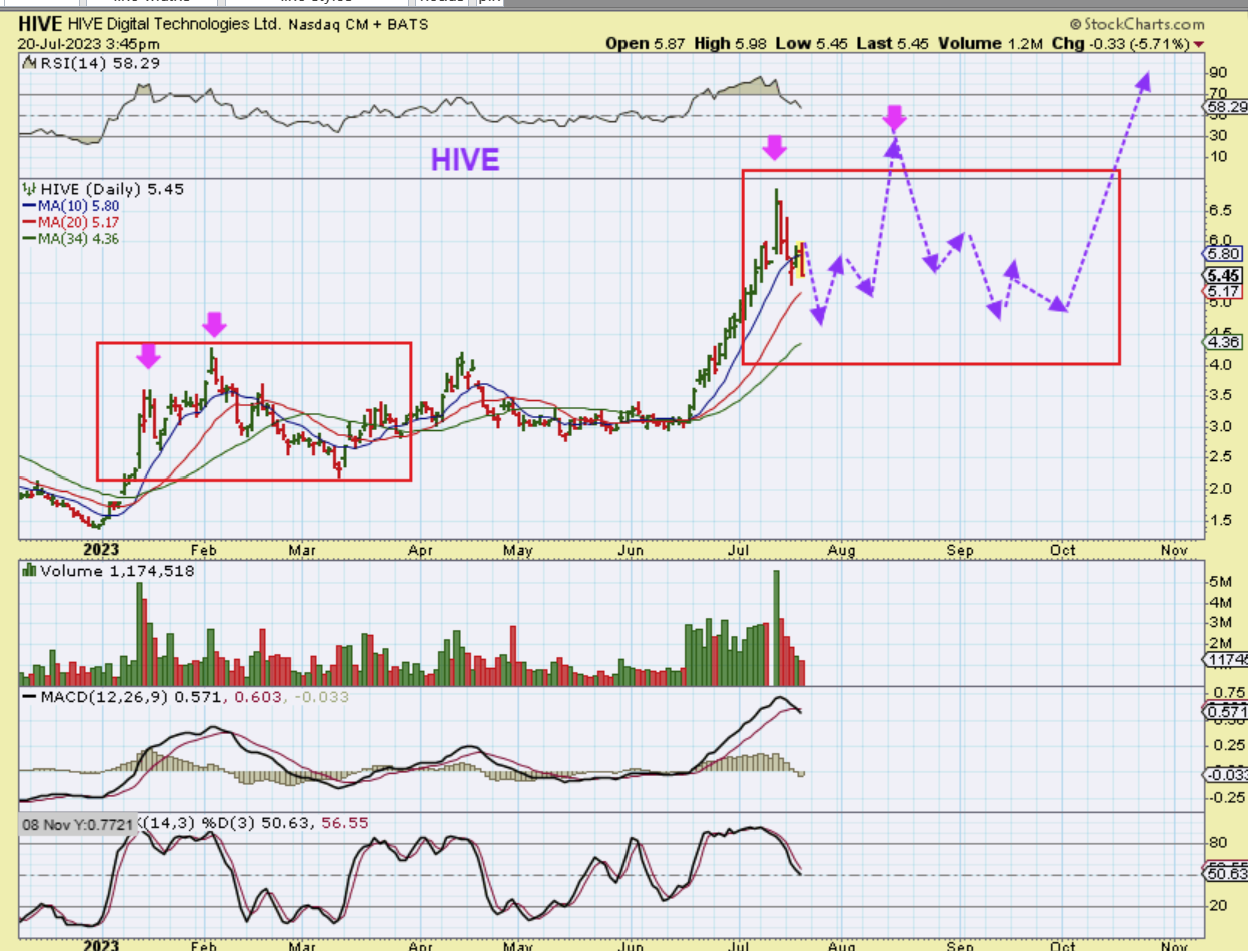
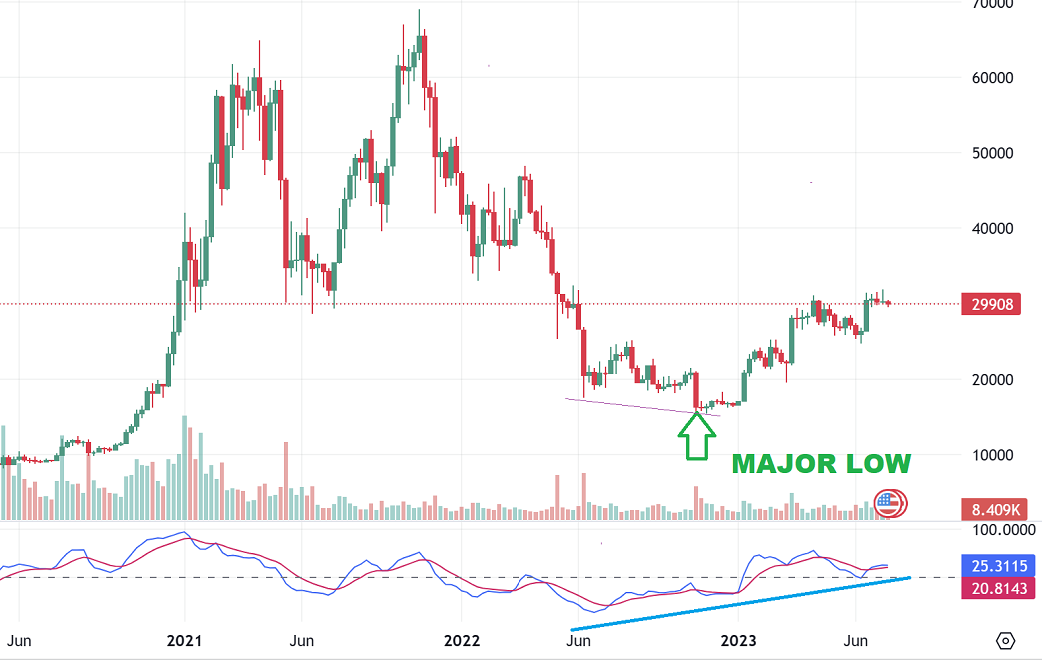
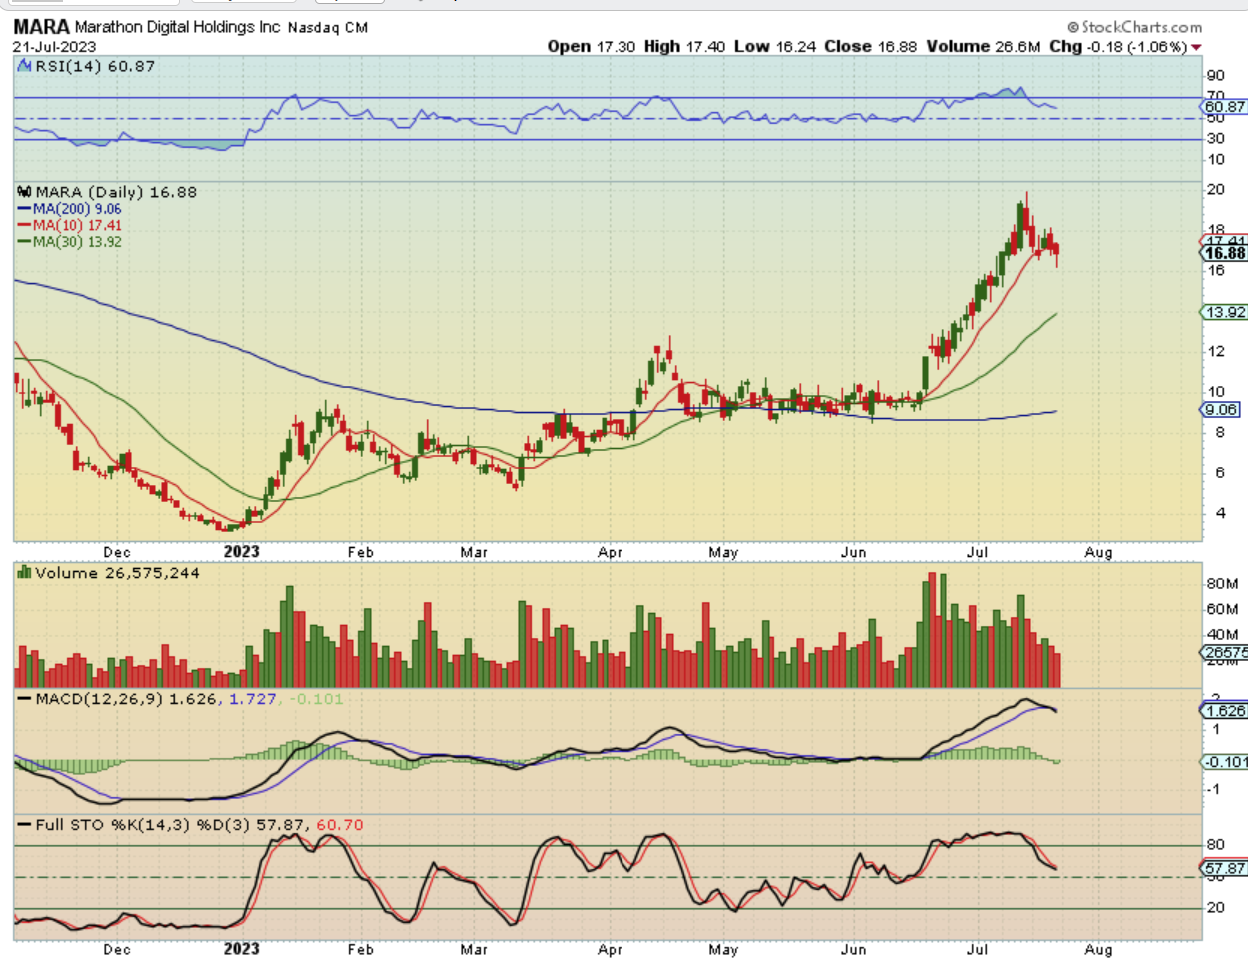
BITCOIN WEEKLY: Bitcoin is in a consolidation phase at this point, but I called a MAJOR low at the end of last year and this should turn Bitcoin bullish for years actually. Crypto land gets very choppy and difficult at times, but investors buying at the lows are up almost 100% in Bitcoin and in MARA, RIOT, HUT, HIVE etc they are up BIG…
.
For example MARA and RIOT have both already ran from roughly $3 to $20, and that is near 600% gains!! This sector has been VERY profitable if you don’t buy high and sell the drop. It is a difficult buy and hold at times though, with the constant chop, but if you could just buy the deeper dip and then park some money there, you’d do well over time.
.
You can easily see that Crypto Stocks often chop sideways for Months. It has many false starts and mini-runs, but that just makes it choppy, and then out of nowhere it QUICKLY puts in big gains on a steep run higher. This was only the 2nd or 3rd real run higher (January, March& April, June – July), but it has gained almost 600% out of the lows.
I have also mentioned that once they break the pattern of the steep climb, they can start that consolidation phase, so…
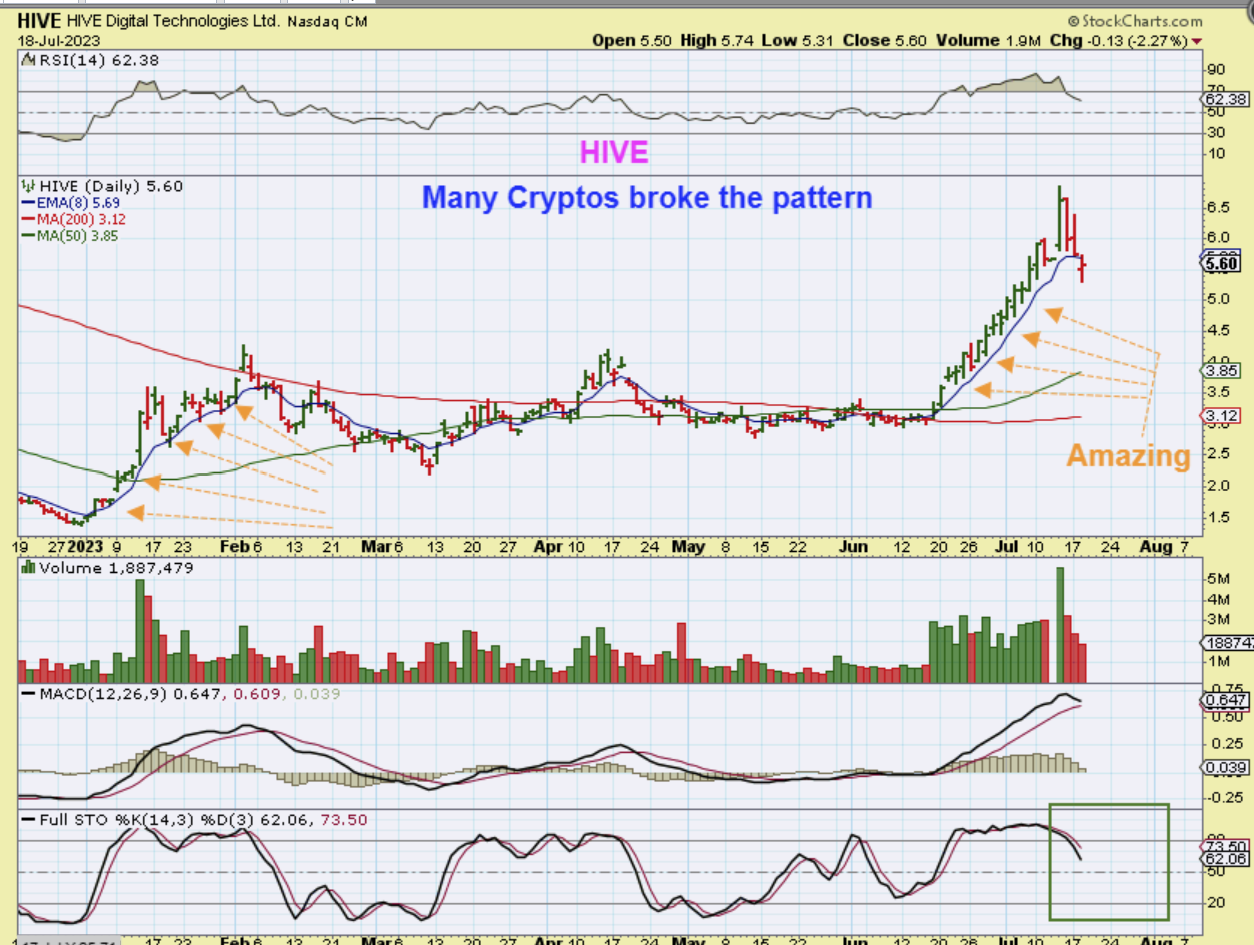
I drew this as an idea of what we could see, but this is just an idea based on my thinking that Bitcoin can run to $35-$36,000. These consolidations can change size (become a bit smaller) if the bullishness goes mainstream and buyers start to continually step in over time. I’ll continue to discuss this sector more in the daily reports as things unfold. I think that Bitcoin has years of bullishness ahead.