July 8th Weekend Review
The General Markets have been bullish for weeks, Crypto stocks have been extremely profitable, Oil has been choppy, but that may be about to change, and as of this week there is also the possibility of a Bullish development in the Precious Metals Sector. 🙂 This weekend report is not boring, so let’s get right to it!
.
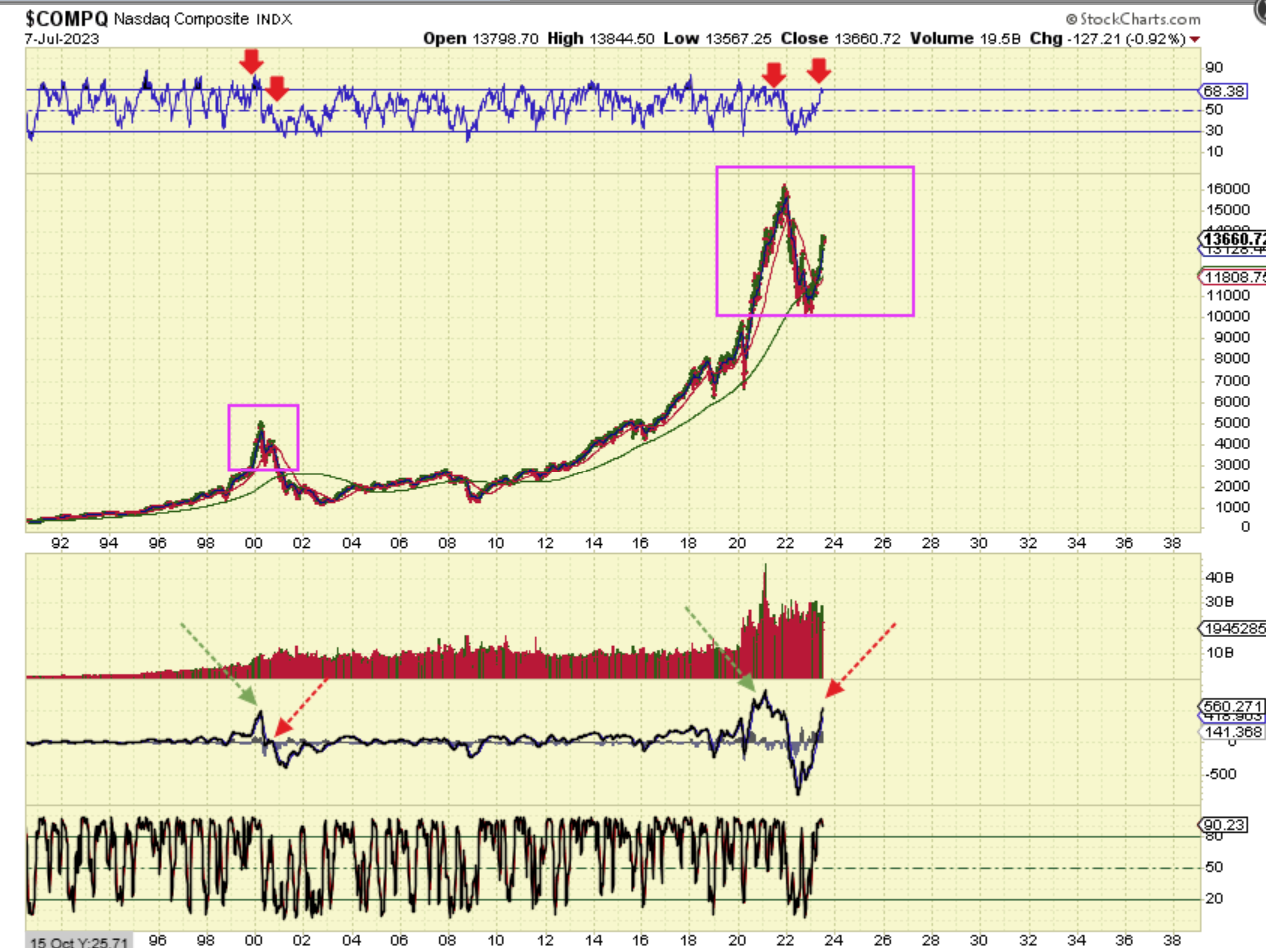
NASDAQ WEEKLY- When I mentioned that I expected the General Markets to rally through 2023, I said that we would always take a look along the way to see if we can tell whether the Markets are in a Bull continuation or a double top.
Is this recent run similar to the double top in 2000? No, it is not. I already see a big difference in the RSI and MACD positioning (see Red Arrows). This is a stronger rally than that 2000 Bear Market Bounce and looks ready to continue to run to the prior highs in the 2nd half of 2023.
.
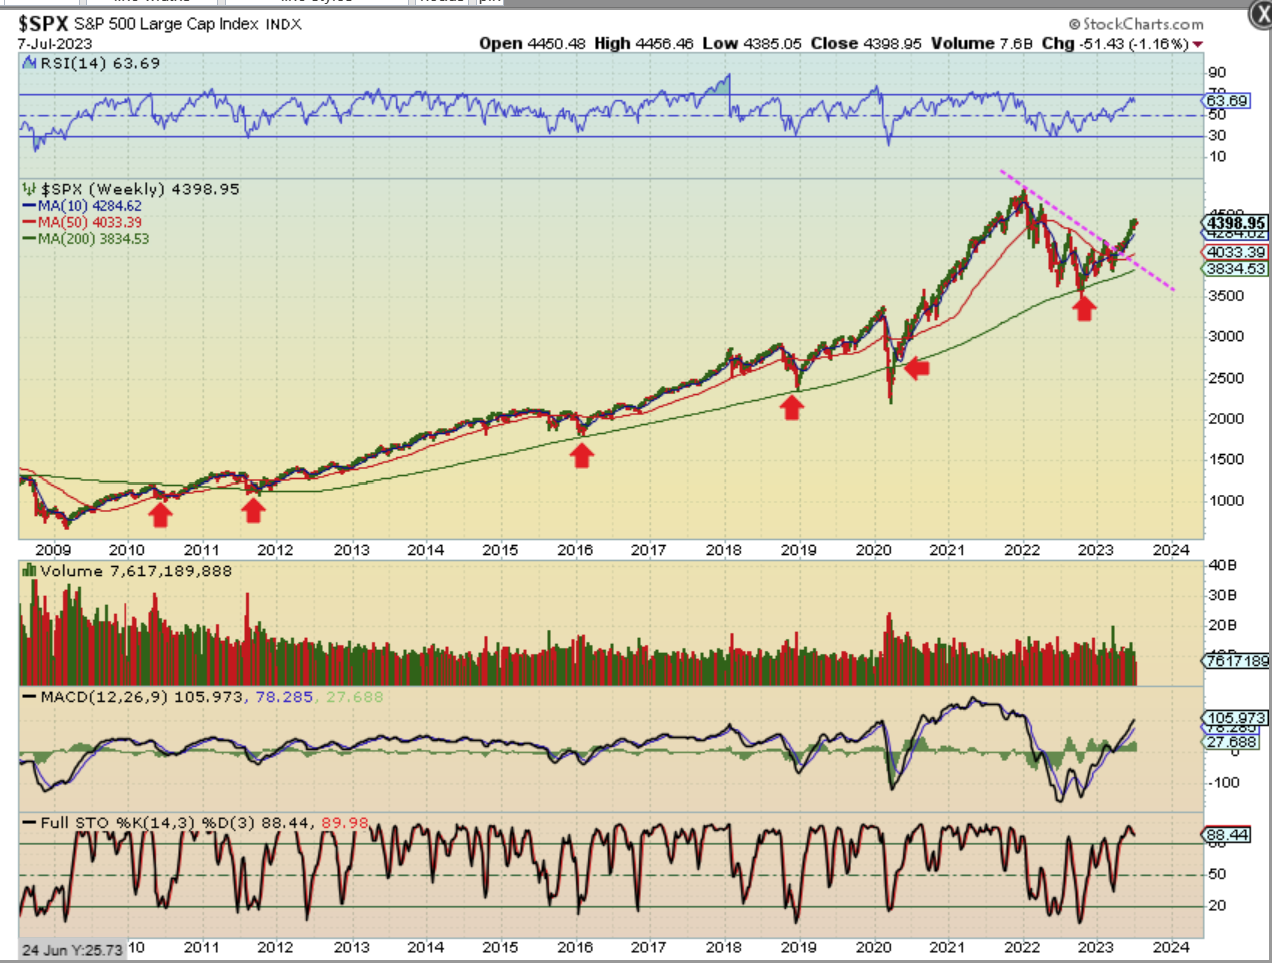
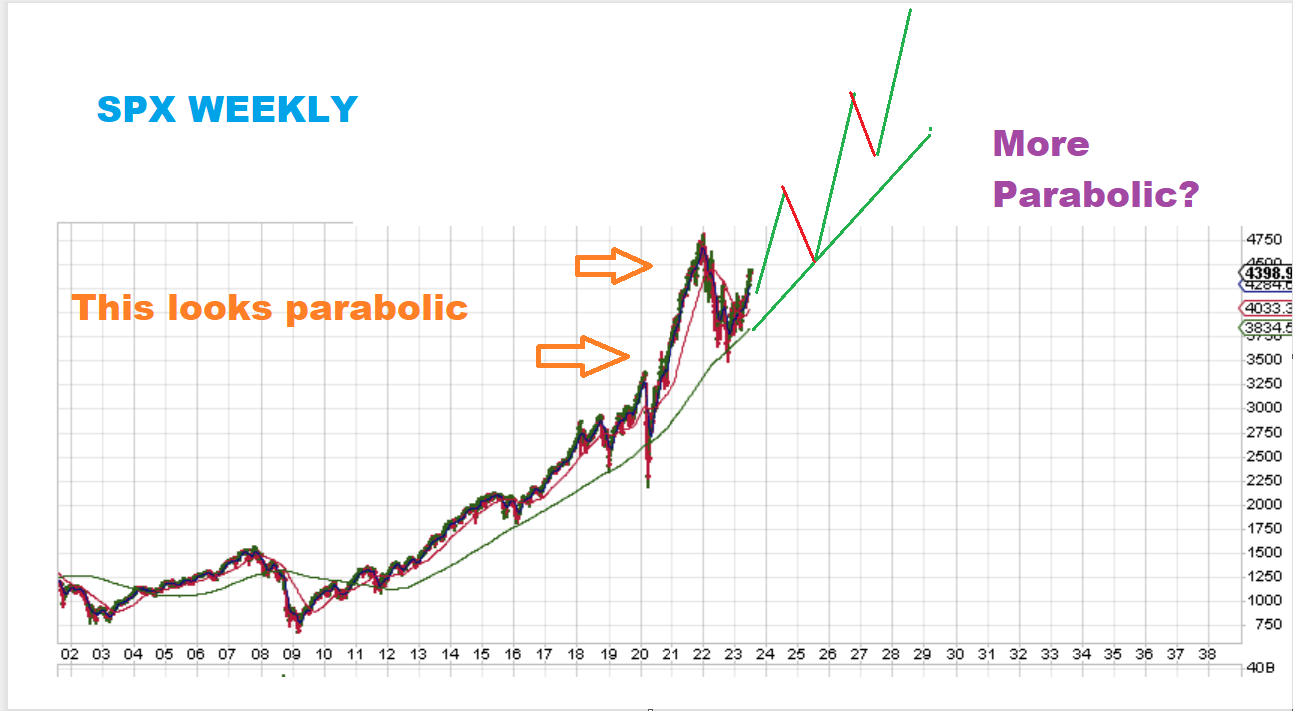
SPX WEEKLY I have been pointing out that the SPX Weekly Price repeatedly found support in the 200 week ma area during the deeper sell offs (with the exception of a shake out in the Covid 2020 crash). I’ve been calling for at least a run back to the former 2022 highs, so…
.
SPX WEEKLY– Even though the markets did look parabolic before entering the 2022 Bear Market Correction, does that mean that they now have a blow off top in place and cannot go higher than those highs?
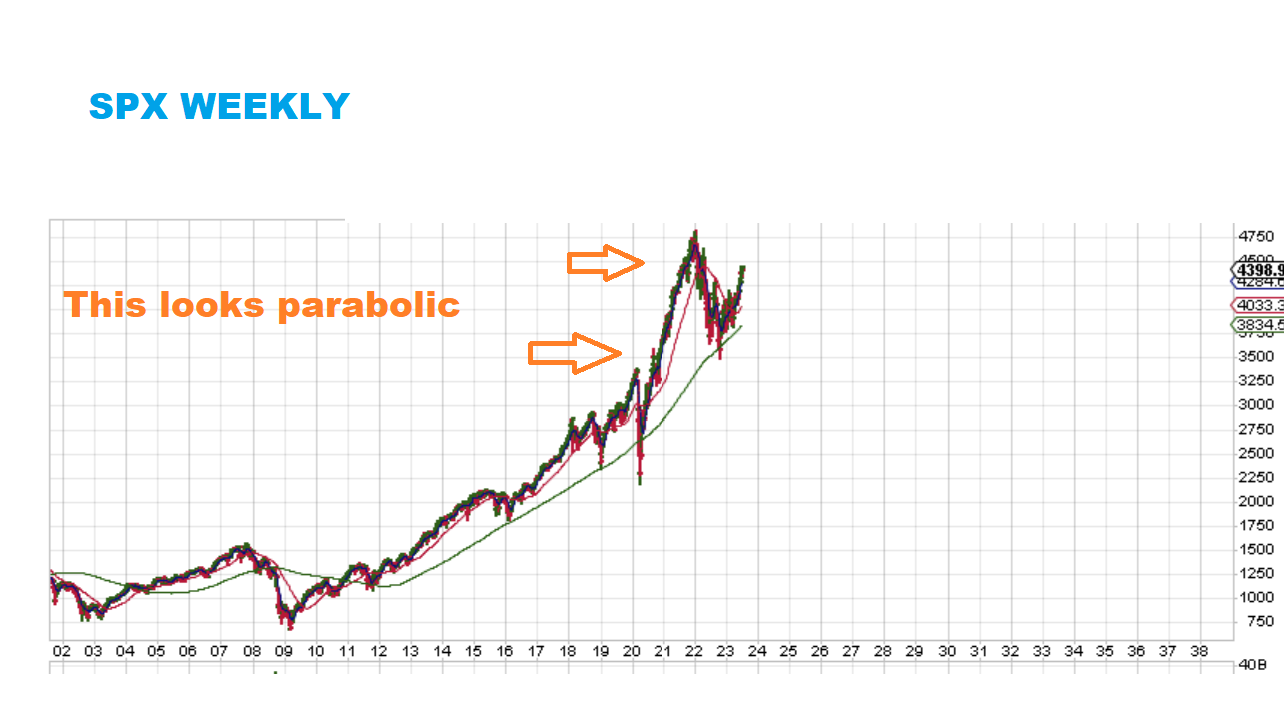
The answer is no. After that bear market correction washed out bullish sentiment and re-set the stage, we could see a continuation of the run, as drawn here. Yes, I am expecting a recession at this point at the end of the year, but we’ll just have to see if the markets climb a wall of worry and it doesn’t last long? Or do we get another ‘bear correction’ for 2024 and then climb higher? We’ll see in 2024.
.
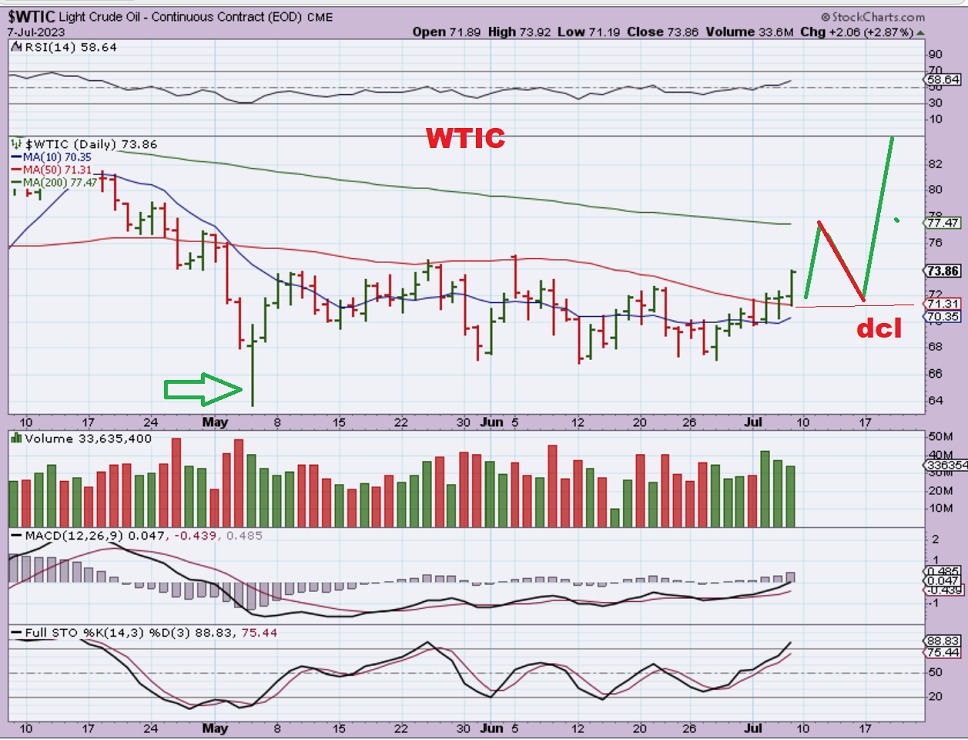
WTIC DAILY– Oil has been very choppy and trading it has not been profitable, but that could be about to change. I called that drop in May a possible ICL and it is still holding up as The Low, so we may have a sideways choppy first daily cycle here. Oil started to push higher this week, with volume, so maybe we get a tag of the 200sma and then a dcl, as shown. Then Oil may finally rally higher. Let’s look at the weekly chart…
.
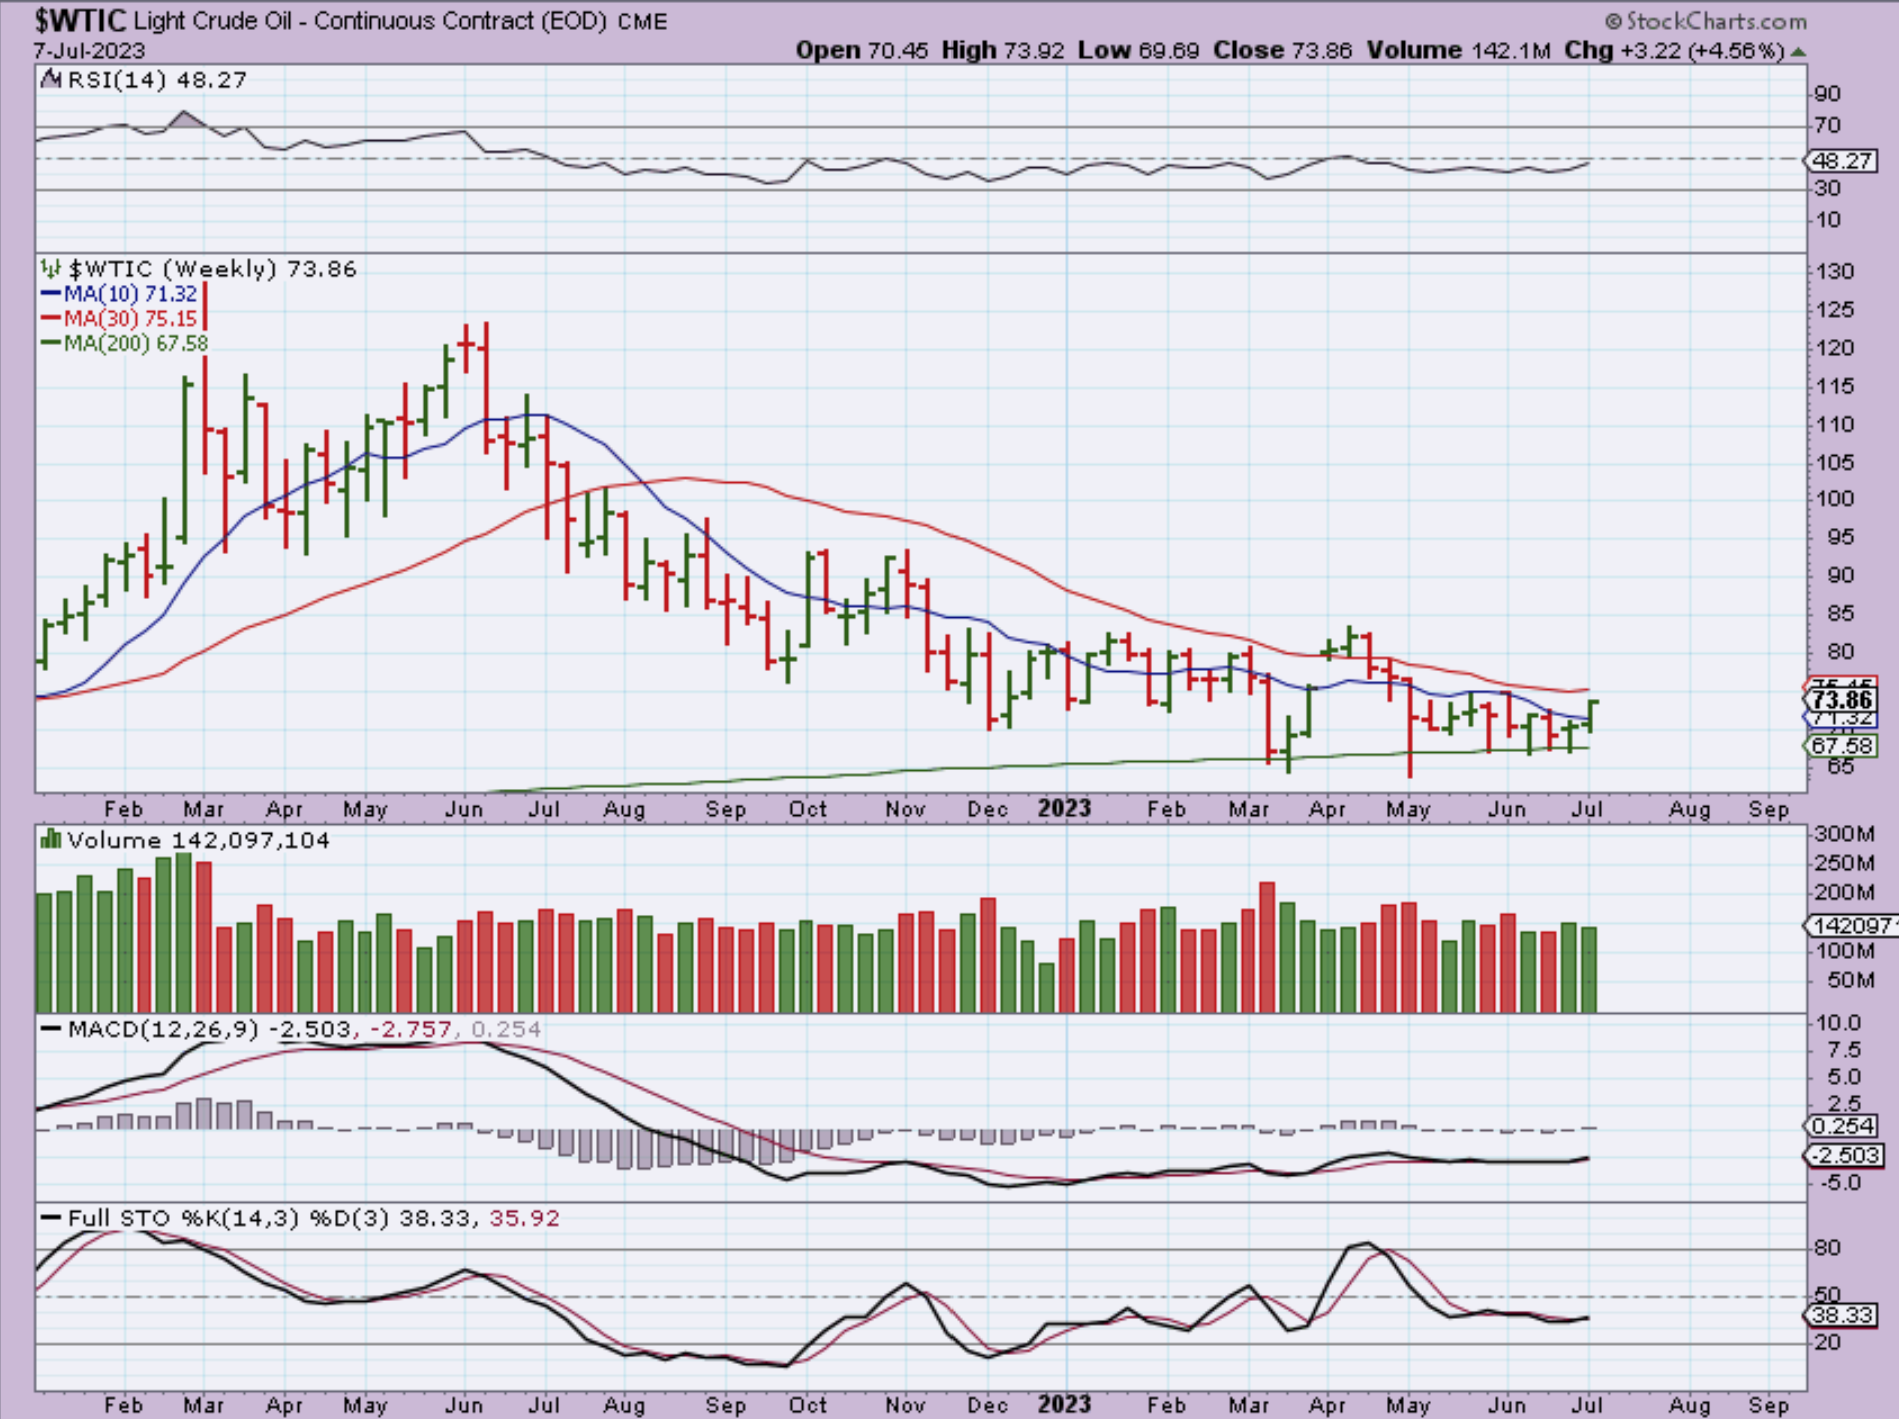
OIL WEEKLY: Again, Oil has been very choppy and sideways, but that won’t last forever. Oils weekly price has been bouncing along the 200 week ma and this could become 1 long rounding bottom base if it breaks and runs higher.
.
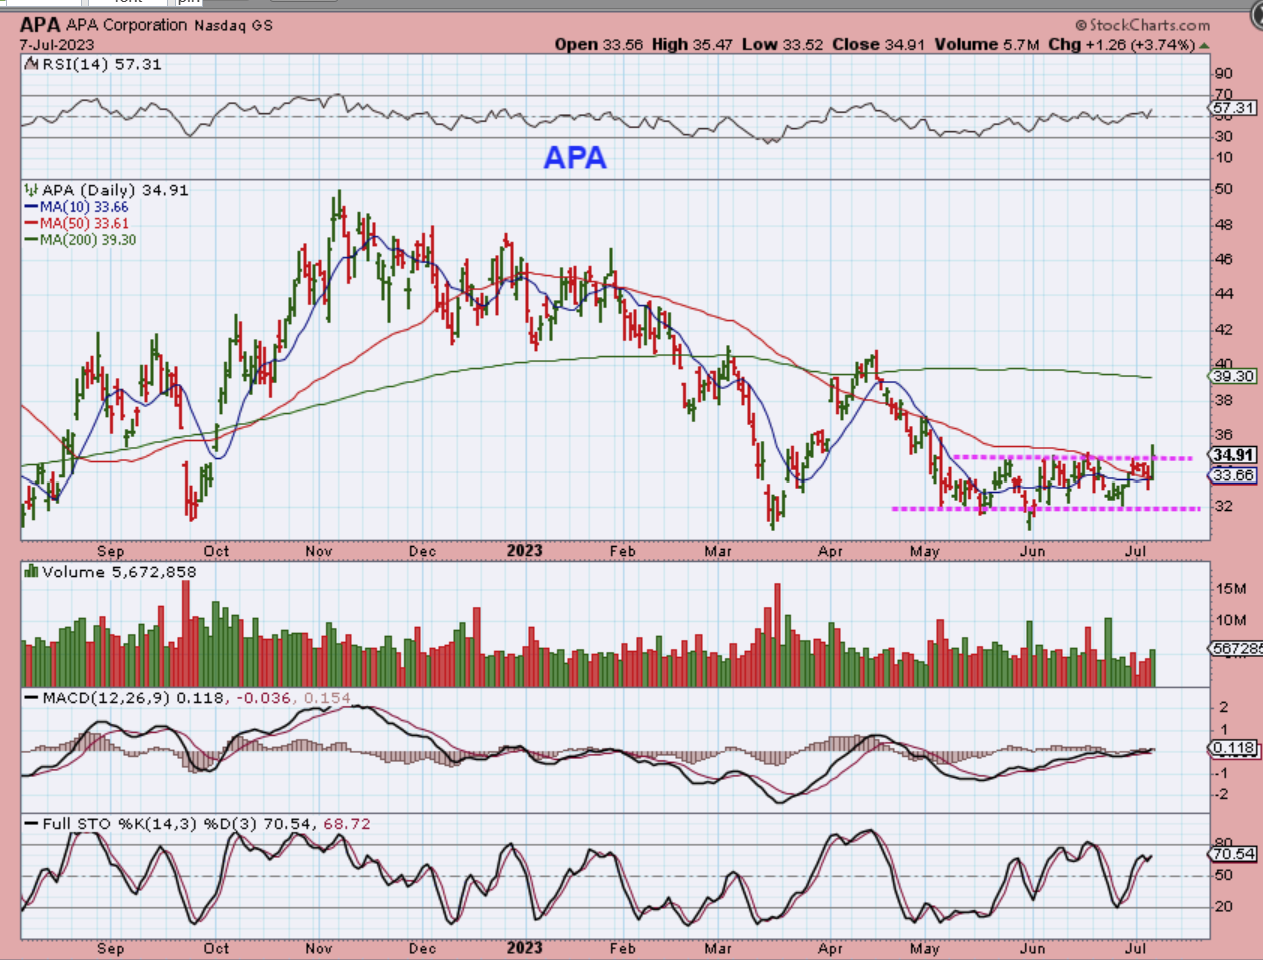
APA DAILY- The individual Oil Stocks on our list have been choppy too, but they are starting to pop higher too. APA broke above the 50sma this week.
.
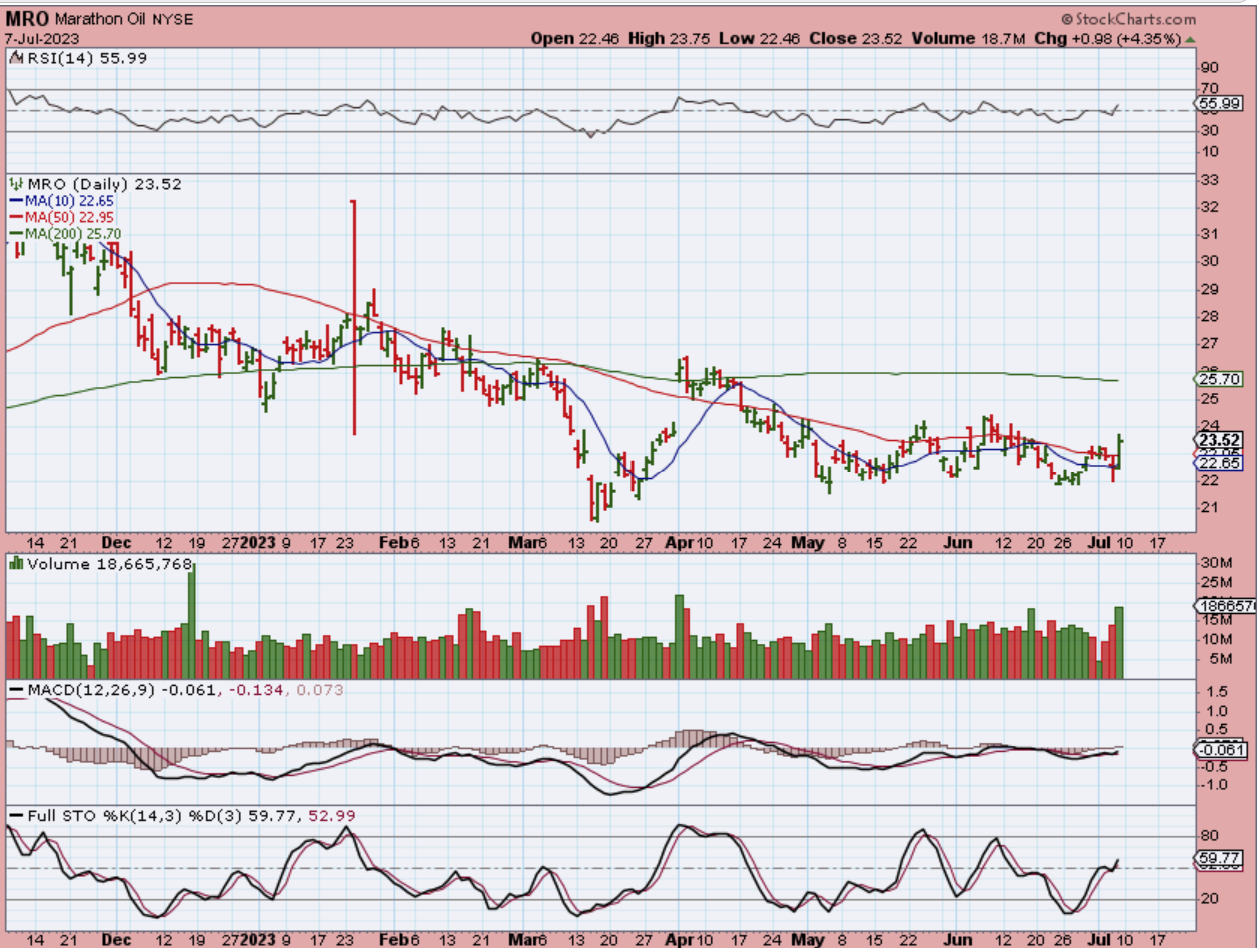
MRO DAILY is also pushing higher and had a nice increase in volume on Friday, so the Oil stocks ( and XOP or Gush for leverage) may become a good trade going forward. See also VLO, ERF, WTI, CPE, etc. I will have more in the daily reports as they set up bullishly, but these are close enough to the lows to be bought with a stop too.
.
THIS IS WHERE WE DISCUSS THE POSSIBILTY THAT A BULLISH CHANGE IS NOW TAKING PLACE FOR THE PRECIOUS METALS SECTOR. Yay! 🙂
.
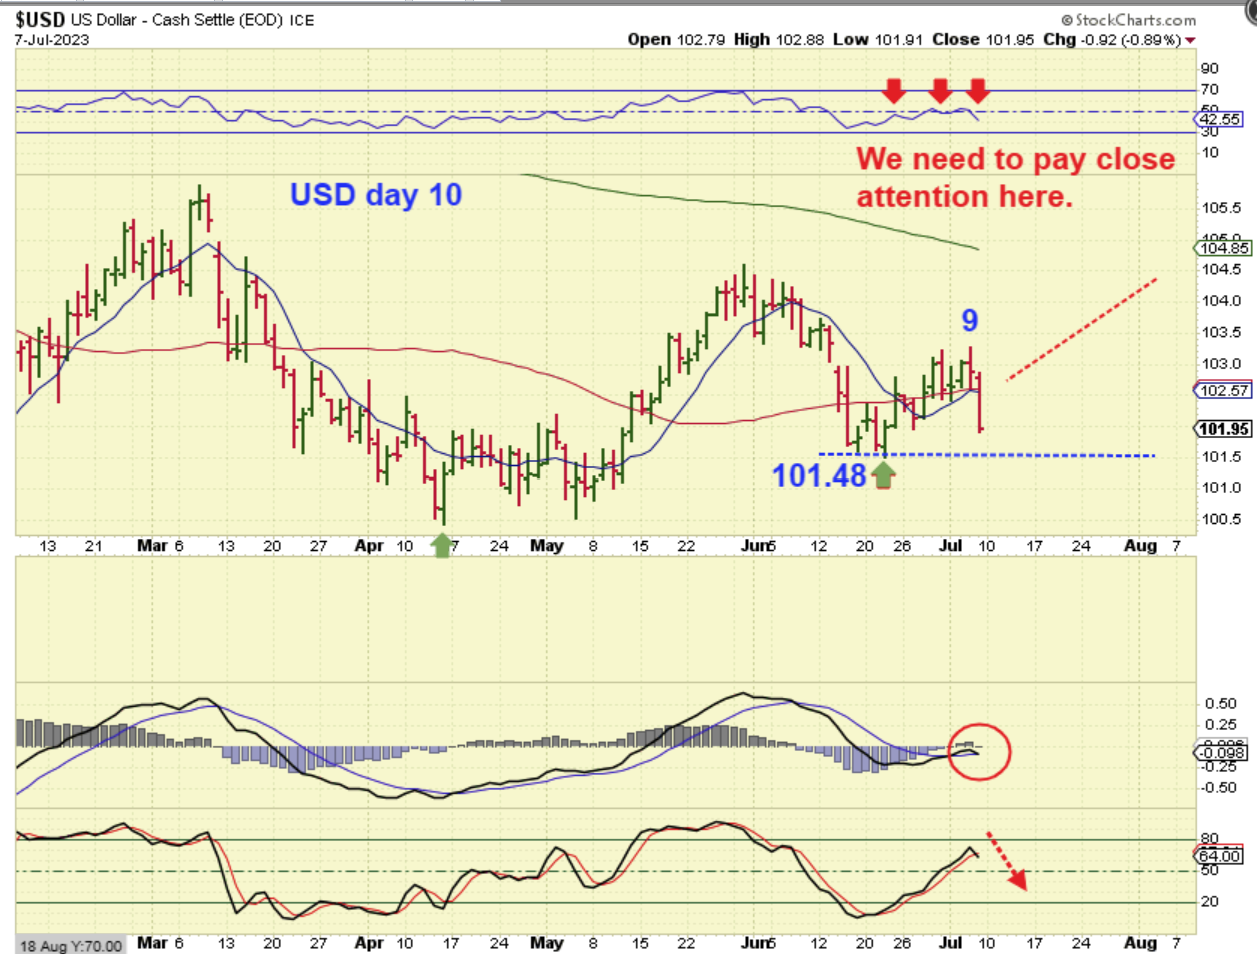
USD DAILY – Take a look at what the USD did on Friday. After re-gaining and closing above the 50sma for 6 days, it suddenly dropped sharply and sliced right through it to the downside. Is that it? Do we have a day 9 peak and is this going to break the recent lows and fail? This is only 1 day, but it could start the ball rolling. If so, that could put the low in place for The Precious Metals and start the long anticipated Bull run to all new highs for Gold.
.
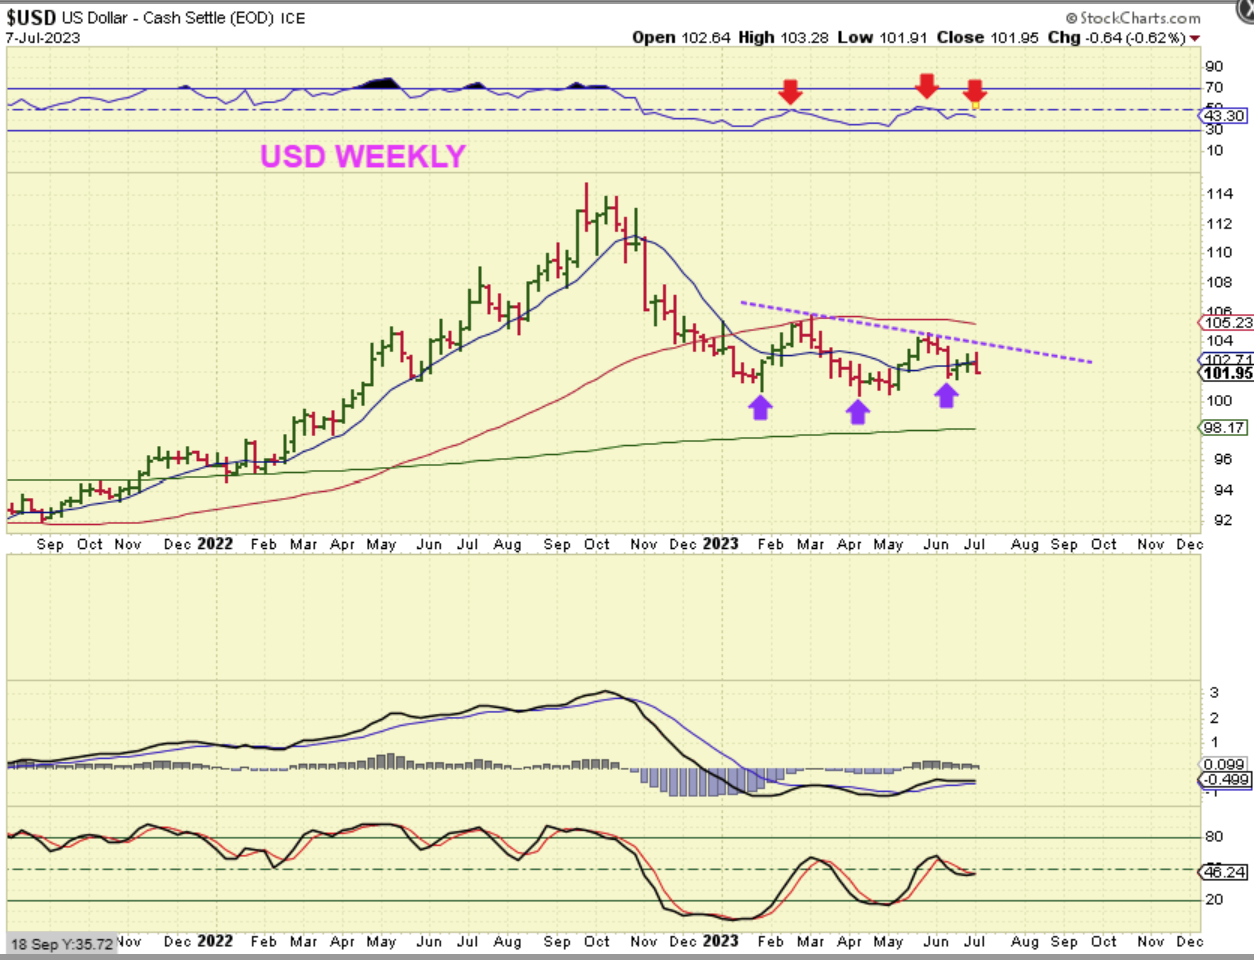
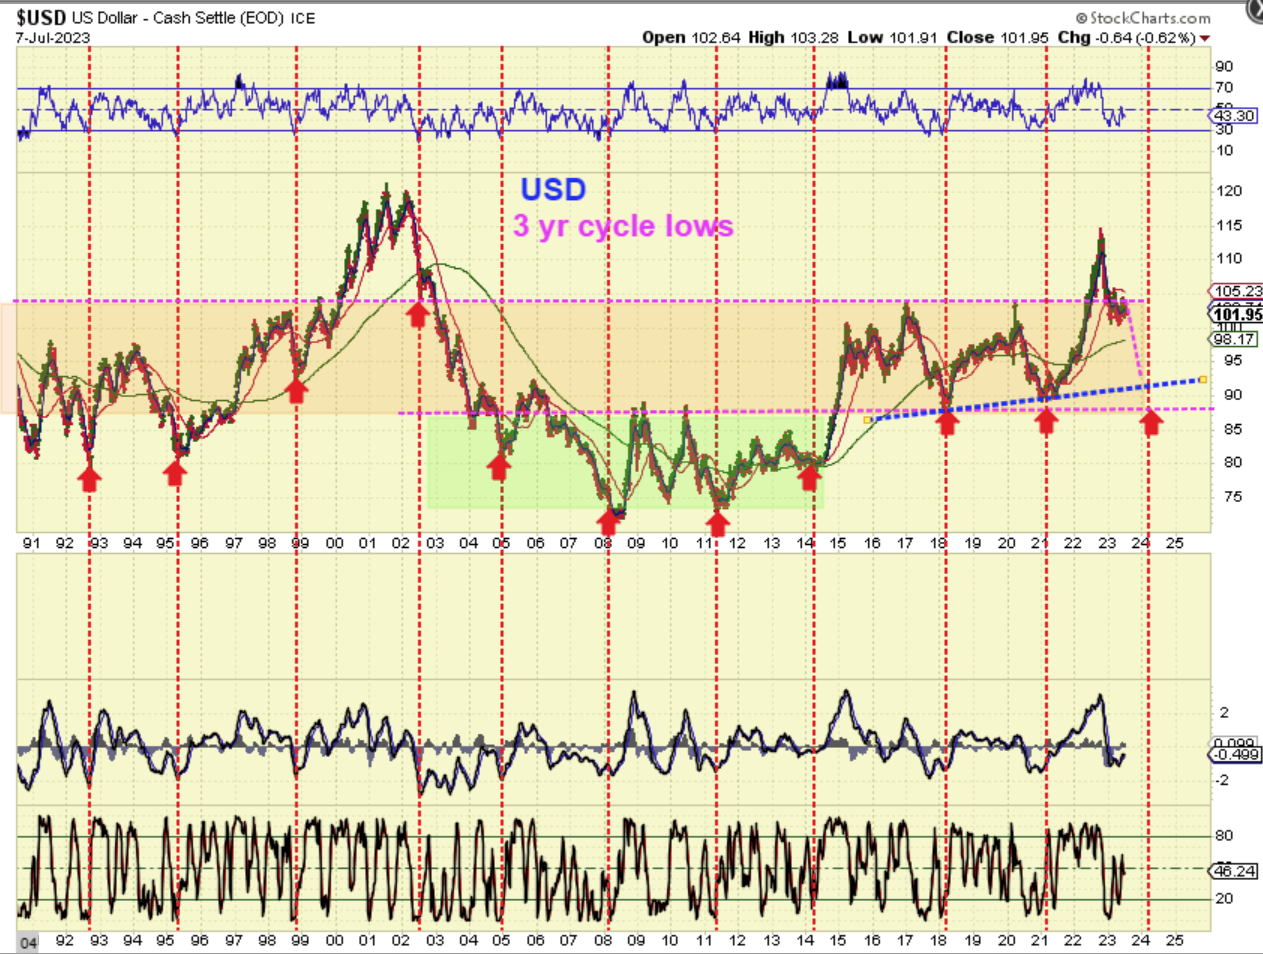
USD WEEKLY – I did expect the USD to push a little higher before rolling over, but I’ll gladly take it if this is all we see for the USD bounce. This is NOT a bearish chart yet, but follow though lower would be a failure for the USD Daily cycle. We need to see what happens next week.
.
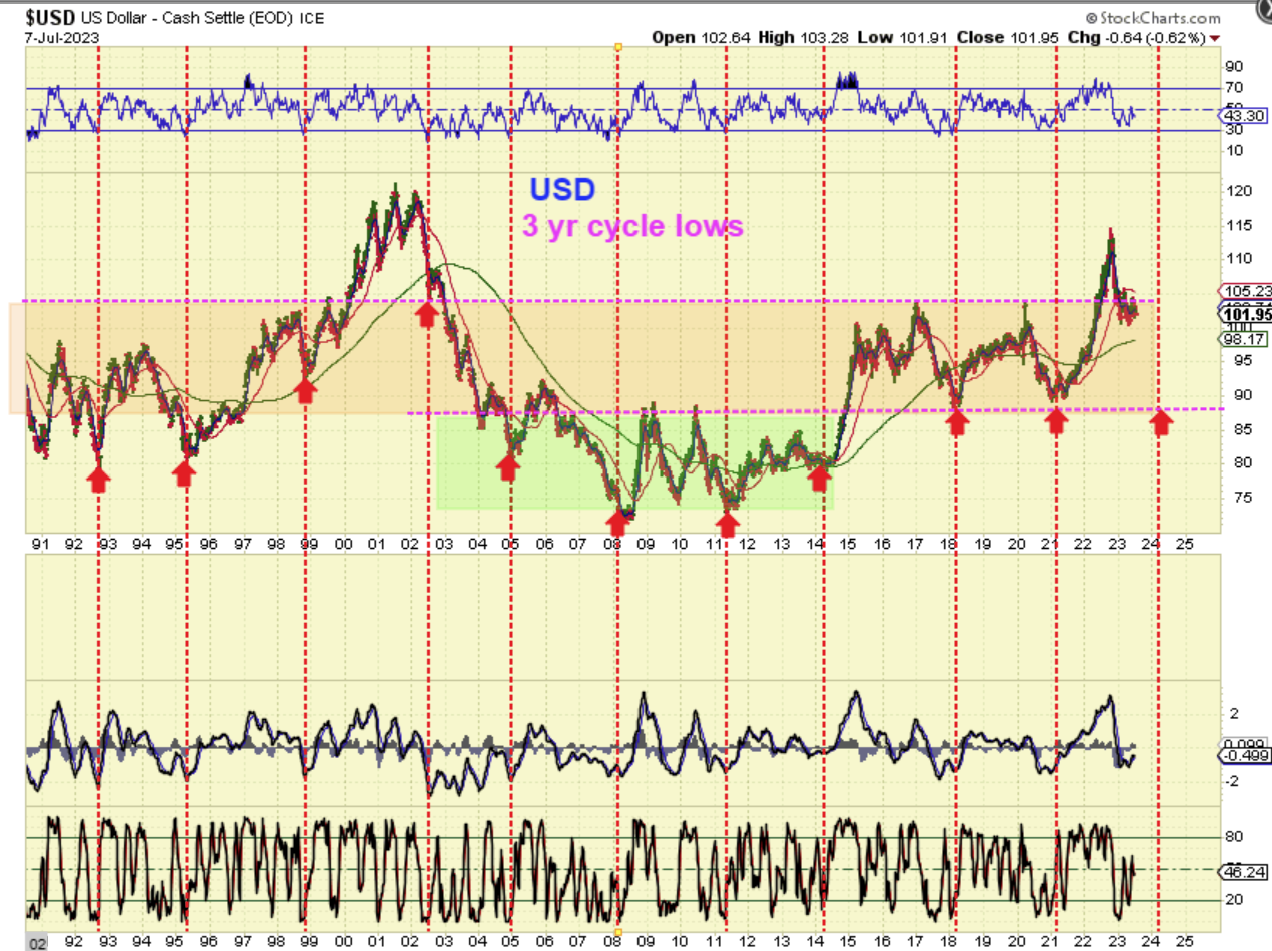
The USD 3 Yr Cycles Lows are really very accurate and so I have been pointing to the start of 2024 for our next deeper meaningful low in the USD.
.
And I have been leaning toward a 2nd half to the first drop that we already saw off of the highs. THIS DROP would cause Gold to break out to new all-time highs and Miners will rally strongly, so we want to be prepared to ride that Bull when it turns to run.
.
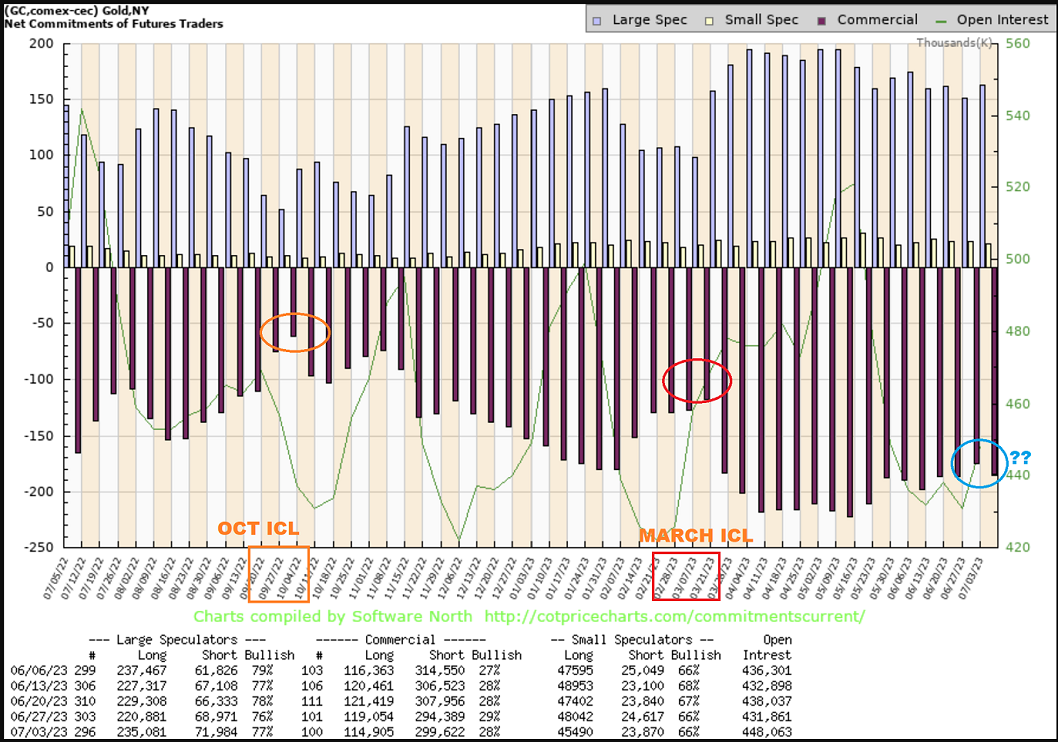
I still do not like the positioning of the COT for an ICL, but this may just be due to the obvious bullishness of Gold near the highs?
.
COT – In October 2022 we saw a COT reading that does reflect ICL levels. The one in March was slightly different, likely cut a bit short by those Bank Failures. To be honest, the current reading is not very bullish for Gold, but this should not stop us from paying very close attention to that sector with that USD drop Friday.
.
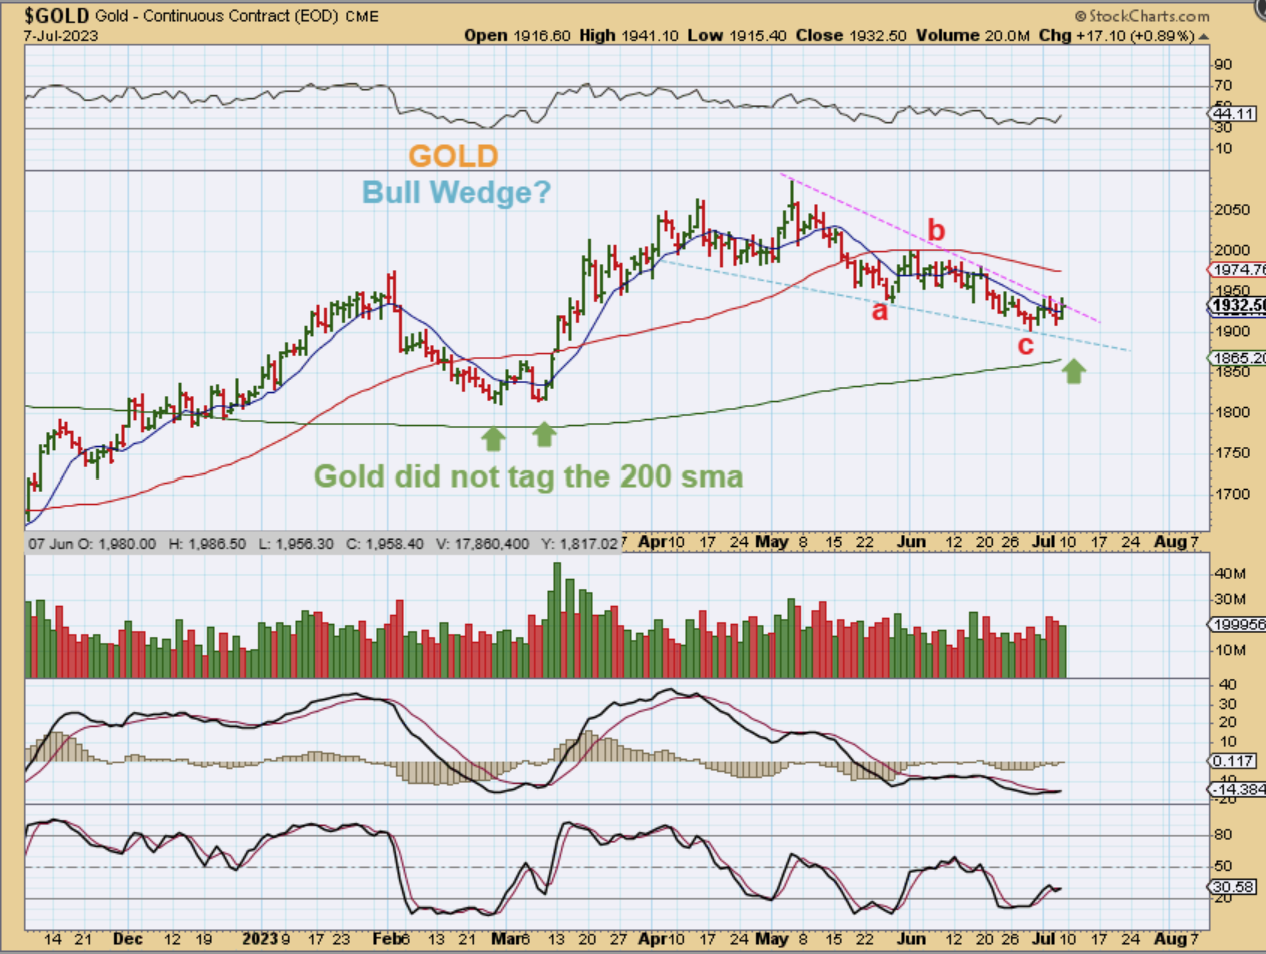
GOLD DAILY – I do wish that Gold was up a little more with that Friday drop in the USD, but we’ll just take it one step at a time. Right now we do have an a-b-c drop and a bullish looking wedge, so if that USD breaks down, Gold is ready to go.
.
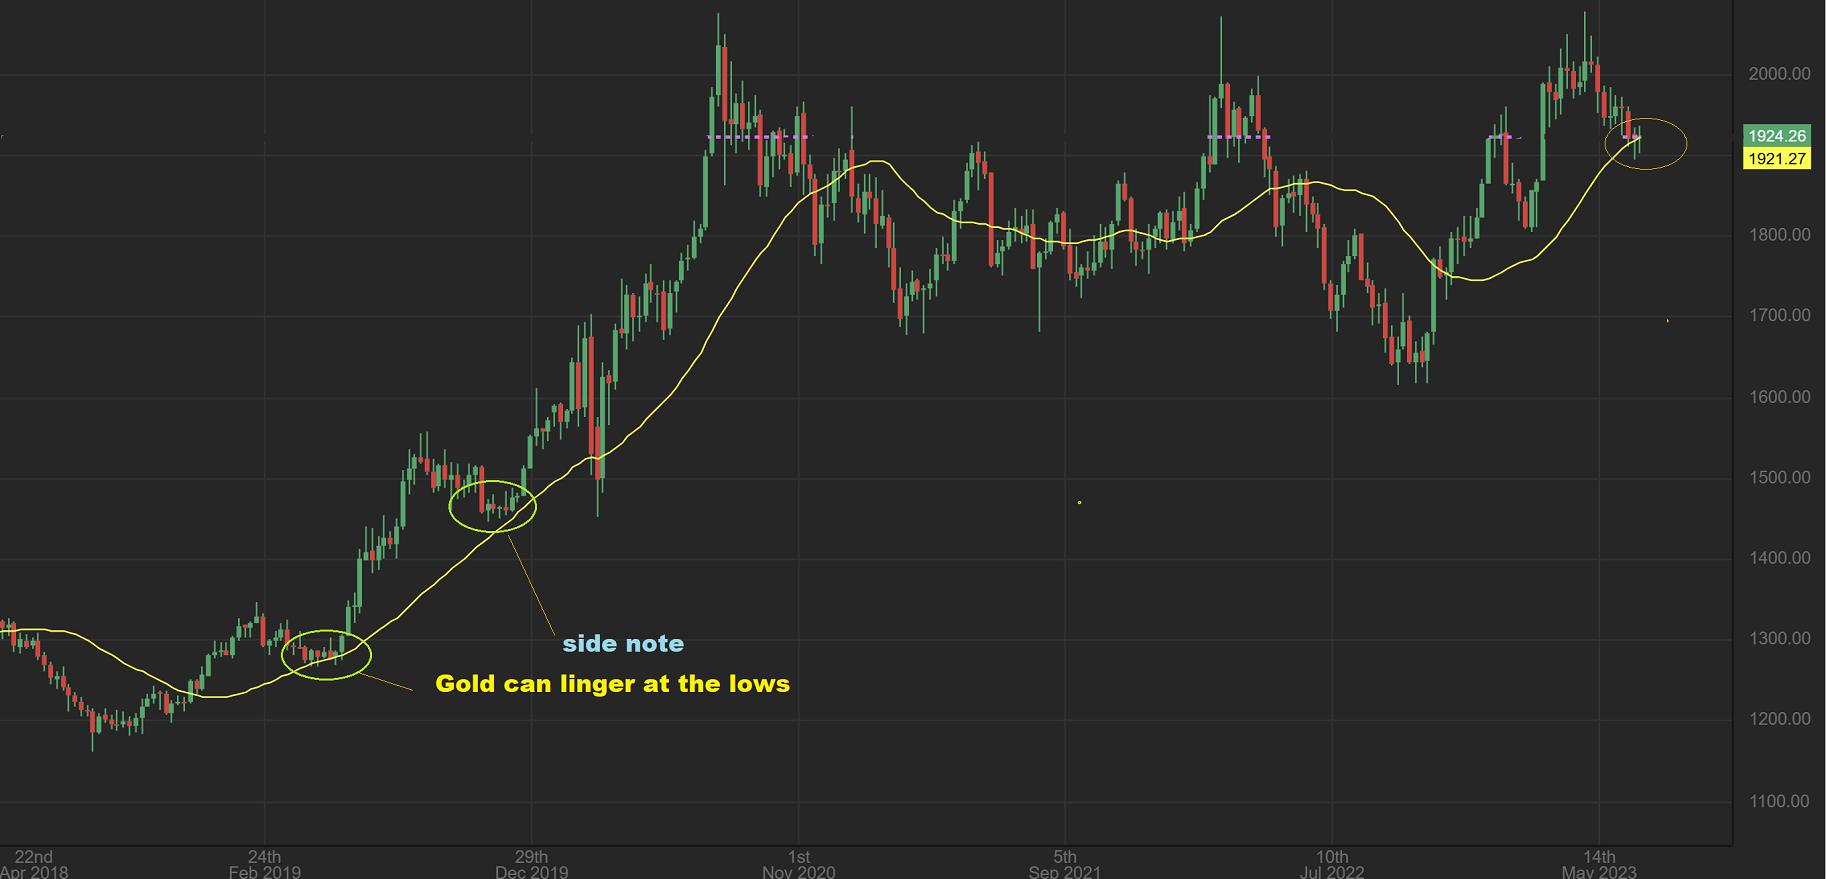
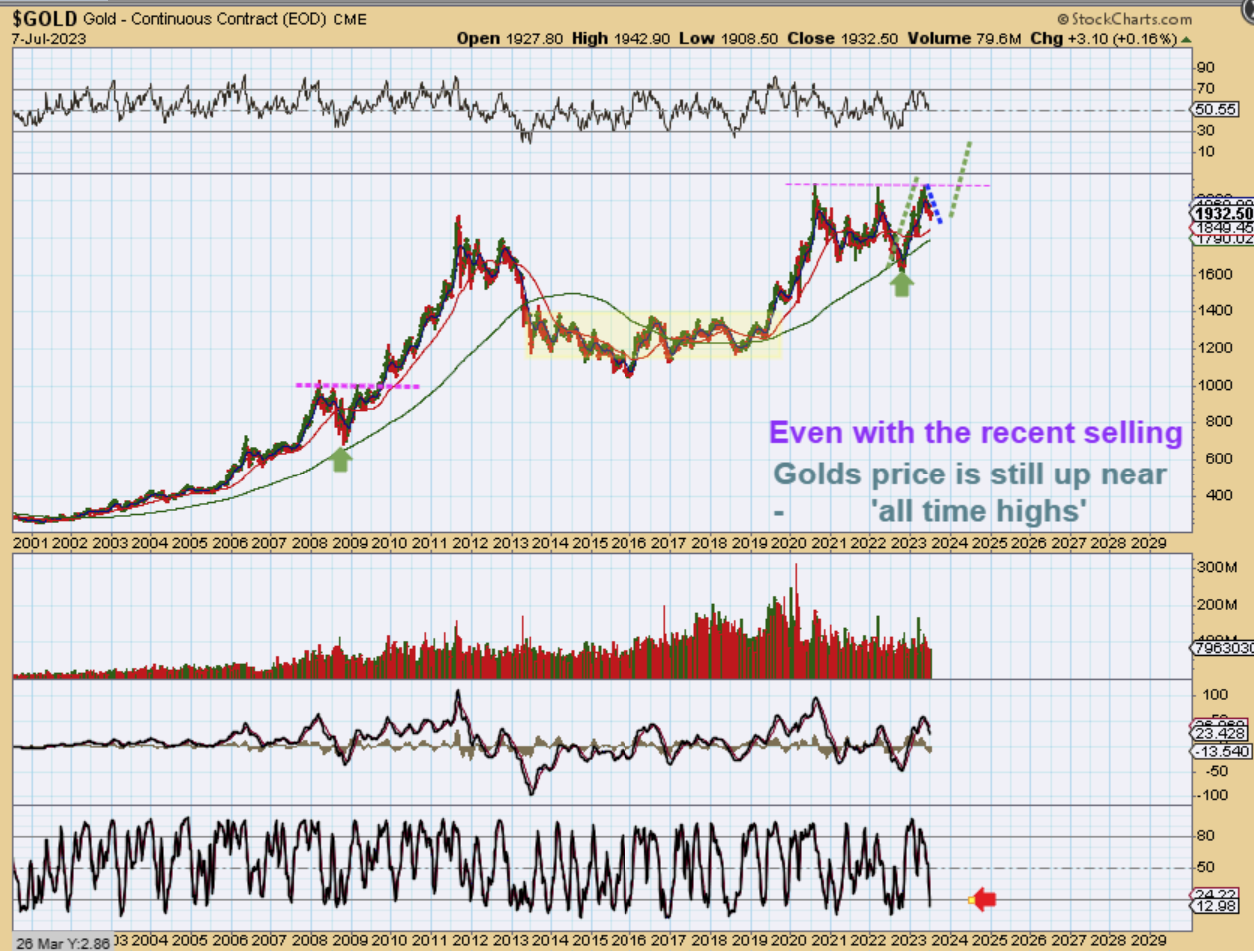
GOLD WEEKLY – Golds weekly chart finally reached the 30 week ma (yellow line), similar to ICls in prior Bull Runs (circled).
.
GOLD WEEKLY – So with the Big Picture, we still have this massive Cup and Handle formation, but now it is finally reaching oversold on the stochastics. After hitting all-time highs, Gold pulled back and should be building steam to break out and rally. See the post 2008 crash and consolidation / rally.
.
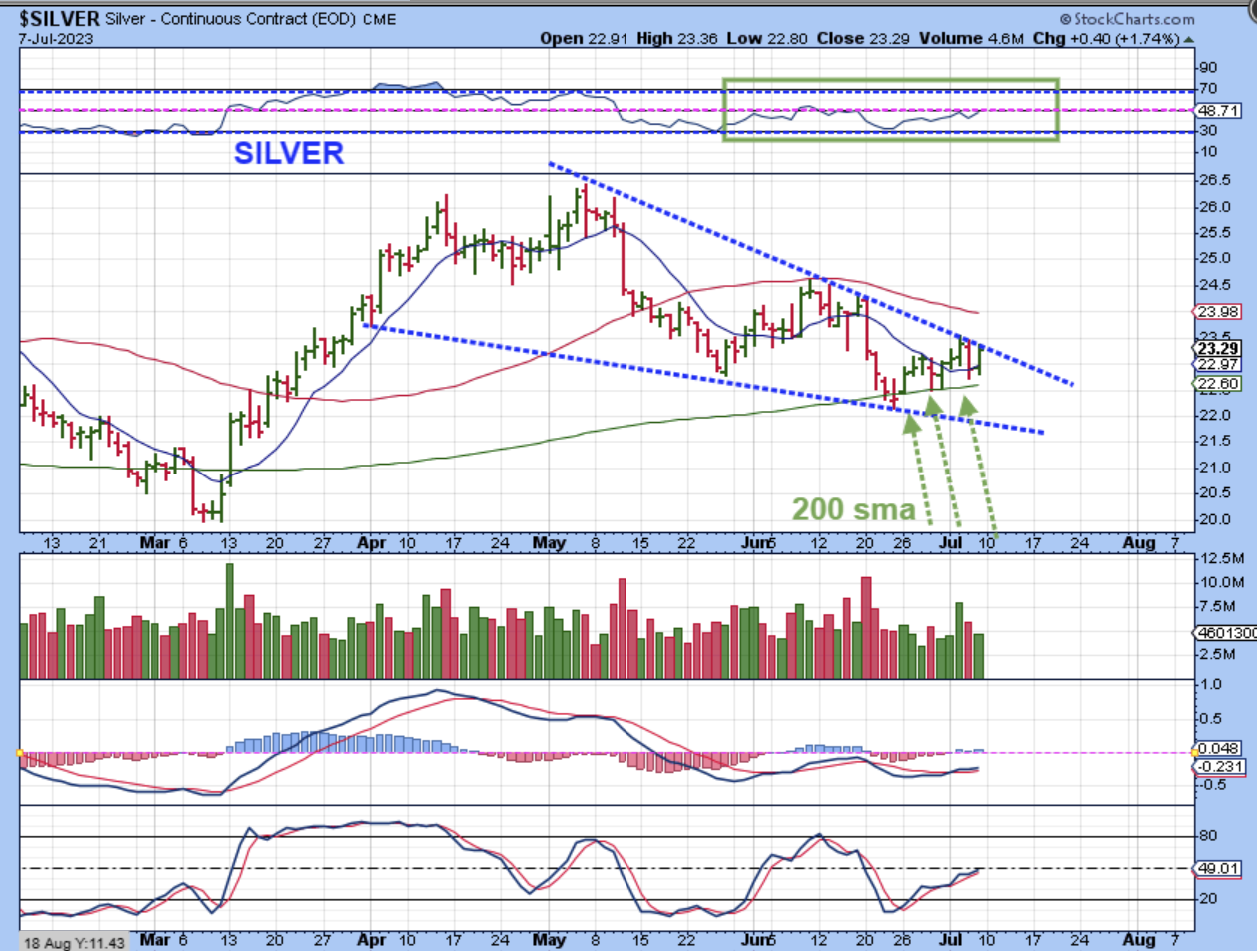
SILVER DAILY – Silver landed on and has been riding along the 200sma.It really needs to break above the wedge (downtrend line) and especially the 50 sma to really become bullish. Until then, we have a downtrend with lower lows and lower highs.
.
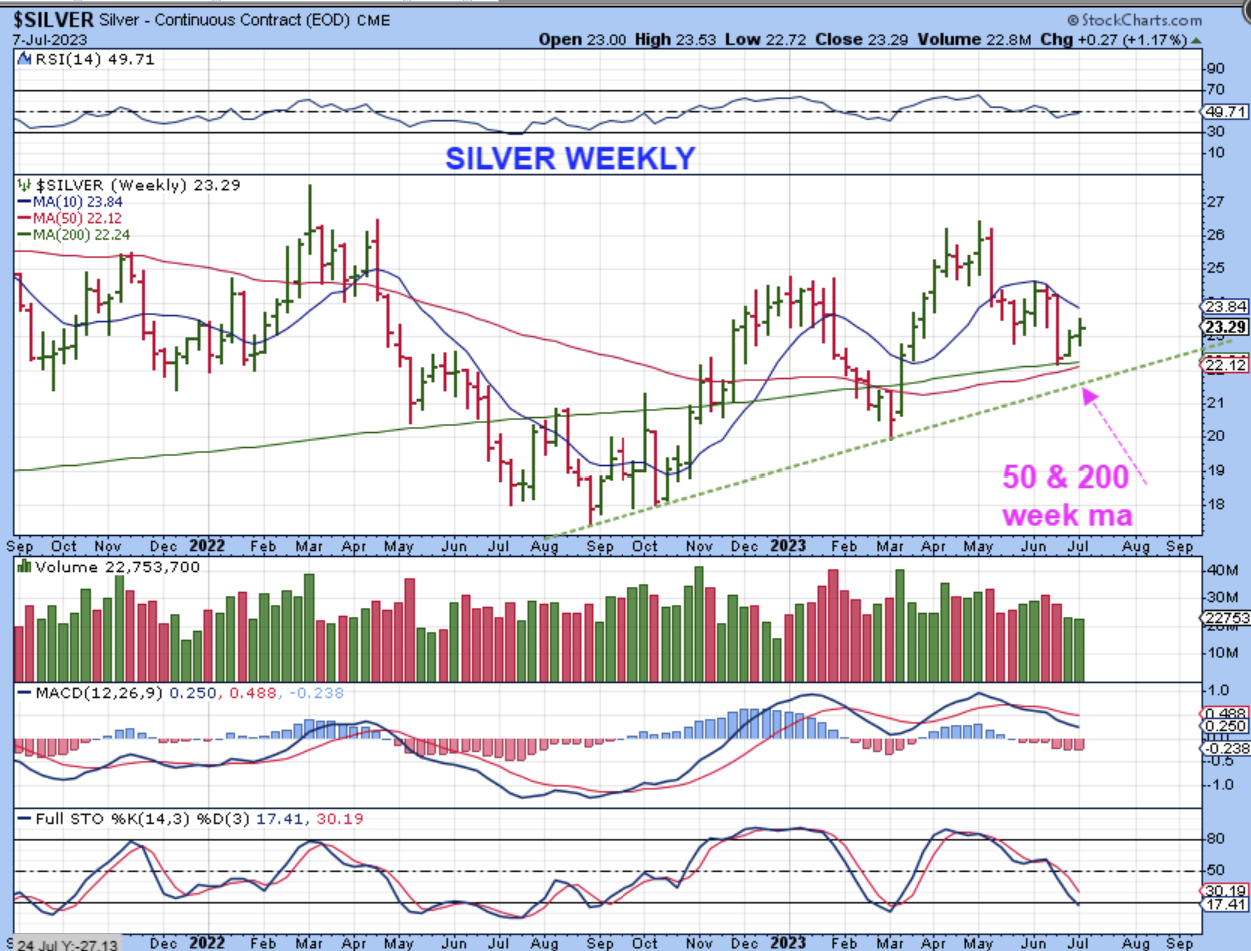
THE SILVER WEEKLY tagged the 200 week ma and bounced. That may be all we need for downside price action, but this does also give indication that it could go even lower and still be fine. It is just now reaching oversold and that lower trend line could get tagged. That said, If the USD breaks down, this should break higher.
.
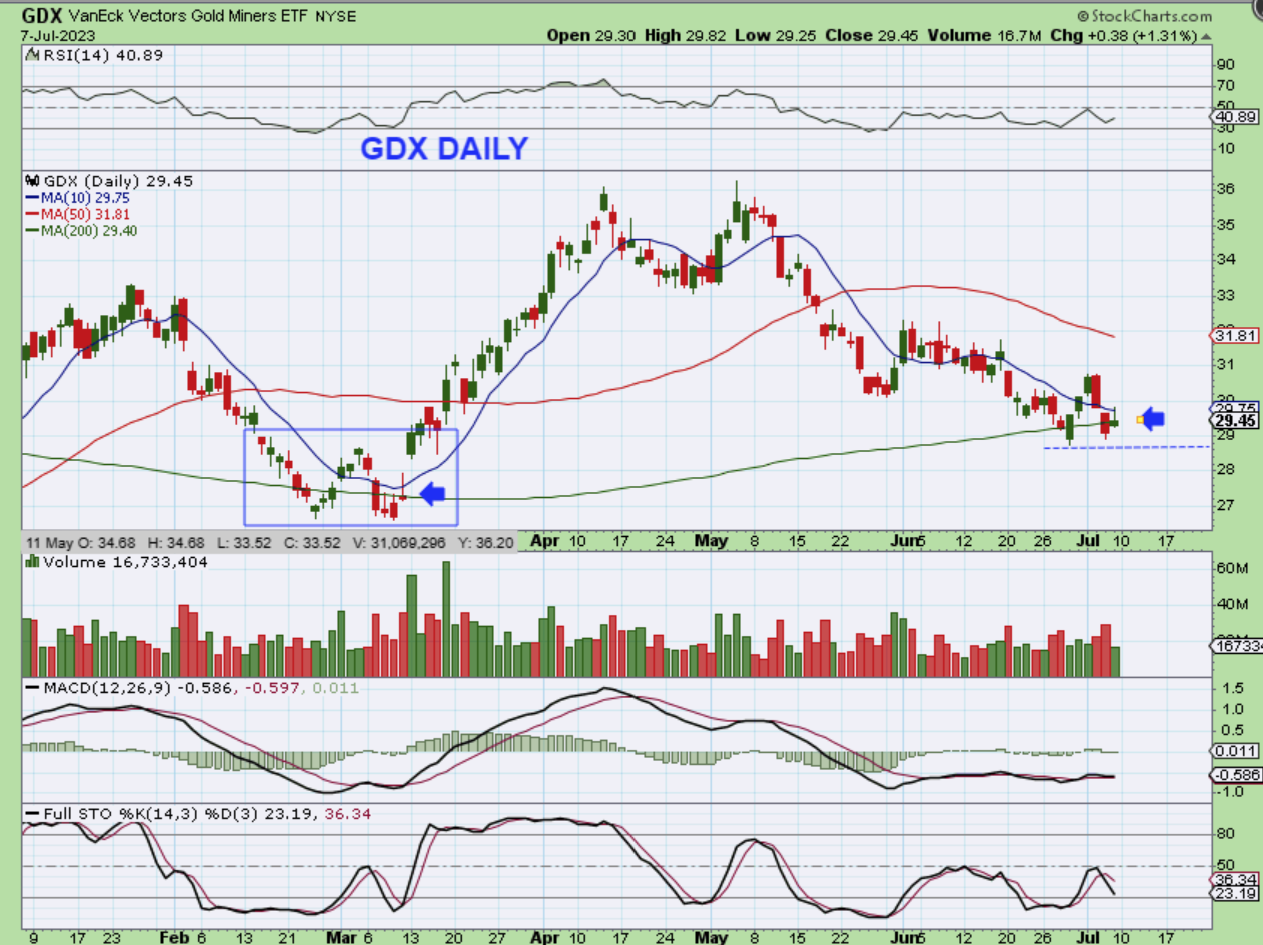
GDX DAILY –
1. This Pop and Drop and dance around the 200sma does look a little similar to the lows in March.
2. The USD had a clear sell off on Friday, so a pop & drop day in Miners is a bit of a bummer. I wish we had a surge higher, but…
3. We still need to just keep an eye on things here, because I’m sure that we will see the Miners take off if the USD breaks down further next week.
4. The good news: We are at the very lows of the sell off, so you haven’t missed a thing 🙂
.
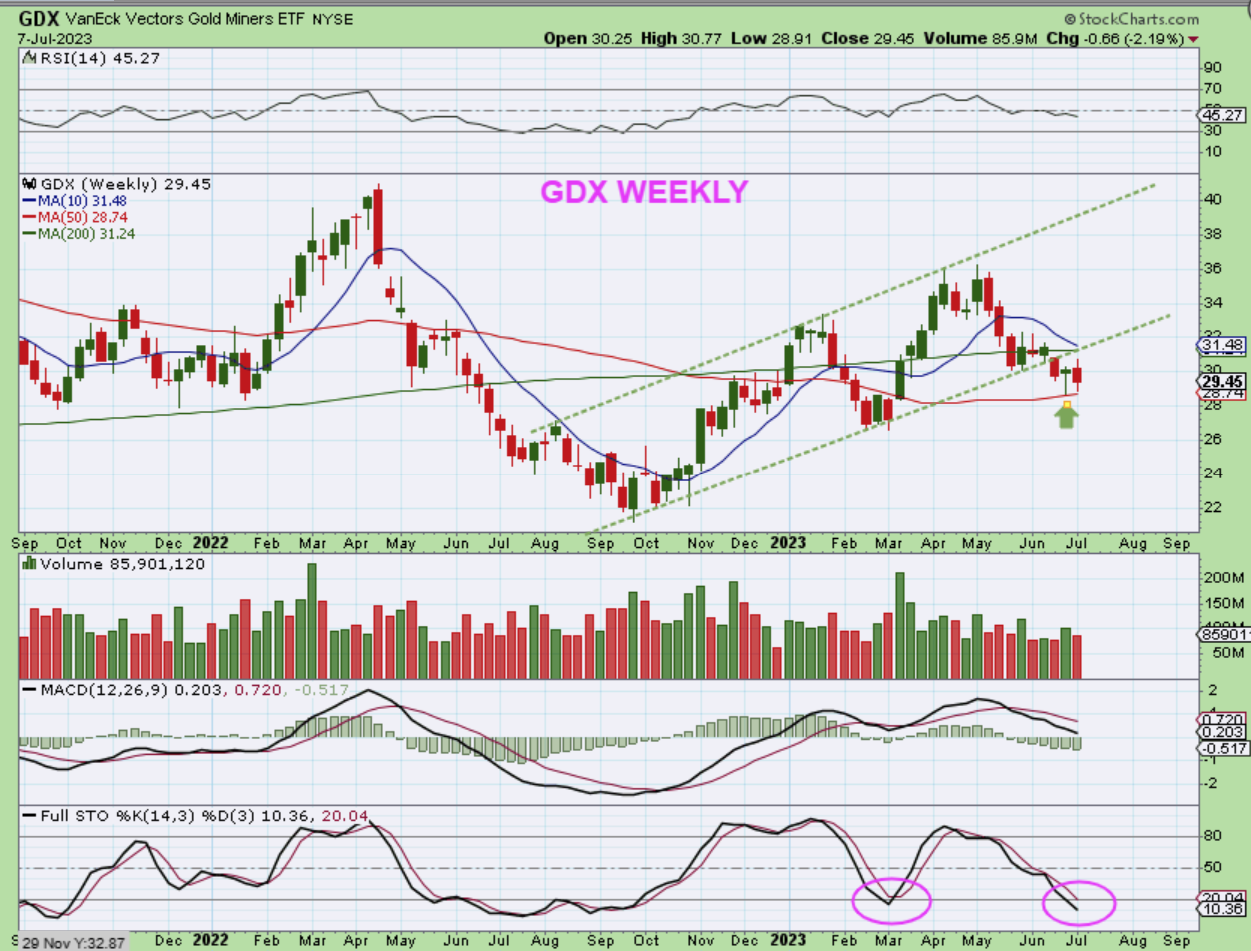
THE GDX WEEKLY found support at the 50 week ma again (2 weeks in a row). The GDX WEEKLY is now finally in the oversold area too.
.
Week after week we have had bullish market set ups in various sectors for 2023. The General Markets and Bitcoin have been on bullish runs lately, and even with pullbacks such as the one in Gold, it is still a bullish set up likely waiting for the USD to continue the downside move into a 3 yr cycle low. We have seen EV & Clean Energy start to move higher too, with NKLA, NIO, XPEV, SOLO, and others perking up quickly. So we do have bullish set ups to trade, find an entry on, continue to ride, or buy the dips in time during pullbacks
Next week, however, is important for the USD and that affects Gold, Silver, and The Miners! We’ll keep an eye on that and we’ll see how Gold reacts to what it does. I also want to include a few extra charts below.
.
Enjoy your weekend everyone!
.
~ALEX
.
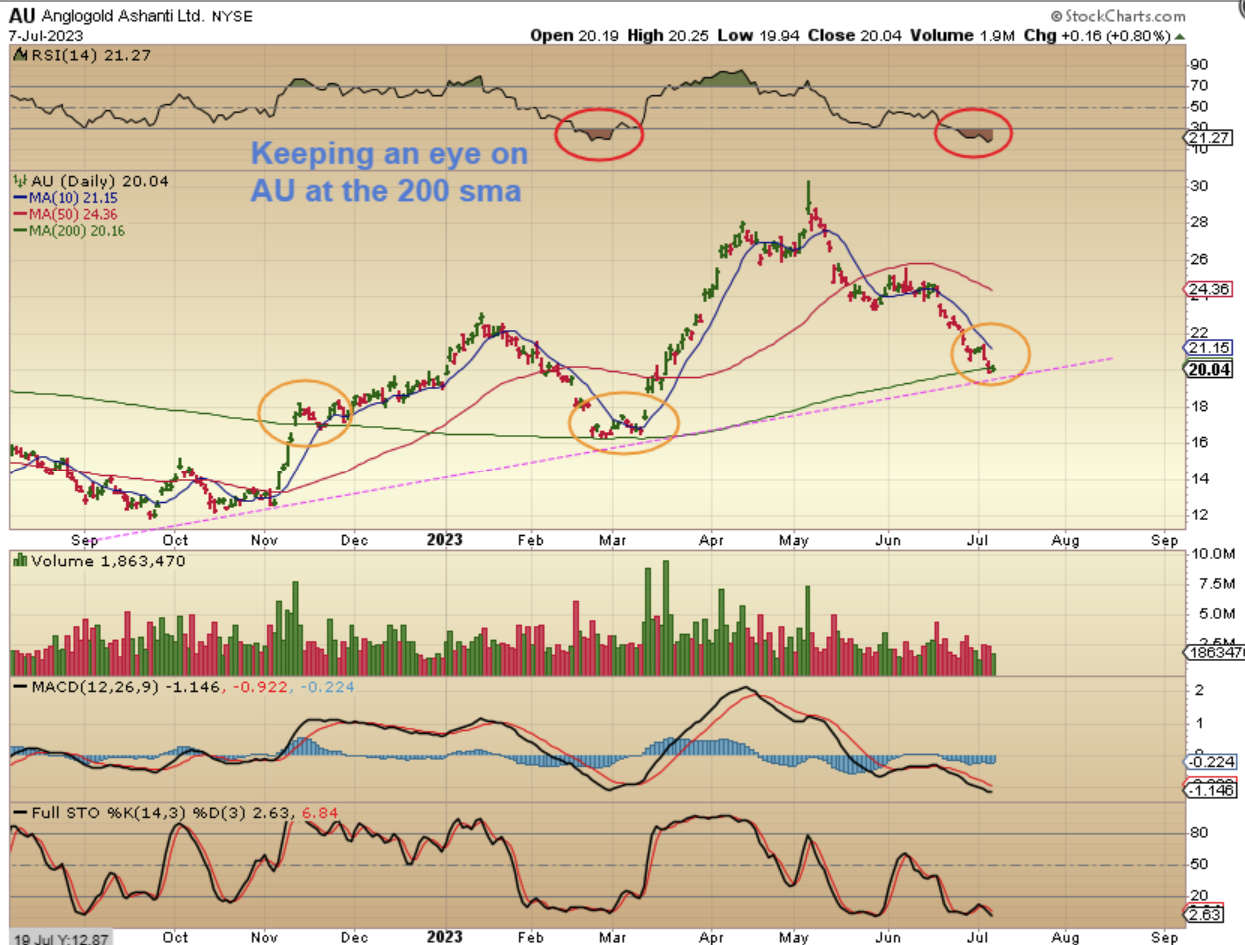
AU has had very strong rallies higher when Gold does, and now take a look at the pull back here.
1. The March sell off landed on the 200sma and the RSI was DEEP.
2. We see that now too. If gold starts to run, this should be a great buying opportunity.
.
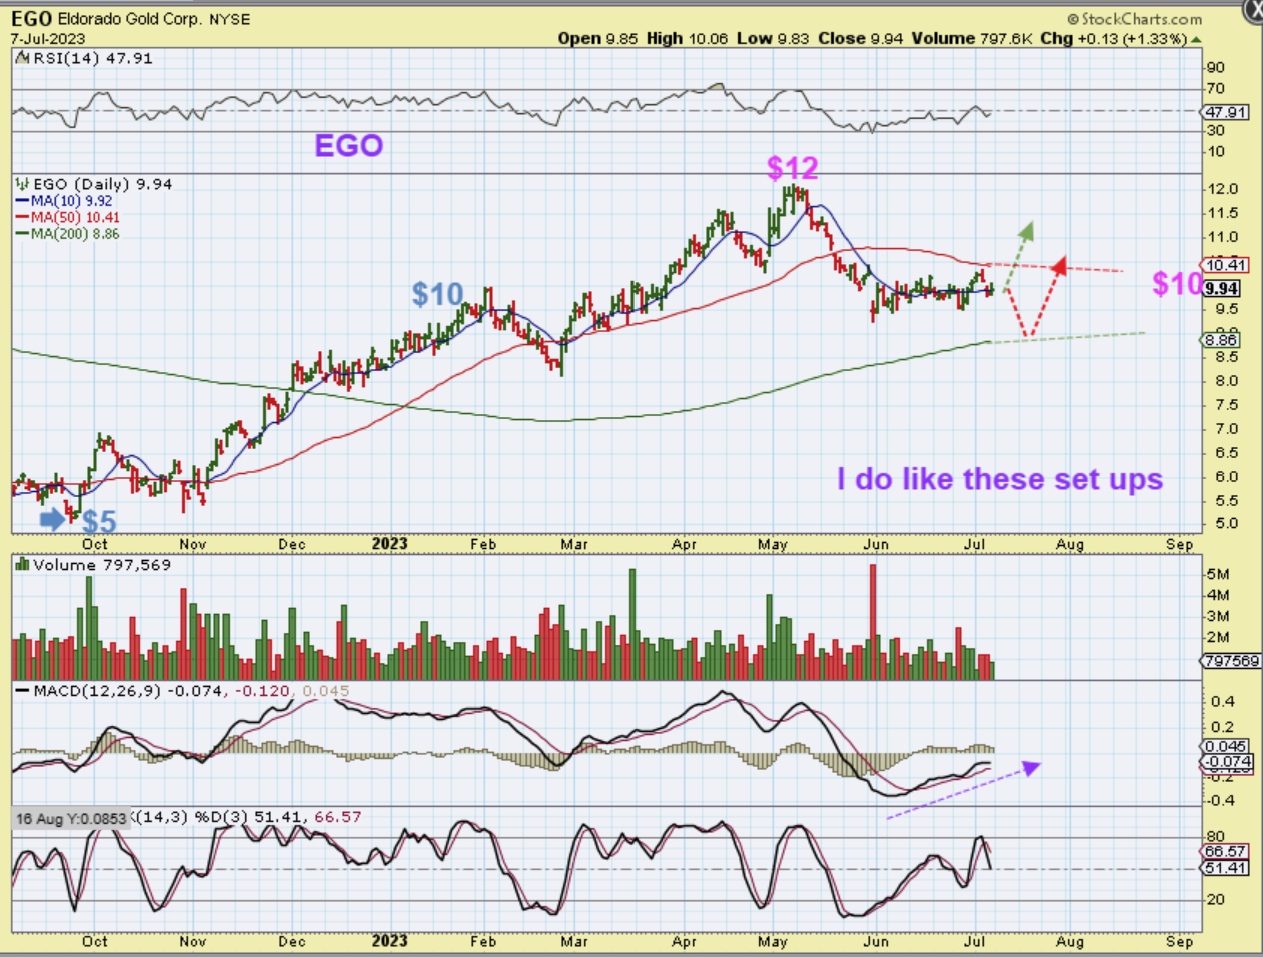
EGO could go either way right here, but what impresses me is that it ran from $5 to $12 and is only at $10. That is a $7 run and only a $2 pullback. This could go either way, higher or lower, likely depending on the USD, but this will be a good buy when the time comes.
.
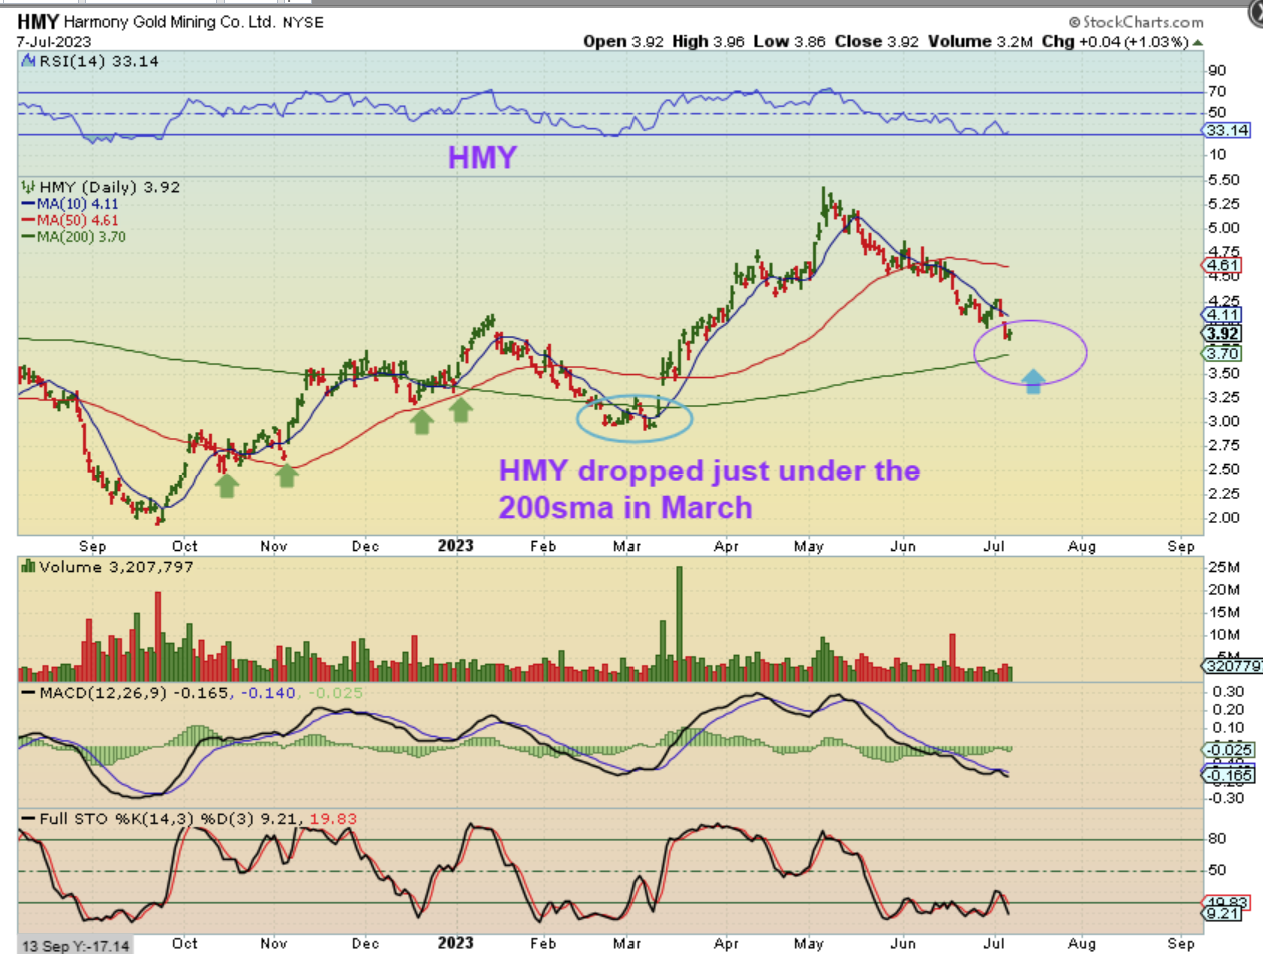
HMY – To be honest, I’ve been expecting a little more selling in HMY & DRD. I expected a tag of the 200sma, but this may be close enough to the 200sma if Gold takes off higher. I’ve been watching & waiting to see how it acts when it gets in that 200sma area. If the USD breaks down and Gold takes off, it just may not get there. HMY is quite oversold, and it will be an excellent buy along with DRD.
.
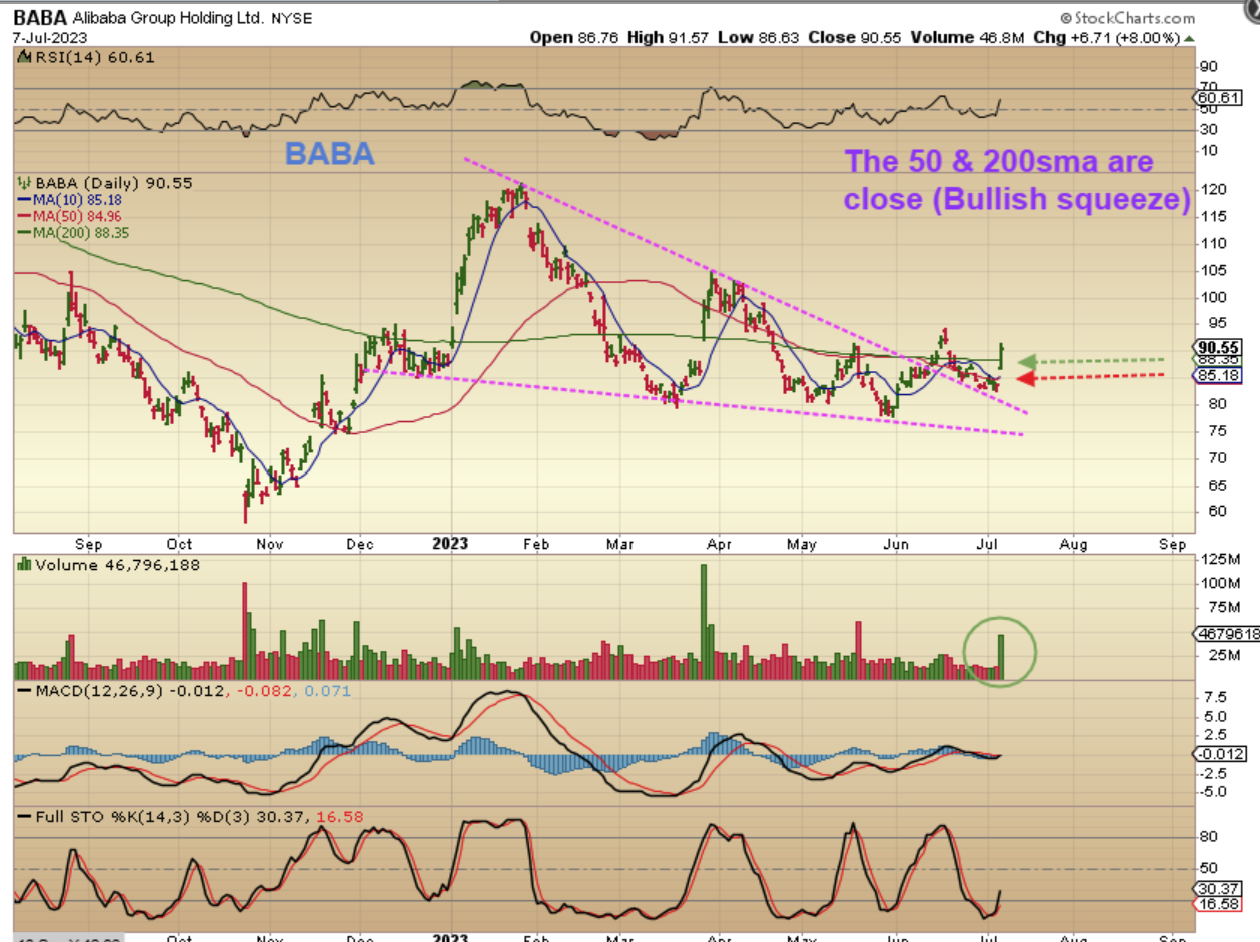
BABA – As mentioned in prior reports when I discussed that MSFT, AMZN, GOOG, etc recovered nicely, even reaching prior highs. I said others look to be setting up too. BABA broke a downtrend, rode down it in June, and Popped above the 50sma on Friday. This may be starting to trend back up to that $120 area.
.
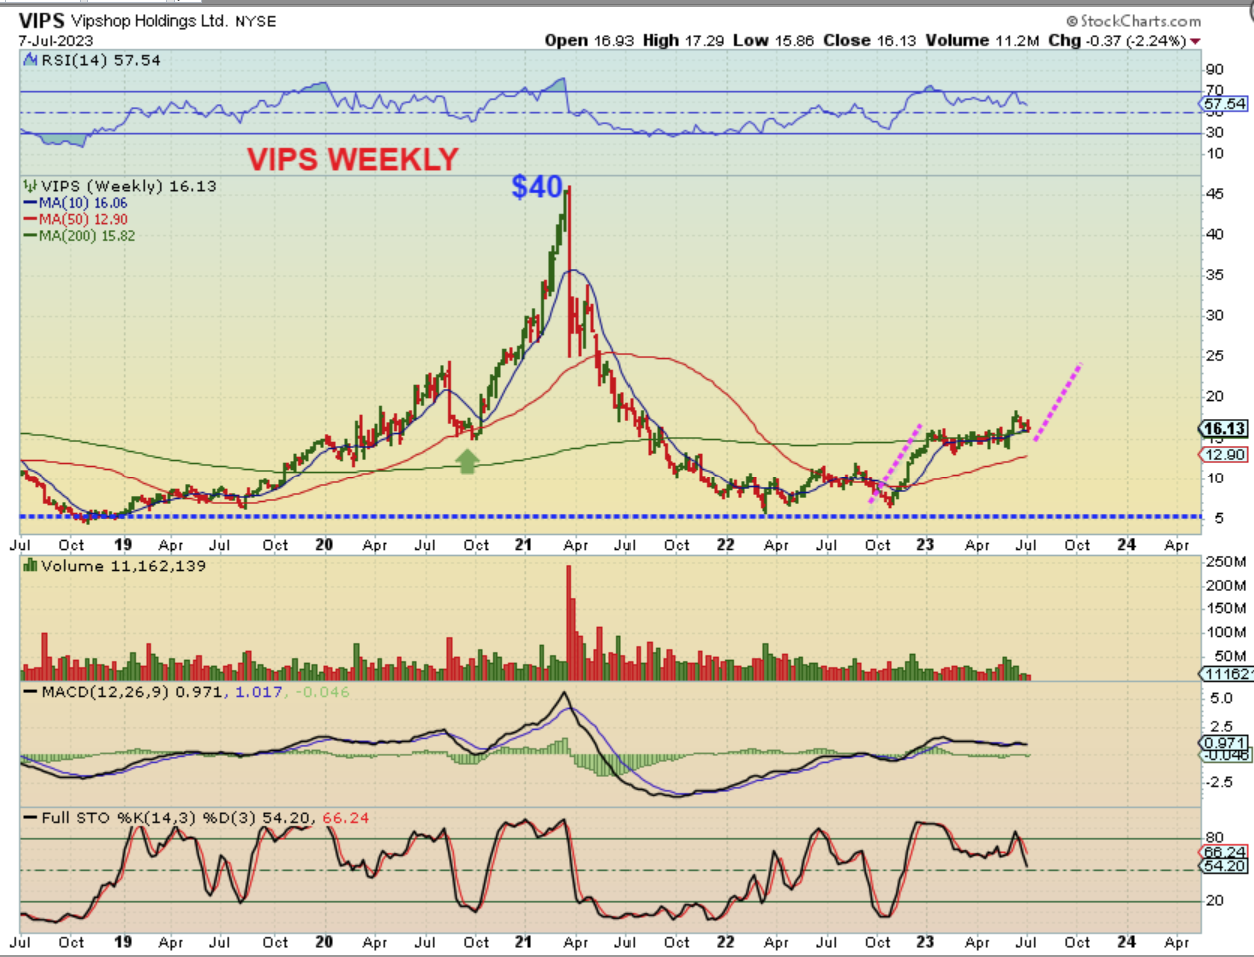
I actually rode VIPS on & off in the late part of 2020 rally and have had it in some reports back then. Well, it sold off hard in the bear market selling.
.
VIPS WEEKLY – Vips then double bottomed in 2022 in the $7 area. In 2023 it has been churning sideways, but it looks ready for another run. I think you’ll be surprised when we zoom in…
.
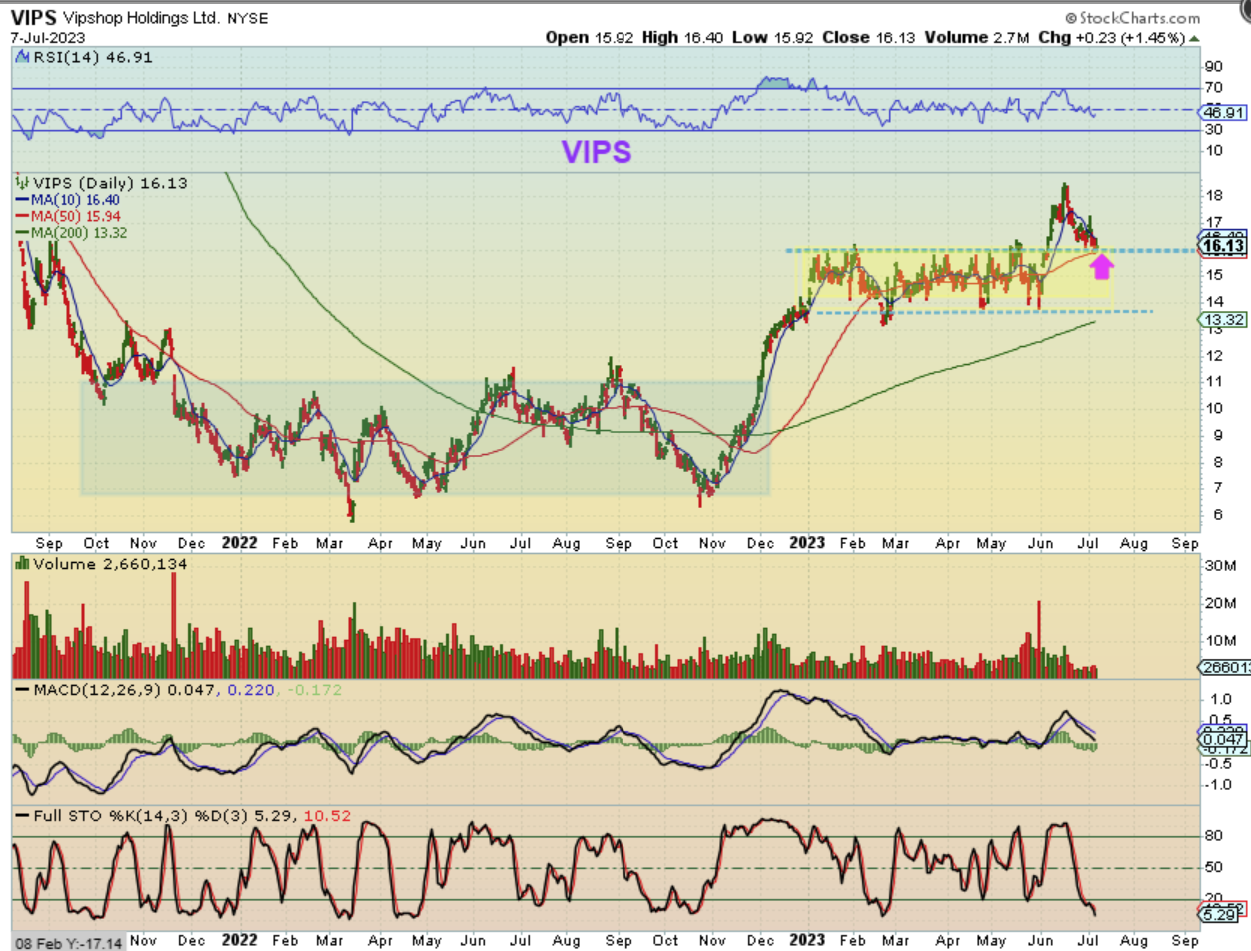
VIPS DAILY – Are you Surprised to see $7 to $18? I was! Well, you can see that VIPS chopped sideways for much of 2023 after that explosive run out of the lows after the ICL in Oct 2022. It chopped from $14 to $16 in most of 2023.
1. Vips posted earnings in late May, and that is when it broke out from the consolidation box.
2. It then ran from $14 to $18+, and is now pulling back to the 50sma ($16).
3. A rally after earnings and a pullback is bullish in my book.
I have been pointing out Crypto stocks for quite a while now and many have doubled again! What a fast amazing run so far.
.
They are on fire, and many have those running corrections that I pointed out a while back. Those remain Bullish, but they are getting a bit extended here too. We’ll buy those pull backs later, but for now, it may also be time to focus more on Gold & Silver Miners! Stay tuned!
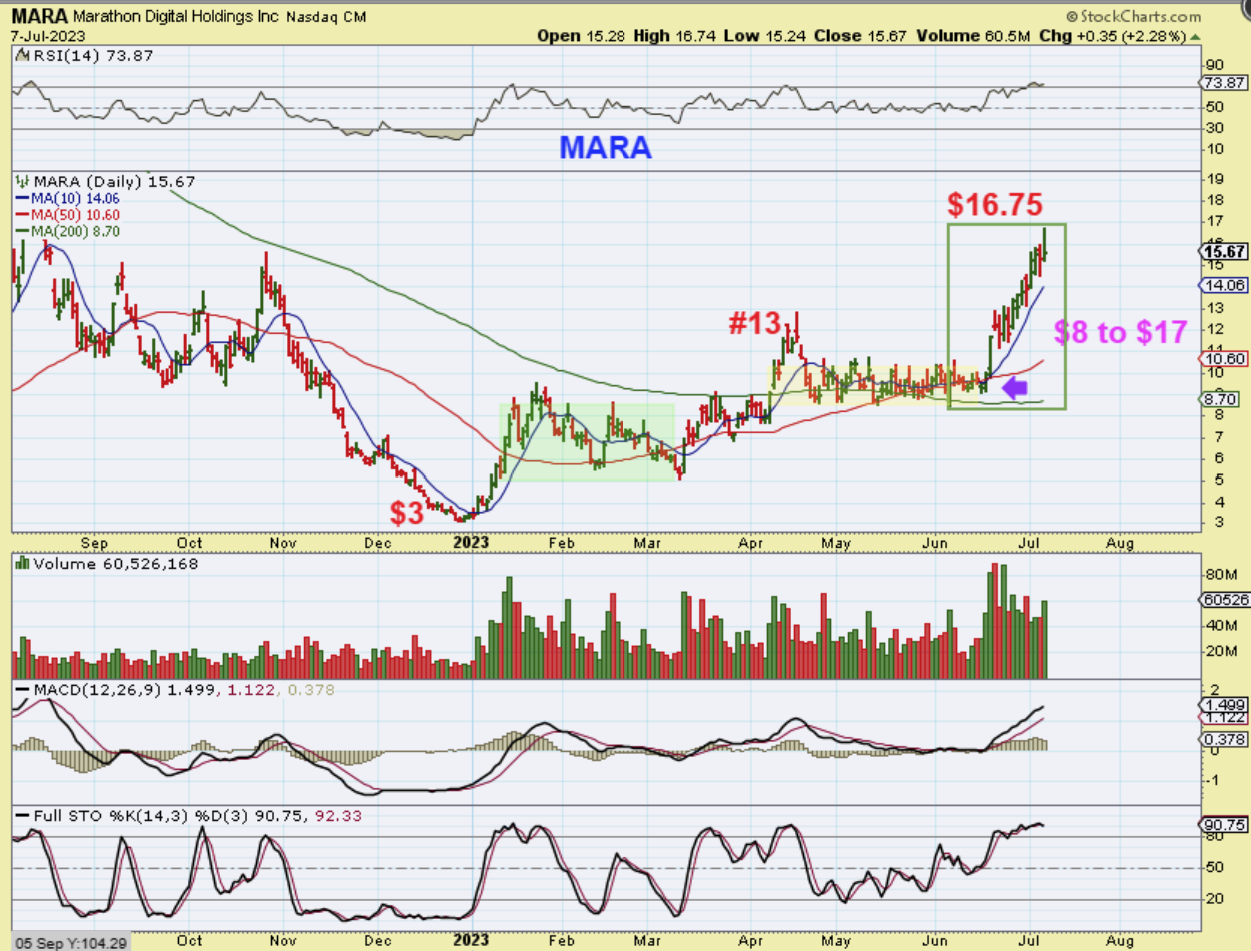
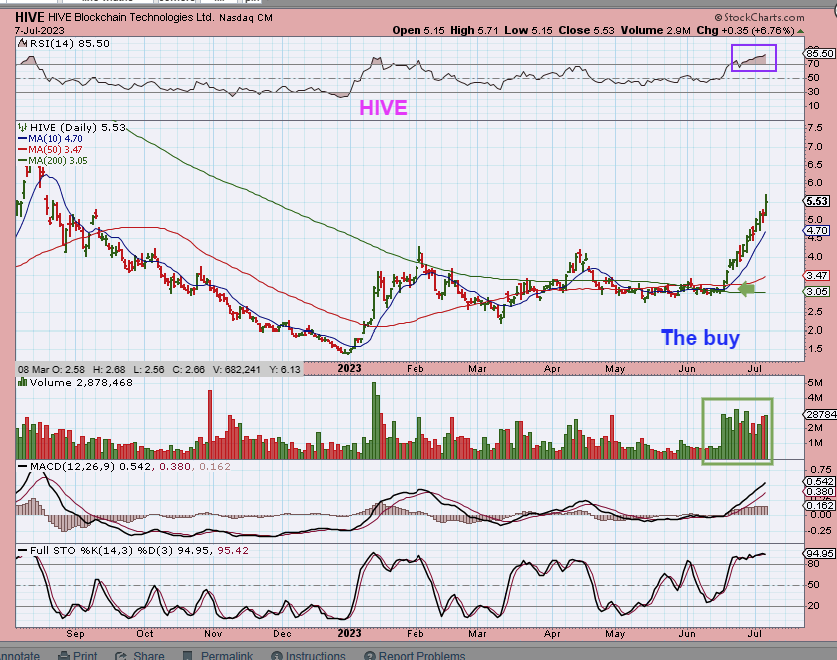
HIVE : $3 to $6 roughly
MARA: Roughly $8 to $17. Many of these have just about doubled in 2-3 weeks time after breaking from those box consolidations. We will be buying the next real dip and consolidation too. Bitcoin has a major low in place and I expect a long run (with decent pullbacks) going forward.