Wednesday June 7th
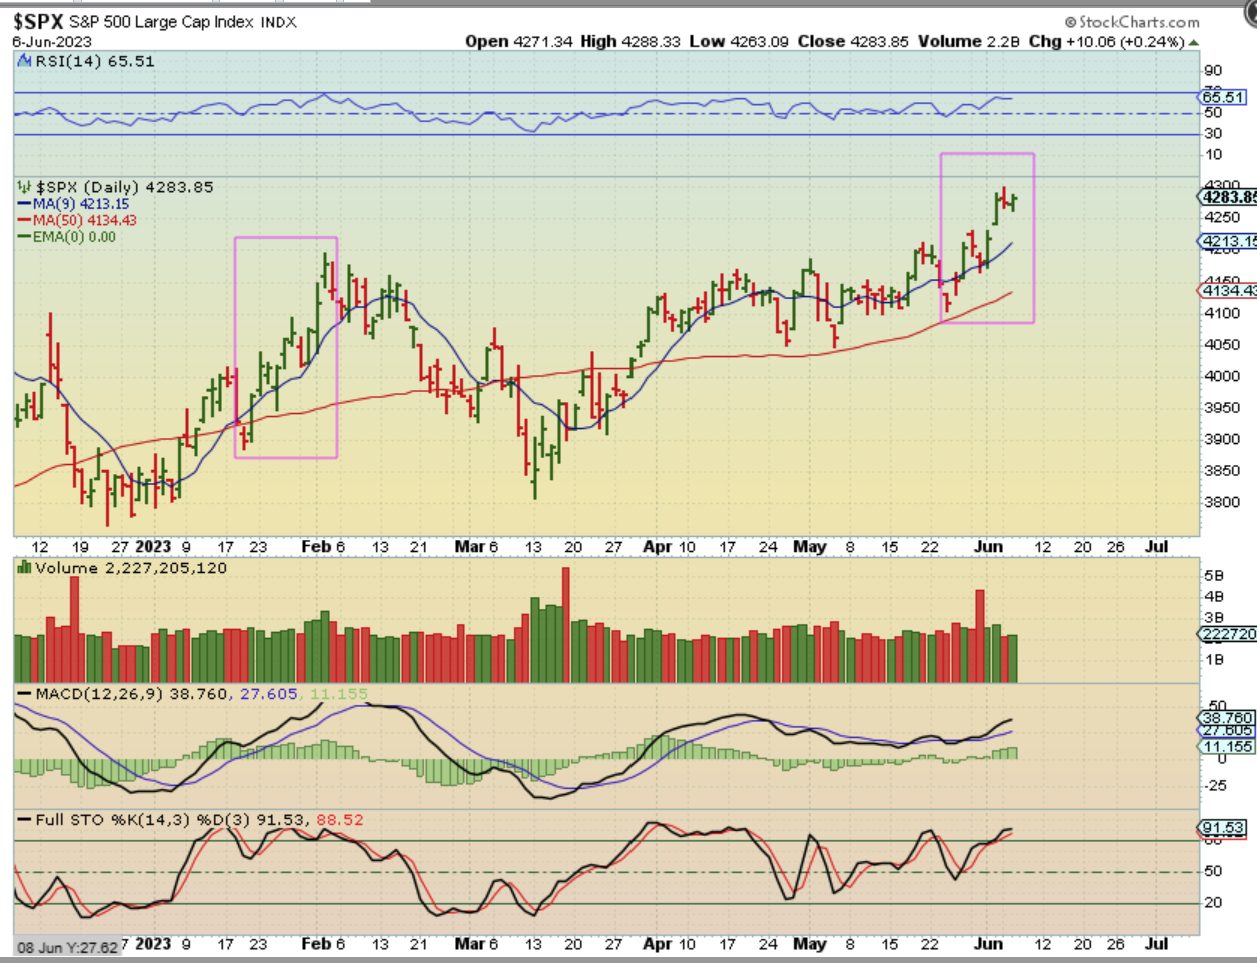
SPX – If we are considering the daily cycle timing, we could begin to dip down at any time and start the drop into a dcl, but right now the markets are finding buyers on each dip. We are seeing 1 and 2 day dips and that is it. Tuesday started lower and reversed higher again. We do not have any strong data on Wednesday or Friday, but Thursday has the ‘Initial jobless Claims’ at 8:30. Lately it has been causing the markets to push higher, but it may trigger some selling this time. At this point stops at the 10 sma should be fine.
FROM YESTERDAY:
.
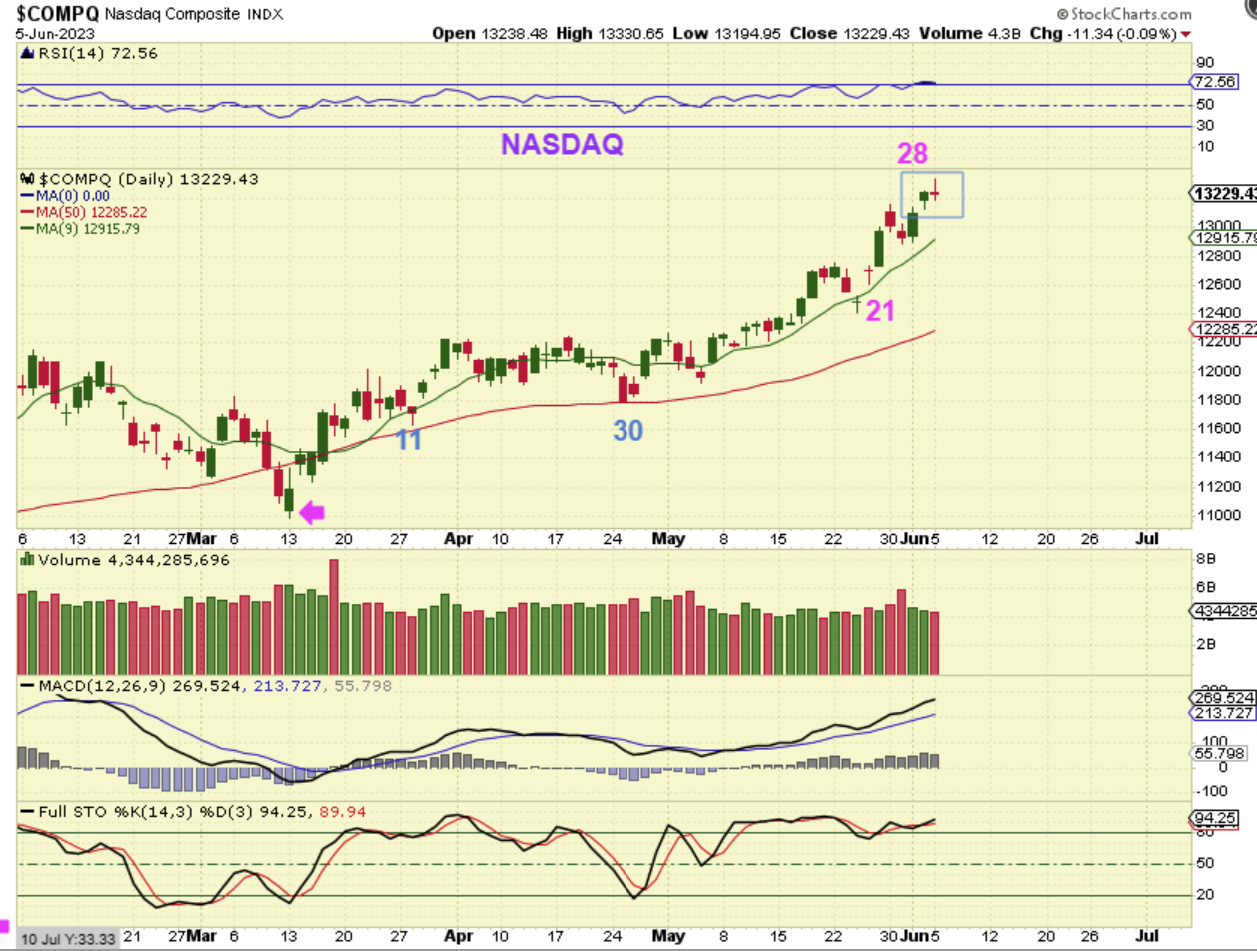
The NASDAQ looks quite different from the SPX. It ramped up along the 9sma, but the counts are the same as the SPX. We have 2 reversal candles at the top here, so I still think that we should expect a dip.
.
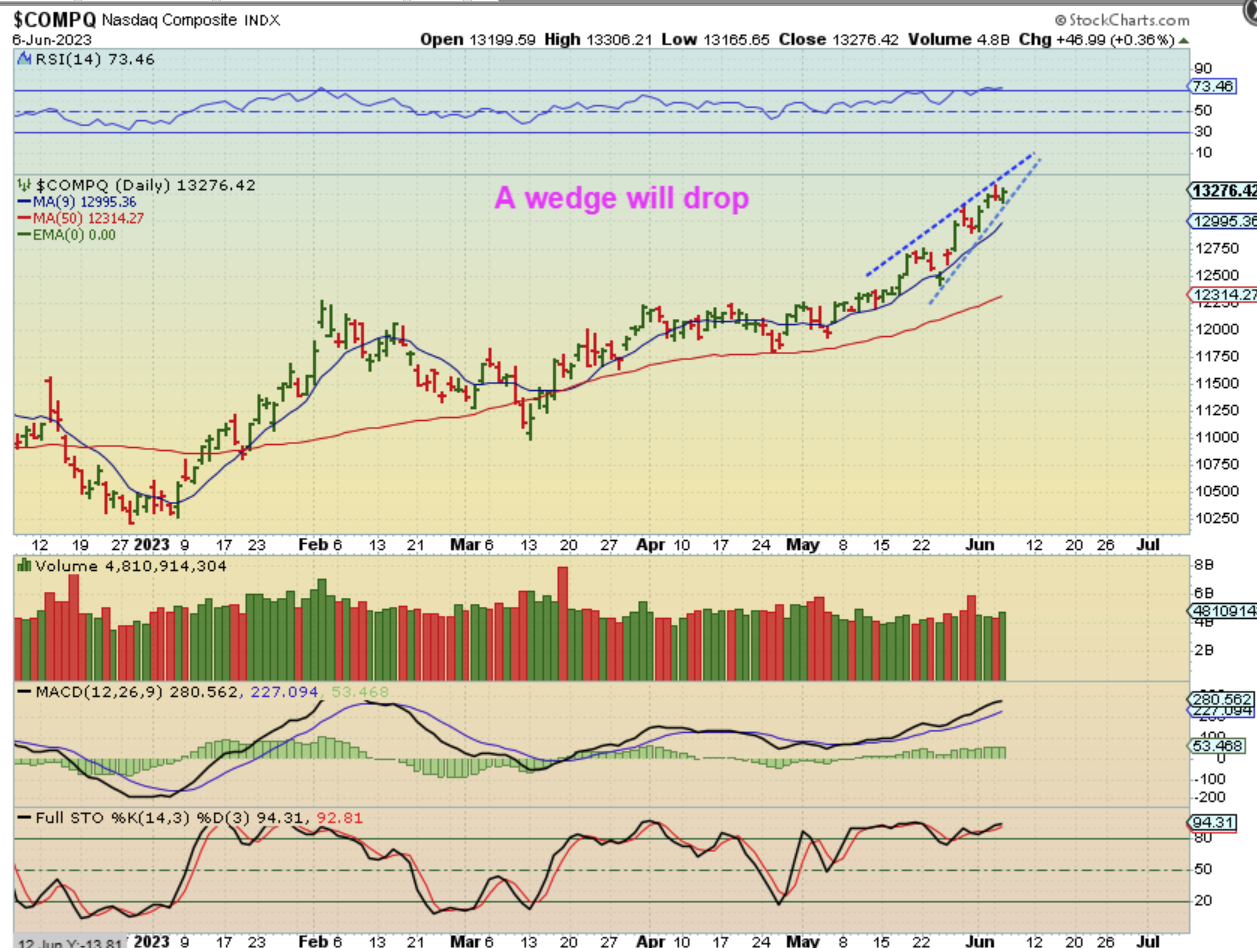
The NASDAQ actually dropped at the open and then found buyers on Tuesday too. There is a little room to run higher in this bear wedge, but these usually break down sooner than later, especially late in a daily cycle count.
.
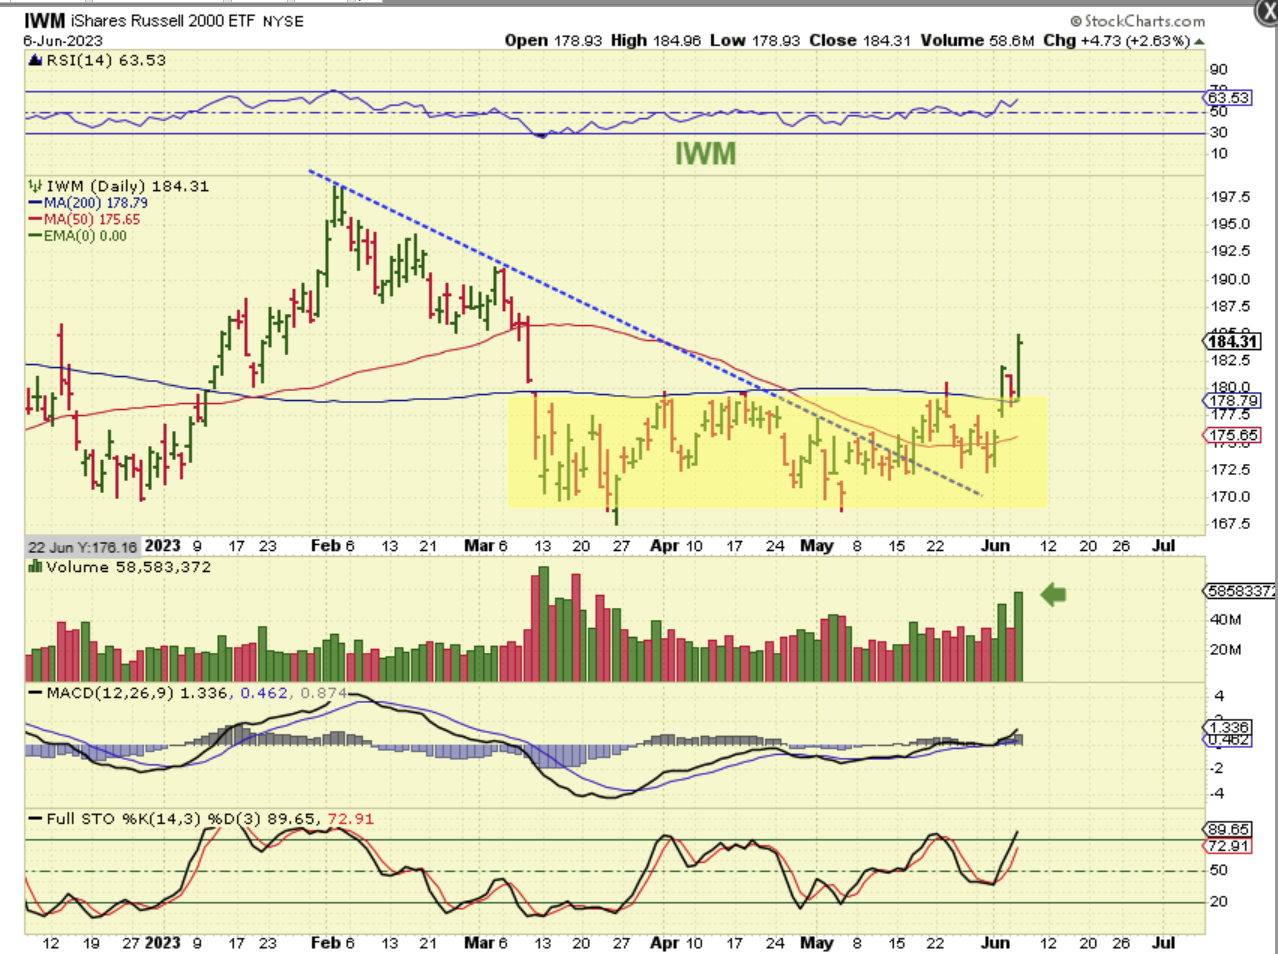
I also discussed that while some sectors were running strong (Nasdaq & Soxx for example), others like The IWM were just breaking out of the consolidation lows or ‘bases’. Many Small caps have this same basing pattern and it feels like we could see ‘sector rotation’. The EV, Energy stocks perked up yesterday for example and have been forming bases…
.
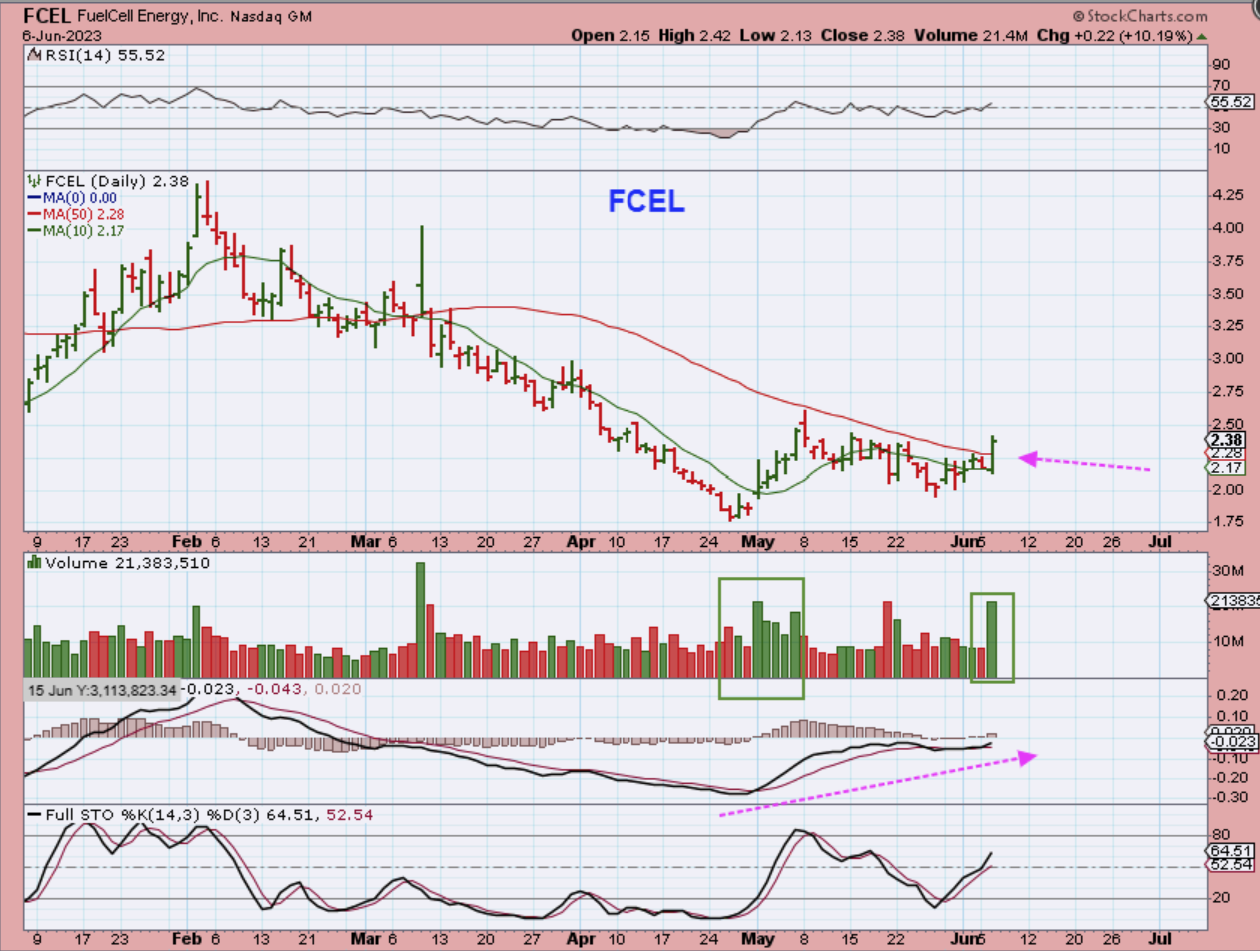
The EV, Energy stocks perked up yesterday for example and have been forming small bases. See charts of PLUG, FCEL, SOLO, QS, OPTT, CLNE, etc. These all look ready to run higher, so I’ll discuss this a bit more at the end of the report.
.
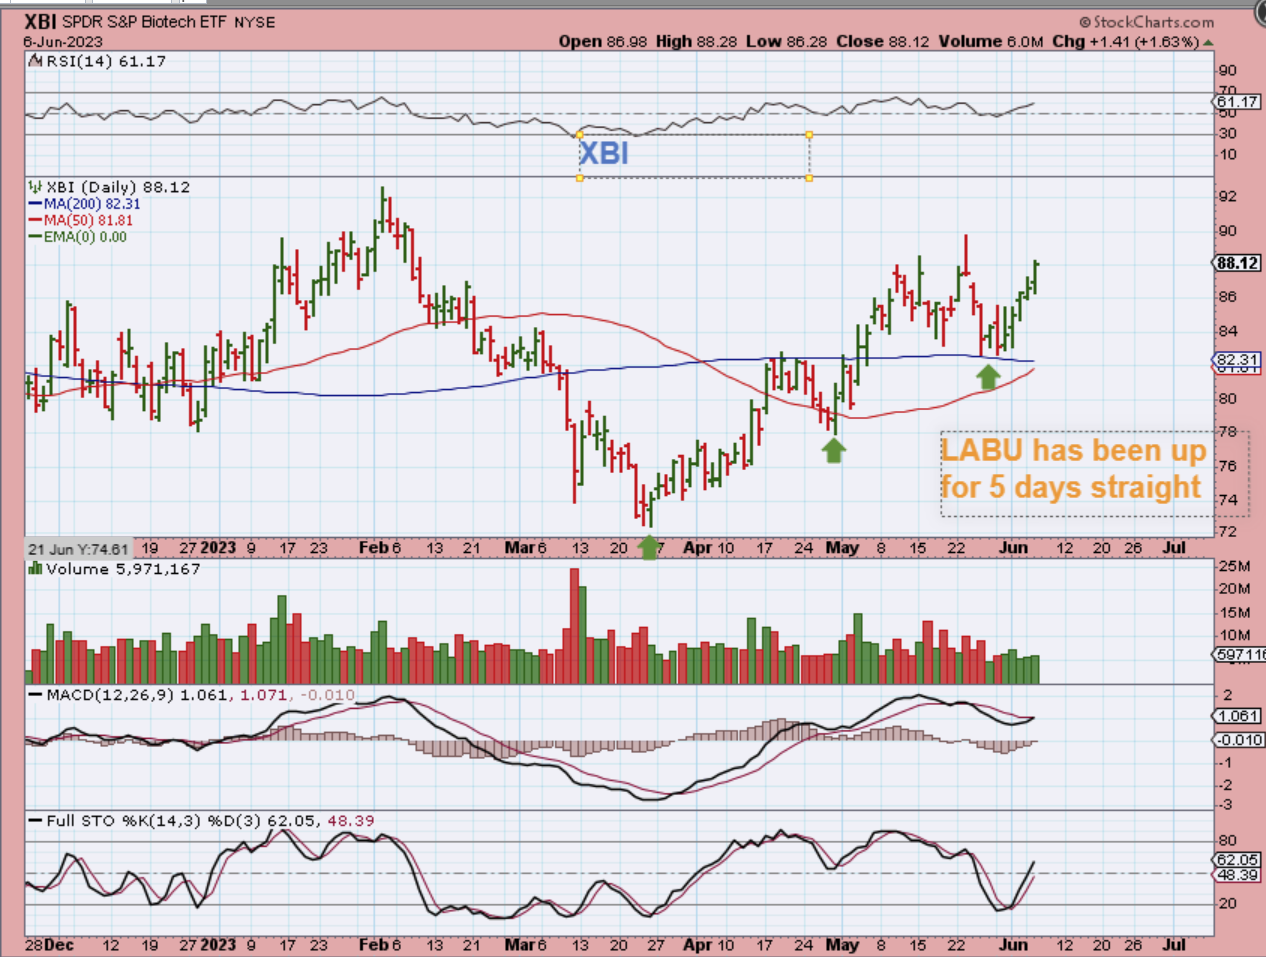
XBI ( LABU) -I also mentioned that Biotech does seem to have given us a full ICL drop in March and now we are seeing a series of higher lows. The XBI bounced off of the 200 sma and was a buy for LABU.
,
From yesterday:
.
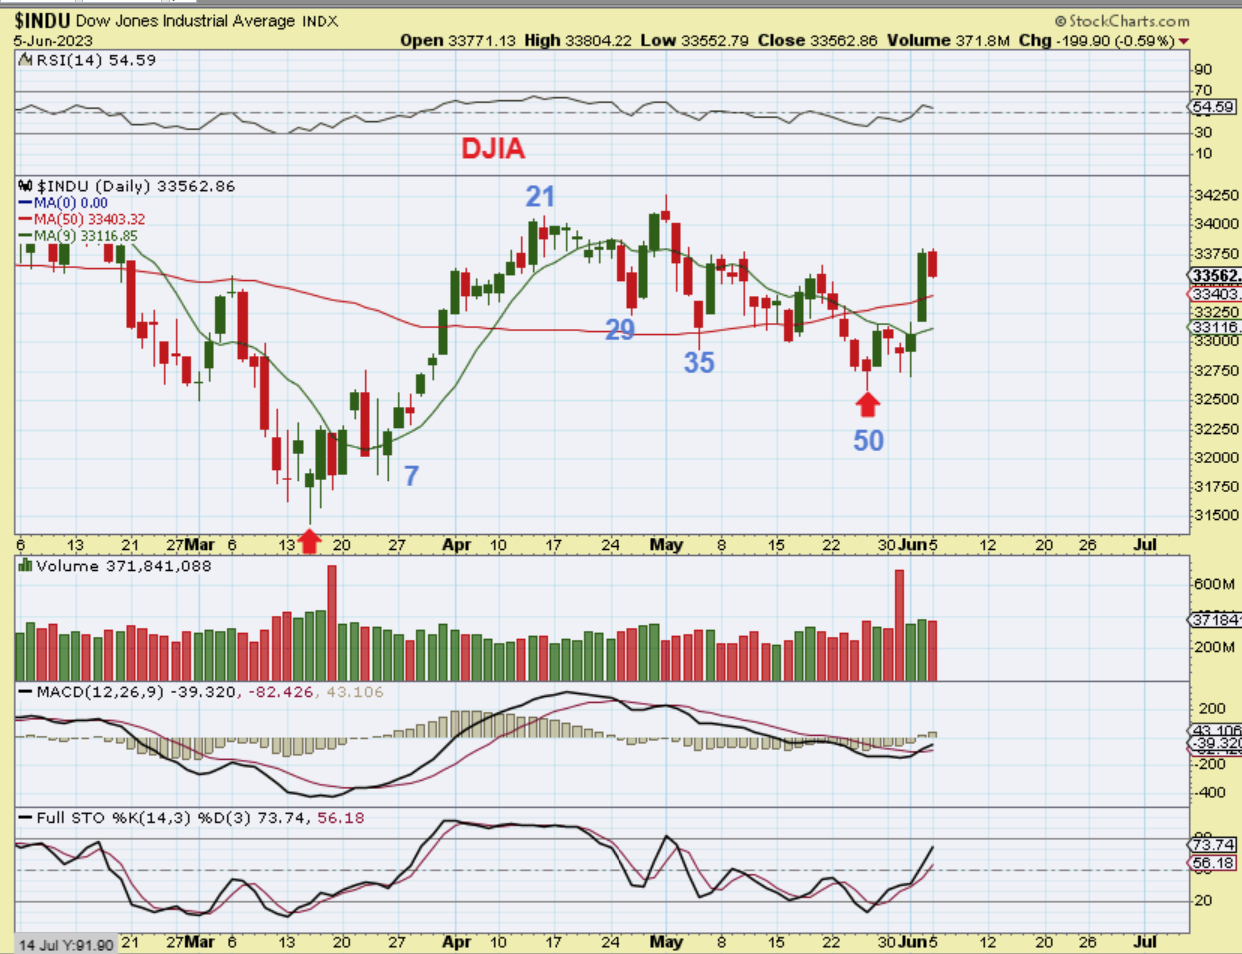
Now when we take a look at The DJIA, we see another very different set up.
This actually shows us a complete 50 day daily cycle into a dcl, and it looks quite clear. This would actually be day 6 and it had a strong rally through the 50sma on Fridays unemployment report. The MACD has crossed too, so it seems like the General Markets are going to pull back, but the DJIA already bottomed. Interesting.
,
So the General Markets seem to be a bit mixed, with all sectors at different stages of a bullish move. We have not seen any really good price action in the EV, Clean Energy sector yet, but the set up is a bullish one and some trades there could pay off. Check out the charts of the ones that I mentioned.
.
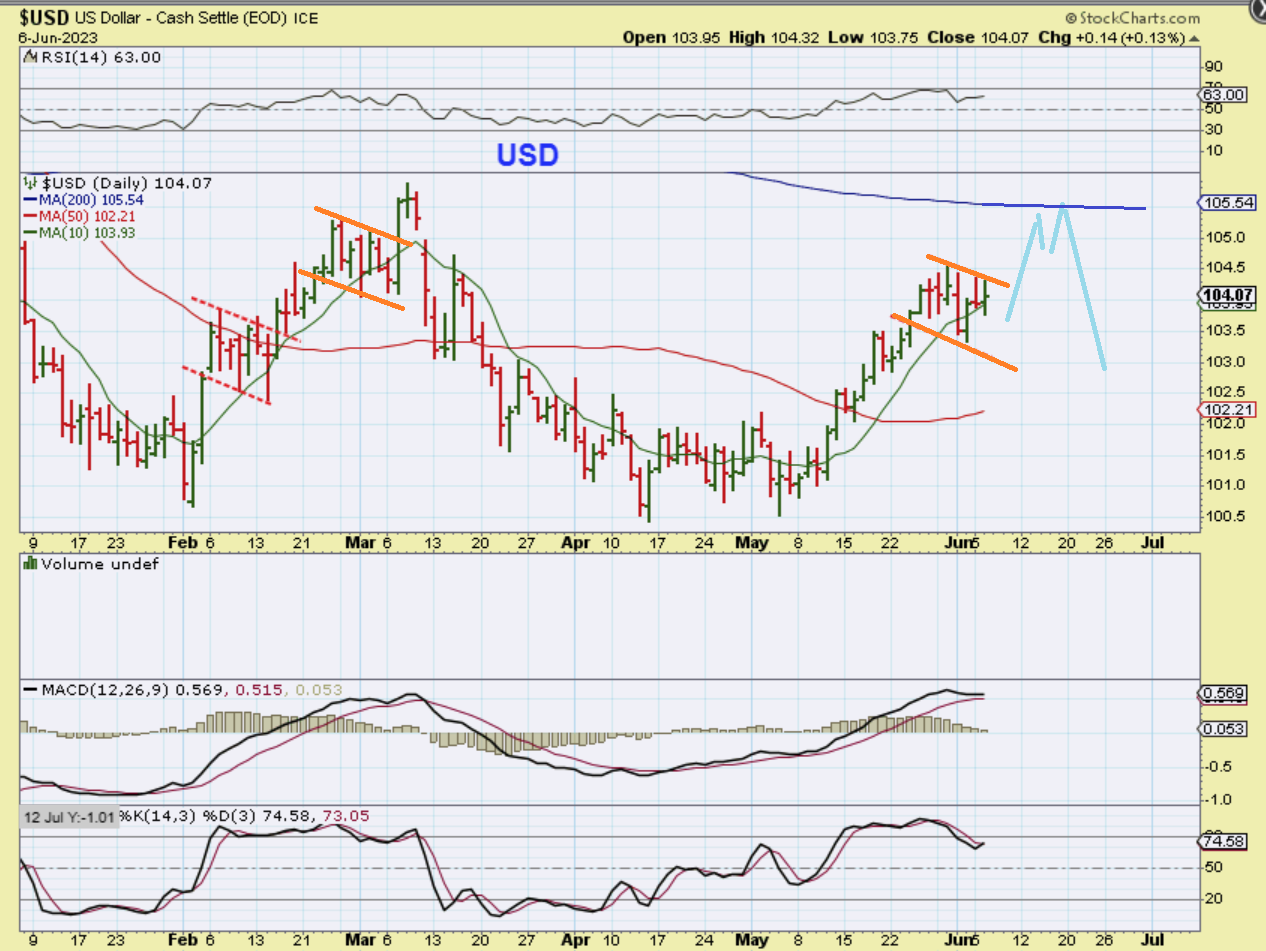
THE USD was ramping straight up in May and then became due for a dcl. At this point we are getting more of a consolidation and it doesn’t look like a dcl dip yet. I don’t know exactly how this will play out, but I drew a run to the 200sma and then a drop. Notice that the USD was Green yesterday…
.
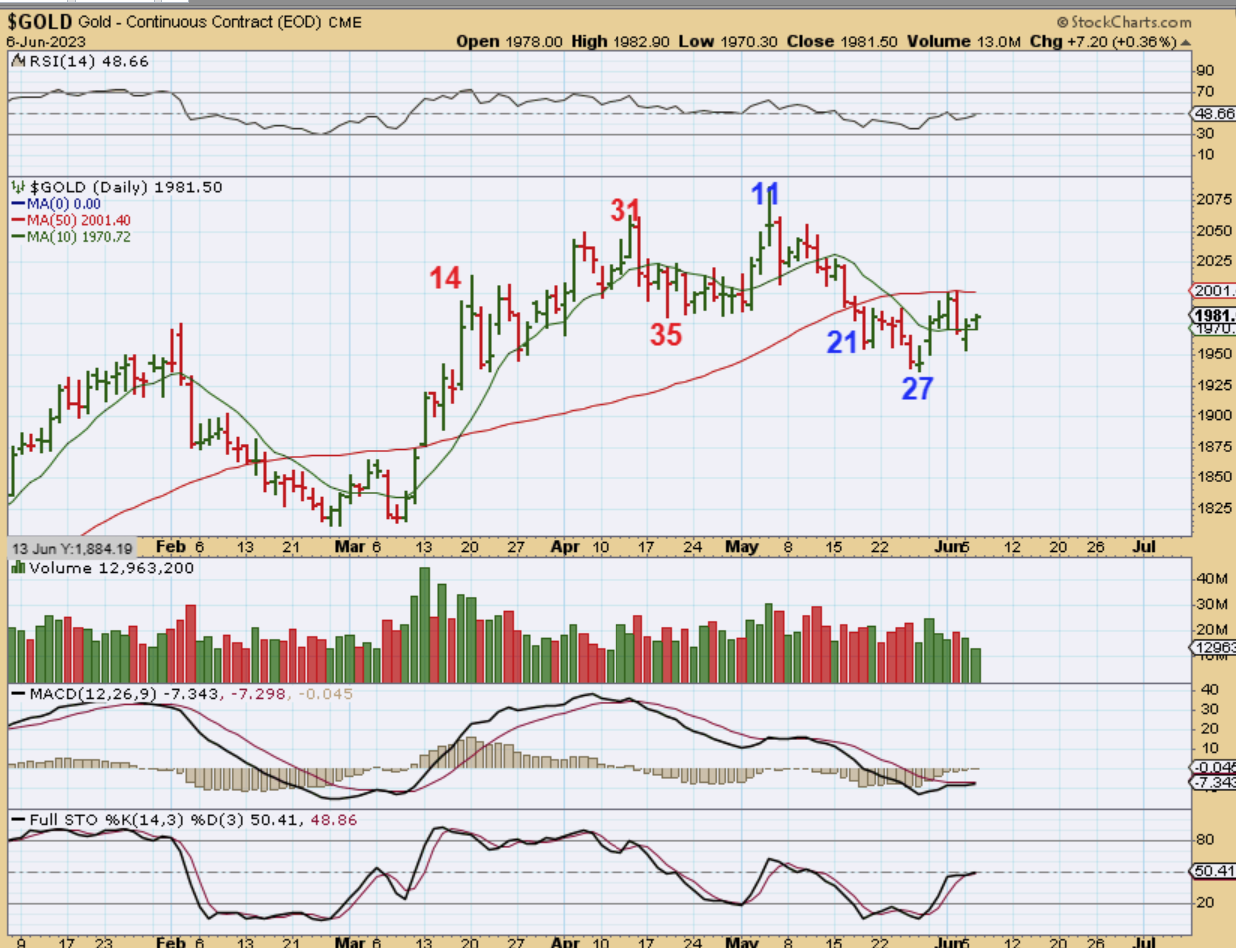
GOLD was also green yesterday. It may be possible that Gold loses the inverse relationship that we have been seeing with the USD. Yesterday I discussed that this looks like 2 daily cycles, but what if Gold really has 1 massive daily cycle with day 62 as a low? It would be right translated and could break out over the 50sma. Then I said…
.
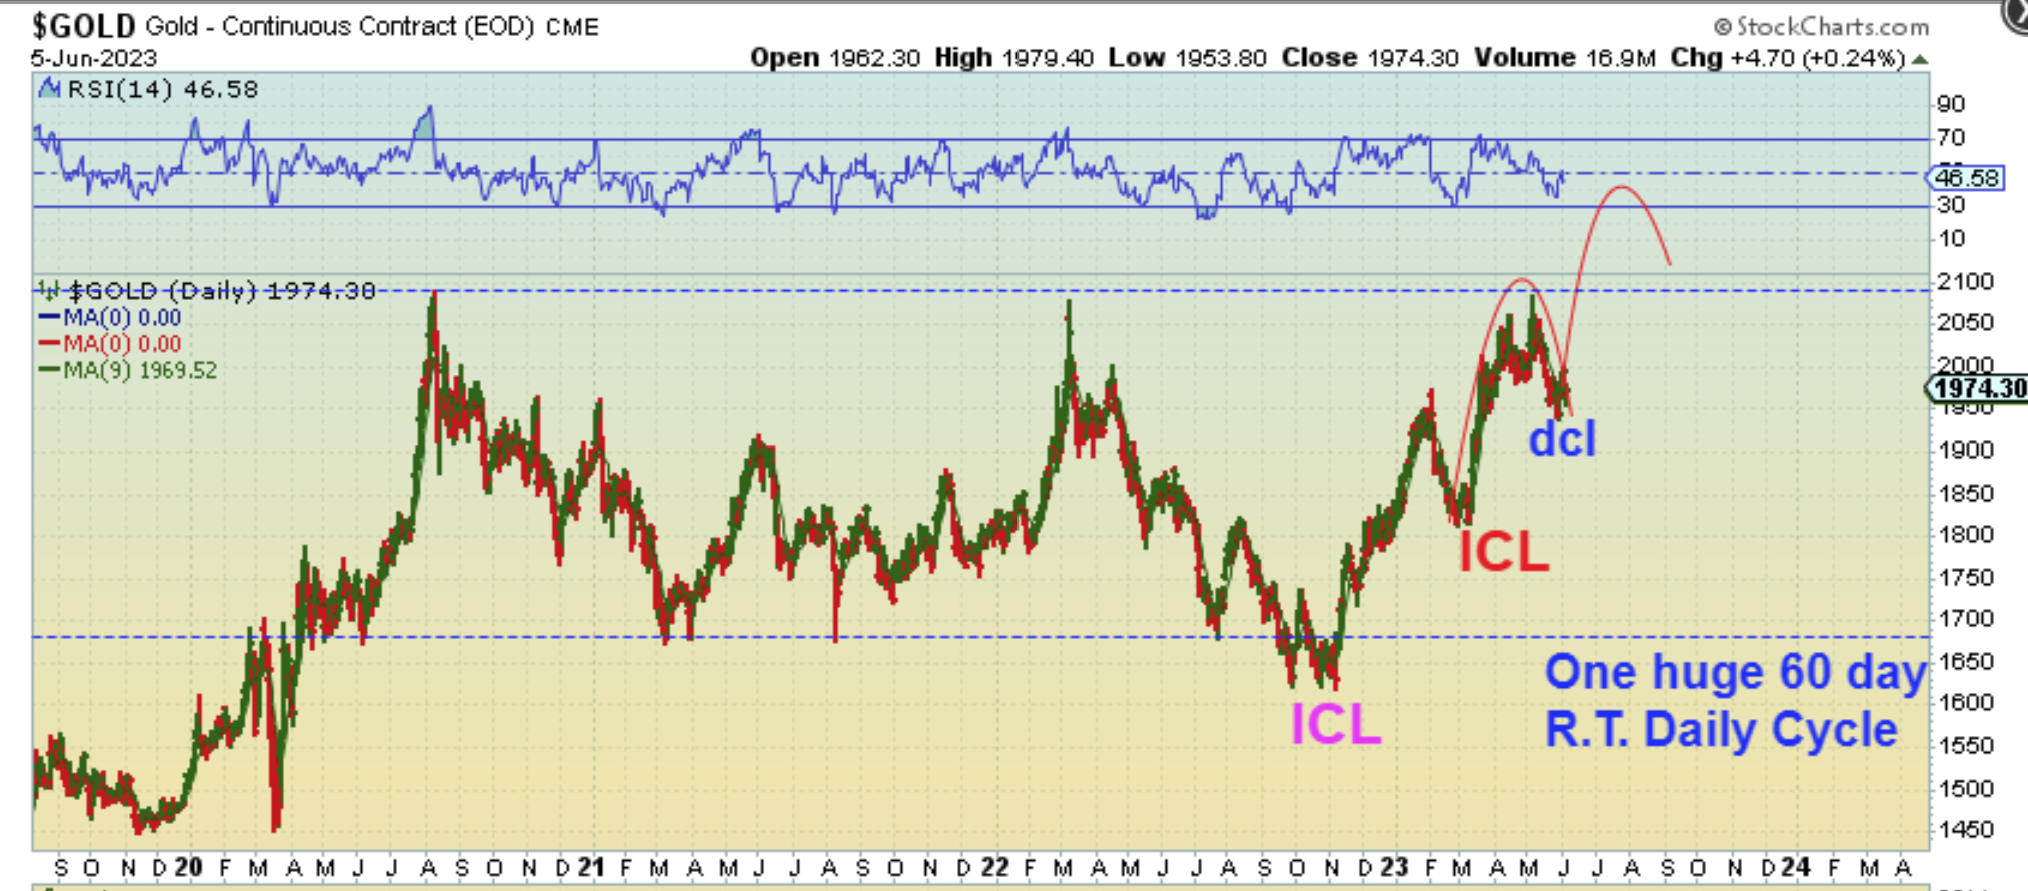
What if Gold closed back above the 50sma soon? Could this be all one daily cycle (62 days long?). After that Bank failure rally, I wouldn’t rule anything out. It would look like this and this dip was just preparing it for that breakout attempt. This is just something to keep in mind, since the Fed Rate hikes, Banks failing, etc did disrupt the ICL drop in march.
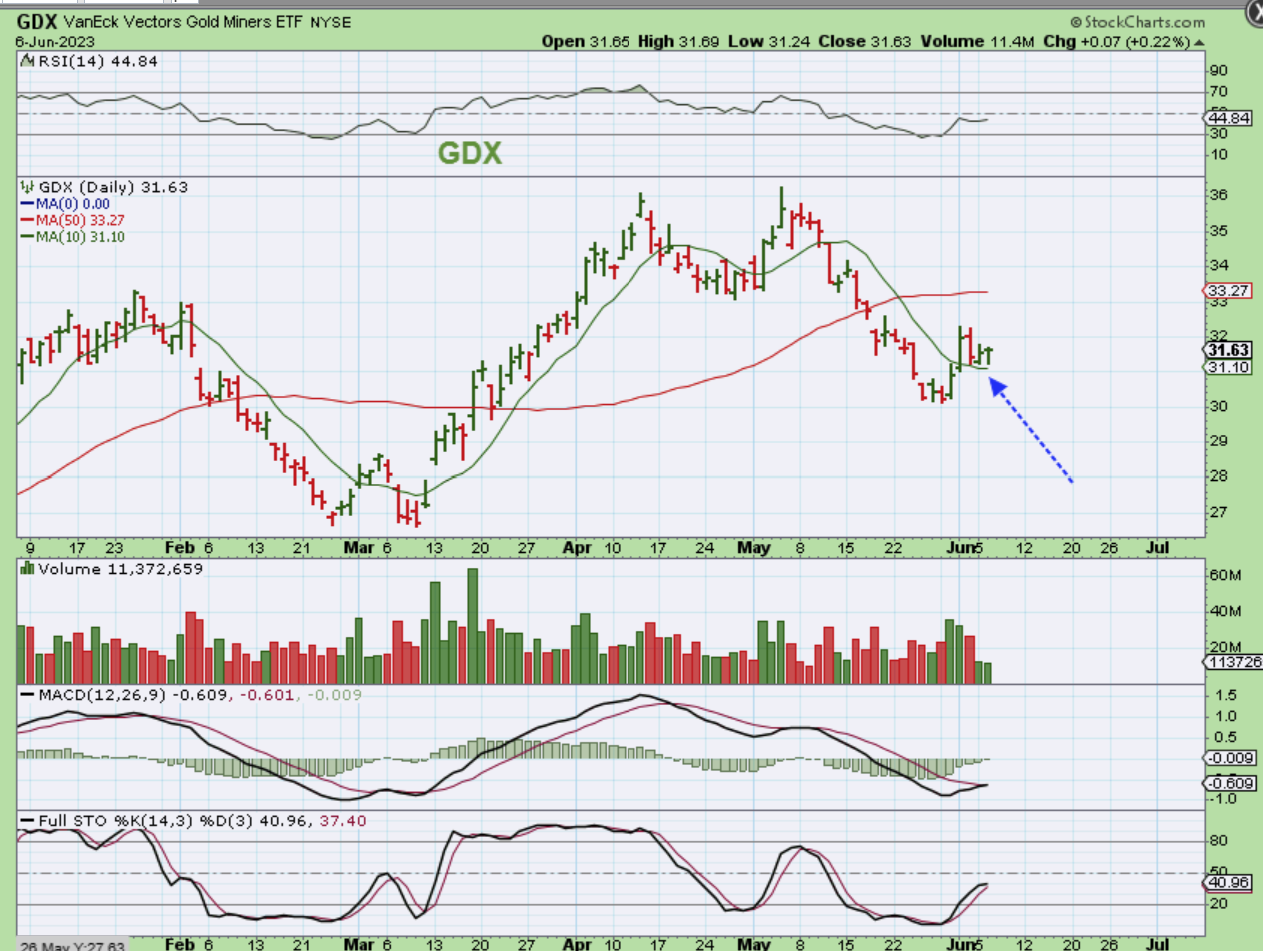
GDX and Silver are very similar right now. They also were Green when the USD was green, and seem to be ignoring the USD (at least for right now they are). GDX held the 10sma as support.
.
So we have a mixed set up for the General Markets with Tech ready to pull back at anytime, but the IWM and many of the Clean Energy stocks look like they want to go higher. The Precious Metals sector is holding up and I’m watching to see if we get the next sell off into a deeper low or will Gold try to break to all time highs sooner than later? I will discuss Energy a little bit more below. Enjoy your Wednesday trading.
.
~ALEX
.
I just wanted to take a minute and discuss the EV, Clean Energy, Chargers, etc.
The set ups are really good, and many have churned sideways under the 50sma and are starting to build small bases or just pop above that 50sma. The IWM broke out sharply. What I wanted to mention is that sometimes when we see a pop out of the base, you get follow through, other times it takes a while. I’ll just give you current examples, because if you see one POP and RUN, and then buy one that is popping, you may wonder why it isn’t getting immediate follow through. This may help you to understand the differences.
.
FCEL – So this is a nice set up and this is what I am talking about with a small base crawling under the 50sma. I would buy this and expect a follow through move higher actully.
.
QS – Quantum has done the same thing, and I so see others (Similar to the IWM). WILL THESE FOLLOW THROUGH?
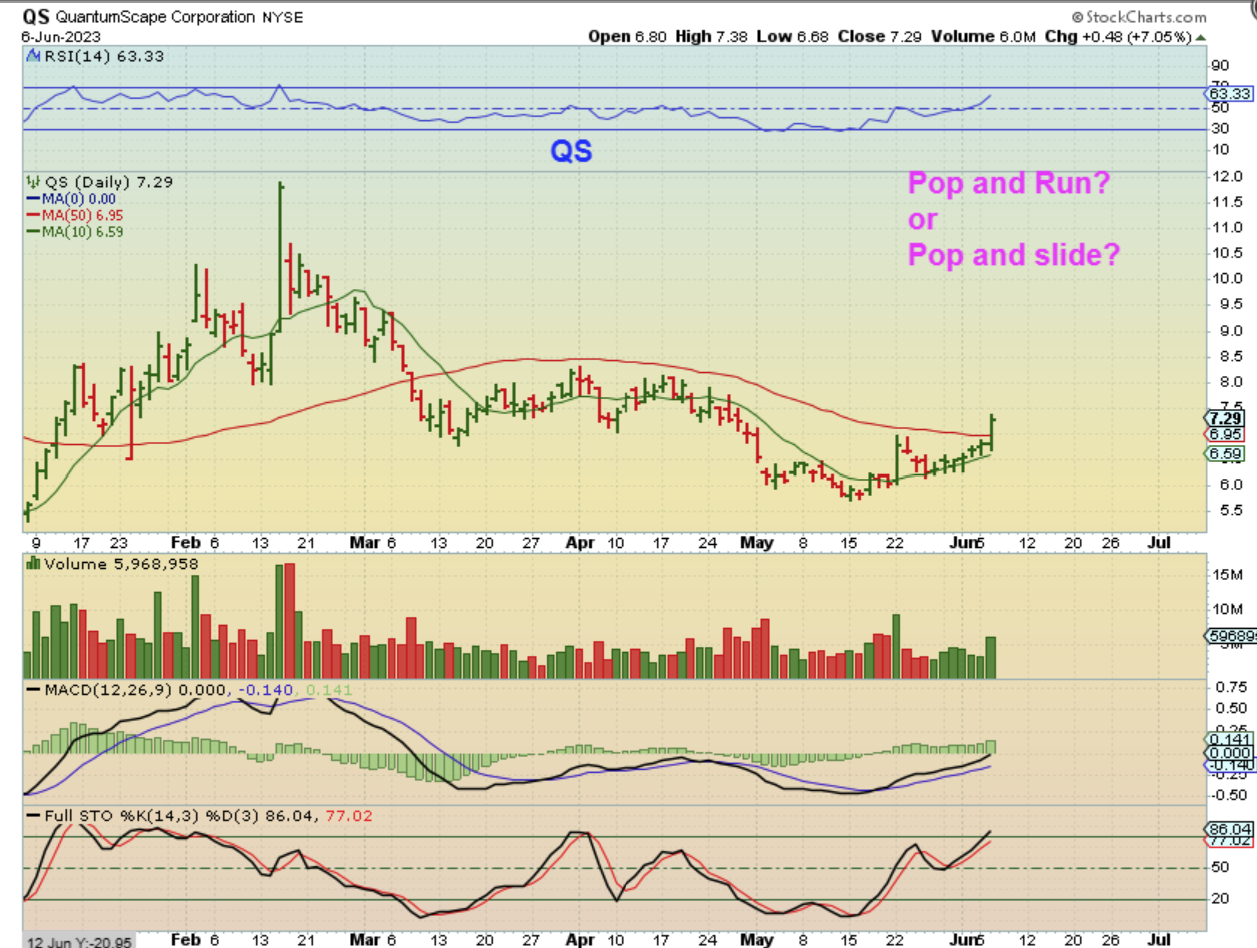
.
WILL THESE FOLLOW THROUGH?
..
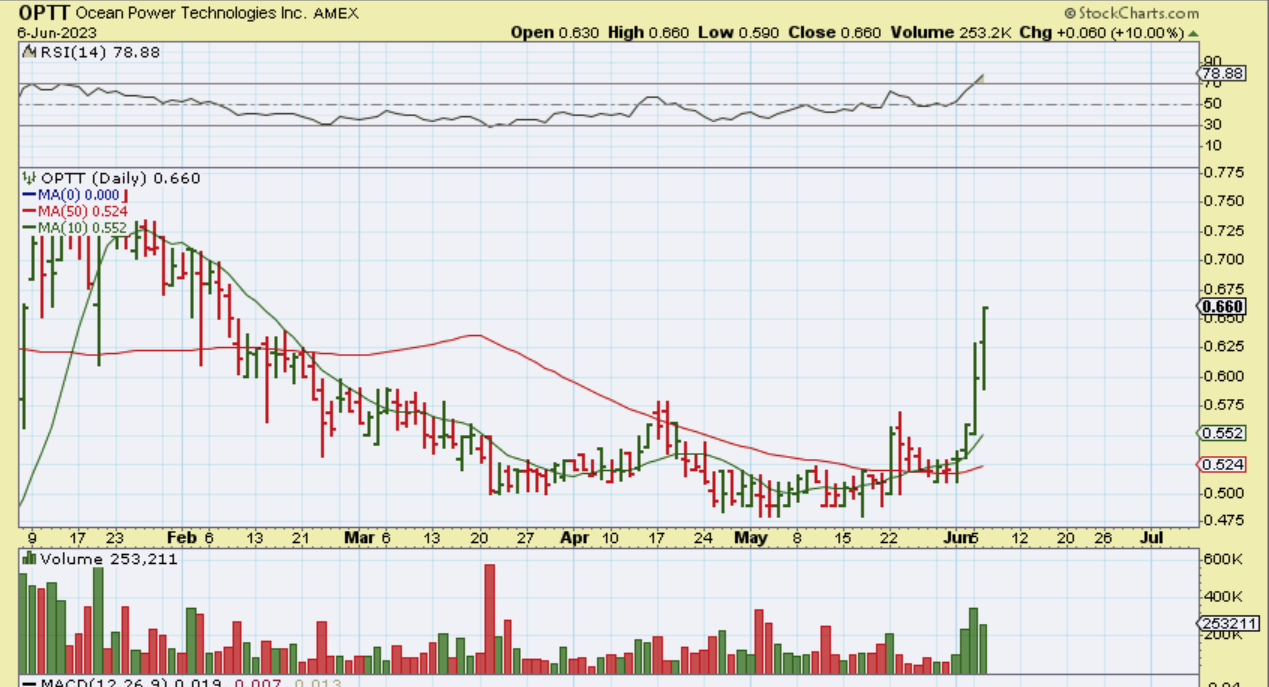
OPTT – This looks like GREAT follow through, right? Well, I want you to notice that when it FIRST broke above that 50sma, it was 2 weeks ago. It chopped sideways for 6 or 7 more days first, crawling along the 50sma and THEN it took off. So even though buying a breakout is recommended here at times, it may require patience.
.
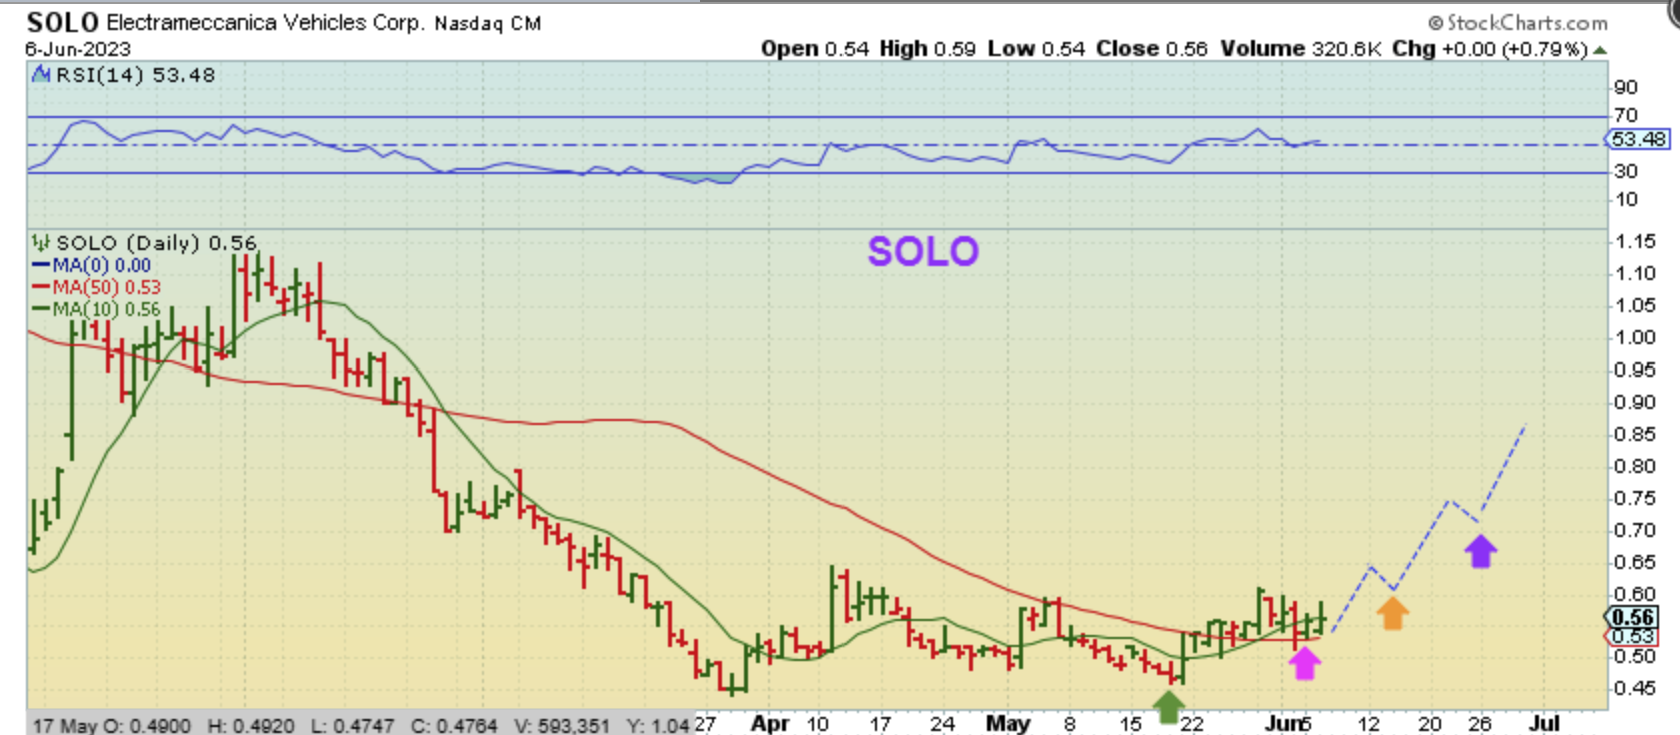
SOLO – Do you remember this chart? I had SOLO in the April report as it bottomed with a higher low and then suddenly burst above the moving averages. Did it have follow through in April?
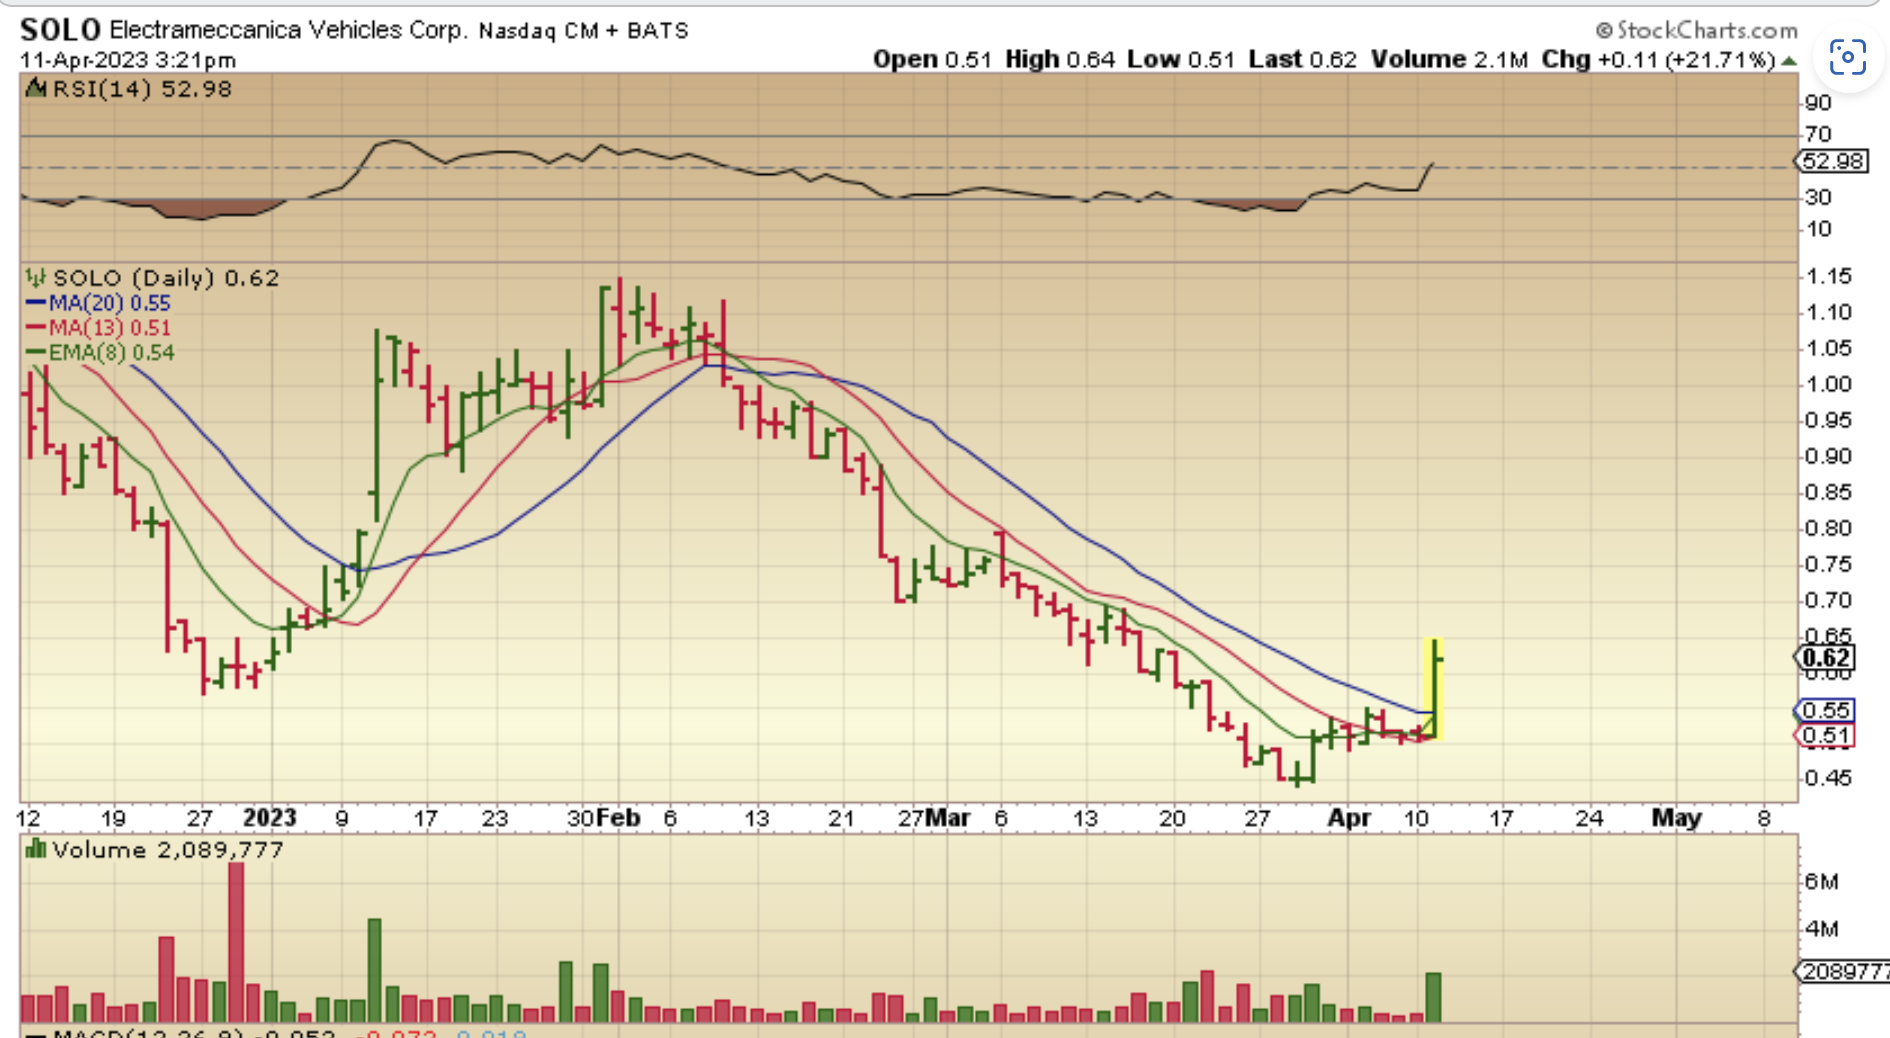
.
NO
.
SOLO churned sideways and dipped back under that 10 sma, so maybe this sector just wasn’t ready to go, but SOLO was acting like a leader? ISOLO then popped again on May 2nd, as seen here. This is forming a base now, so was it ready to go higher yet? No, because it was actually still under the 50sma…
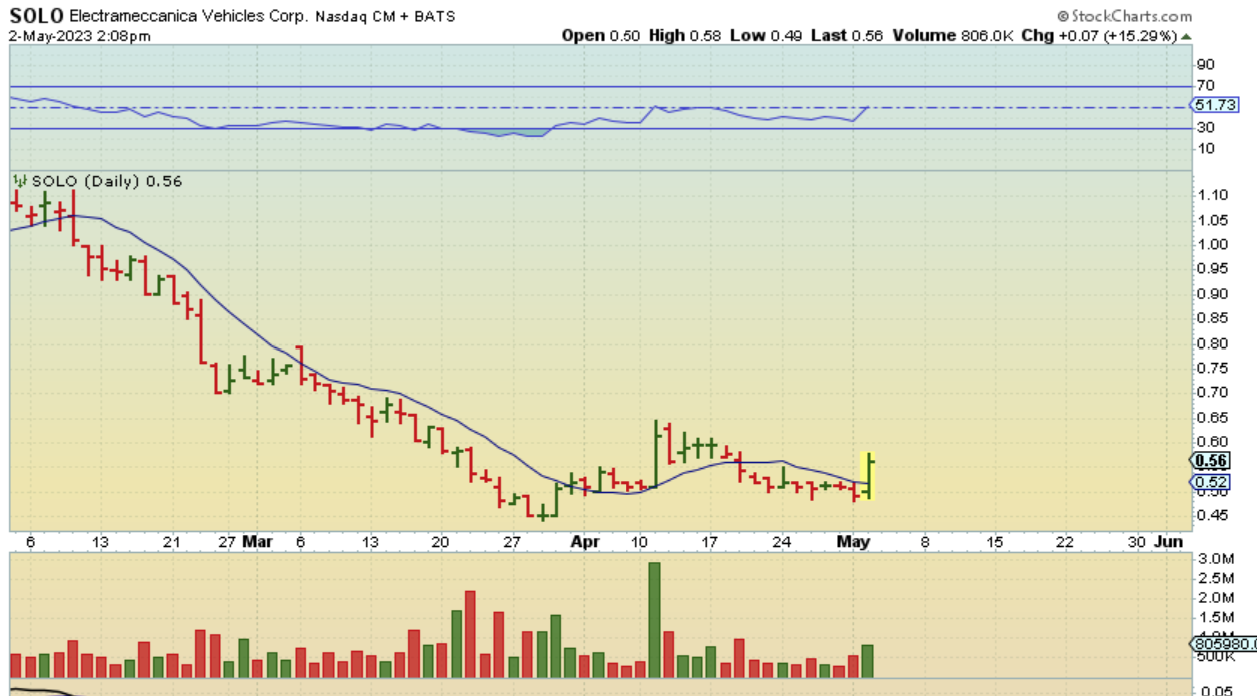
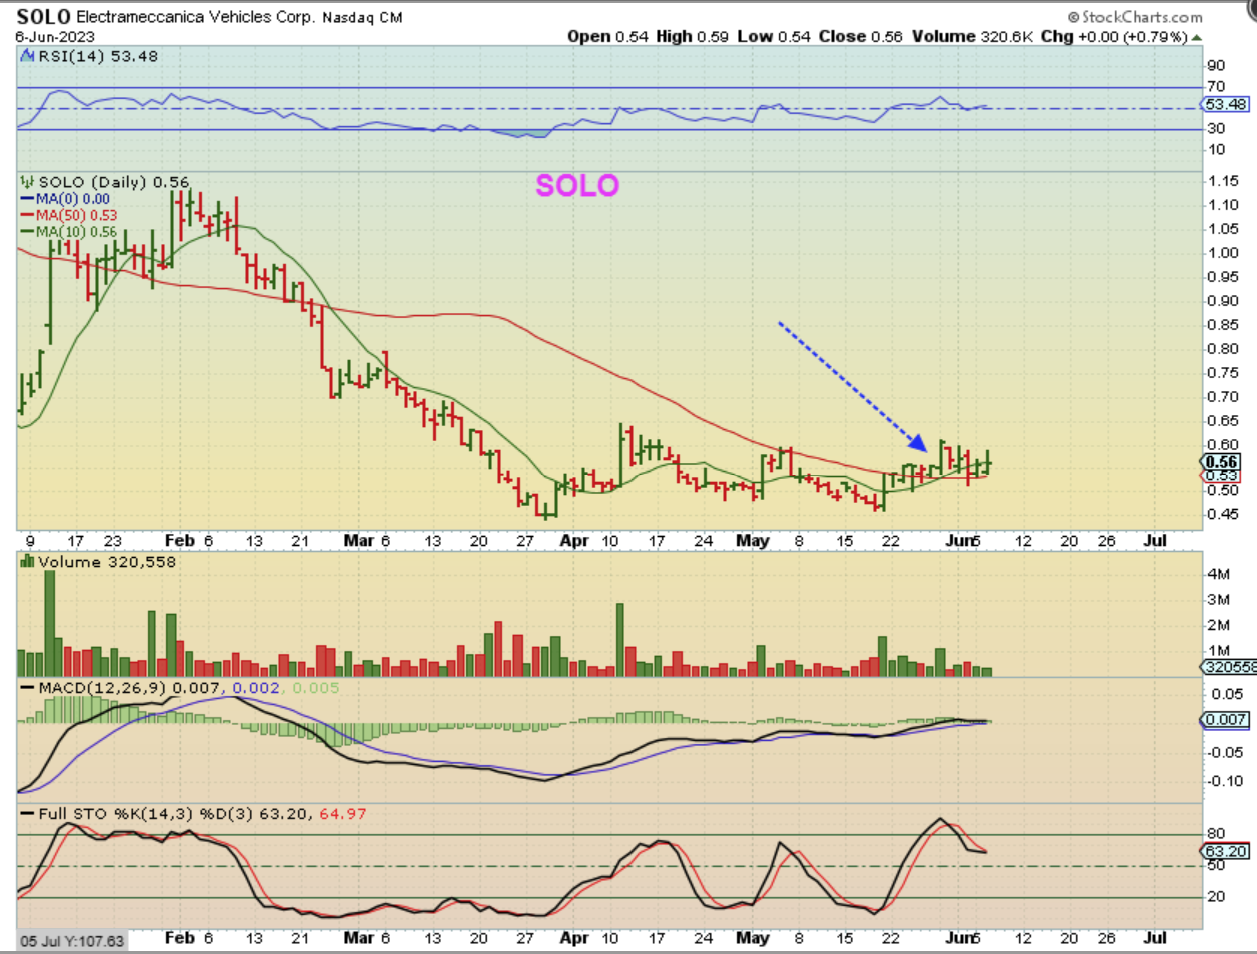
This is SOLO today and you can see that it recently got above the 50sma on May 23 and has only churned sideways again above the 50sma since then.
This is a good example of what I was saying : Even the POP with the blue arrow didn’t have follow through. I do think that this is actually constructive price action, but my point is that some will Pop and Run and others may churn and need to build energy. So…
.
So even though I do buy breakouts and I do also buy bases in sectors that are already running, others may prefer to wait for a trending move and they buy the dips in the run higher. This SOLO chart could be viewed as a First Daily cycle forming the base, and you are buying the 2nd daily cycle as it breaks out and ramps higher.
Solo actually does look set to make that next move, but so far most of the EV are not really ramping up, they look to still be basing. Those Clean Energy stocks may be running higher now though.