Tuesday June 6th
I’ve been watching the different sectors of the General Markets and I’m noticing that they do seem to be marching to their own beat at times, so I just want to start with that here. The reason that I want to start with that is that some look ready to dip lower, while others may have bottomed already, so let me show you what I see…
.
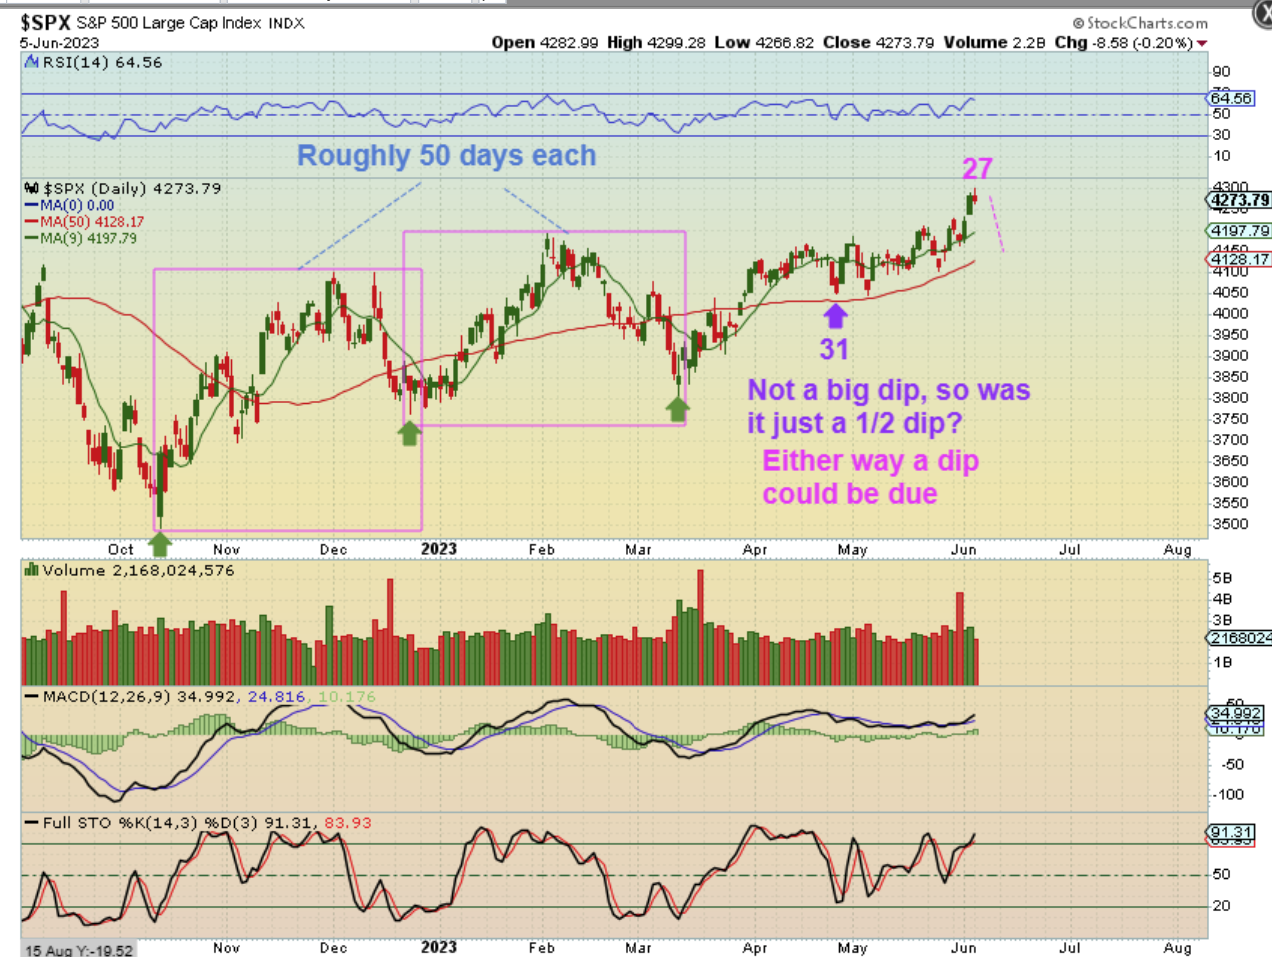
THE SPX has had roughly two 50 day First and Second daily cycles. We either have a day 31 half cycle dip, or a day 31 dcl and now its day 27. Either way, this would be due for a dcl, right? Another day 31 dcl or a day 50 plus dcl. It reversed on Monday and I think that we should expect a pullback. This is a bullish set up though.
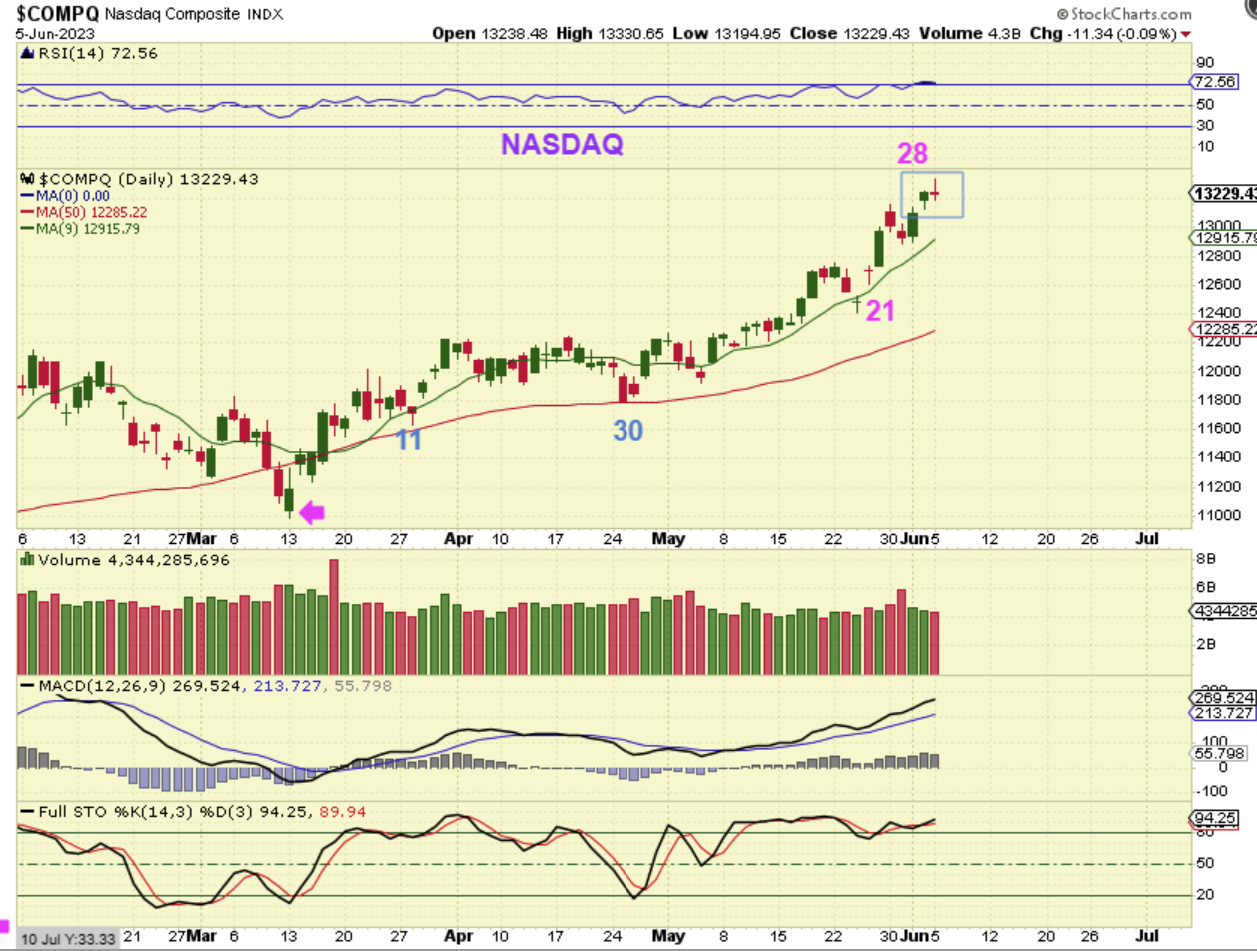
The NASDAQ looks quite different from the SPX. It ramped up along the 9sma, but the counts are the same as the SPX. We have 2 reversal candles at the top here, so I still think that we should expect a dip next.
.
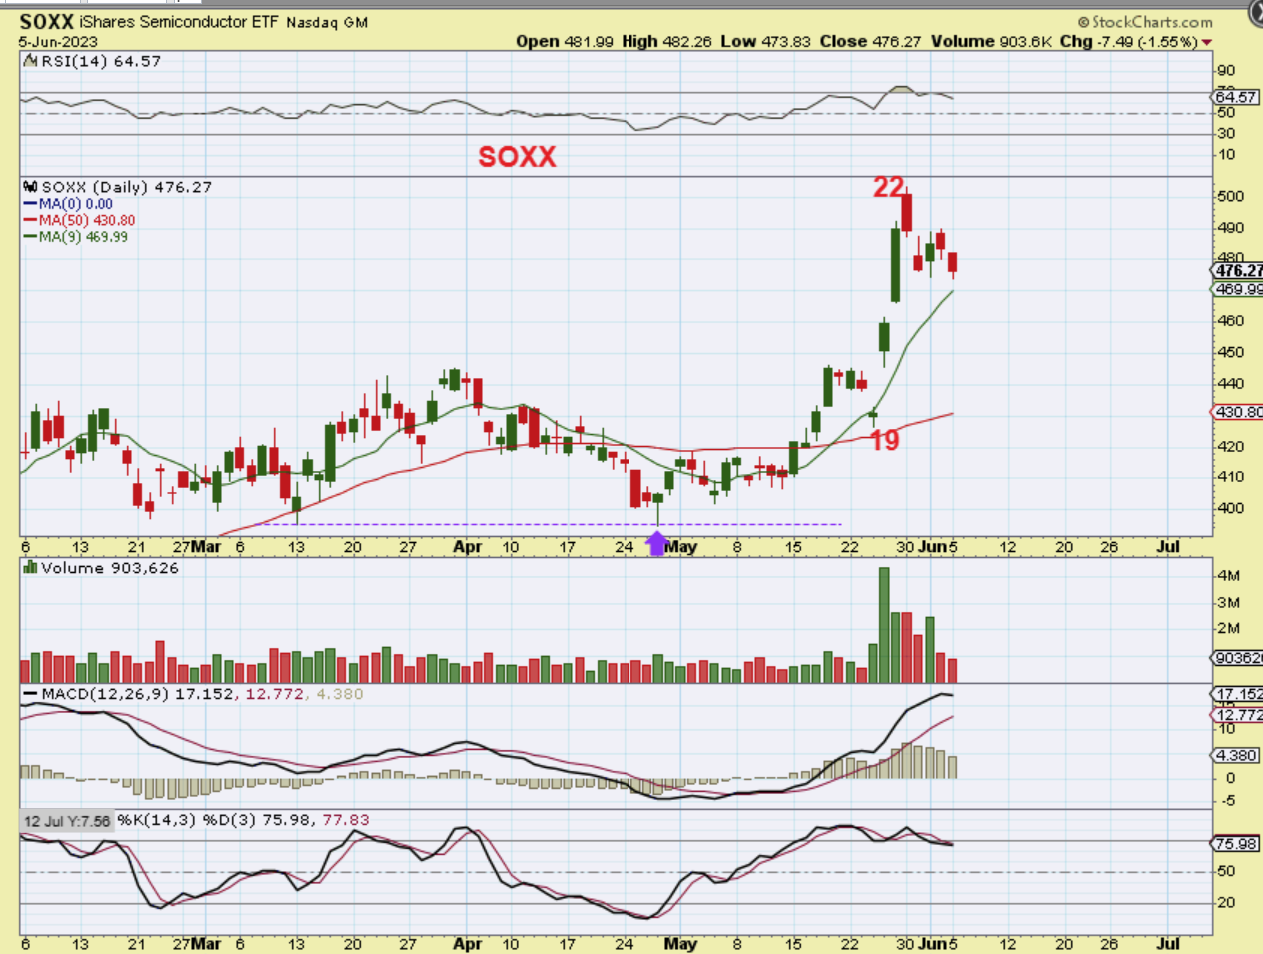
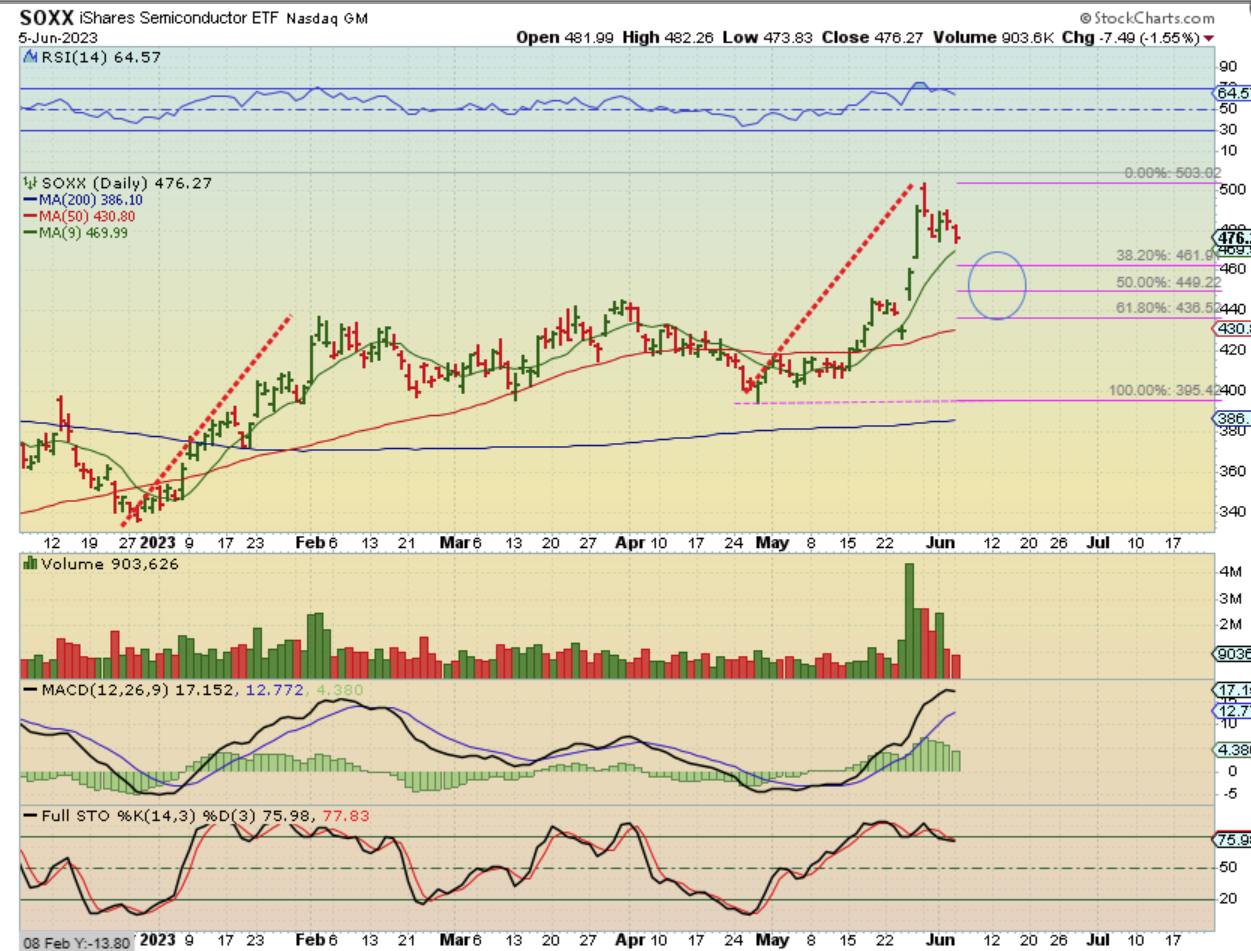
THE SOXX looks Very Different though. The NVDA earnings report caused many Semiconductor stocks to gap up and run straight up after that day 19 drop. So far we have a day 22 peak and the pullback here seems to have already started, since it got a bit extended over a week ago. This is day 26 and it may drop or it may just chop for a while. How about another view of this…
.
THE SOXX actually has done an equal run to that first run out of the December lows and is now flagging. The 38% dip would fill that upper gap. This was a strong move, so we’ll see if that is all that we get as it dips or will it dip lower as the rest of the market dips down into a dcl too?
.
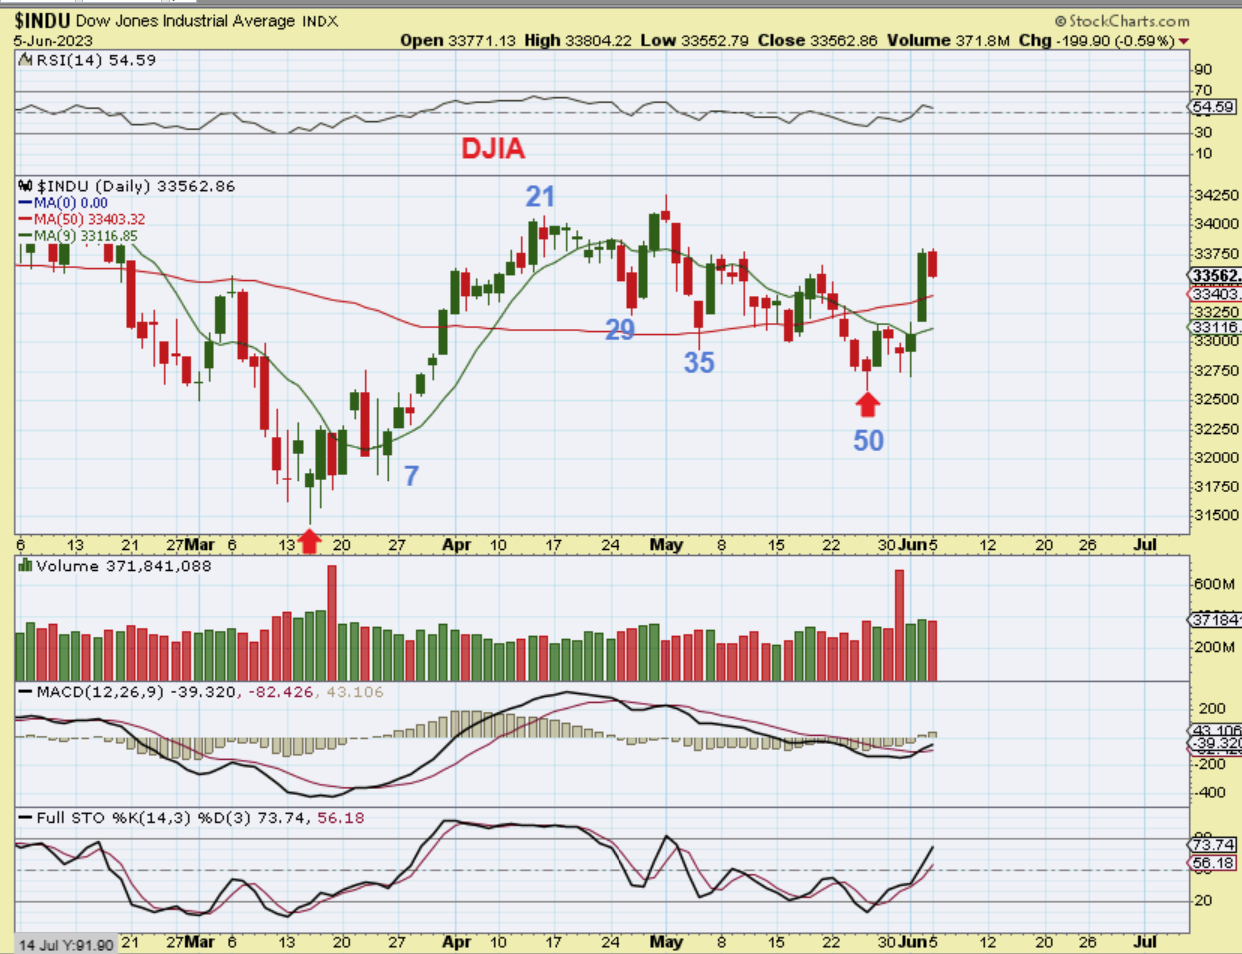
Now when we take a look at The DJIA, we see another very different set up.
This actually shows us a complete 50 day daily cycle into a dcl, and it looks quite clear. This would actually be day 6 and it had a strong rally through the 50sma on Fridays unemployment report. The MACD has crossed too, so it seems like the General Markets are going to pull back, but the DJIA already bottomed. Interesting.
.
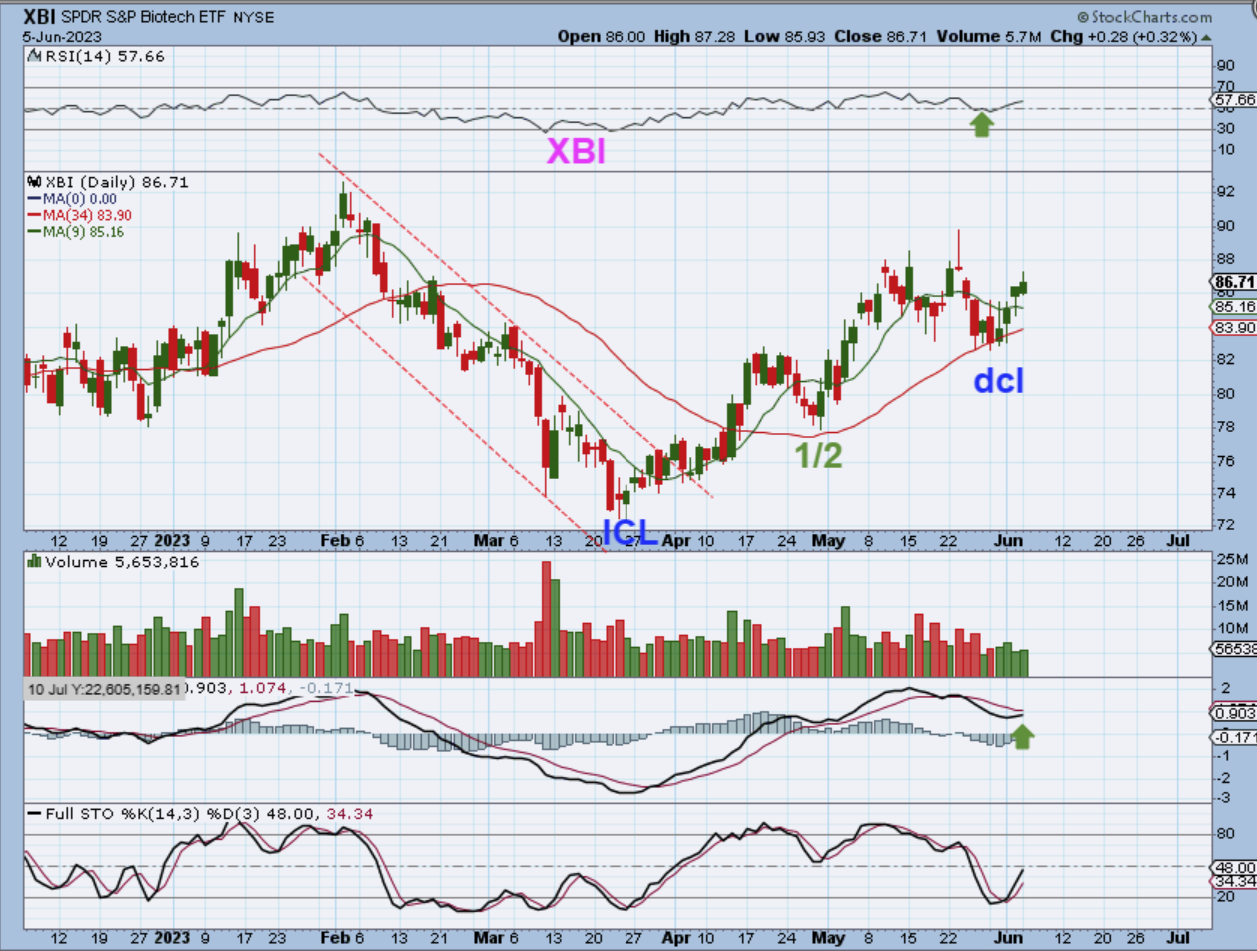
And I have already discussed my thoughts on Biotech, which also seems to have a dcl in place.
The XBI did not rally when the Banks failed & the markets took off higher, so it continued down into a normal ICL sell off. This appears to be day 4, out of the reversal at the 34 sma. Many Biotechs did seem to continue higher last week and on Monday.
.
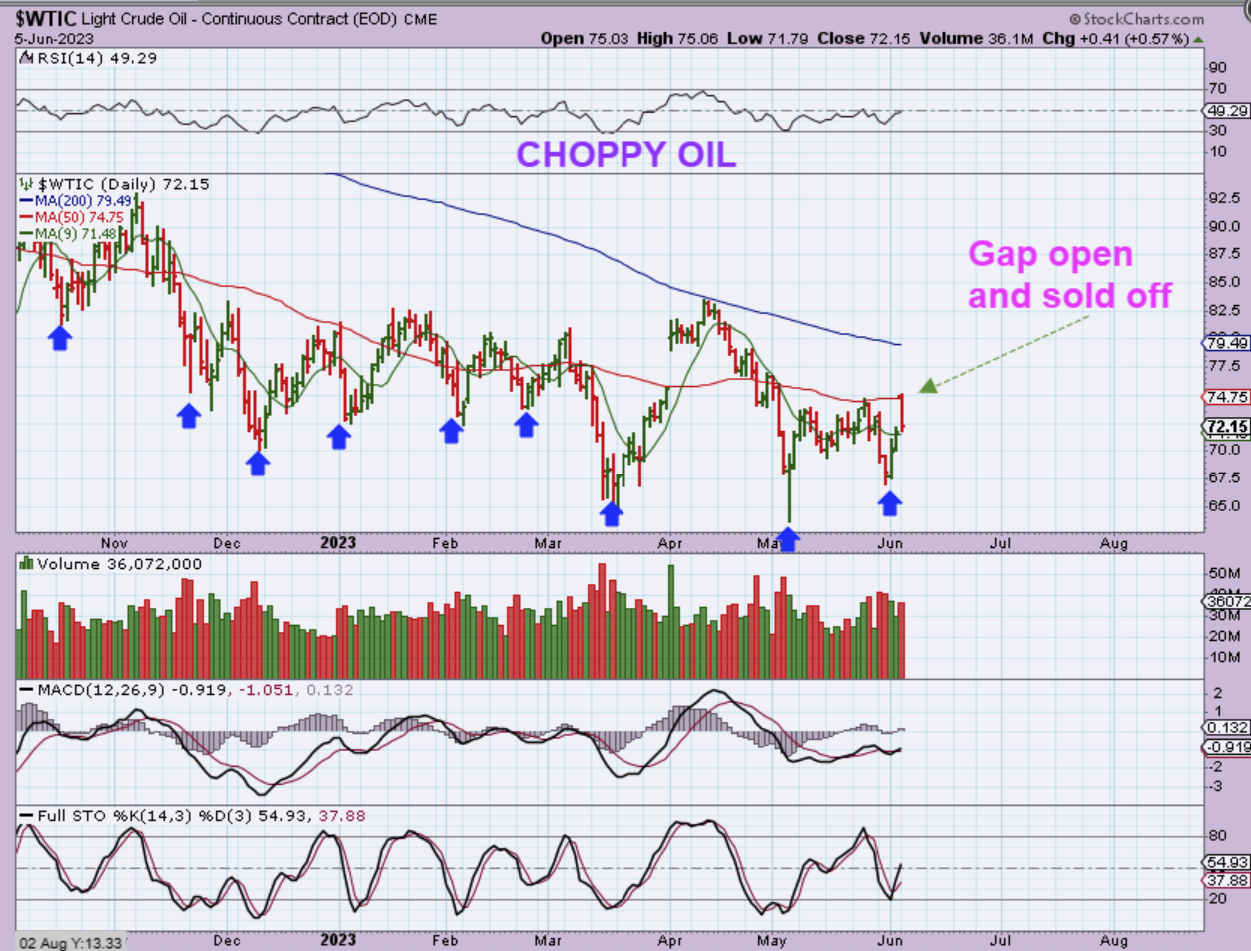
WTIC– Saudi Arabia announced plans to cut production on Oil, and Oil jumped sharply. Oil stocks also jumped sharply, but they all sold off as the day went on. Oil was again rejected at the 50sma and as I have been saying for months, OIL IS VERY CHOPPY (see blue arrows) and will likely remain that way until it breaks out and starts to trend higher.
.
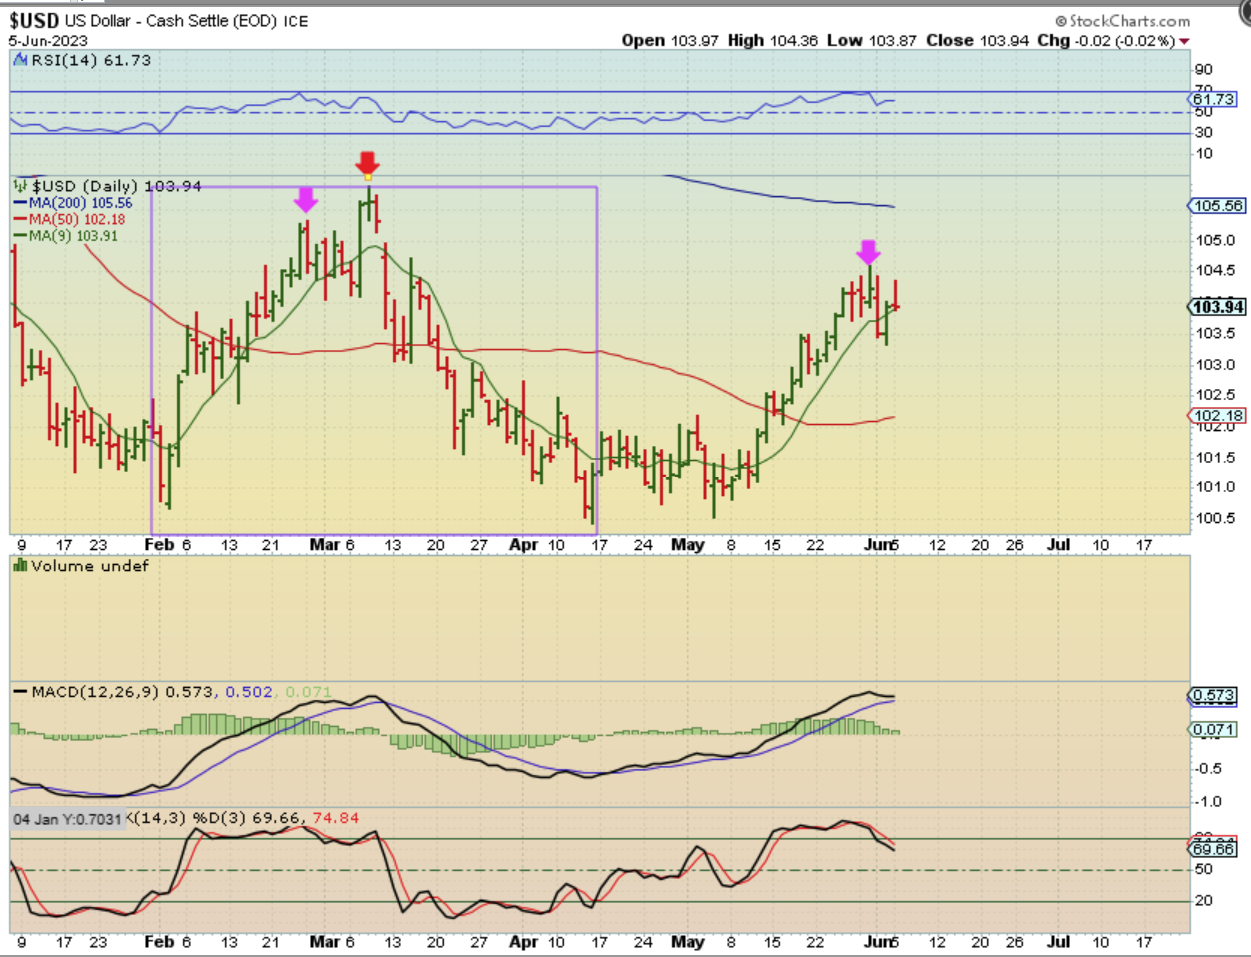
The USD peaked and should be dropping into a dcl. I have discussed a couple of ideas here, so we’ll see how it plays out.
.
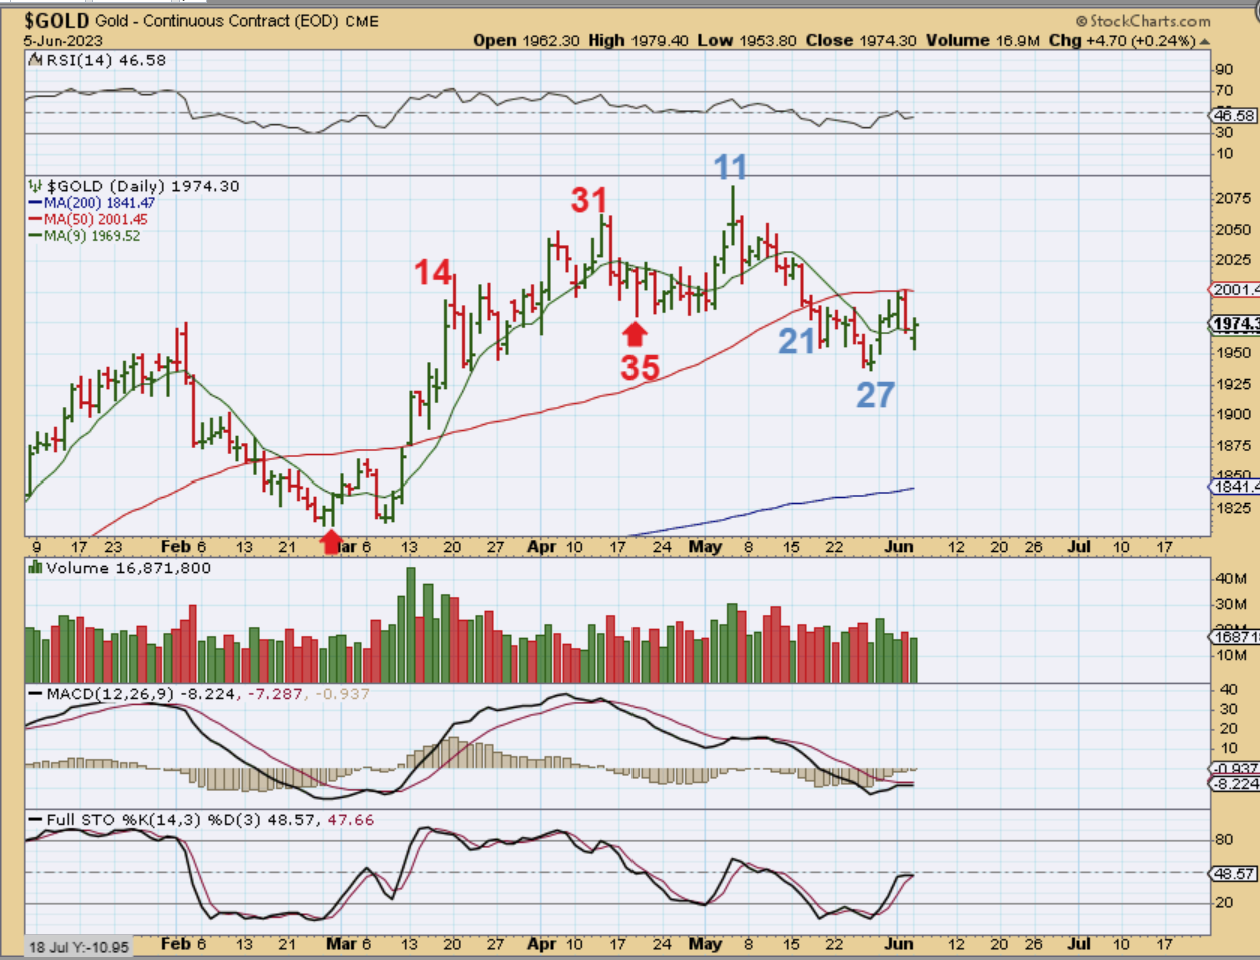
GOLD bottomed on day 27, which is usually early for a dcl, but things are not normal timing wise here. That said, day 27 might be a dcl, or we’ll see Gold rejected at the 50sma again and it would drop into a dcl closer to day 33. What if …
.
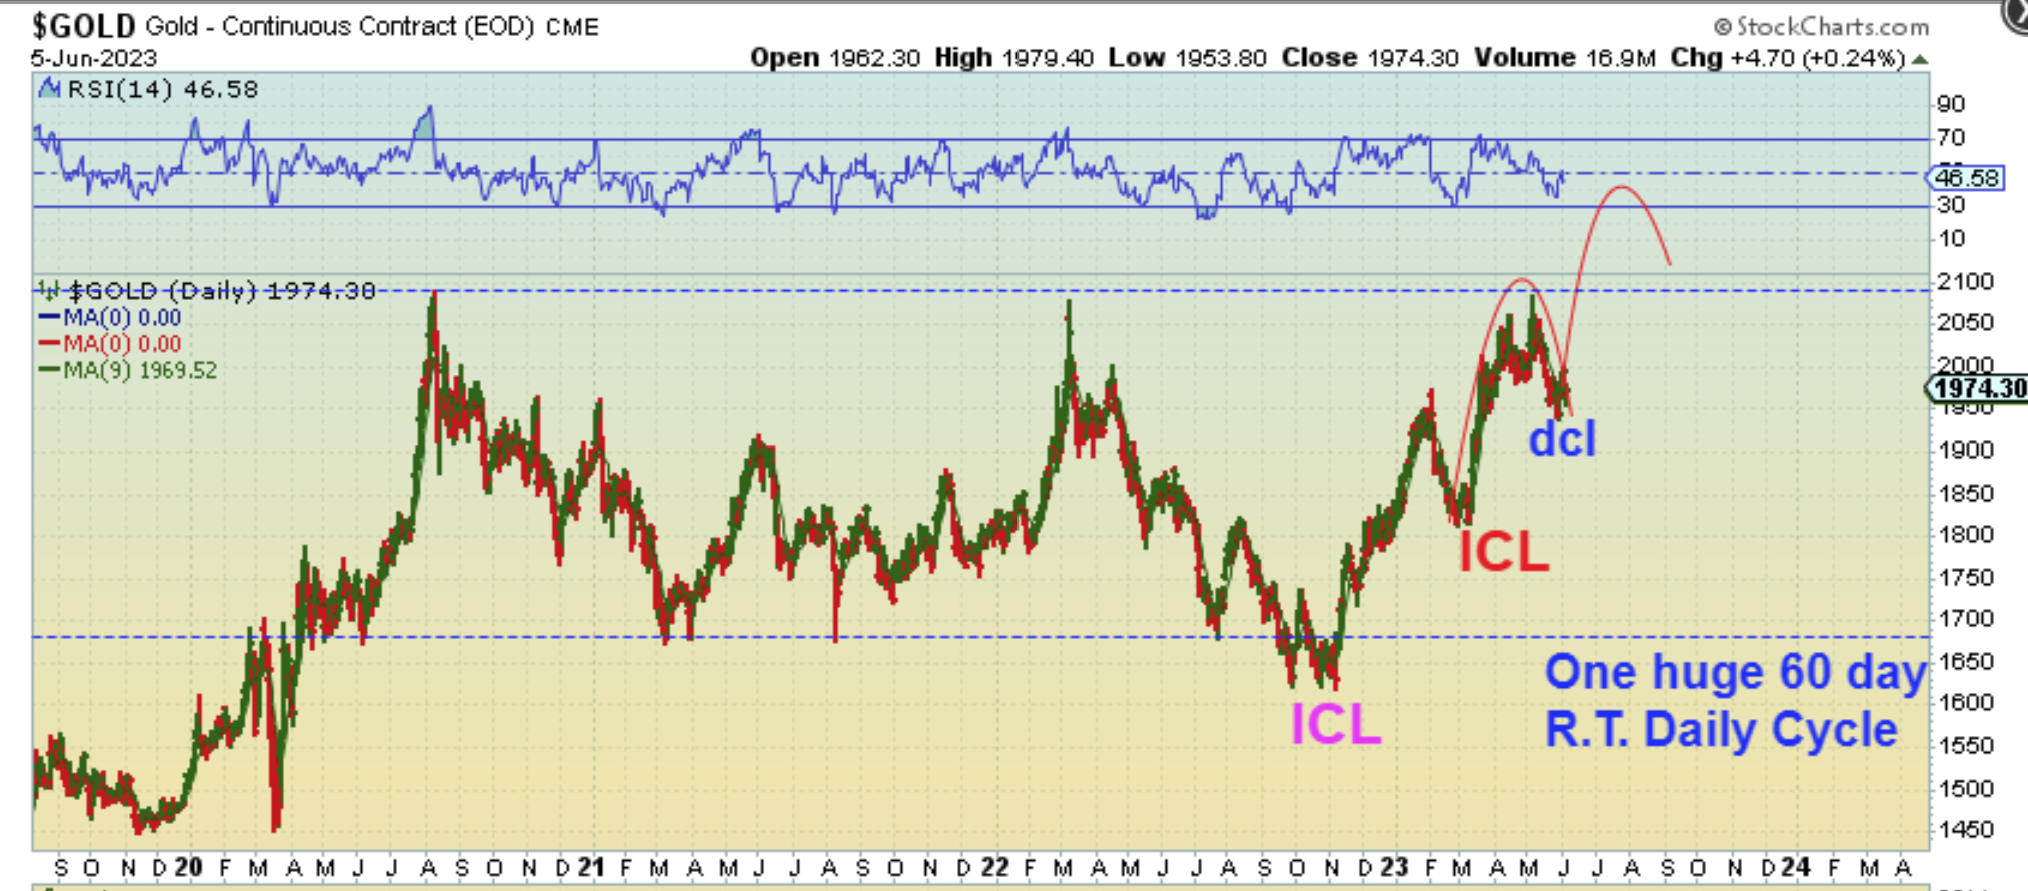
What if Gold closed back above the 50sma? Could this possibly be all one giant daily cycle (62 days long?). That is least likely and extremely rare, but after that Bank failure rally, I wouldn’t rule anything out. It would look like this…
What if Gold closed back above the 50sma soon? Could this be all one daily cycle (62 days long?). After that Bank failure rally, I wouldn’t rule anything out. It would look like this and this dip was just preparing it for that breakout attempt.
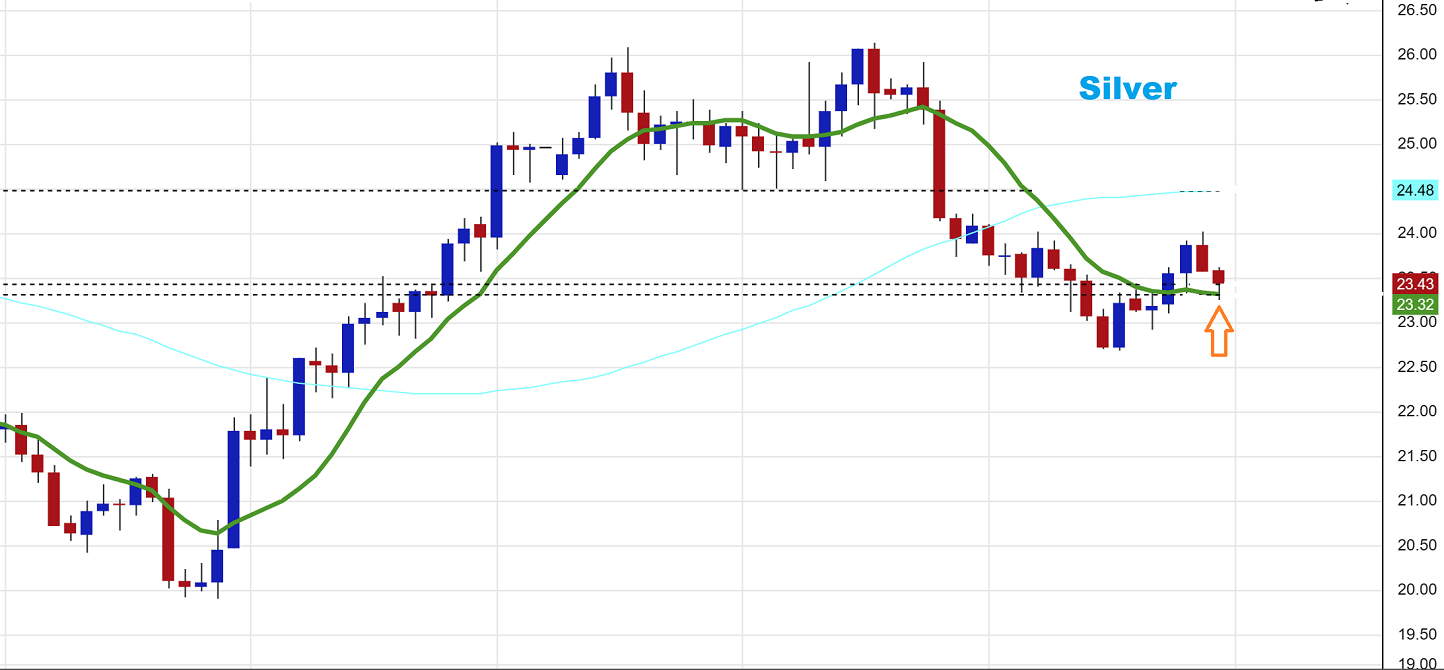
SILVER dropped to the 10sma, found support, and bounced back on Monday.
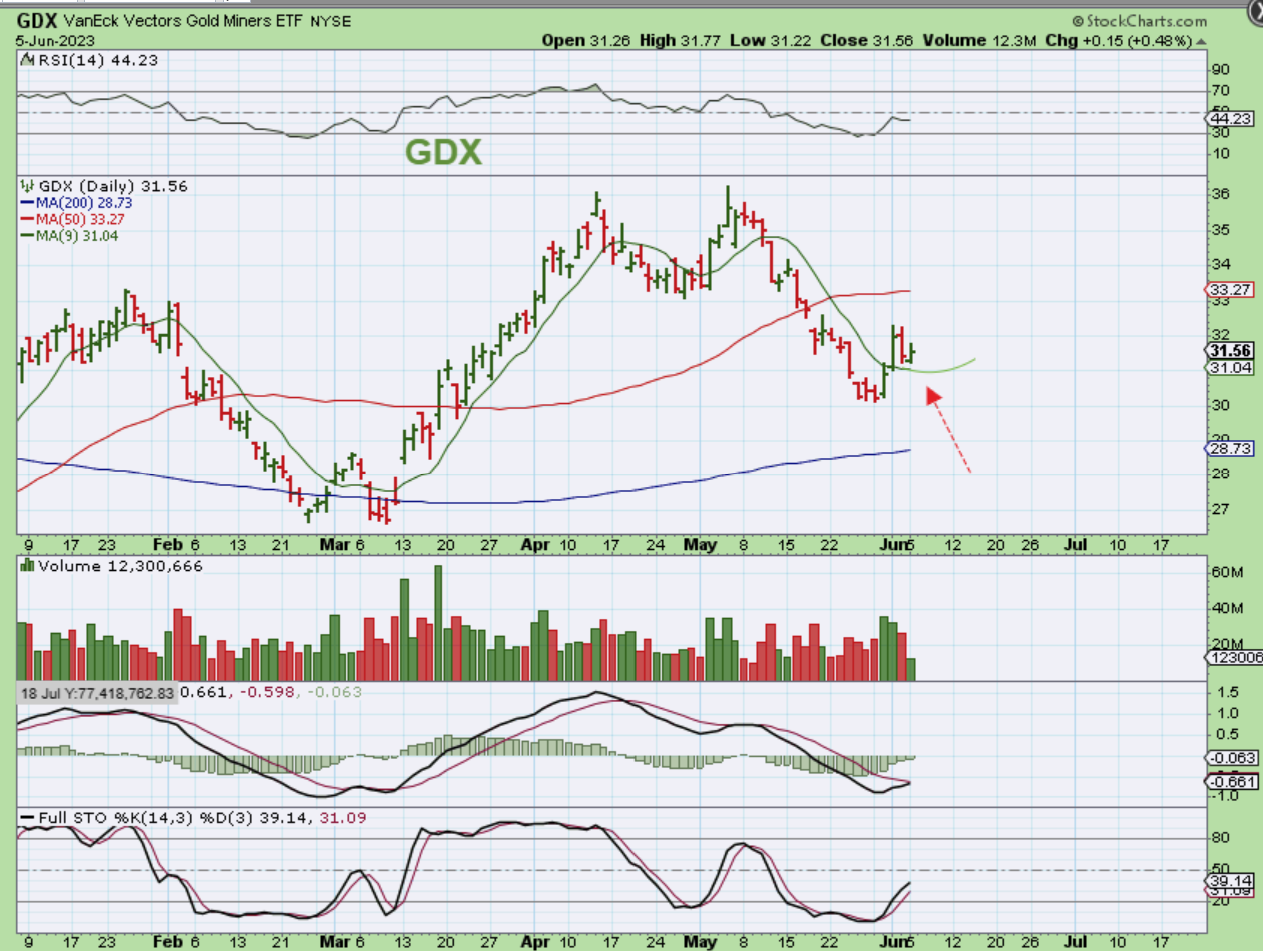
GDX is finding support at the 9 sma too. I have expected this to tag the 50sma and then drop into a new low, but if this gets back above the 50sma, we might have a low in place. I’ve explained that in past reports and again with Gold on this report.
.
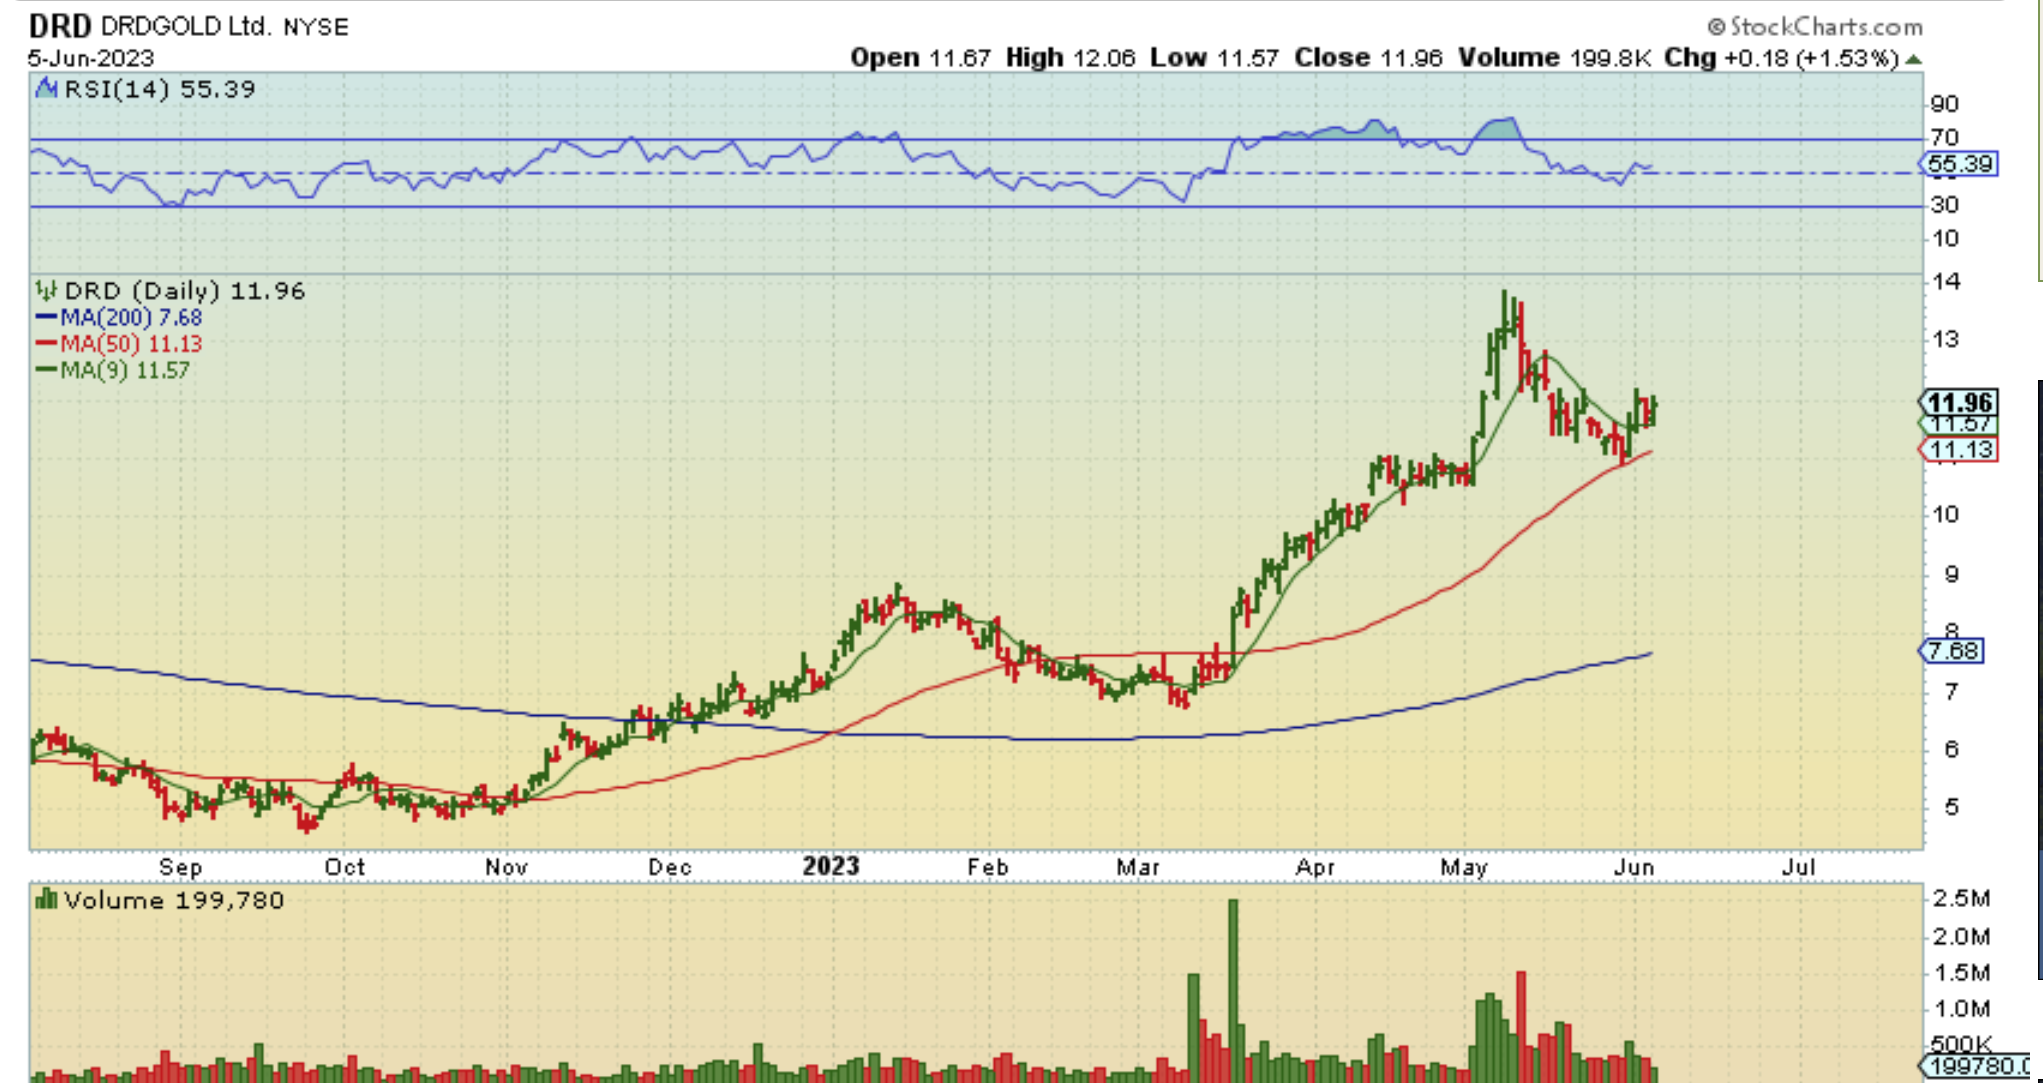
Last week I mentioned that you can buy these stronger stocks and raise a stop, because they have acted bullishly by reversing at the 50sma. Of the stronger Miners, some did hold up at the 50sma, others lost it. See charts of DRD, HMY, AU, GFI, EGO, MUX etc for the variety.
.
This is DRD and it is a pretty chart and GFI & HMY held that 50sma too. Some of the others are under it back testing, so we’ll see how this all plays out.
.
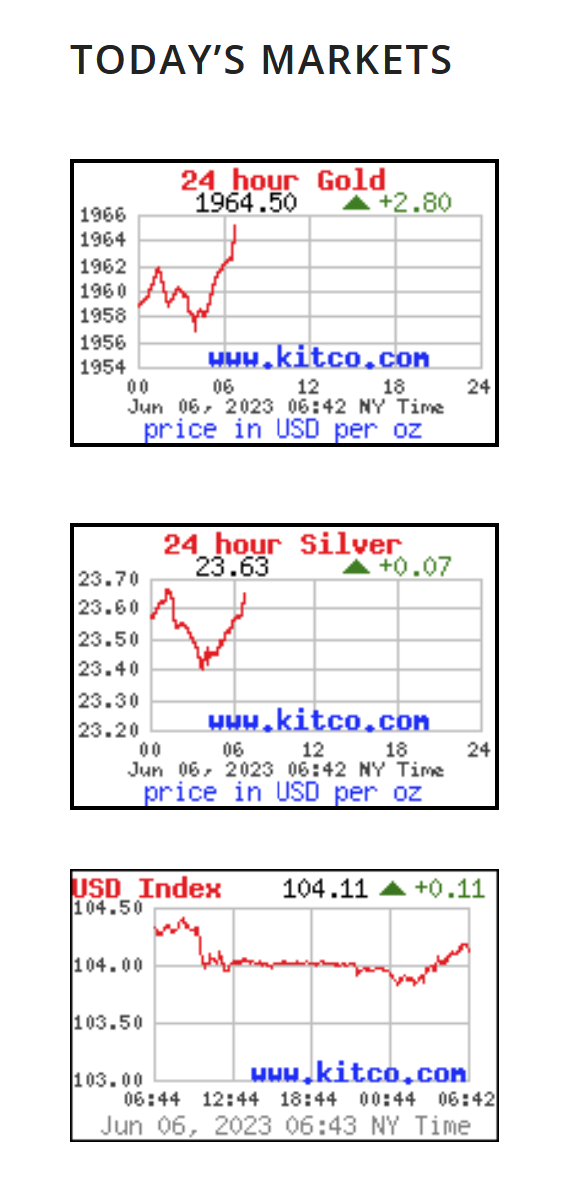
Just a thought here: This is a live shot of Gold, Silver, and The USD right now. You can see the ‘June 06, 2023 6:43 a.m.’ time stamp on each chart.
You can also see that they are all green or rising higher at the same time. This could just be a temporary fluke, and then they’ll move opposite of each other again soon enough, but if the Precious Metals start to ignore the rising USD, we want to be alert to that idea that if Gold breaks convincingly above the 50sma, it may just be ready to move higher no matter what the USD does.
.T
I will discuss bitcoin below, enjoy your Tuesday trading.
.
~ALEX
.
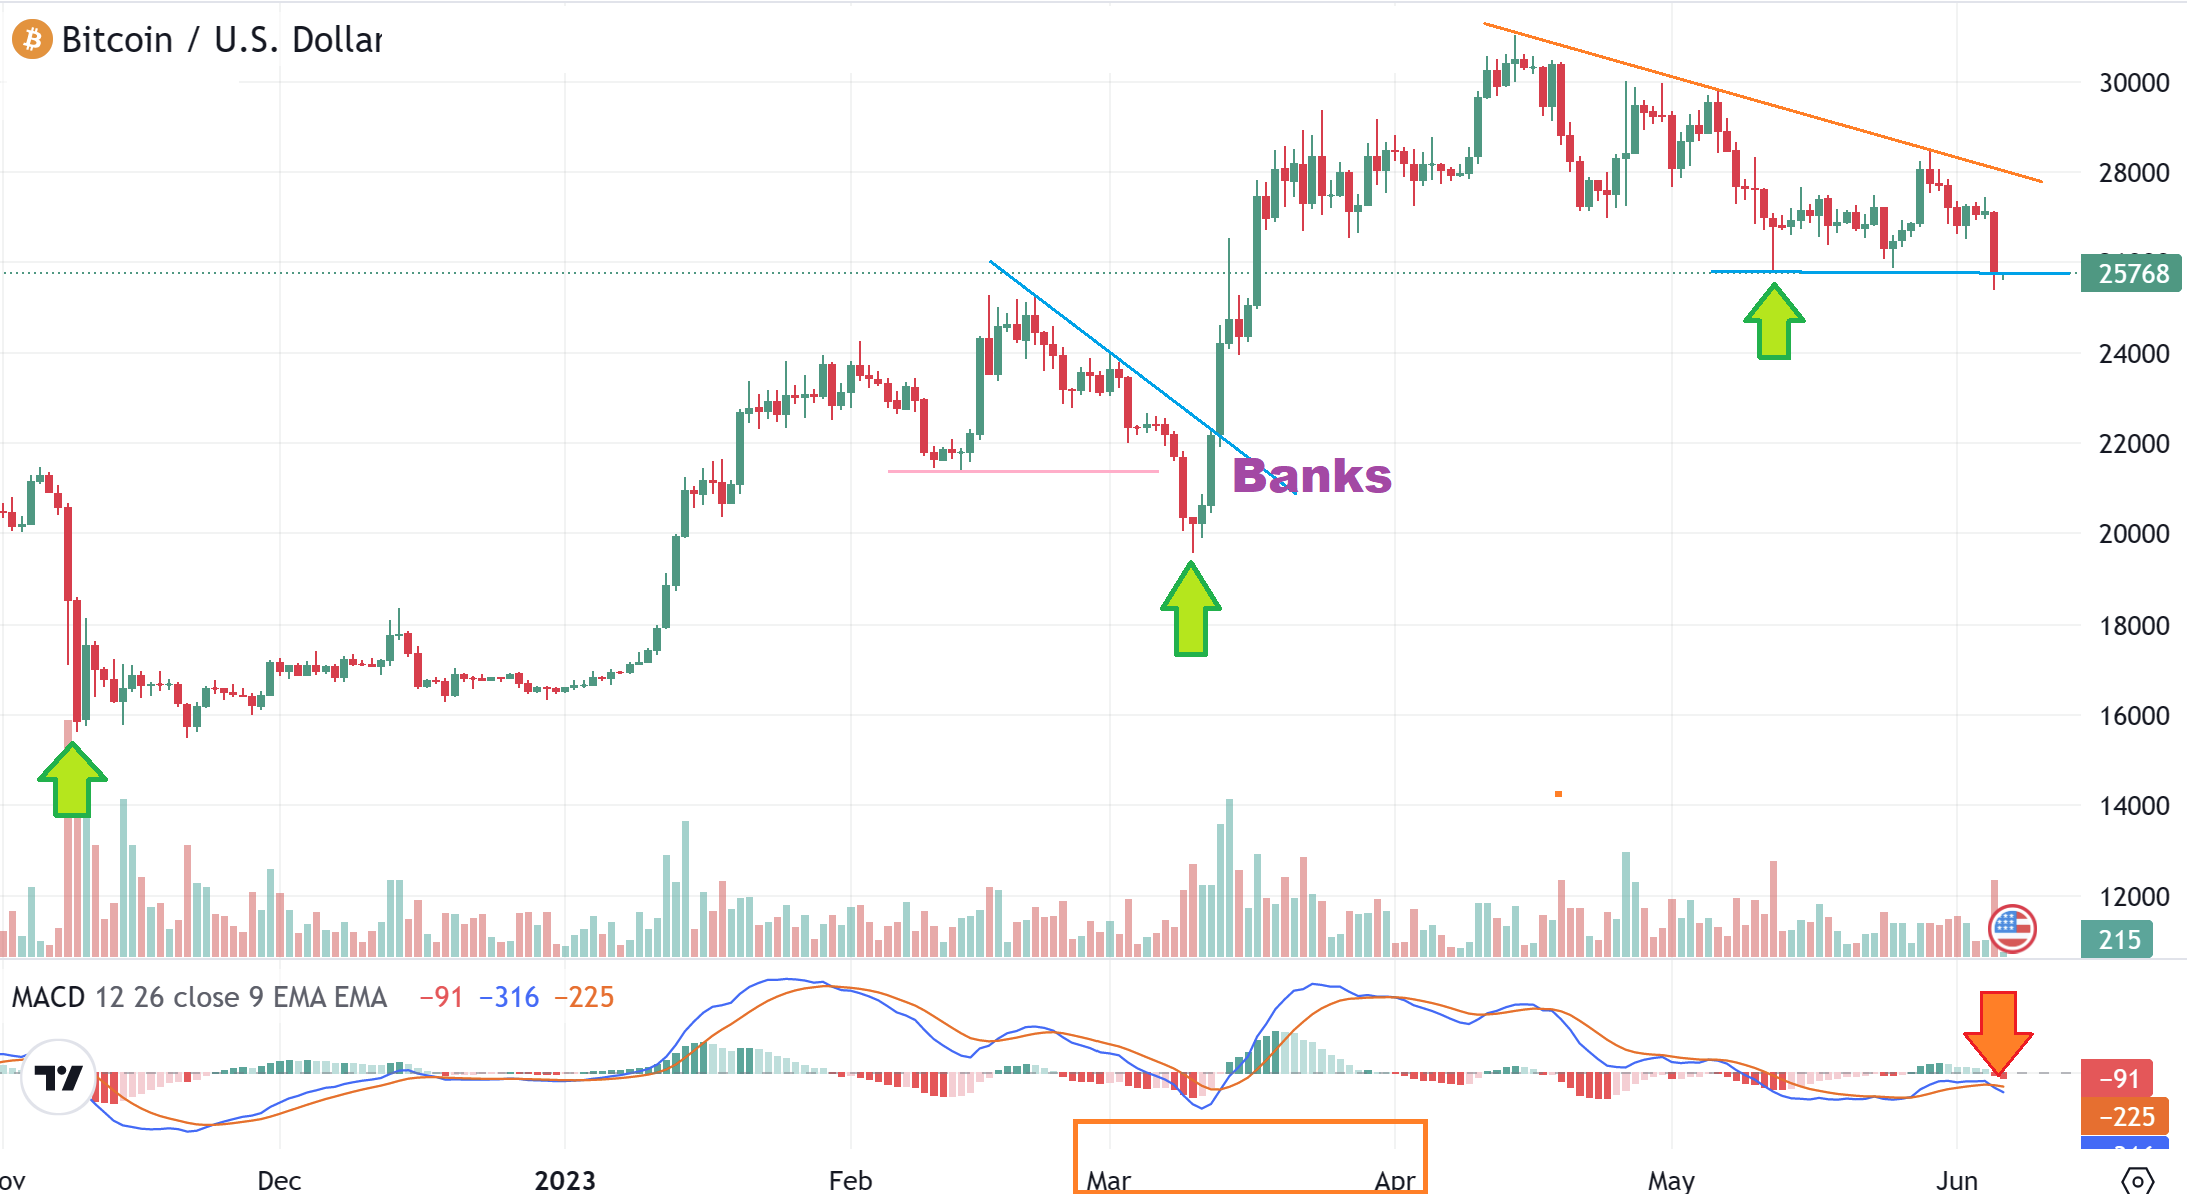
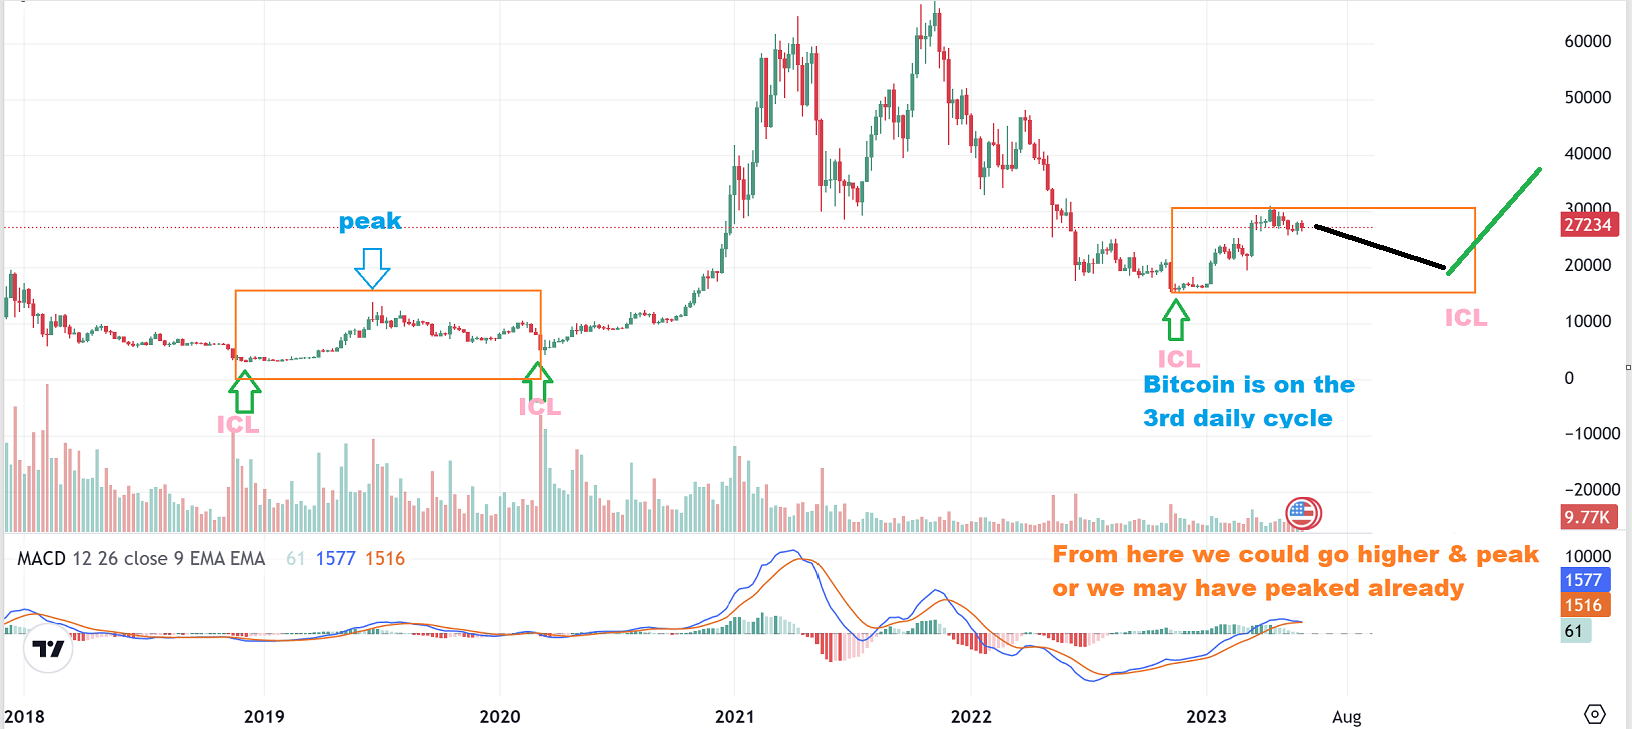
BITCOIN broke the recent lows that were marked as a day 62 dcl, so this should be a failed daily cycle. You may also look at it this way: This is a downtrend with the orange line acting as resistance and we have lower lows from the ‘peak’ until now and the orange line gives us lower highs. It would take a break above the orange line to break the pattern.
.
Below was one of my ideas in the weekend report and it seems that this may play out this way. This will give us a MAJOR buy if this drops into an ICL , since the next run should be quite strong. RIOT, MARA, HUT, CIFR, CLSK, etc all tripled out of that last ICL. I went in light & cautious out of that last ICL, but after this confirmation, I’d go in heavier next time.
.
BITCOIN WEEKLY: This would be Bitcoin remaining choppy and already having peaked in this intermediate cycle in the 3rd daily cycle. It is still bullish long term. You can see that this gradual chop lower is similar to 2019-2020 (orange box).
BIOTECH: I have discussed Biotech stocks in recent reports and I just want to quickly run through a few more Biotech stocks to show you that many are still moving Bullishly. LABU may be a trade idea if XBI did bottom.
.
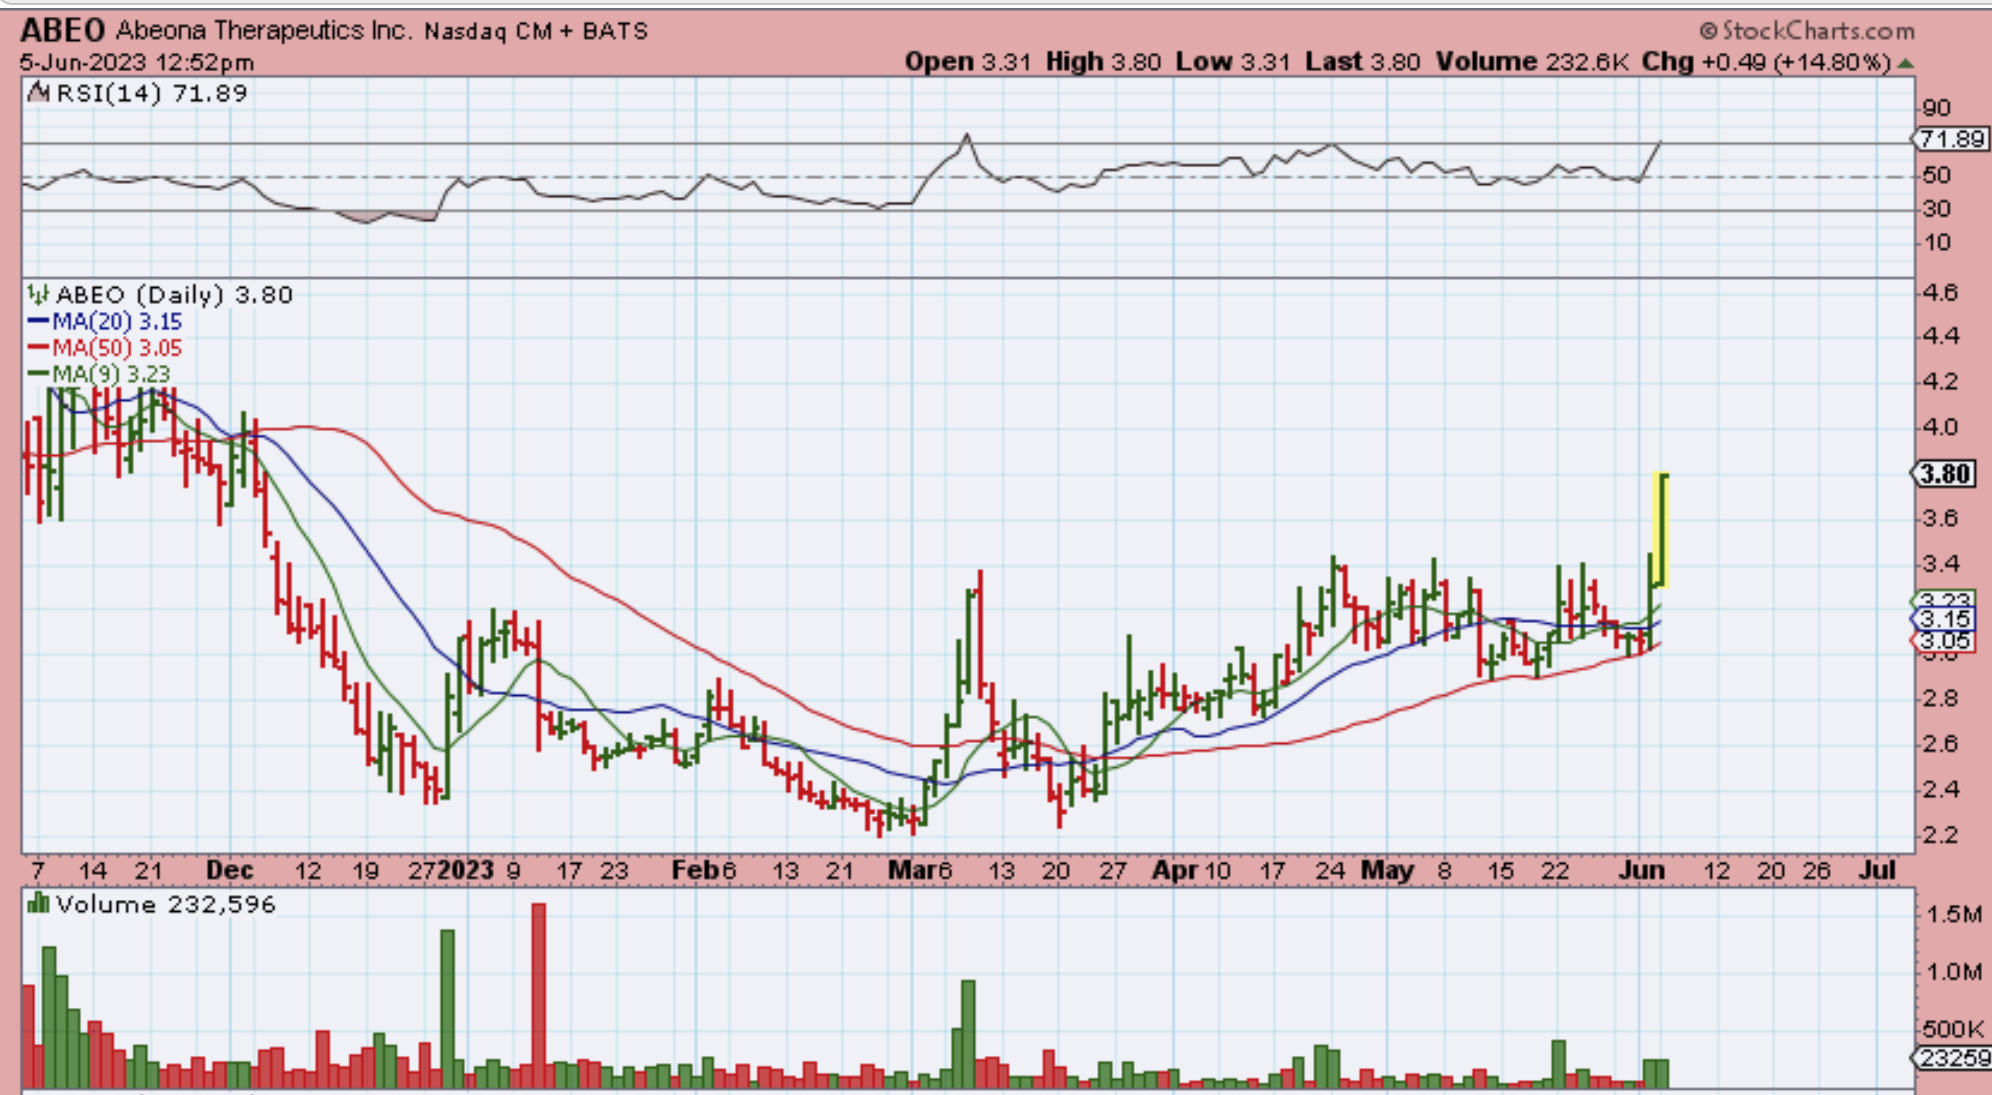
ABEO shot up Friday at the 50sma and then on Monday it popped again. This was midday and it was up 14%, but it was up 25% at one point and closed up 21%, so some of these are really moving swiftly.
.
And then again, some aren’t moving quite as swiftly (yet?).
,
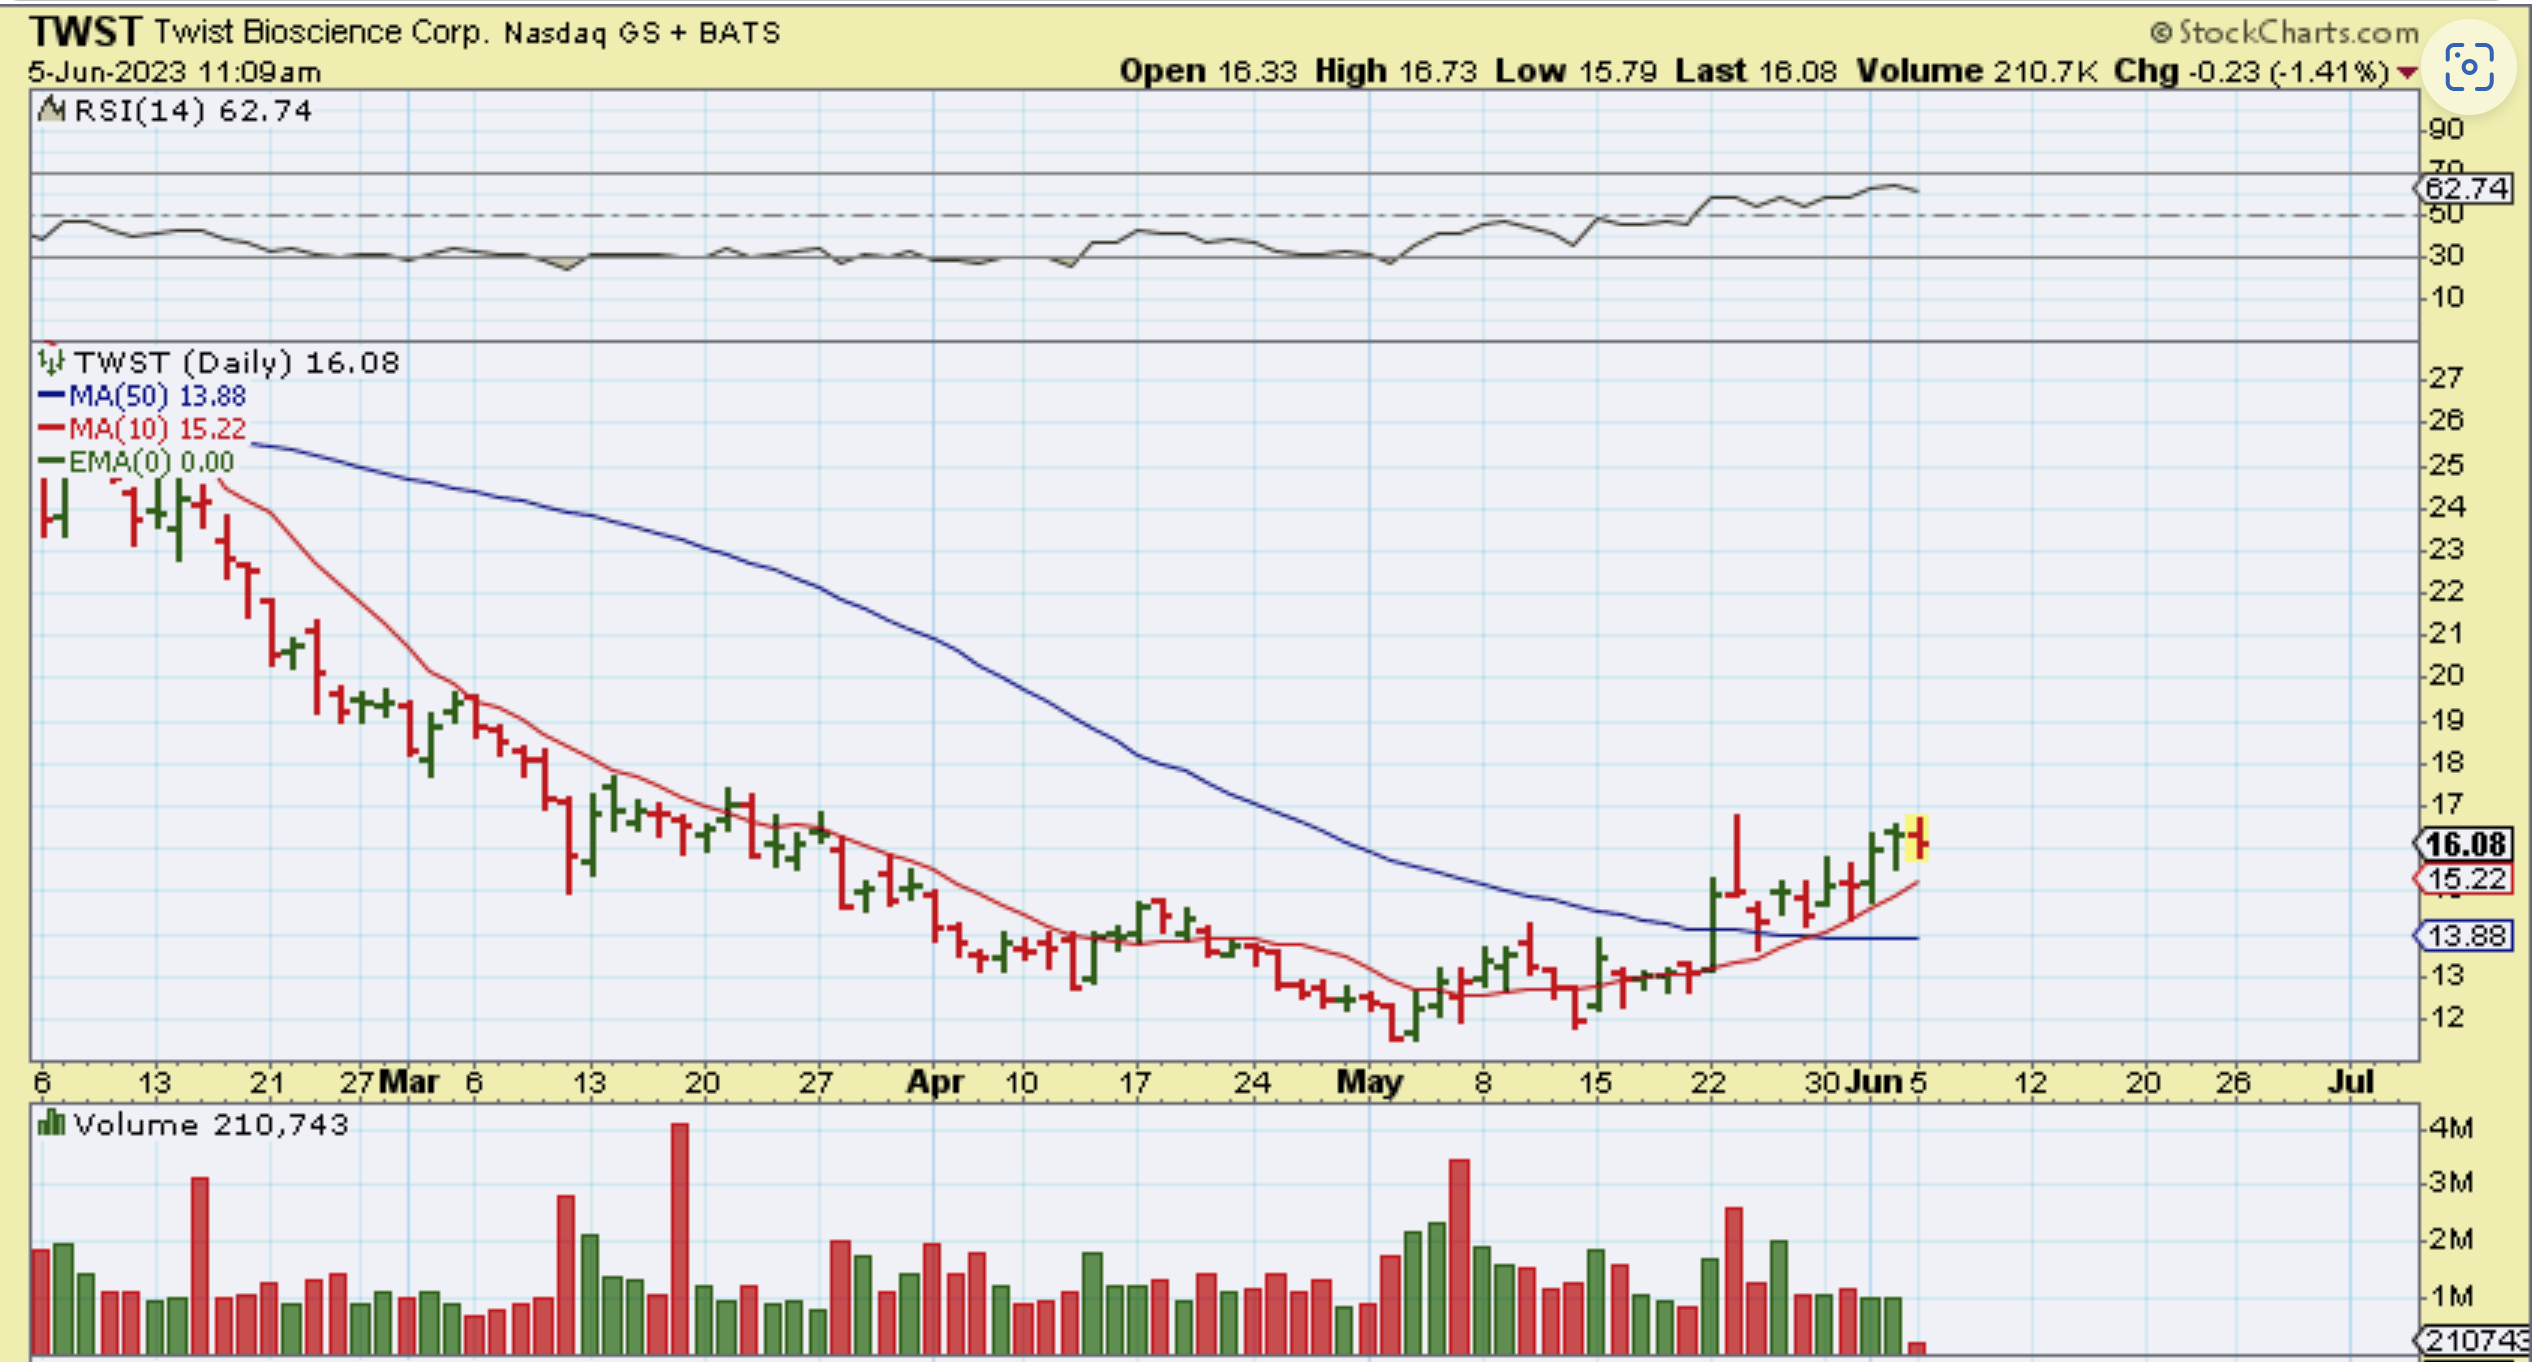
This is TWST and I had it a few reports when it was closer to the 50sma. I wish it had more volume, I ended up selling mine before the weekend hoping for a dip to the 50sma again, but this could just take off like ABEO and leave me behind. Let me say this: TWST has bigger moves than it looks. TWST has moved from roughly $11.50 to $17 in May.
.
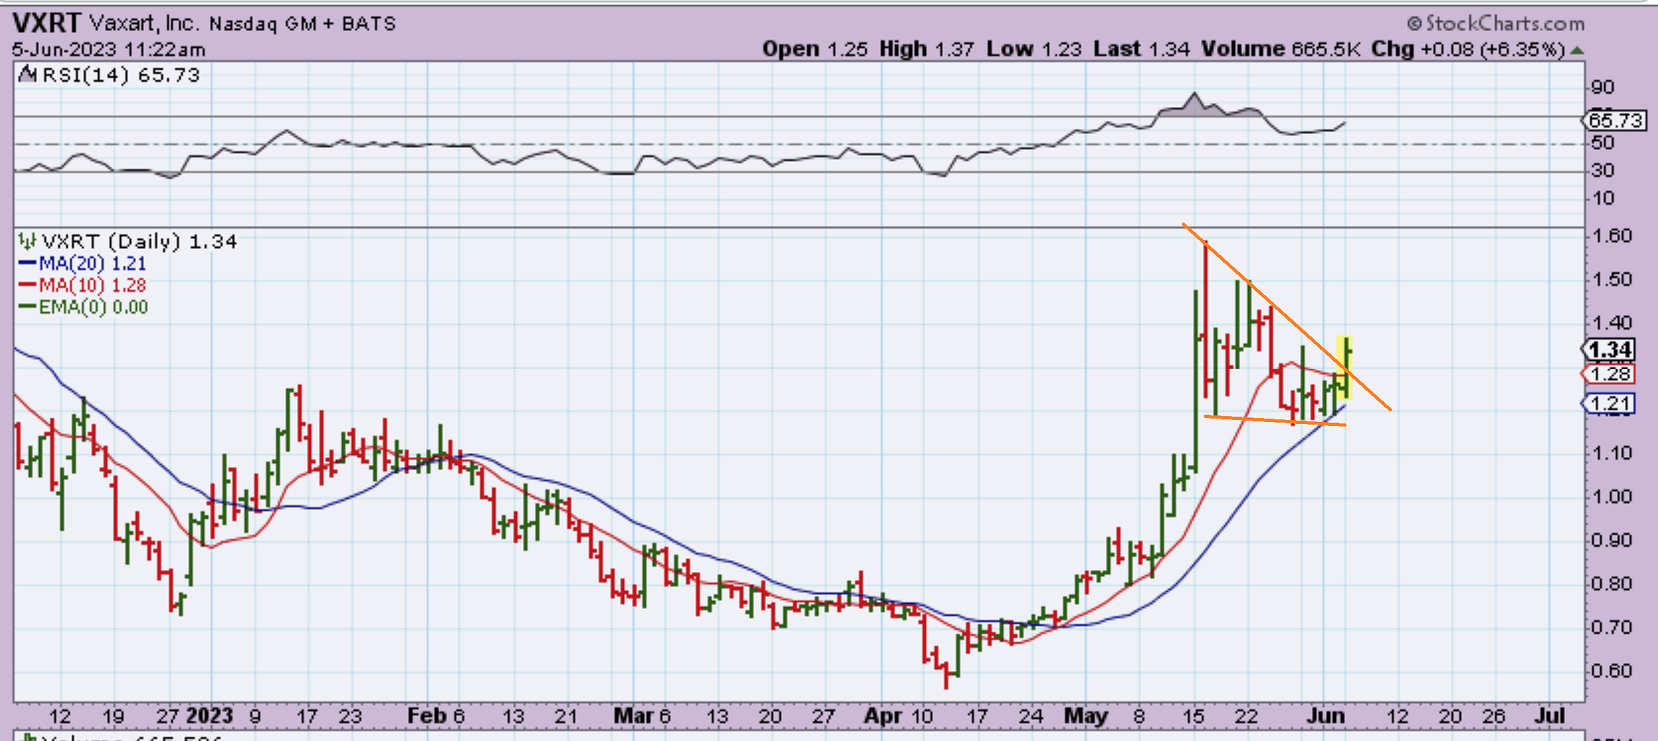
VXRT started to run higher out of a triangle pattern. It dropped back inside of the triangle, but I’d put this on a hot watch list- this could break out and run at anytime.
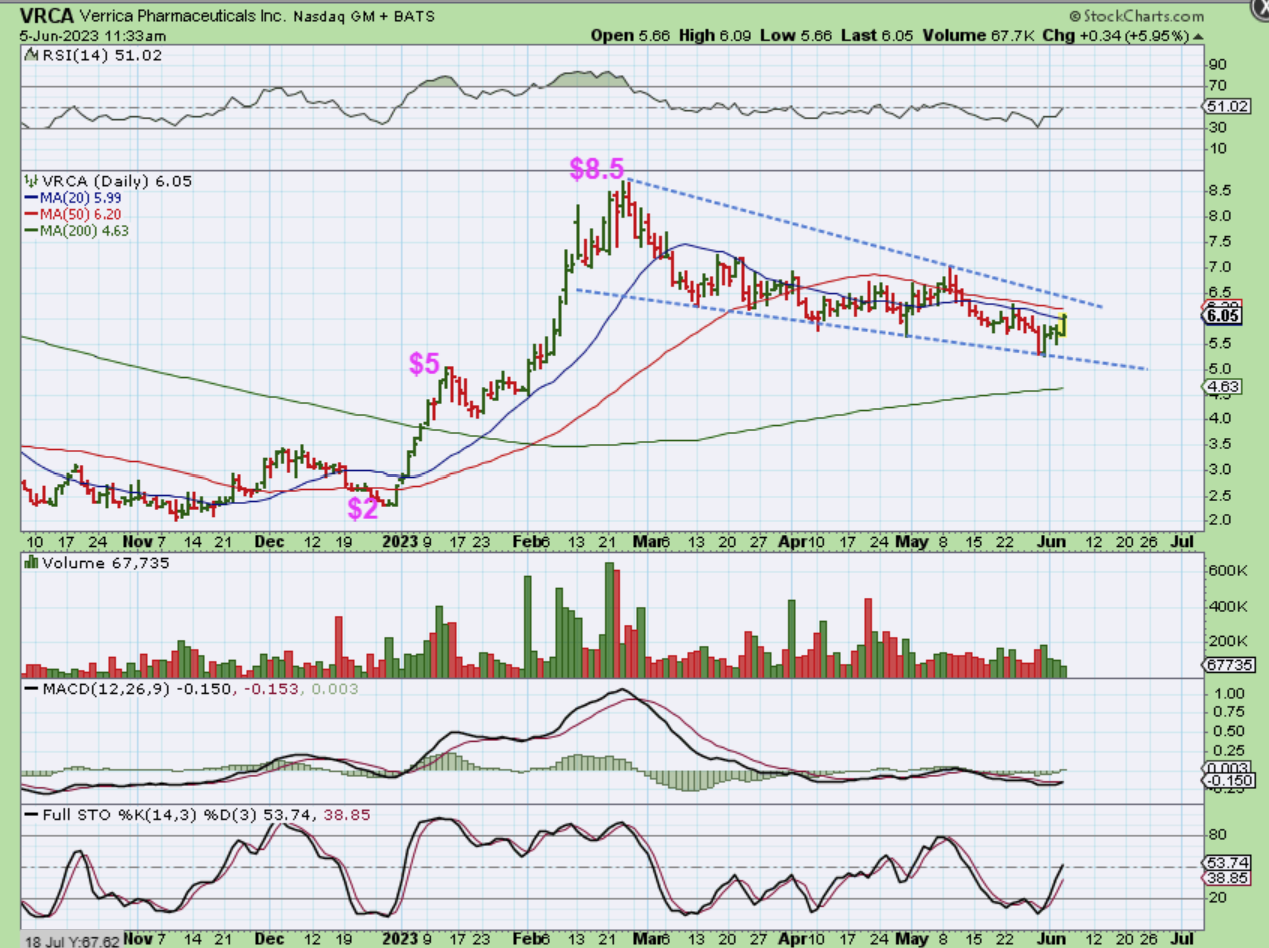
VRCA had a tremendous run from $2 to $8.5 in 2023 and has consolidated those gains for months. Watch for a break above the 50sma or the blue trendline.