June 4th Weekend Report
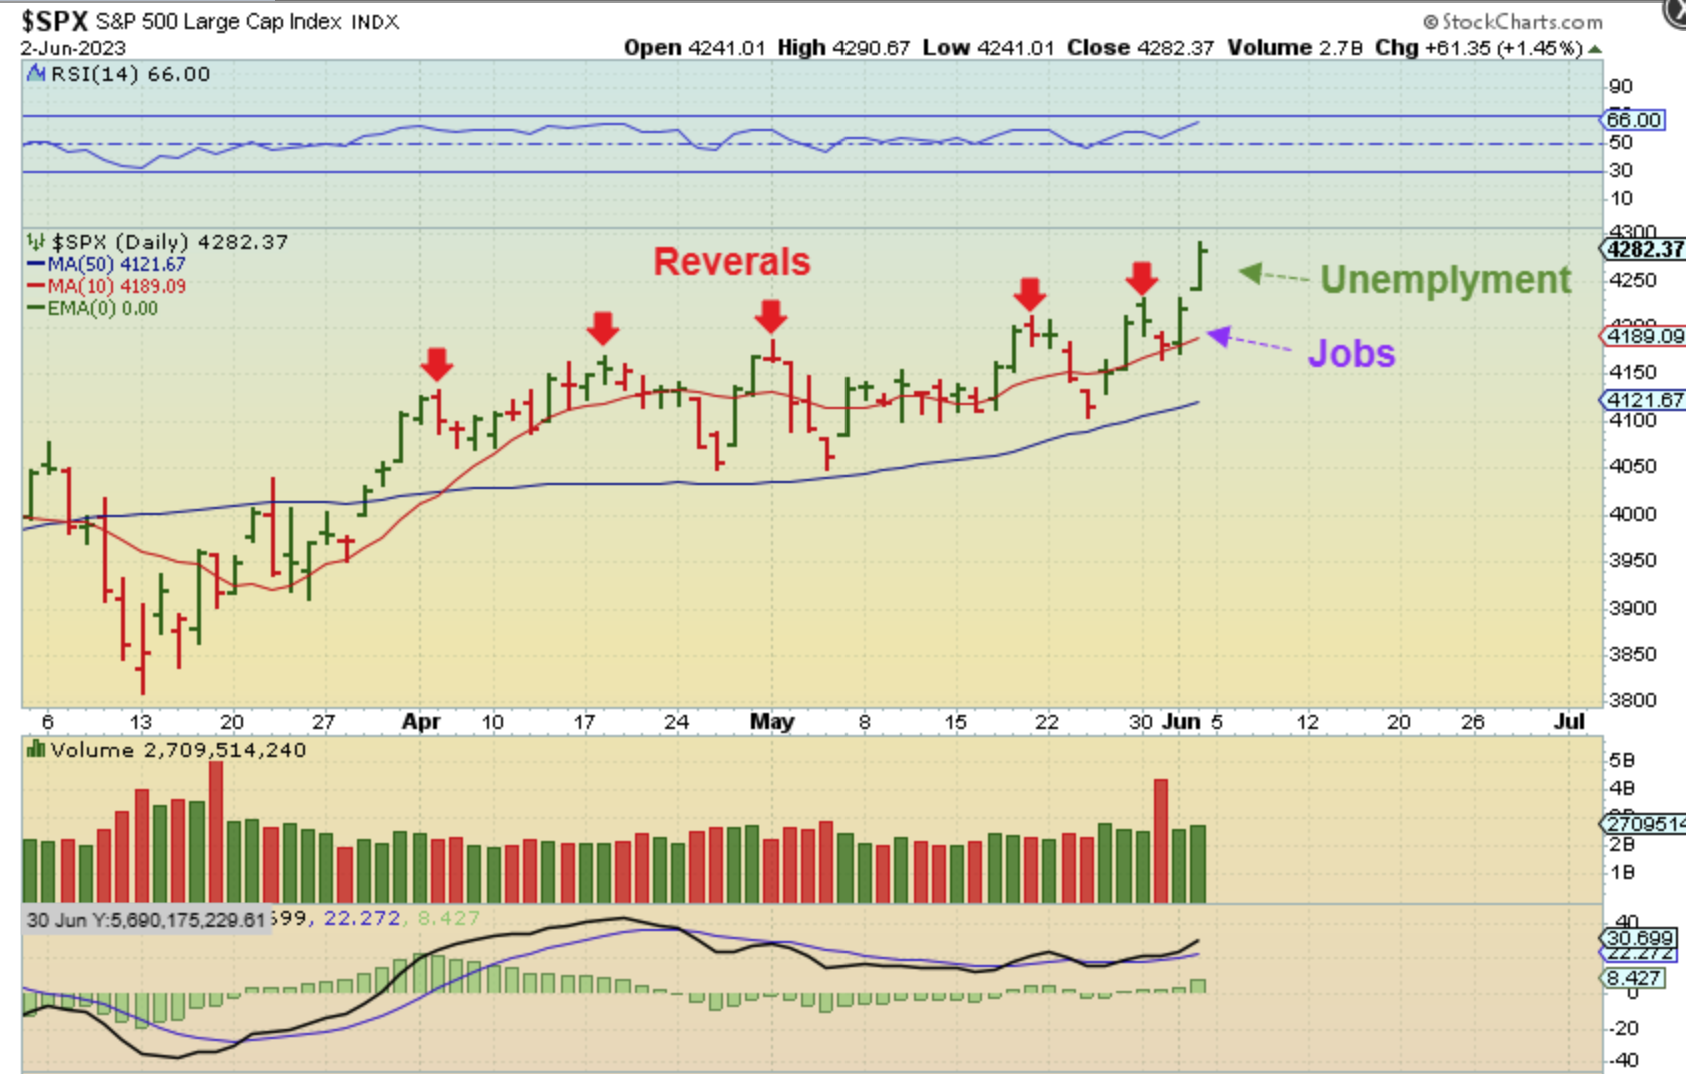
The General Markets got some good news with the Job Report Thursday and the Unemployment Report for My on Friday. They rallied and closed at the highs, so let’s take a look…
.
SPX DAILY – After chopping sideways for all of April and May, we have a break out and close at new 2023 highs.
.
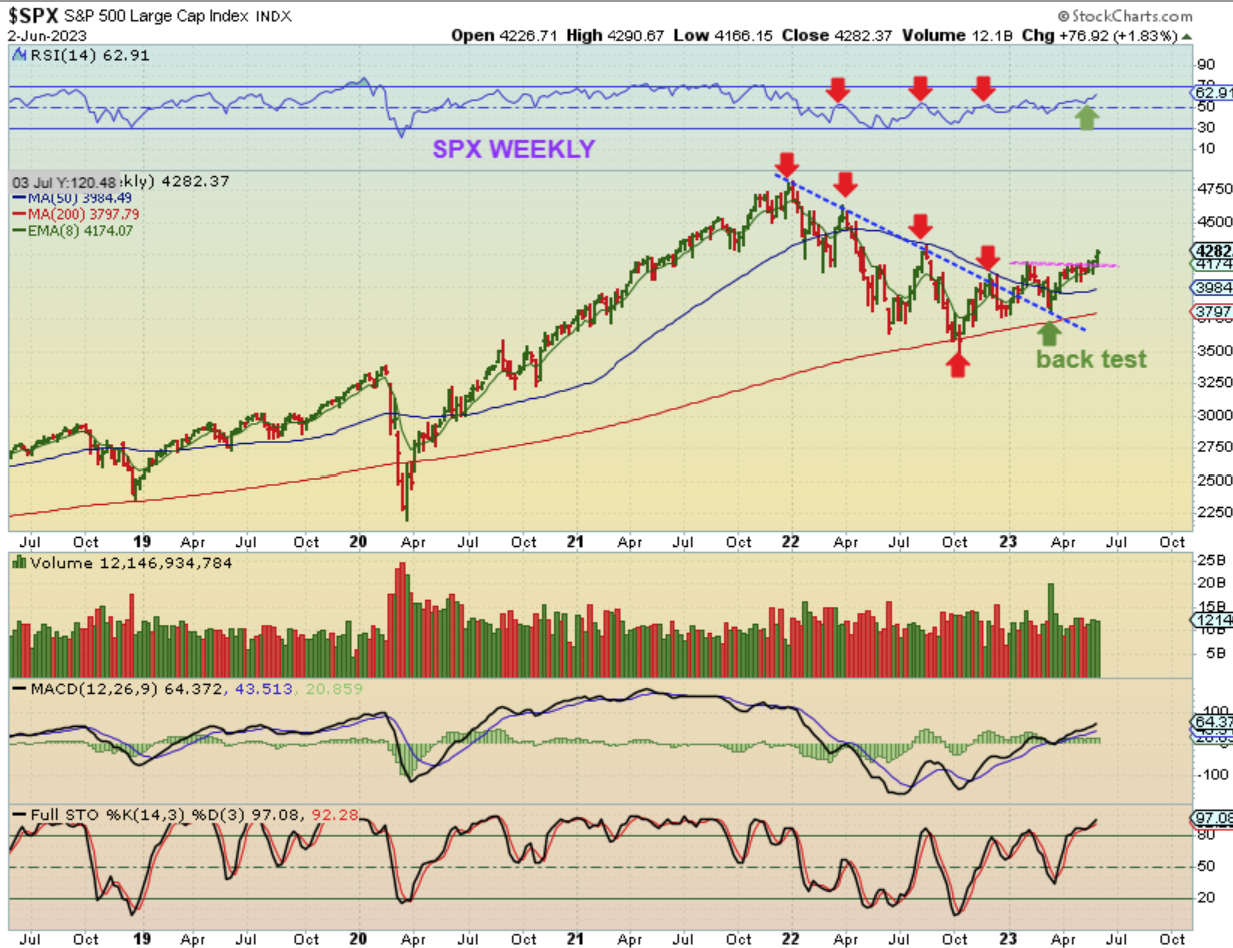
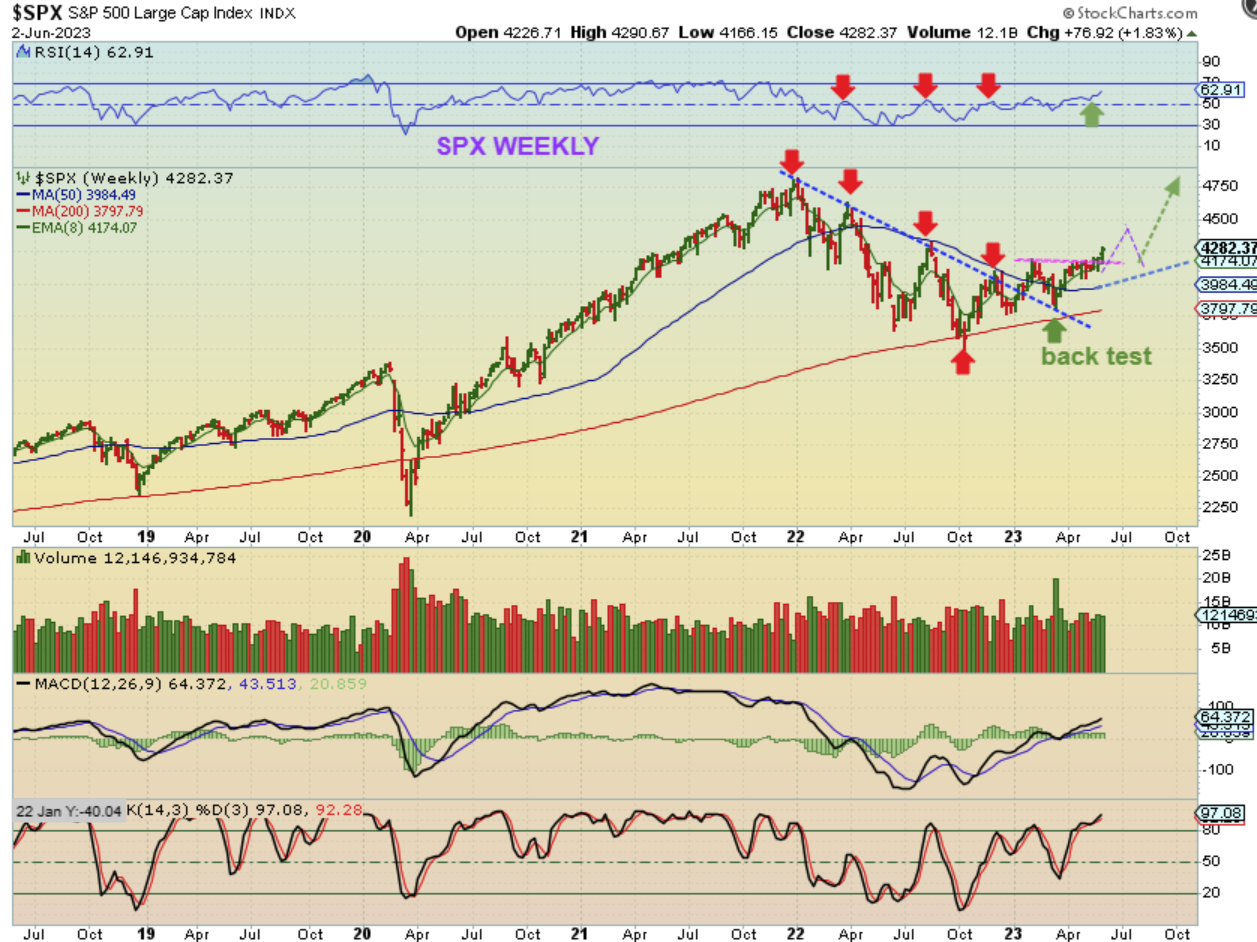
SPX WEEKLY – The weekly chart remains bullish after the 2022 bear market correction, and it is in ‘Recovery’ mode. You can see that we had a sideways stall at the lows over the past couple of months, but this week was a breakout from this base.
.
SPX WEEKLY – It can run higher, but a dip into a dcl is coming due. Maybe a back test?
.
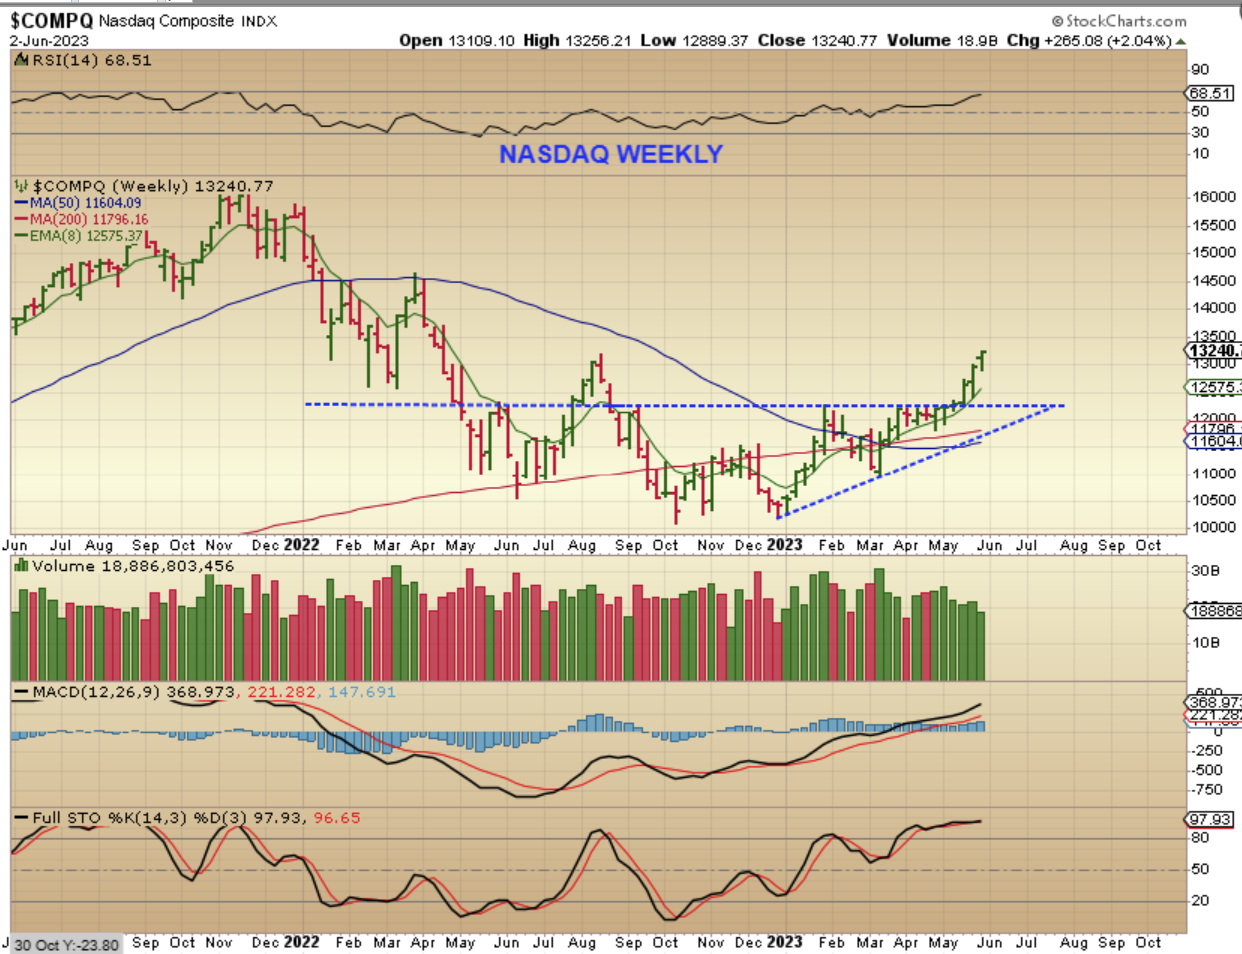
NASDAQ WEEKLY – The Nasdaq was choppy and lagging too, but began to accelerate after the NVDA / Semiconductors took off higher. The Nasdaq closed at the highs too, after breaking to new 2023 highs 3 weeks ago. The Markets are bullish, as discussed in past reports. Many Tech stocks are trying to recover and a few are at the highs again already.
.
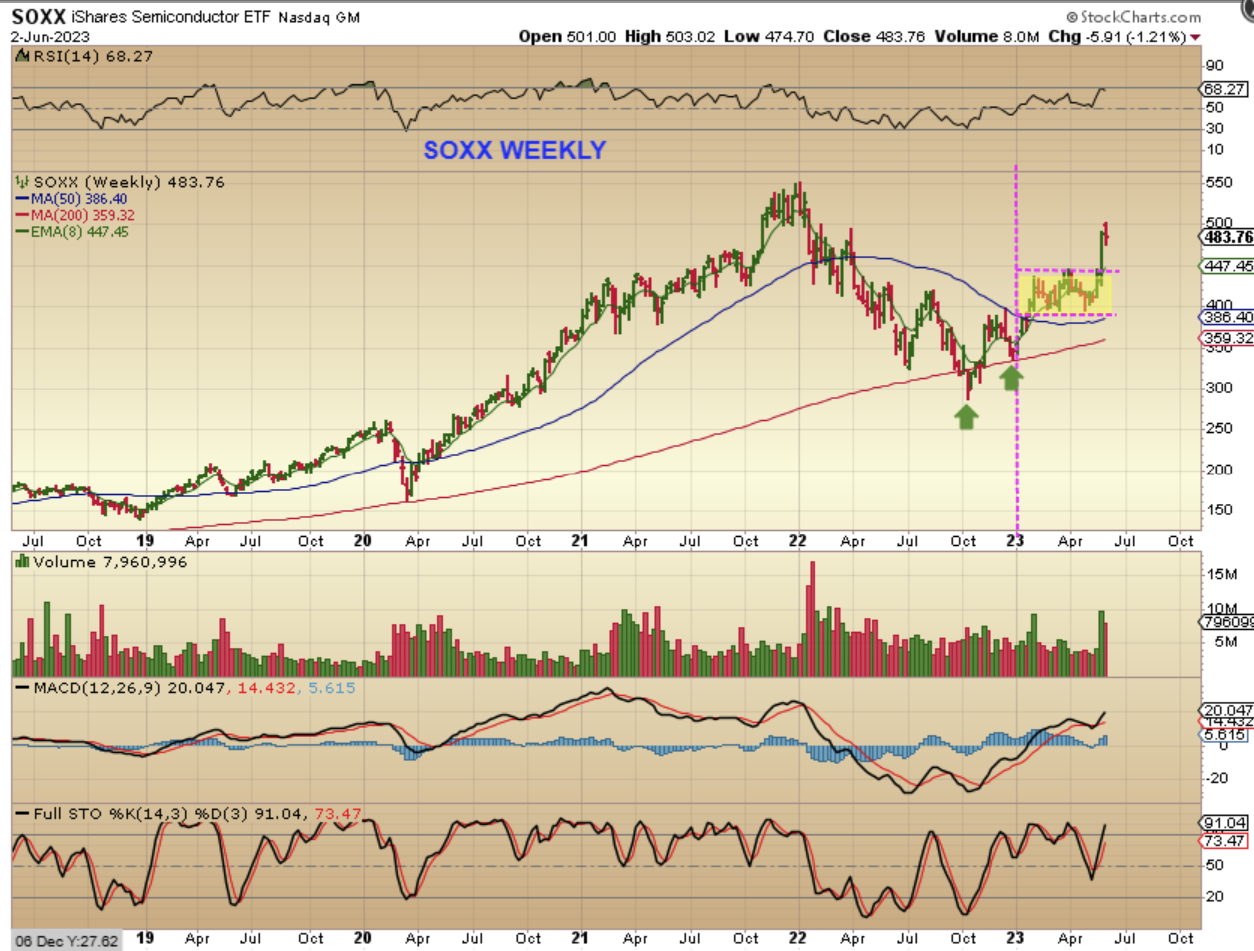
SOXX WEEKLY – The SOXX closed lower this week, but it already had an explosive move with the NVDA earnings last week. The SOXX chopped sideways for most of the year (2023), but it really broke out in a big way with NVDA. This also might back test if we drop into a dcl, and that should be a great buy opportunity for semiconductors.
.
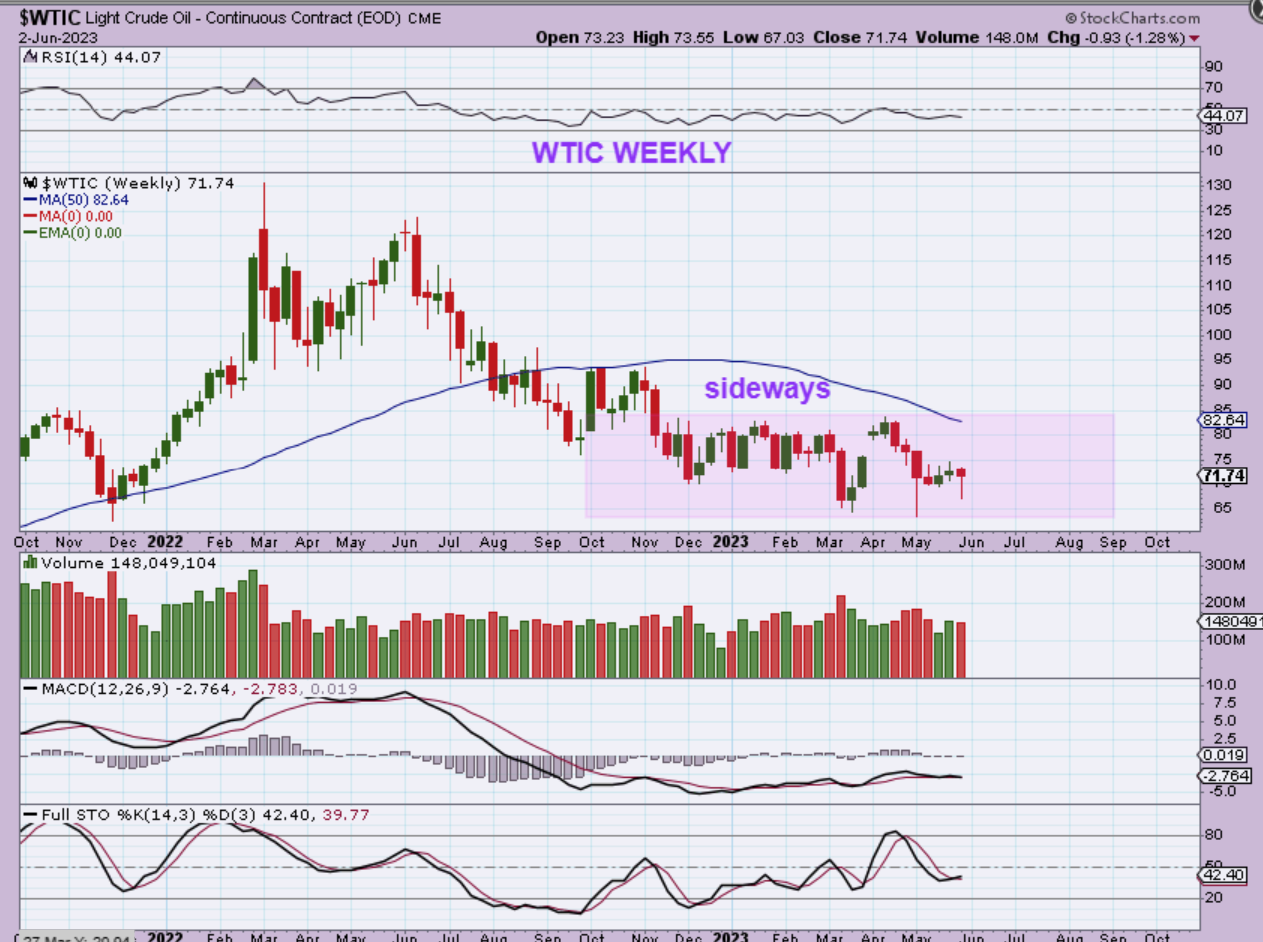
WTIC WEEKLY – Oil has been choppy and dancing along support in the bigger picture.
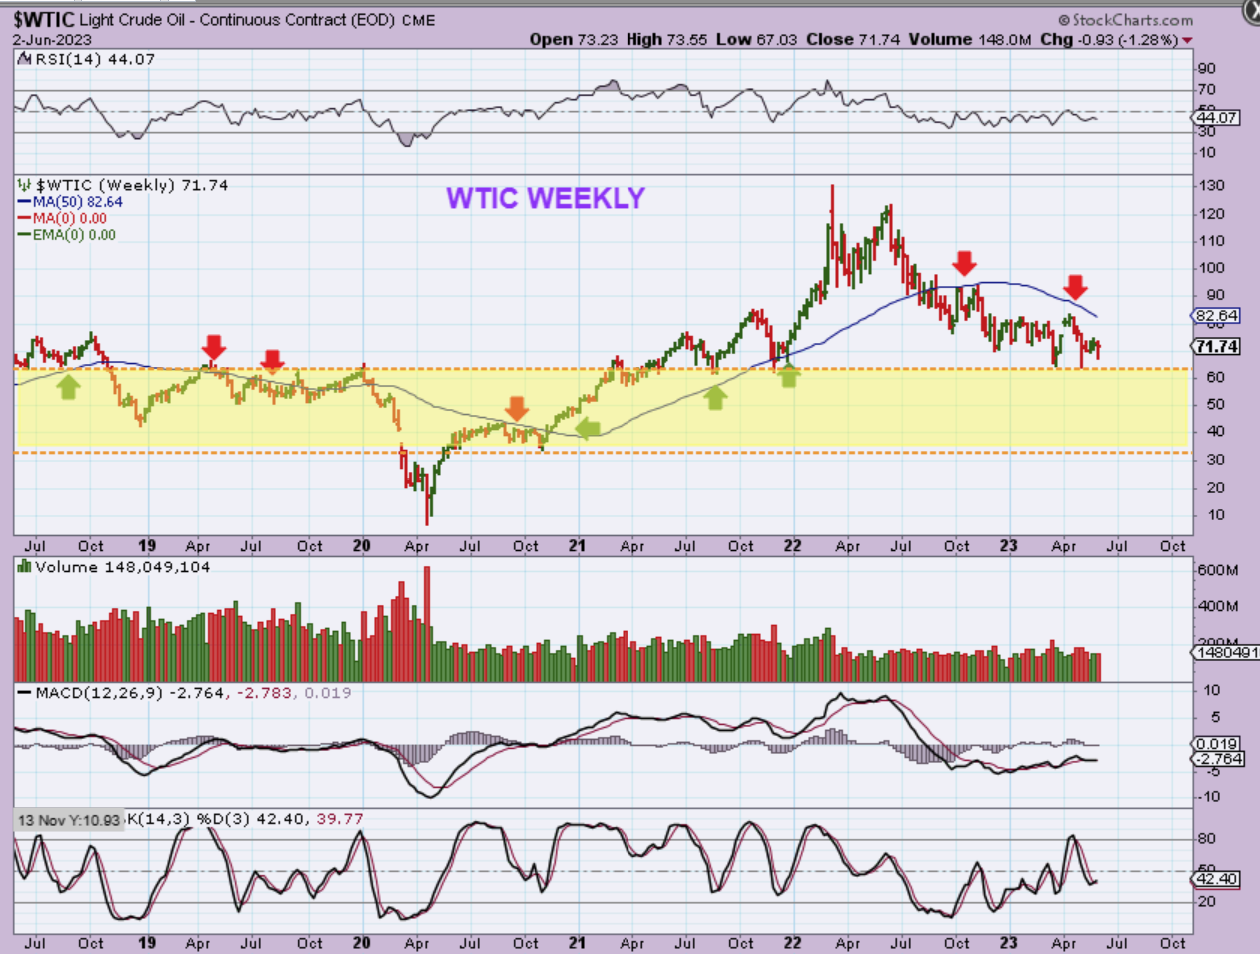
WTIC WEEKLY – oil chopped sideways for Months, so buying the reversals at the lows is a valid trade, but Buy & Hold has been a bust. I traded Oil stocks a couple of times but I made gains and gave them back after being stopped out in the chop, so I’m not going to trade it until I see a trend form.
.
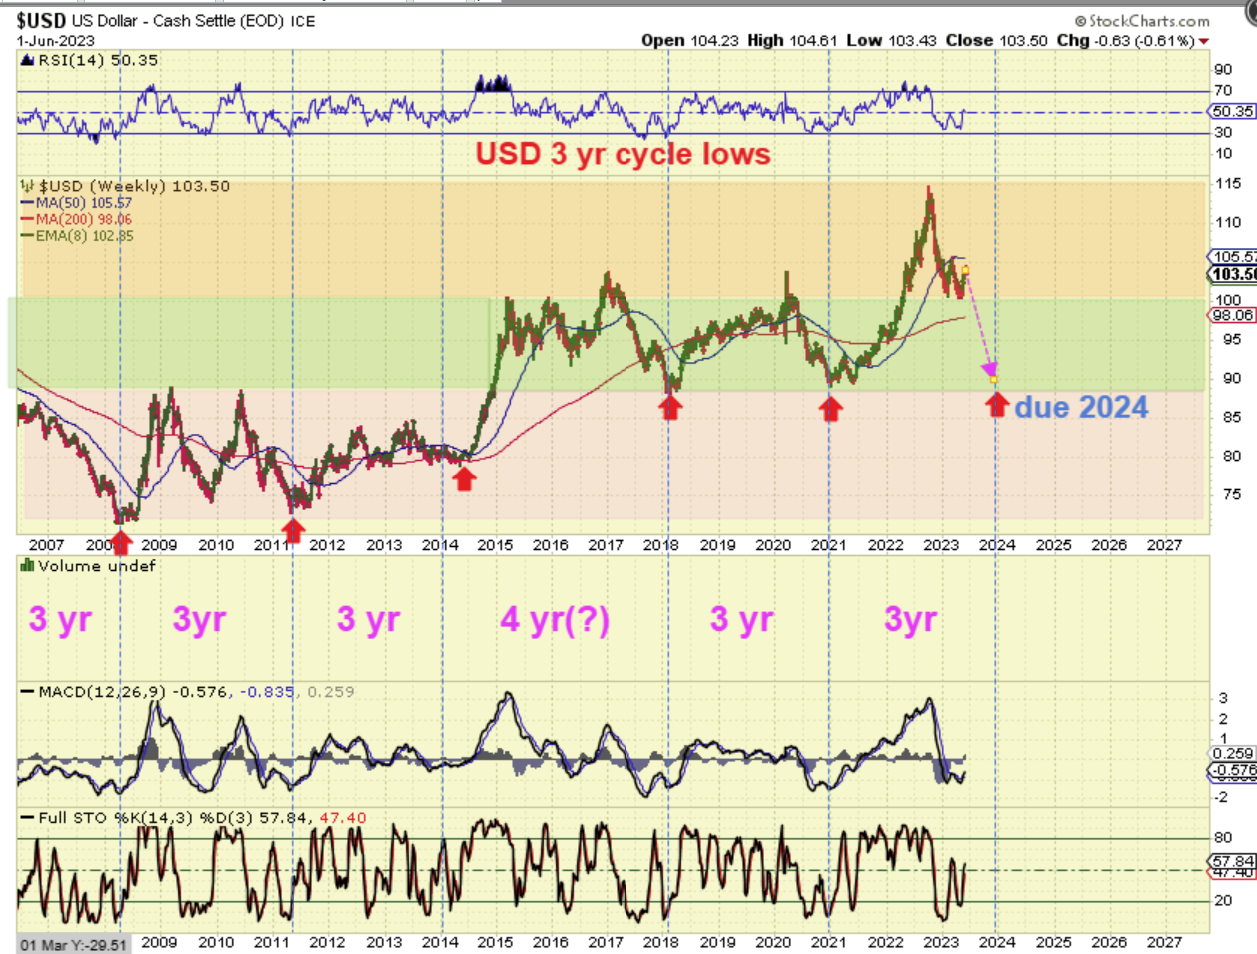
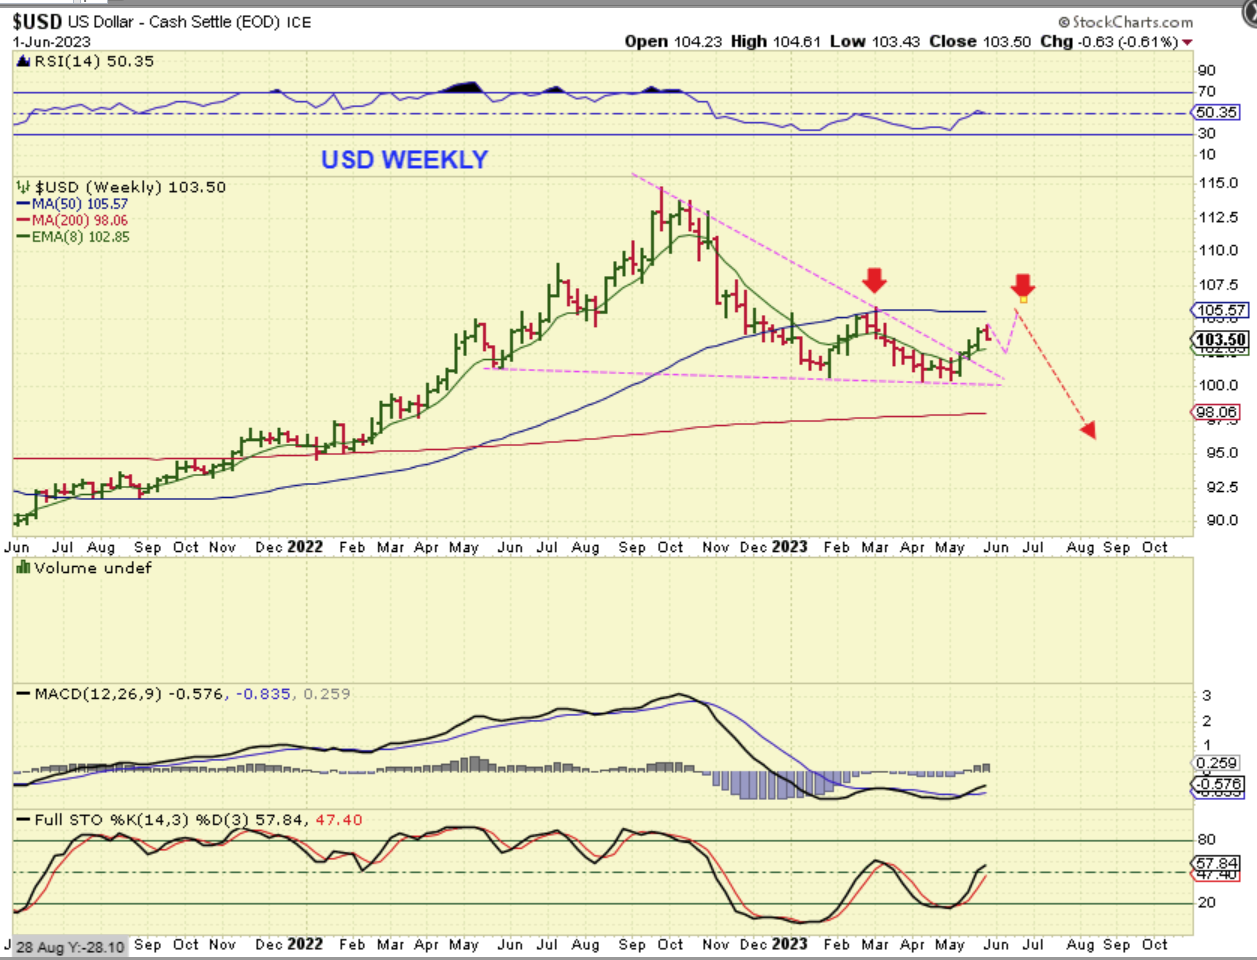
USD WEEKLY – So I have been saying for a year that I am watching the 3 yr cycle lows and
1. One is due in Jan 2024, so this chart below is what I have been saying that I expect for a long time.
2. I am expecting a 2nd leg down after this recent bounce.
3. Let’s look at this set up of the 3 year cycle lows a bit closer…
.
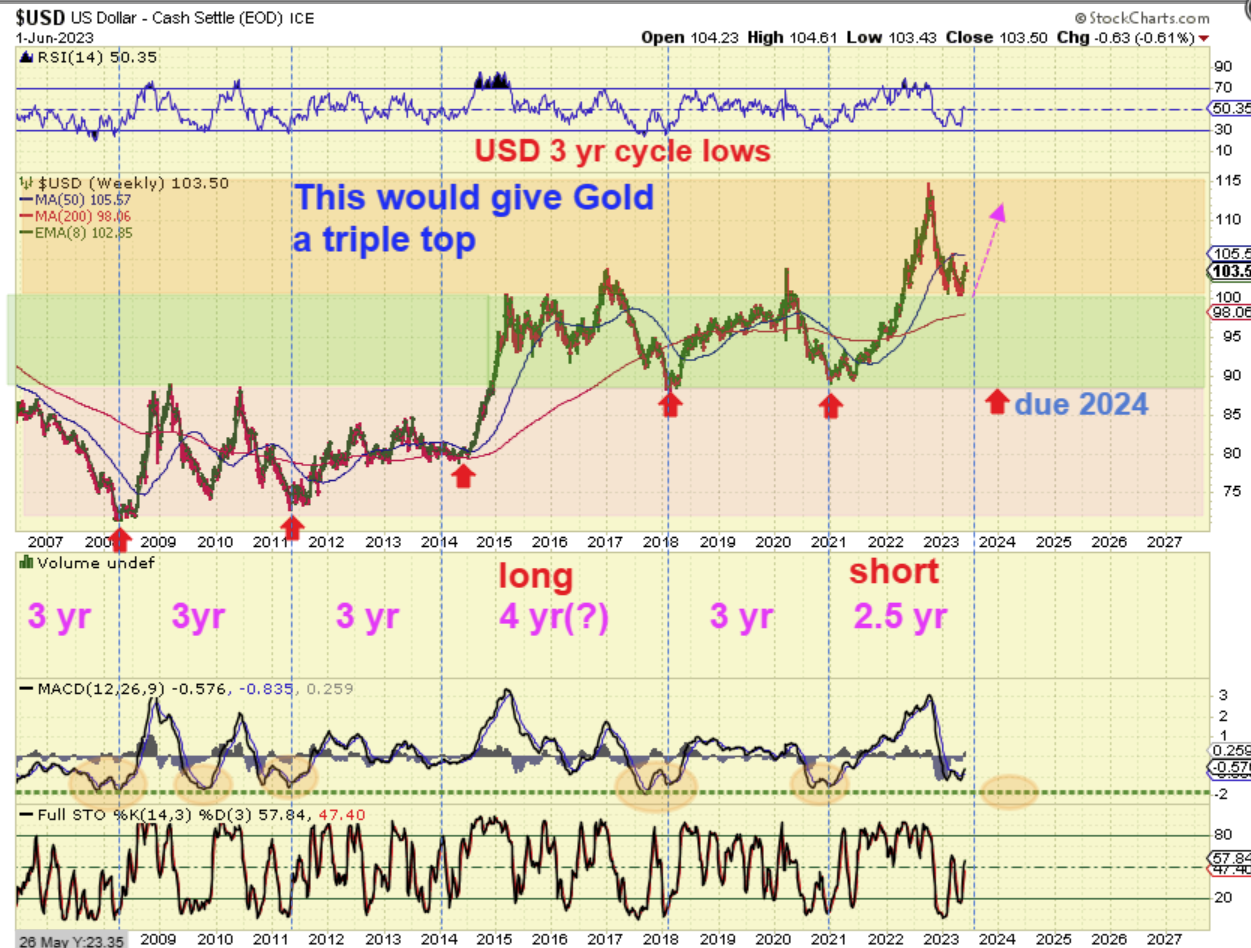
Let’s look at this set up of the 3 year cycle lows a bit closer…
,
After examining the 3 year cycle lows, I came up with a 2nd (Less likely) Scenario and mentioned it in the reports. Now I’ll show you why I came up with that as something that we do need to at least keep in the back of our minds until the USD begins to drop again and breaks the midpoint lows.
.
USD WEEKLY – The 3 year lows are VERY reliable, even going back further than what I have hear starting in 2007. You can count the 3 yr gaps easily, but please notice that we do have one period that ran from 2014 to 2018, and then got back on track. That gave us one 4 yr cycle low to low (long). I have wondered…
.
I have wondered,… “With all of the Fed manipulation, Excess Rate Hikes, and so on, could we get an earlier 2.5 yr low right now to offset that 4 yr long one?” If we could and do, then the USD could put in a 3 yr cycle low right now shy of 2024 and give Gold a triple top. THIS IS NOT VERY LIKLEY, and haven’t I been calling for the USD to top since last summer and calling for the Lows in the USD to be 2024 all along? I see no real reason for that to change, except for maybe the Fed actions, but it should be better to have that in the back of our minds than to be blindsided by it if it were to happen. So for now…
.
For now I am still expecting the USD to possible peak on the next daily cycle at or near the 50 week ma again, like we saw in March, and then roll over giving Gold a Bottom to push higher from and break out to new all time highs.
.
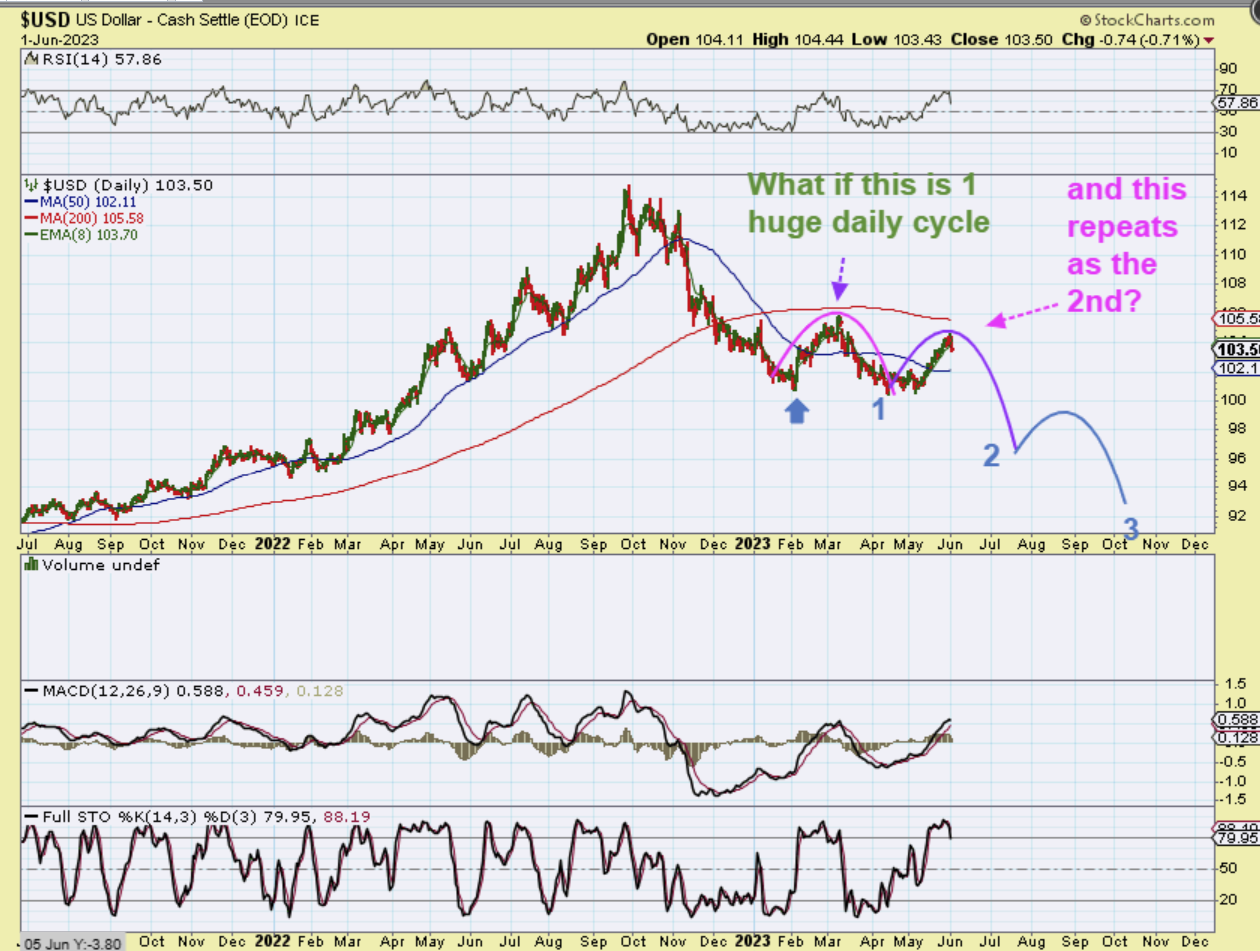
LAST WEEK I ALSO MENTIONED THIS FOR THE USD: That rally in March was an anomaly due to the Bank Failure. What made it different?
It rallied higher for a long time to a peak and then rolled over and dropped for a long time too, even breaking those February lows.
1. What if we see that as all one LARGE daily cycle from the blue arrow to the #1?
2. This could now be the 2nd LARGE Daily Cycle that also just peaked and rolls over to a new low. In that case, Gold would have 1 large daily cycle out of the March lows too and we’d possibly be starting the 2nd daily cycle now.
.
NOTE: The action that we saw when the Banks collapsed in March, along with all of the Fed Rate Hikes seems to have blurred the clarity out of cycle set ups, but the Technical Analysis side is still perfectly bullish, so we do want to keep that in mind. Try to picture it this way, Cycles make it so that we are trying to ‘count the time’ of the normal rhythms of the markets. These are not normal times for the markets, and we need to take that into consideration. I am always the first to say that ‘timing’ can be thrown off by outside interference. If you have ripples in the pool and someone throws a rock in, what happens to those normal ripples? But after the initial splash & disturbance ebbs away, the set up should remain the same if nothing has changed fundamentally.
.
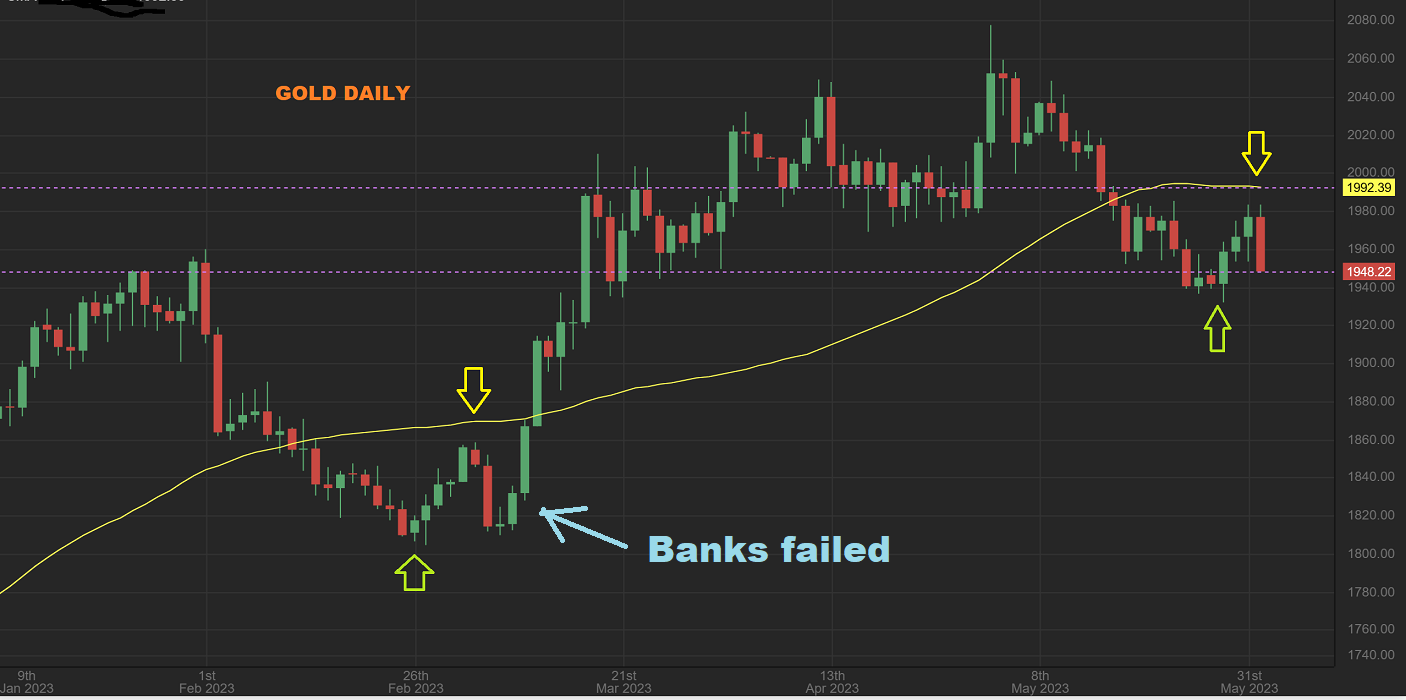
GOLD DAILY – All I can say is that at this point, Gold looks very similar to that March sell off that I was calling for an ICL when the Banks suddenly failed. Back then I was expecting the selling to continue and we’ll see if we get that this time.
.
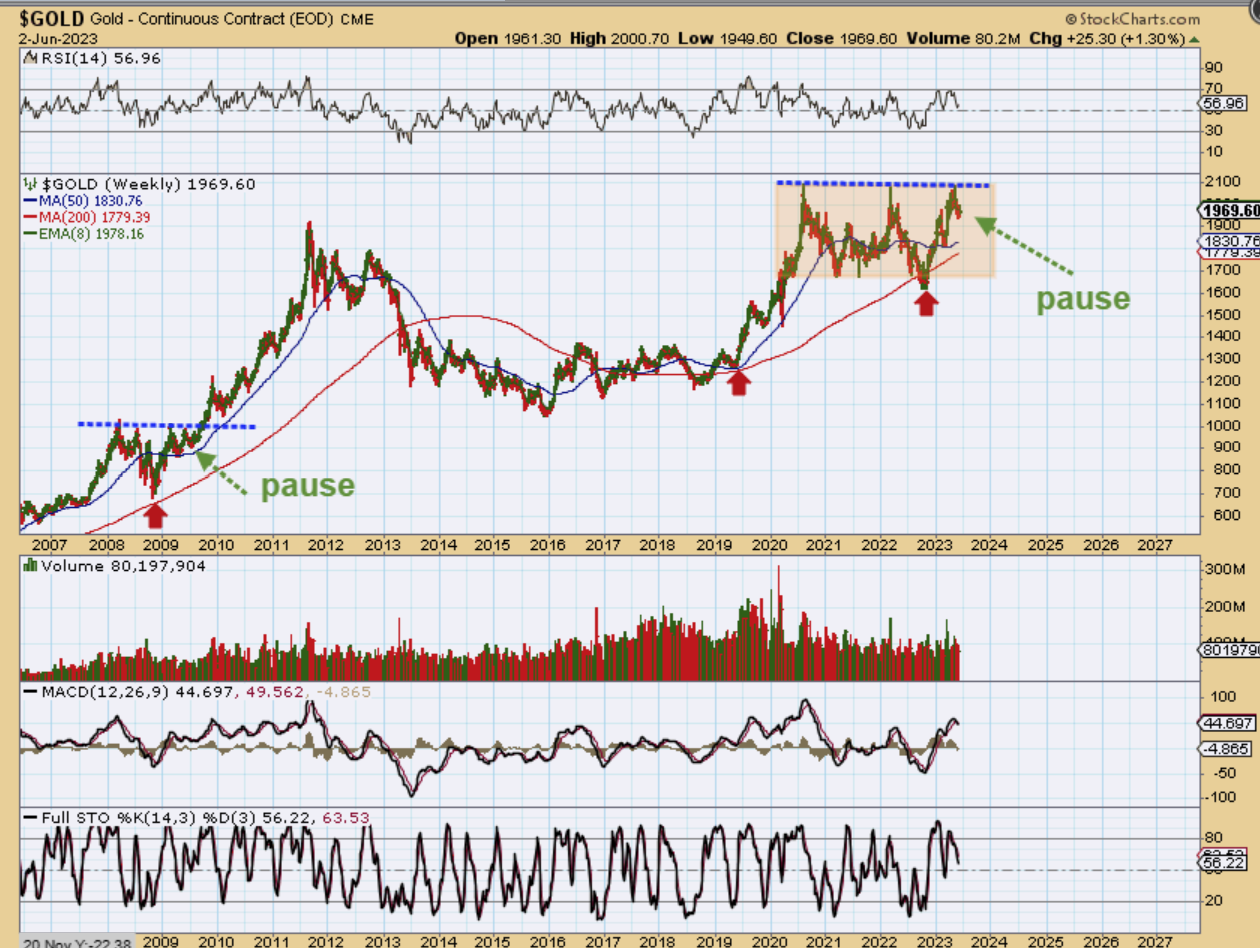
Let’s compare this prolonged sideways consolidation in GOLD to the one in 2008. When price returns to the highs and prepares to break out, it usually builds energy by pulling back, pausing, and losing favor. People also start to short the dip and when it starts to run back to the highs, they have to cover and the breakout can accelerate. Take a look at the breakout and run from that 2008 consolidation. We are expecting that, so…
.
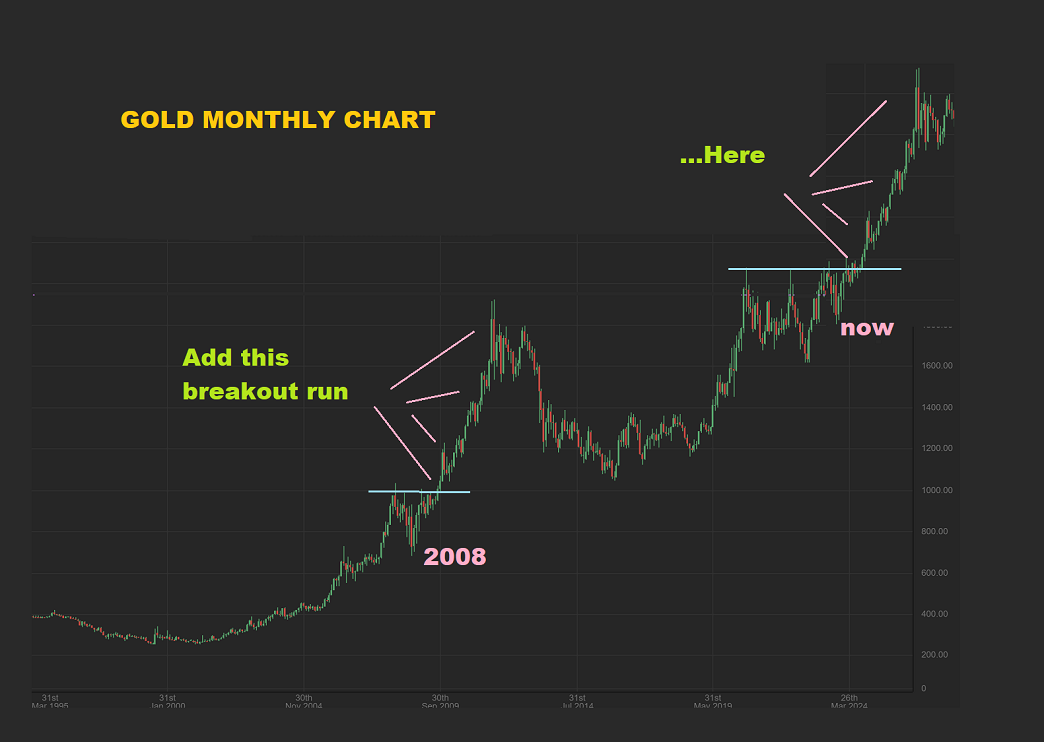
GOLD MONTHLY – Here I added the breakout from 2008 to the current set up and this is what we get with the same bull run higher. This pause and pullback that we are currently seeing will be a flickering memory if this happens.
.
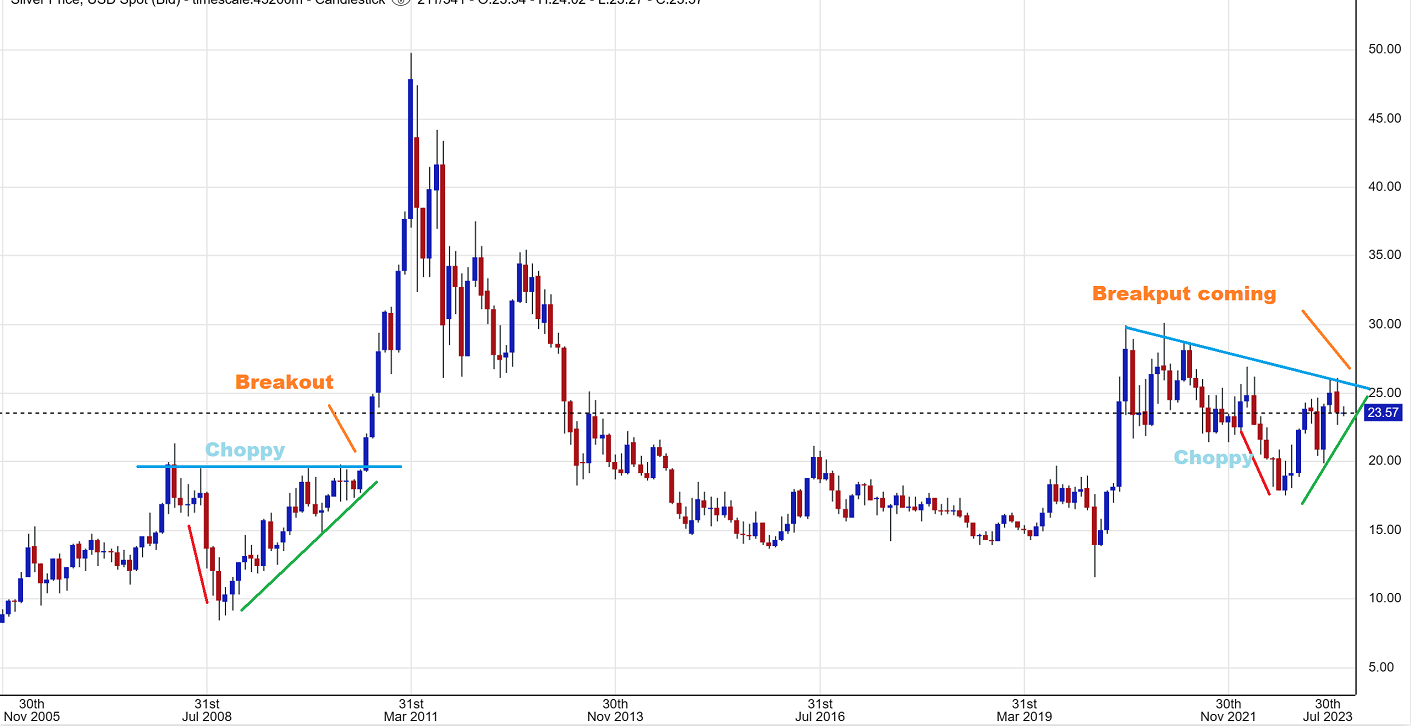
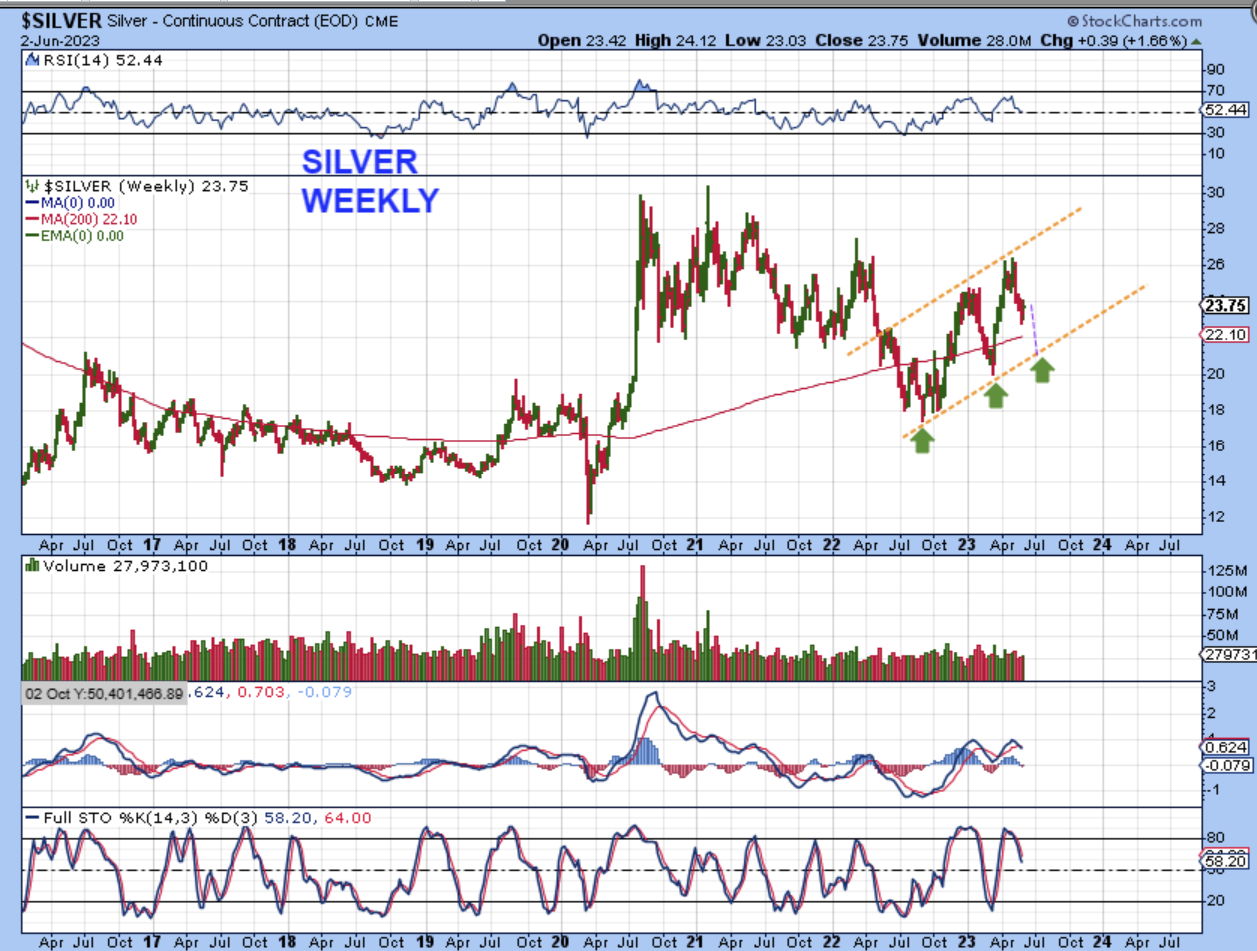
SILVER MONTHLY – All I want to point out here is that when Silver puts in a large choppy consolidation similar to what we saw in 2008 (again), it then broke out and shot straight up. We want to be ready for a breakout in Gold and Silver if that is what we are going to see, because the reaction after a breakout like that can be special.
.
SILVER WEEKLY – As for the weekly view, we were seeing price reacting around that 200 week ma in 2017-2020 and now price is near that 200 week ma again. Will that act as support? Or will silver drop to the $21 area at the bottom of the channel? We’ll see, but Silver is not oversold and the USD should bounce too, which can send Silver lower.
GDX – The weekly chart looks to be near support at a horizontal trend line and an upsloping channel line, but the Stochastics is not oversold, so this may pause and then sell down lower too. That said…
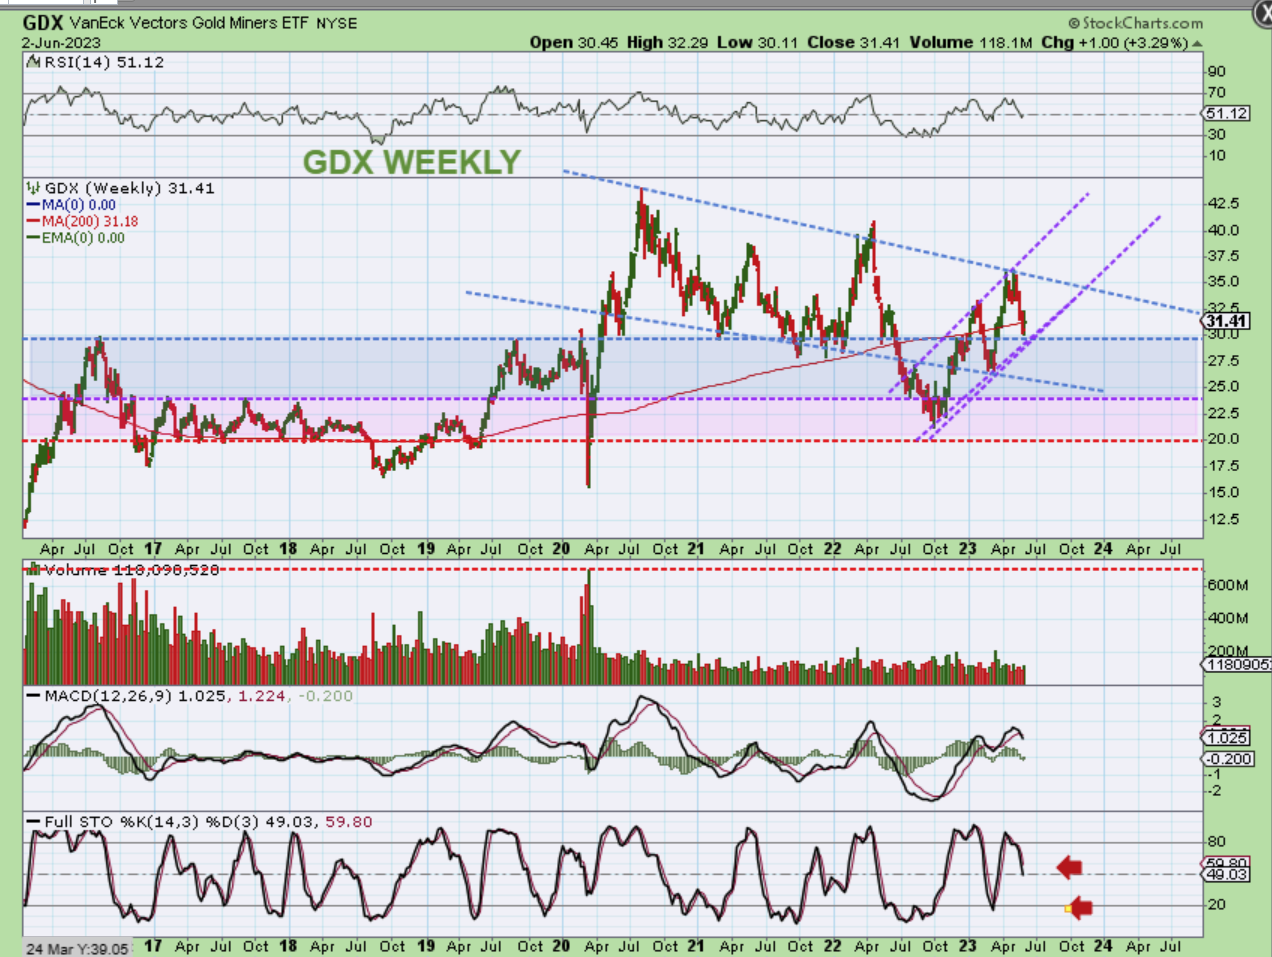
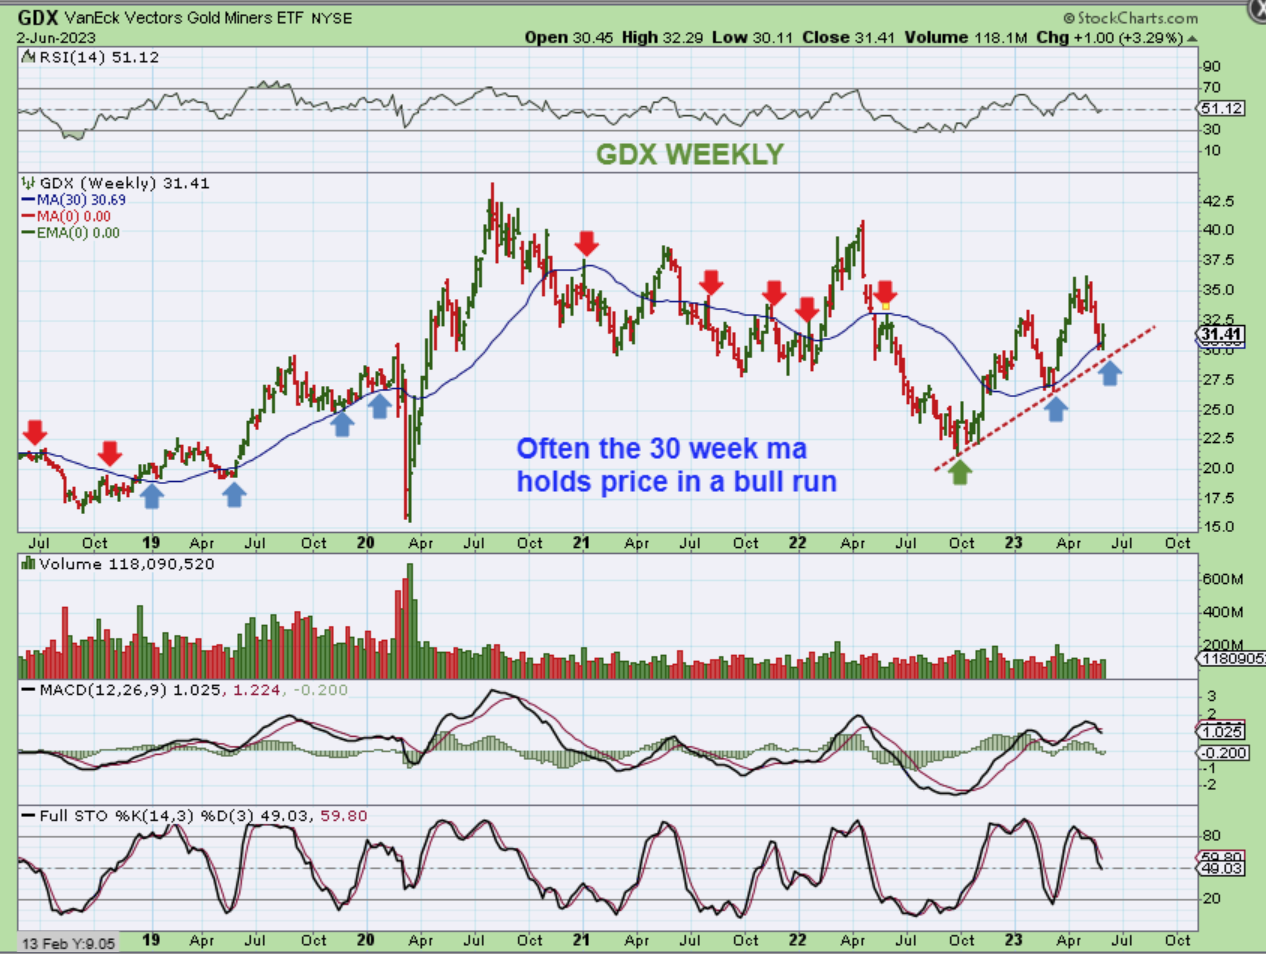
The 30 week ma is often a level of support and price has reversed there in March and this week, so now we have to see what happens at this bounce. I honestly feel that the USD will bounce again soon, and this will drop one more time. The stochastics is not oversold yet.
.
All of the set ups remain bullish, even the ones that are pulling back like Gold. I will discuss Bitcoin below, and that does remain long-term bullish too. Enjoy your Sunday and thanks for being here at Chartfreak!
.
~ALEX
.
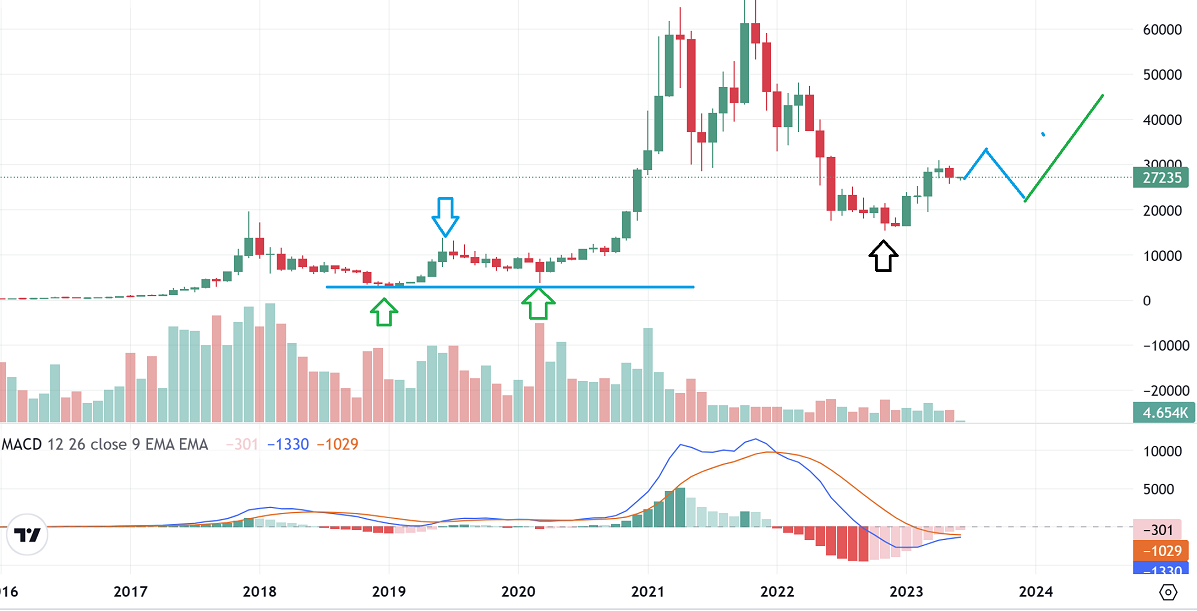
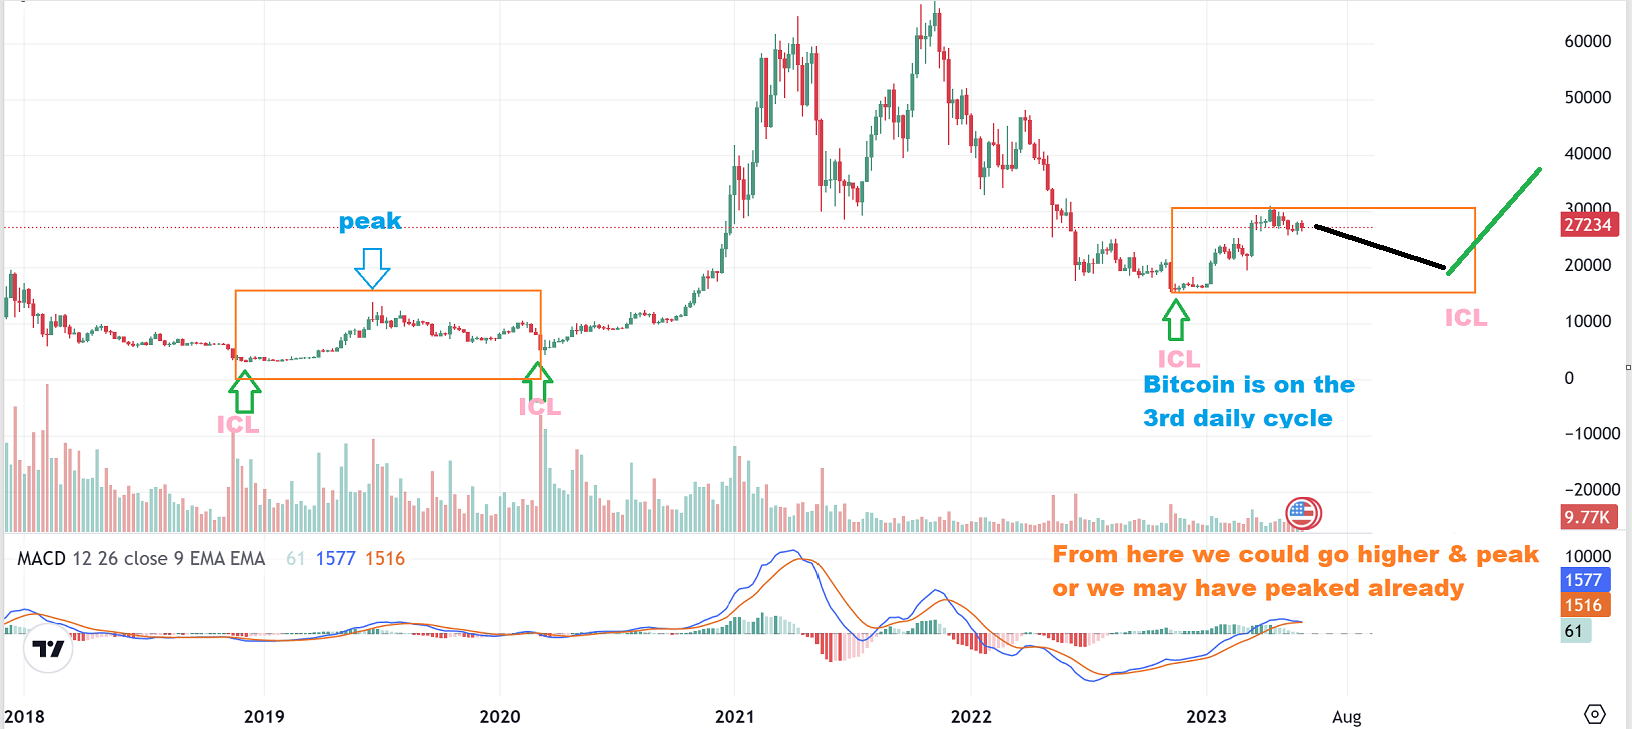
BITCOIN – I have been saying in my weekday reports that we are in the 3rd daily cycle, so what that means to me is that…
1. Bitcoin can run higher, peak and drop into the next ICL over time, or
2. It may just remain choppy and start to roll over sooner than later, so it needs to be monitored during this current period of choppiness.
3. I still think that Bitcoin bottomed and this is a bullish set up. Let me show you visually the ideas that I am thinking of with this 3rd daily cycle…
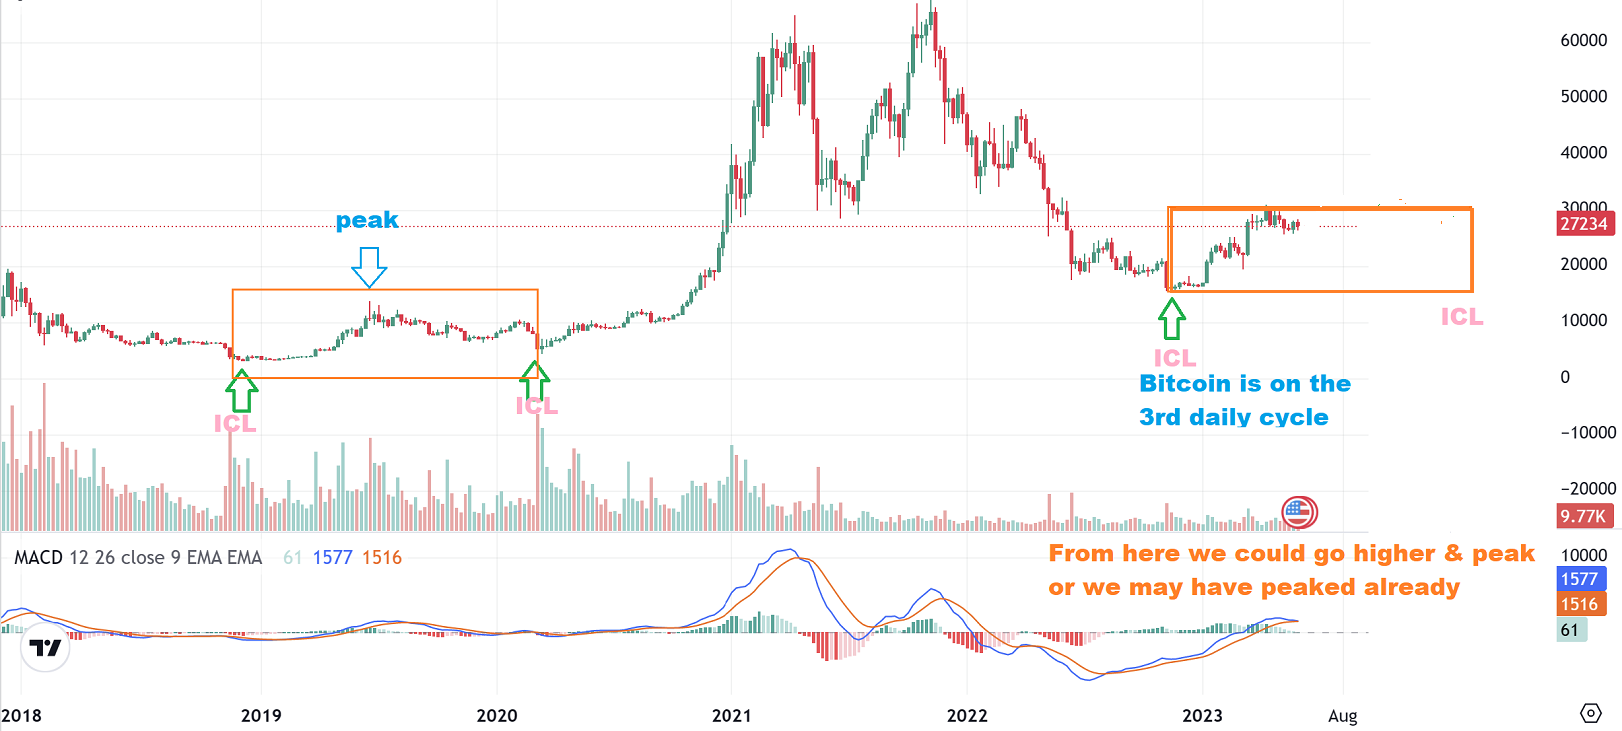
BITCOIN WEEKLY #1 : This would be Bitcoin remaining choppy and already having peaked in this intermediate cycle ( or peaking in the very near future in this 3rd daily cycle). It is still bullish long term. You can see that this gradual chop lower is similar to 2019-2020 (orange box).
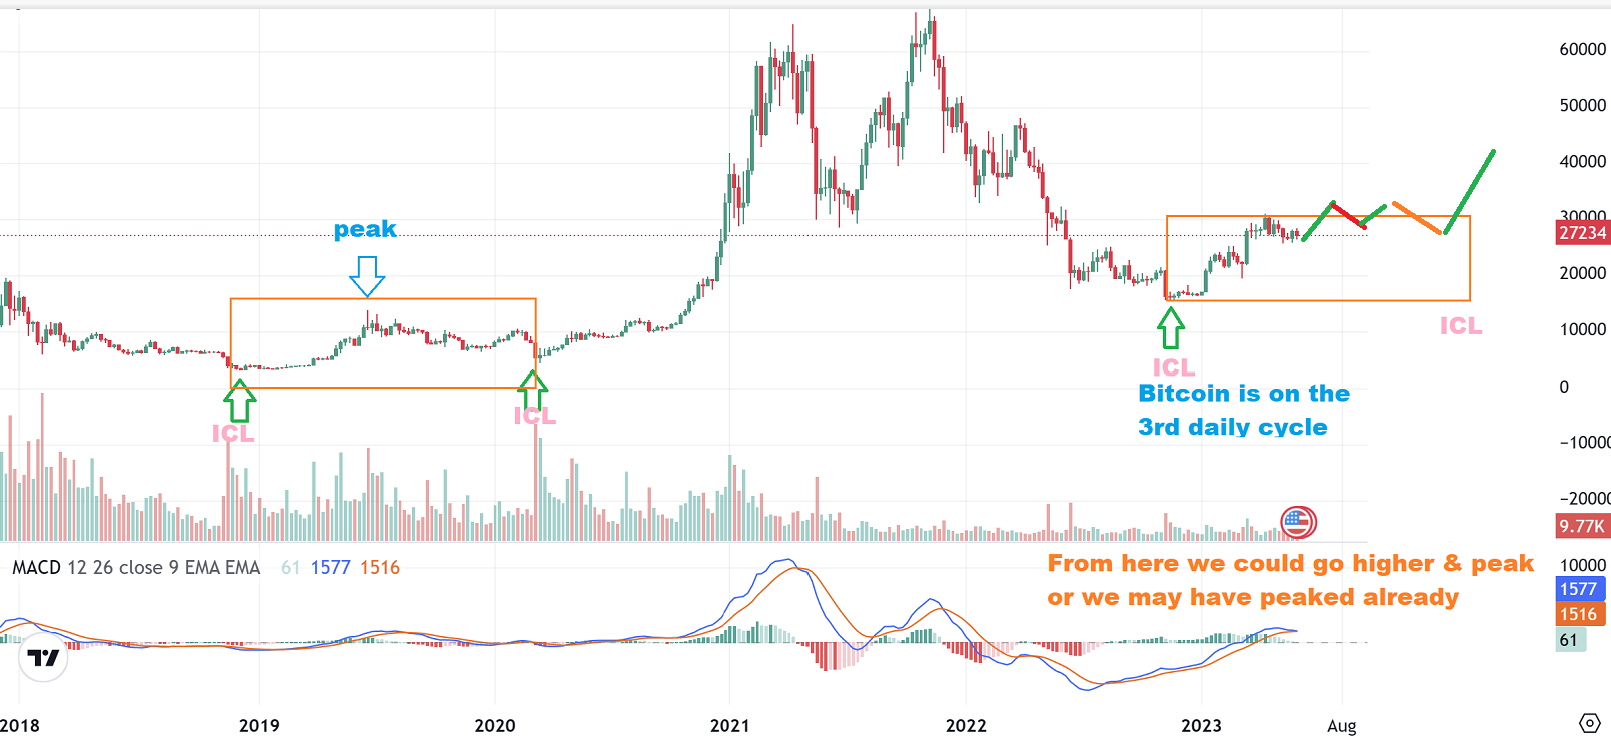
BITCOIN WEEKLY #2 : This idea is with Bitcoin still able to push a little higher in this 3rd daily cycle, then putting in a peak and gradually rolling down into the next ICL.
BITCOIN MONTHLY – So here we have the Monthly at the end of May. We have moved out of that low and again, it can go higher and then dip into an ICL, or it may continue to chop sideways, dip later, and then rally strongly later out of an ICL. The 2019-2020 run peaked after 5 green candles and we are basically at that point now.