Wednesday May 31st
At the end of todays report I want to briefly discuss how some stocks are set up to run higher. From time to time, I want to spend a day (or report) focusing on some bullish stock set ups a little more and the indexes a little more briefly. Today however, we’ll have our normal review following a 3 day weekend in the U.S.
.
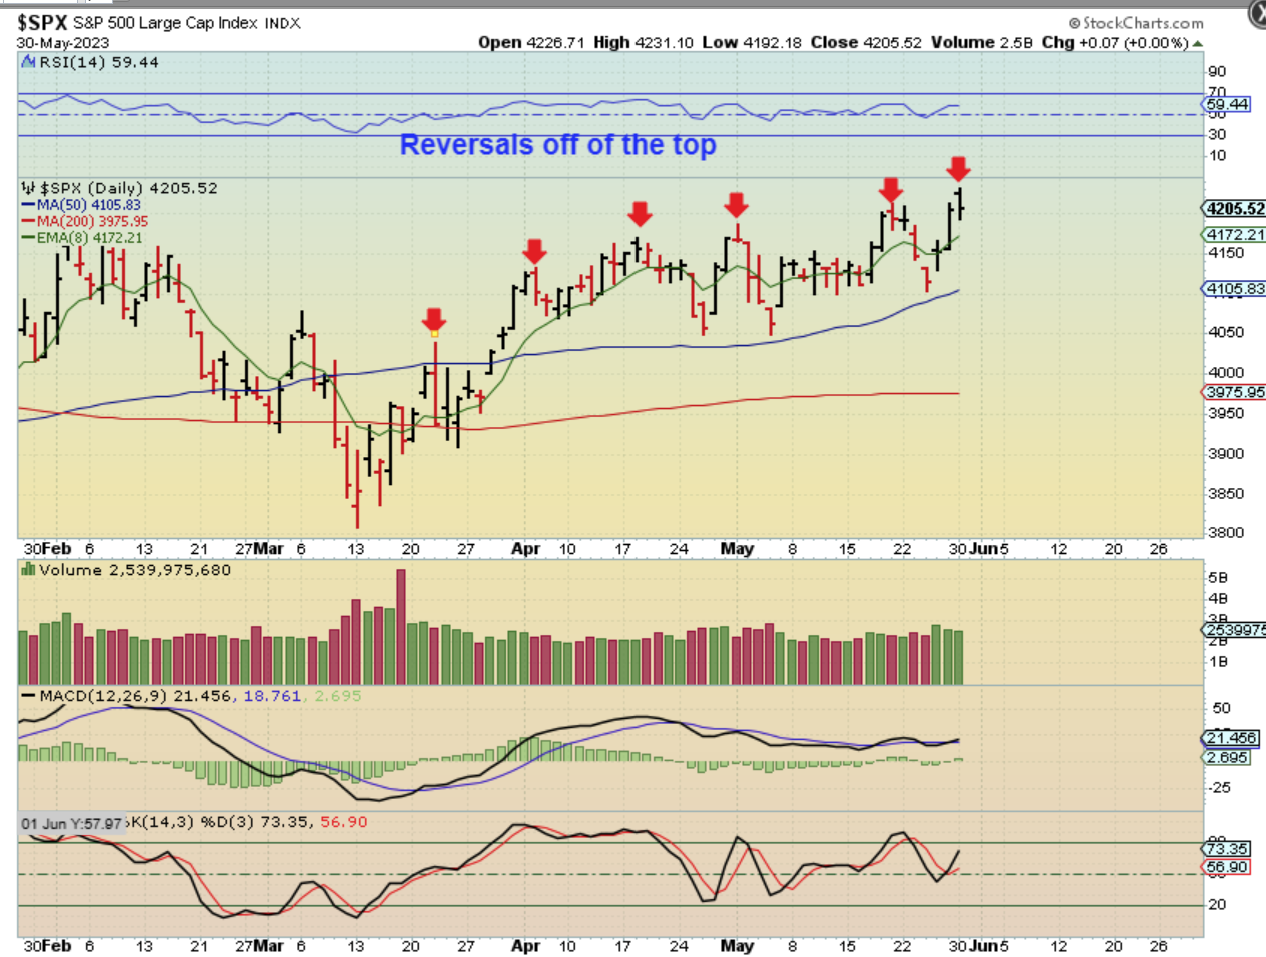
We saw a Gap open higher on Tuesday, but it slowly sold off as the day went on. Most of these reversals will have a day or 2 follow through, as seen by the arrows on this chart. In addition to that…
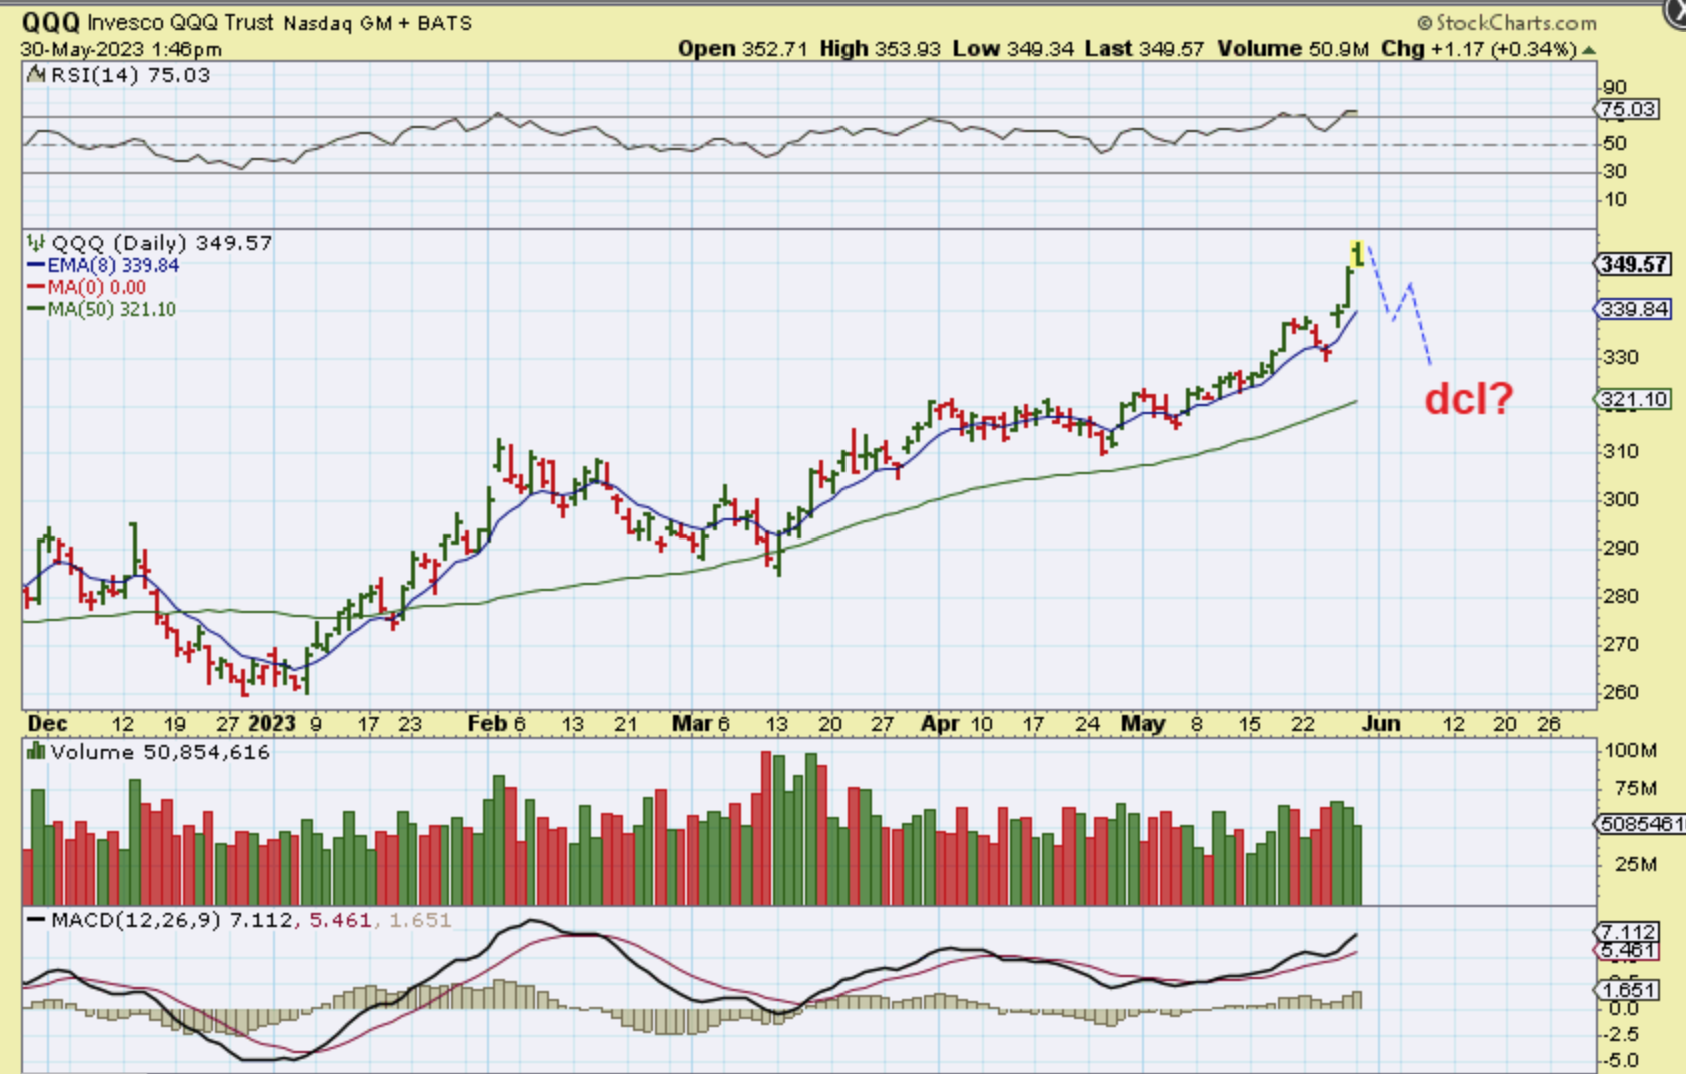
The timing is near for a dcl. It is tricky, because thee General Markets used to put in about 40 days or so, but the first 2 daily cycles were 50 days long. With The NASDAQ ( & SOXX) we have seen more of a run higher than the SPX, which is chopping slowly higher as well as sideways.
.
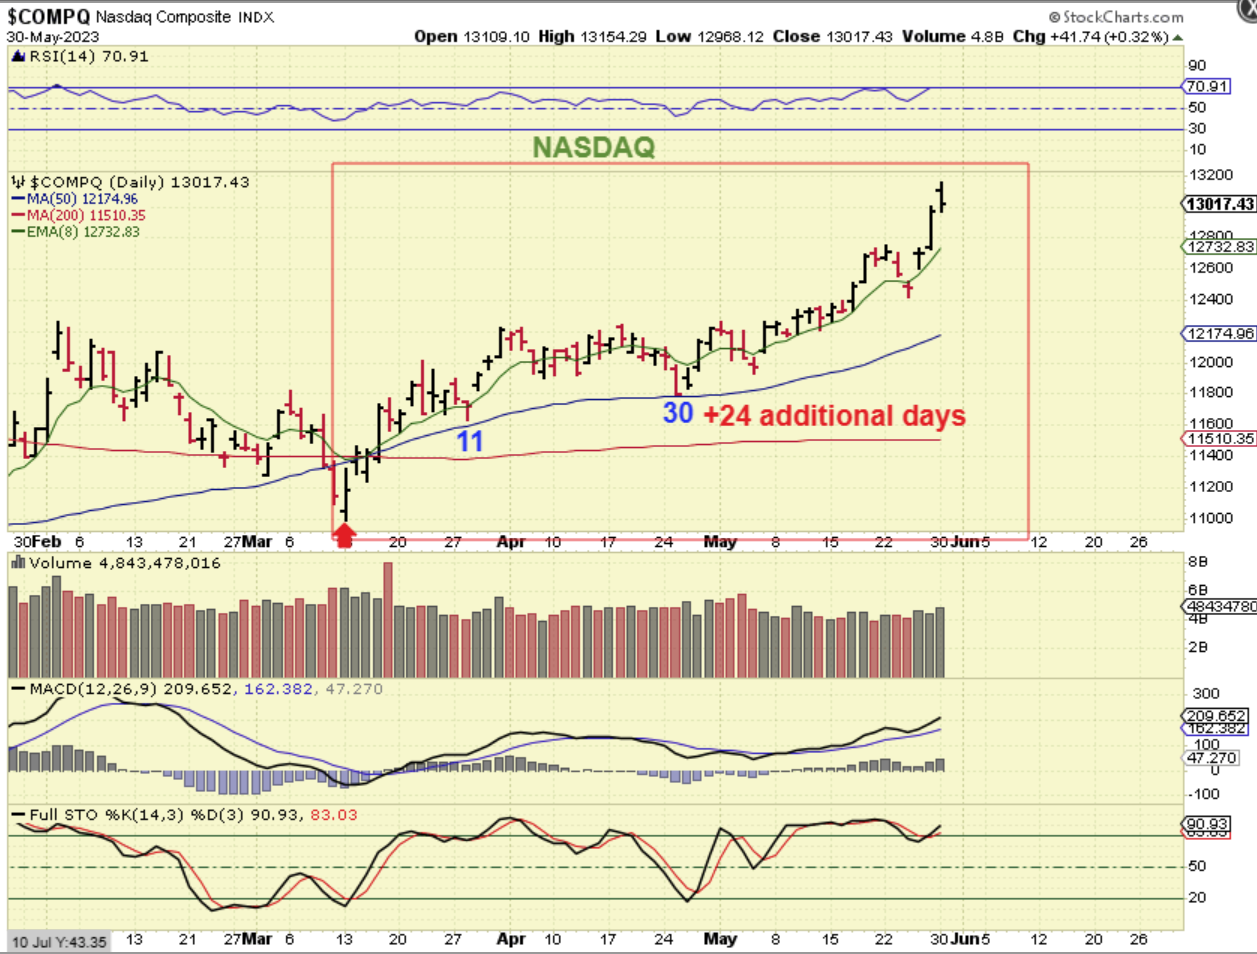
THE NASDAQ: We have discussed that it was unclear if day 30 was an early dcl or 1/2 cycle low, since the first 2 daily cycles were 50ish days long. AT this point it probably doesn’t matter because…
– If it was an early day 30 dcl, we’d be on day 24 and could dip into another early day 30 dcl ( or chop higher and dip closer to day 40.
– If it was only a 1/2 cycle low on day 30, we’d be on day 54, so we’d be due for a dip at any time, and we have a gap open and then a reversal here too. This can keep running, but the reversal makes it look a bit tired.
.
I drew this simple idea of a a-b-c type of a pullback and posted it midday yesterday for The QQQ.
.
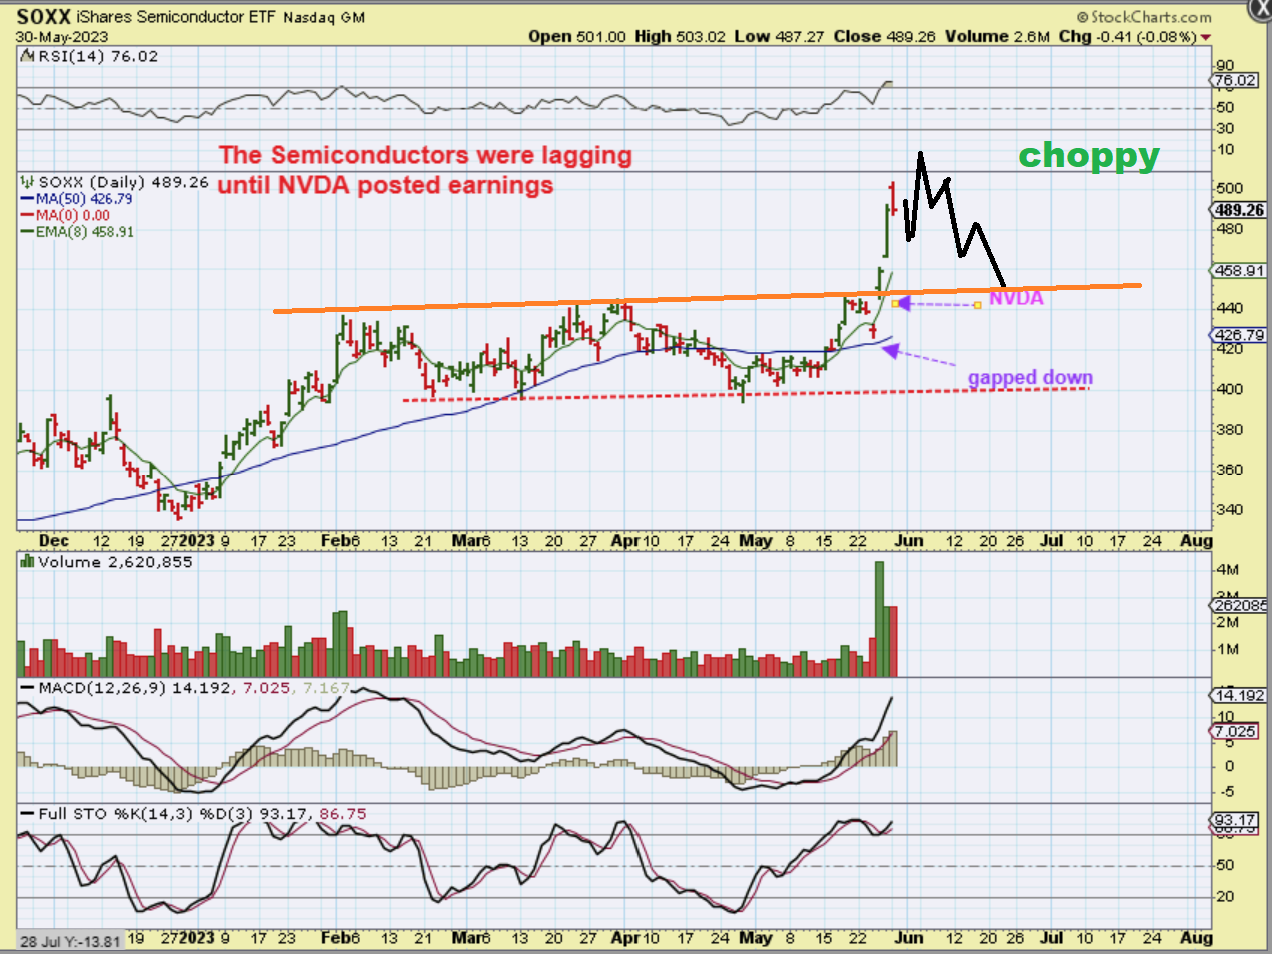
The SOXX looks a bit different because it was only chopping sideways and then it actually broke to a new low in late April, but after a bounce out of that low, the NVDA earnings release gave us 3 gaps higher in a row. Yesterdays gap closed with the reversal and the move may be getting tired. This is day 22 out of that low, so…
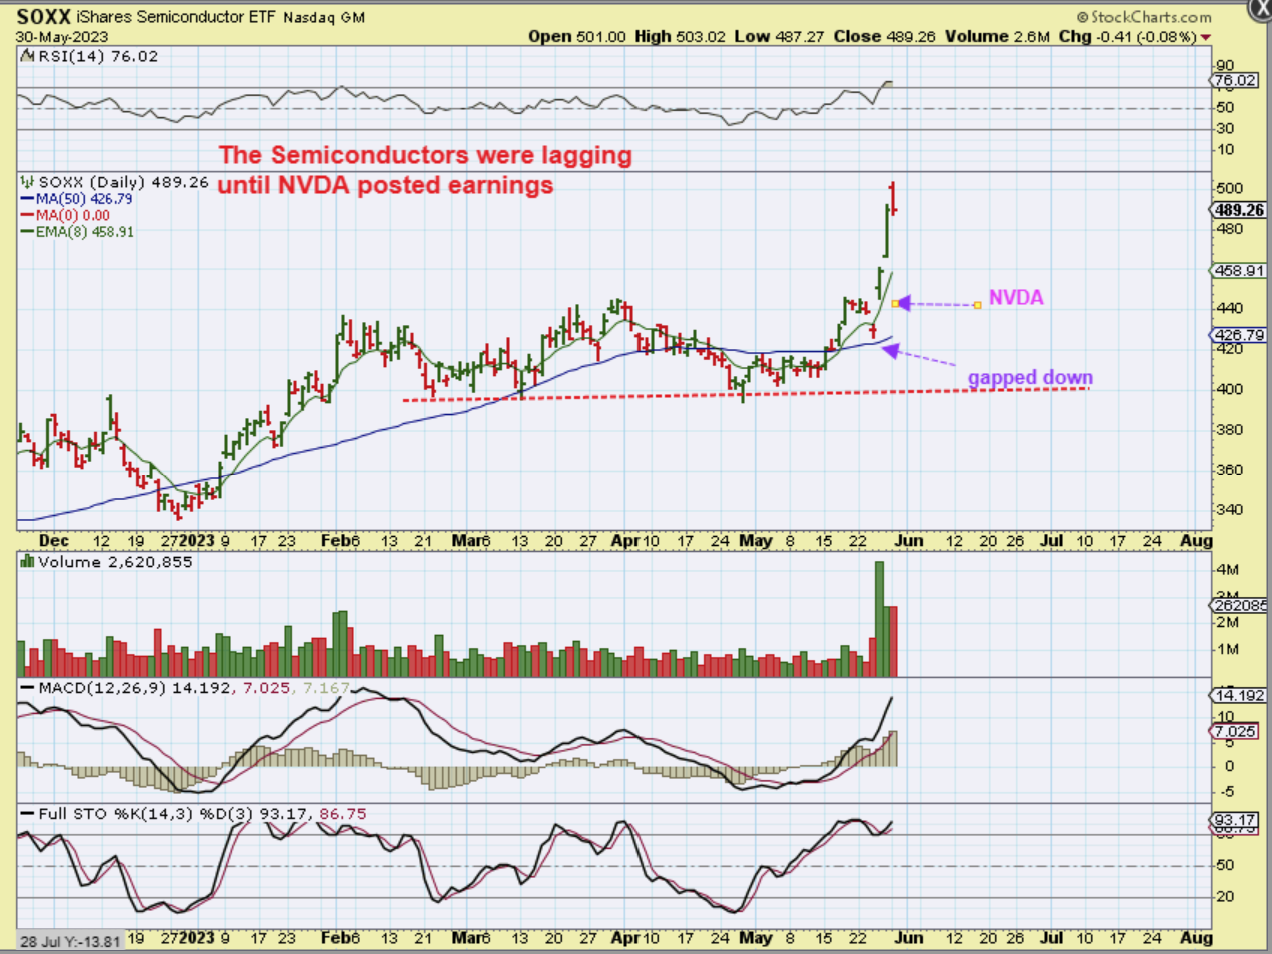
.
This is only day 22 out of that low, so really this could just get choppy and move higher before a dip comes due. These daily cycles used to be 40ish days long.
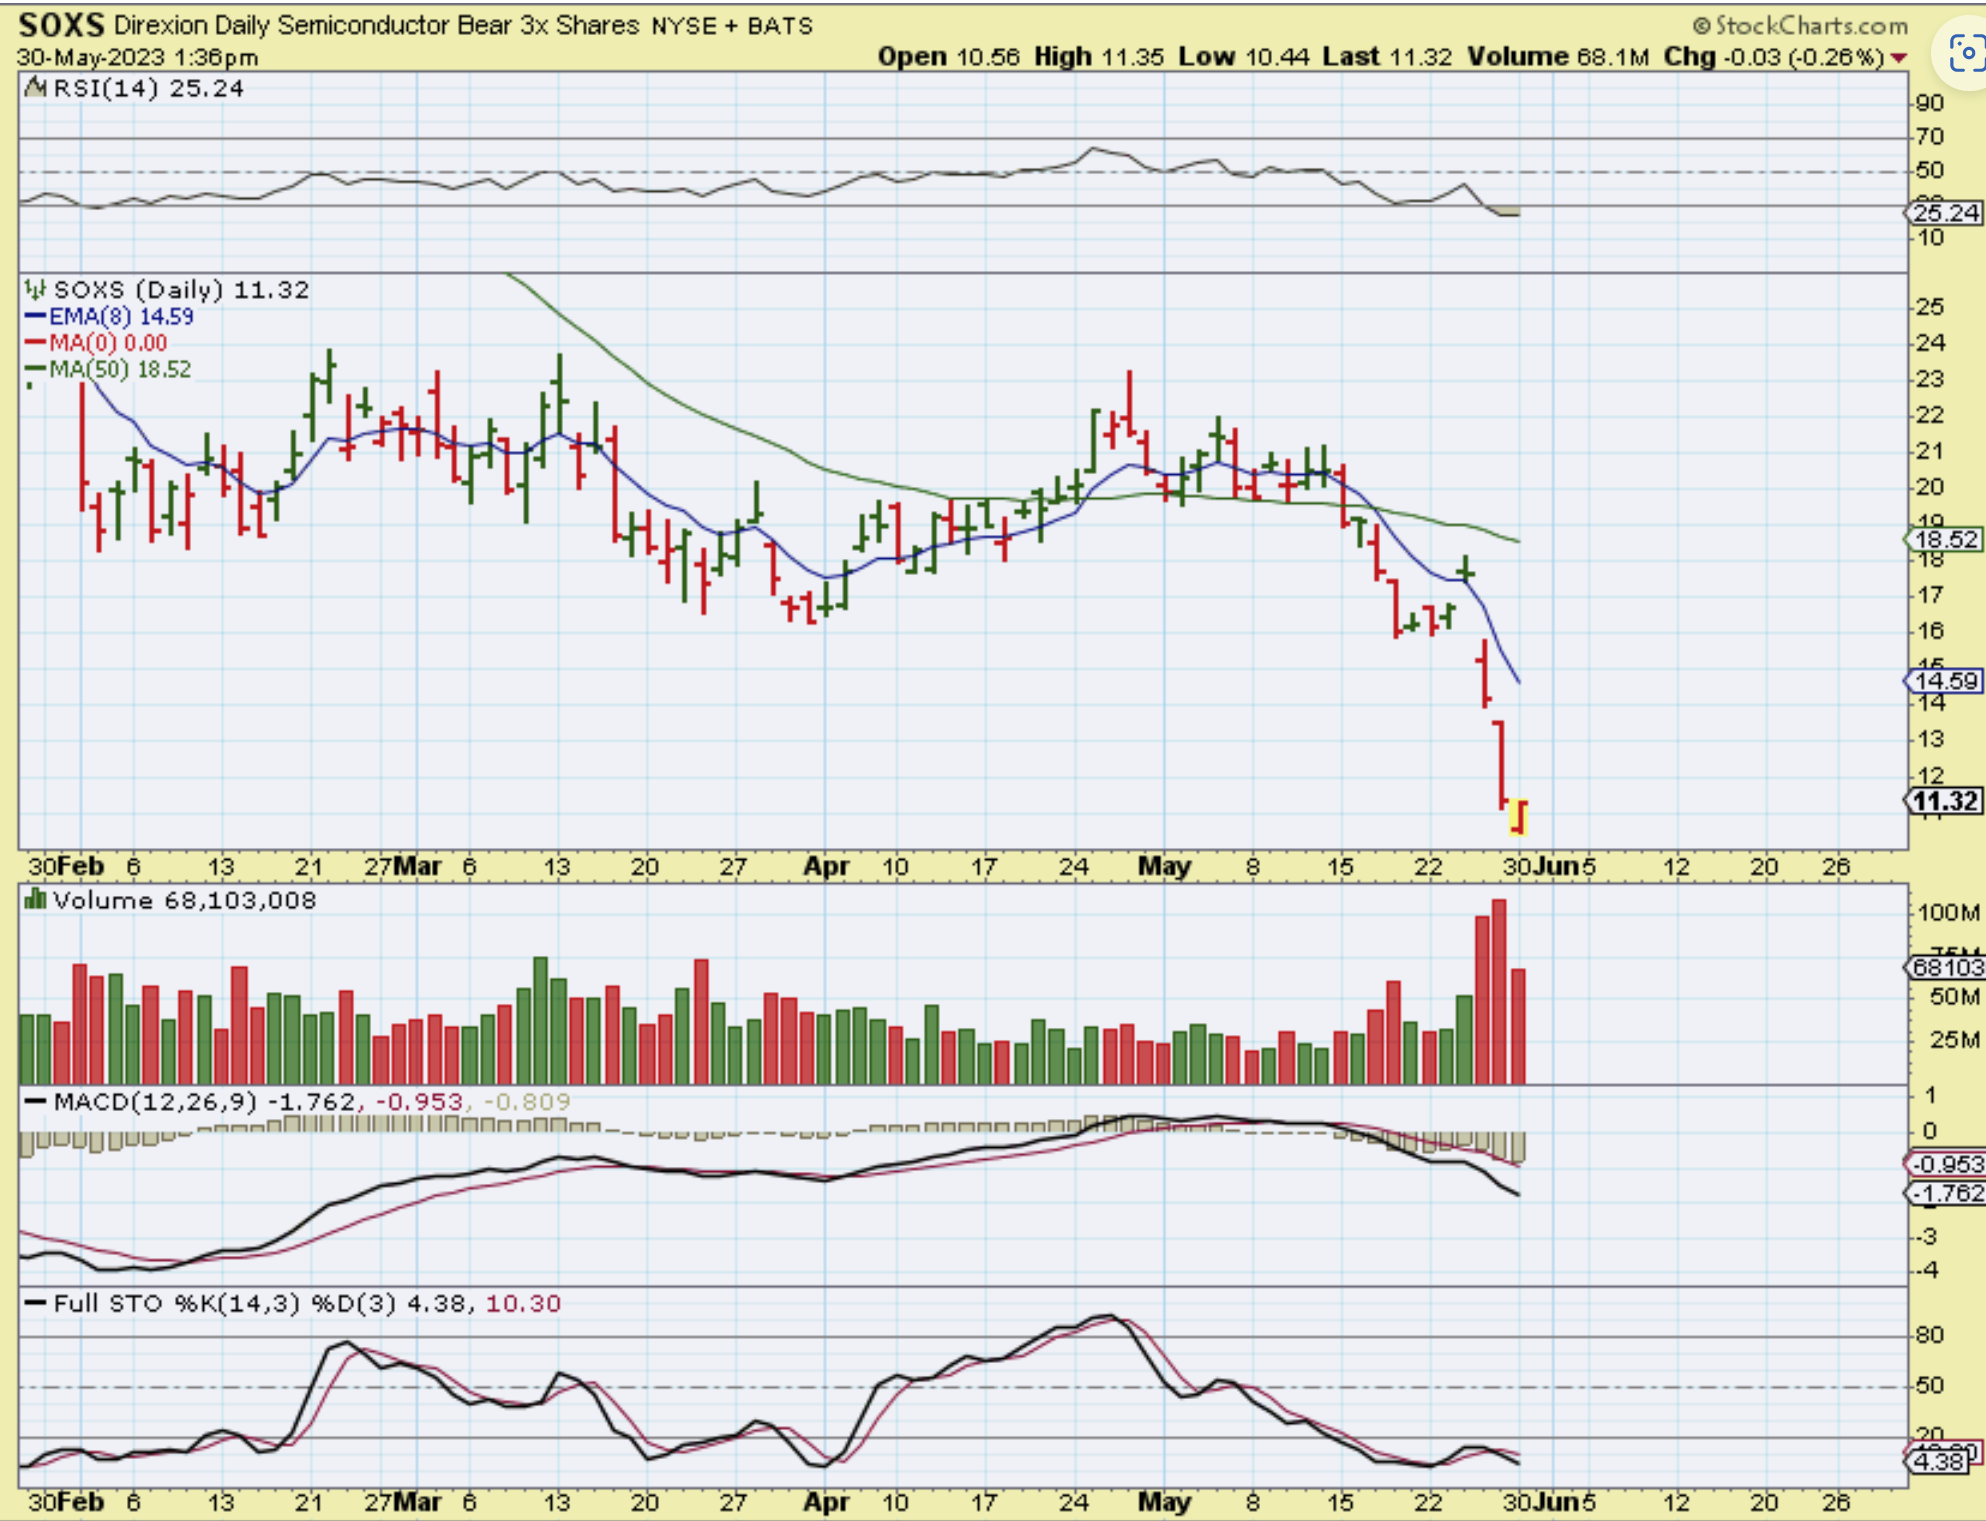
The inverse 3x SOXS does the opposite of the SOXX, so we can see a reversal at the lows here. This does make it look like it will push higher at least for a day or 2 to reach the 8 ema or that red resistance line. We’ll see, but often you can buy a reversal like this and put a stop under the lows.
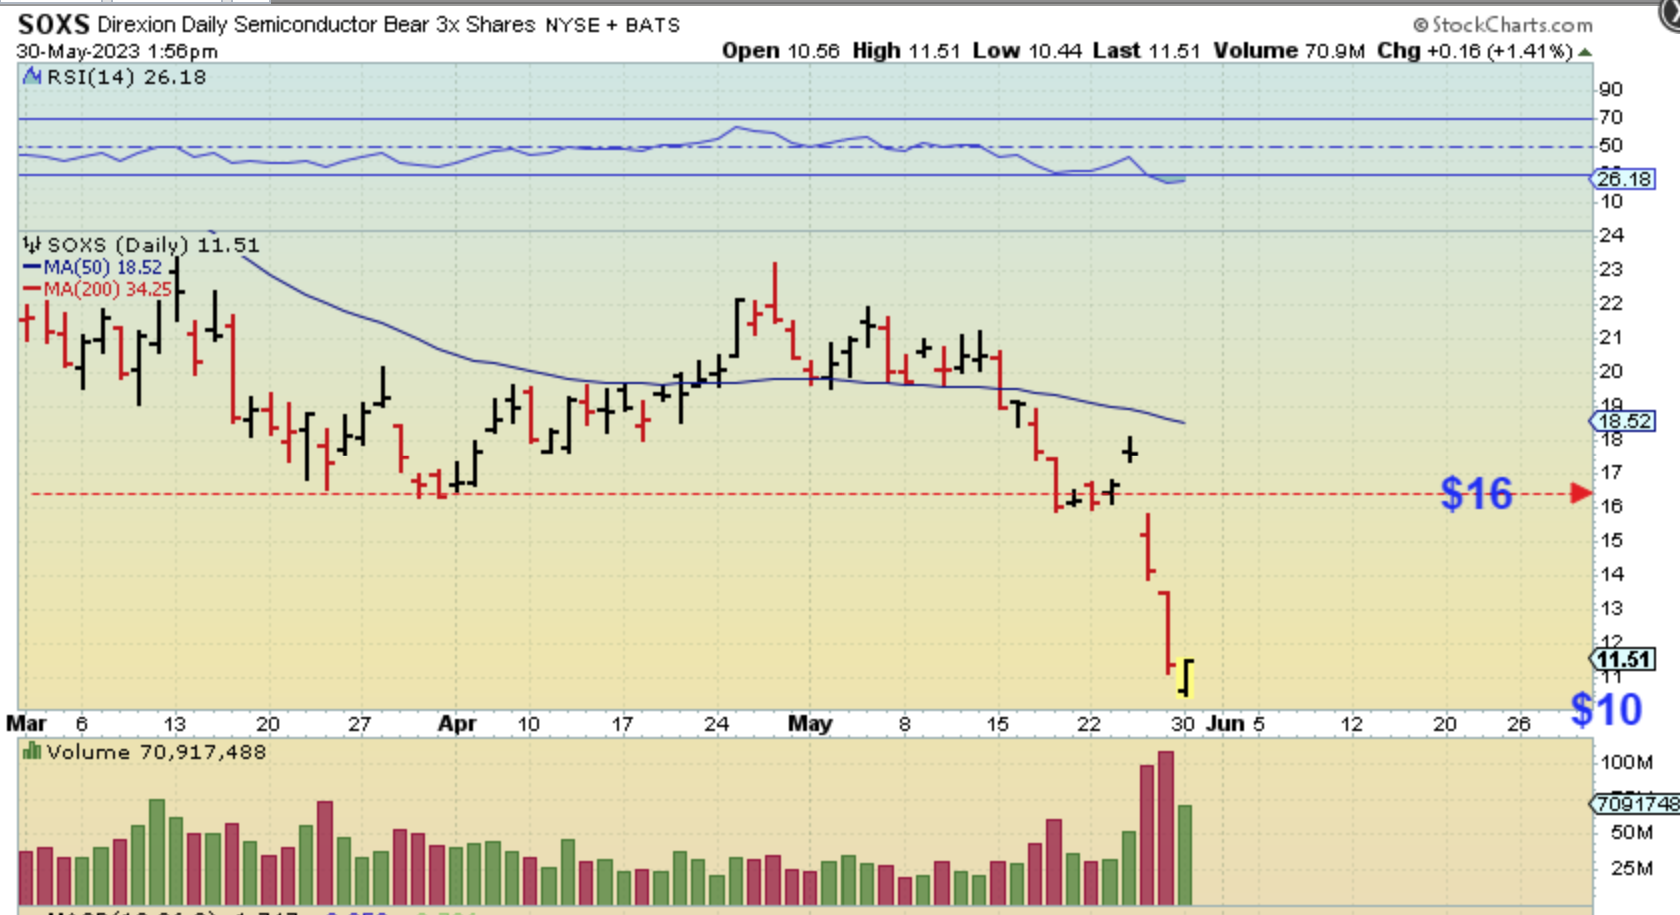
.
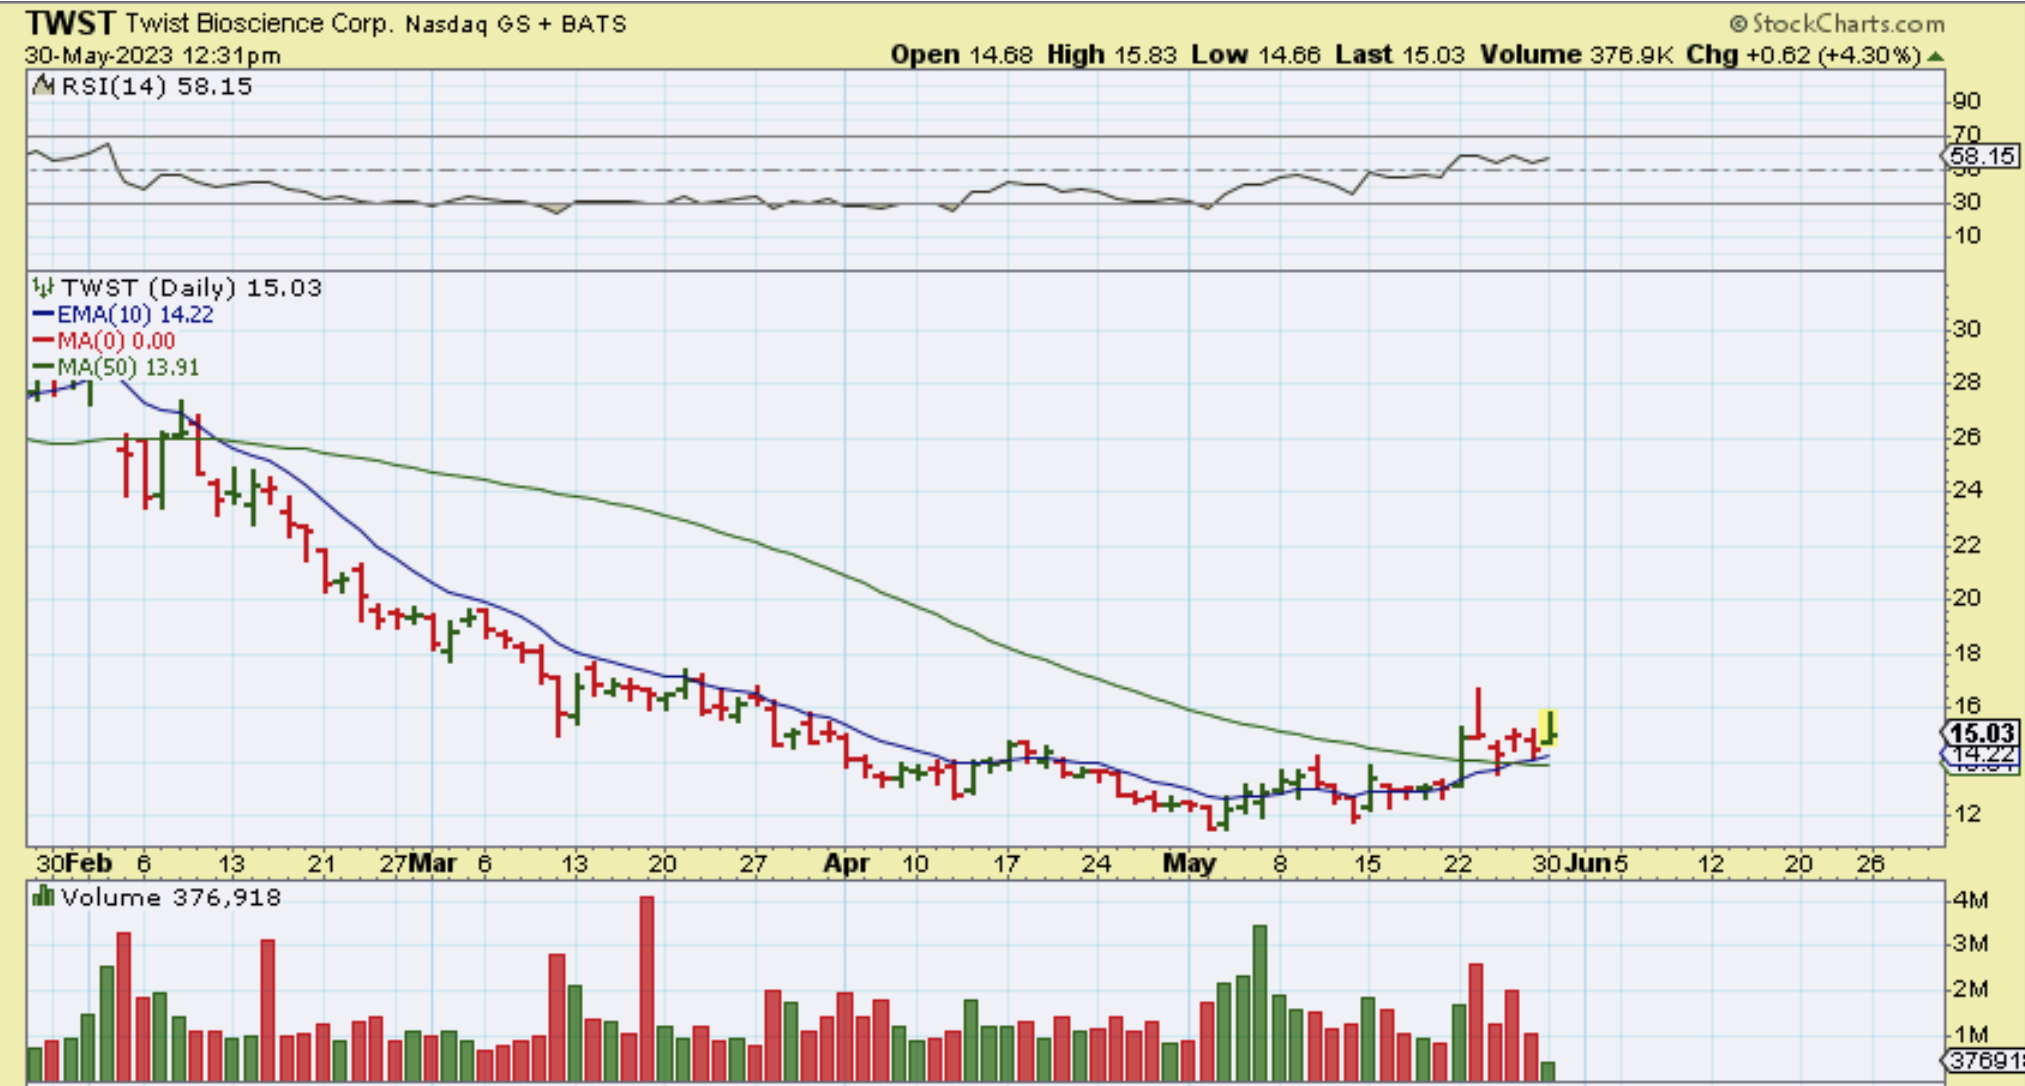
The chart that I grabbed midday shows the 8 ema at $14.50 area.
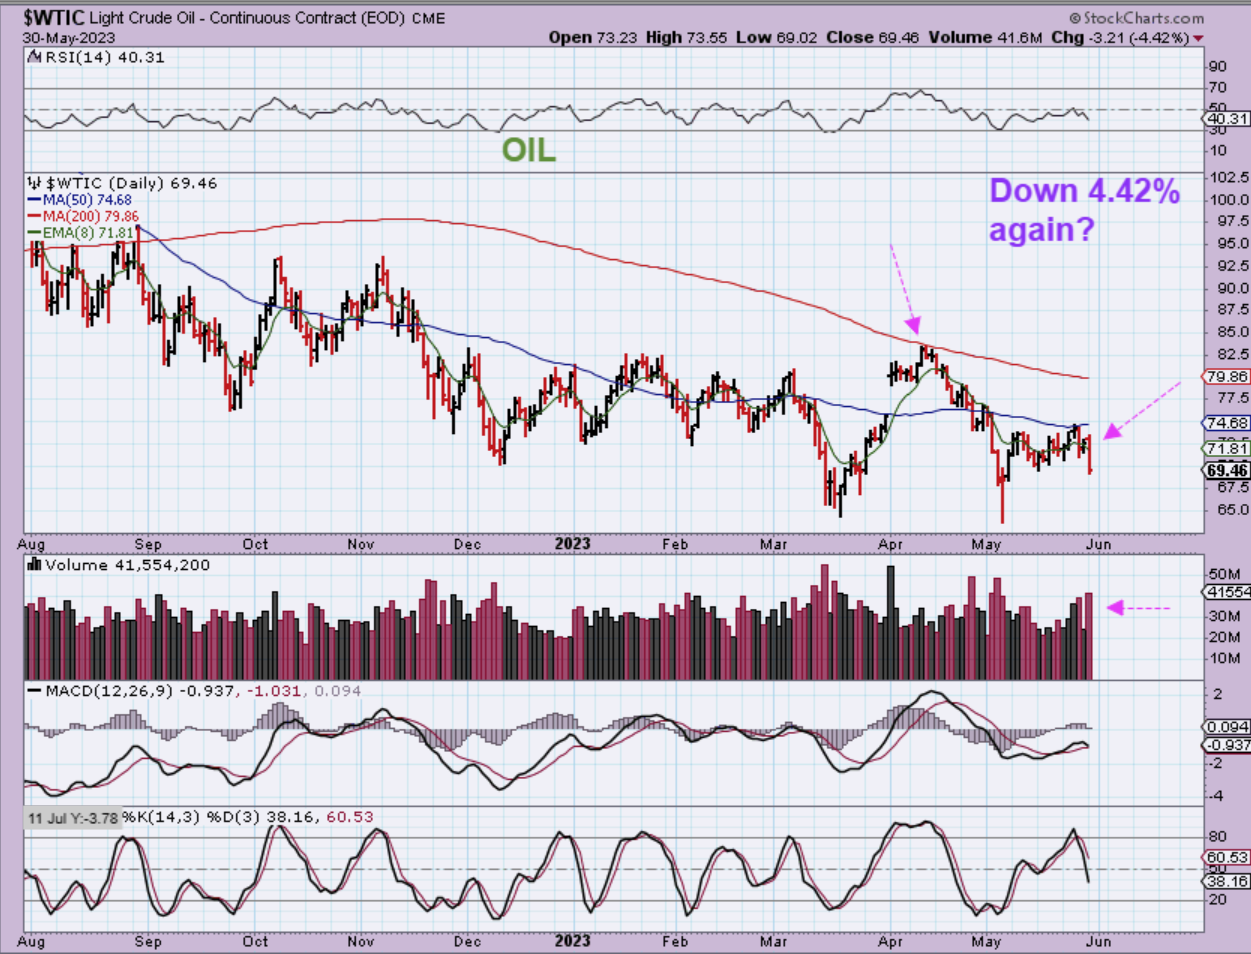
WTIC – Oil dropped again! That was a 4.42% reversal after finding the resistance of the 50sma last week. I have been saying that traders can buy the lows, but this has been so choppy month after month after month, that I have not been trading it until it starts trending again.
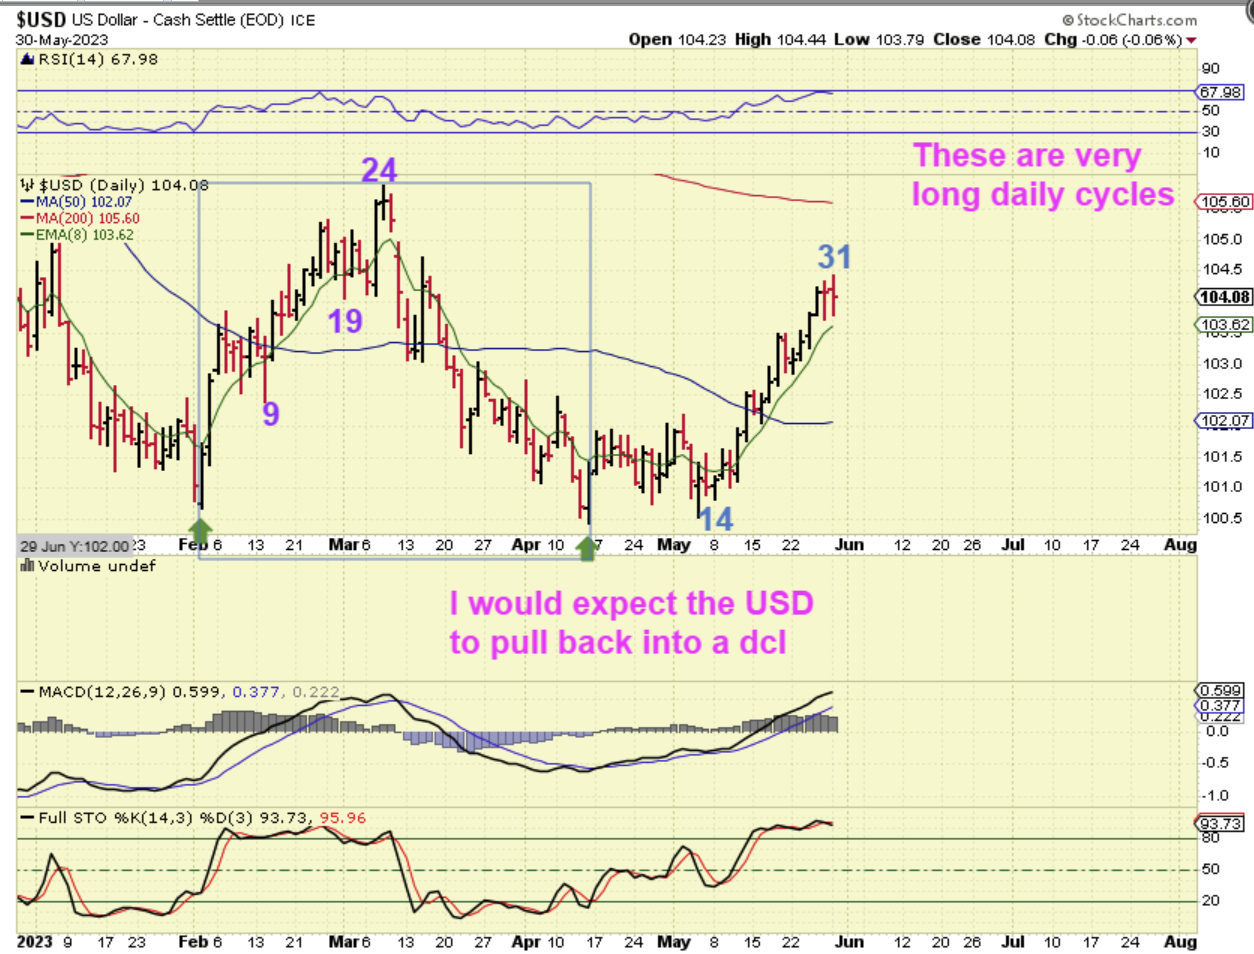
The USD had a February rally that peaked on day 24 and then rolled over to a new deep low (odd). This rally is on day 31 for a peak and that is already a long rally for the USD. The way that I have been saying this could play out is 2 daily cycles higher and then the sell off continues, so…
.
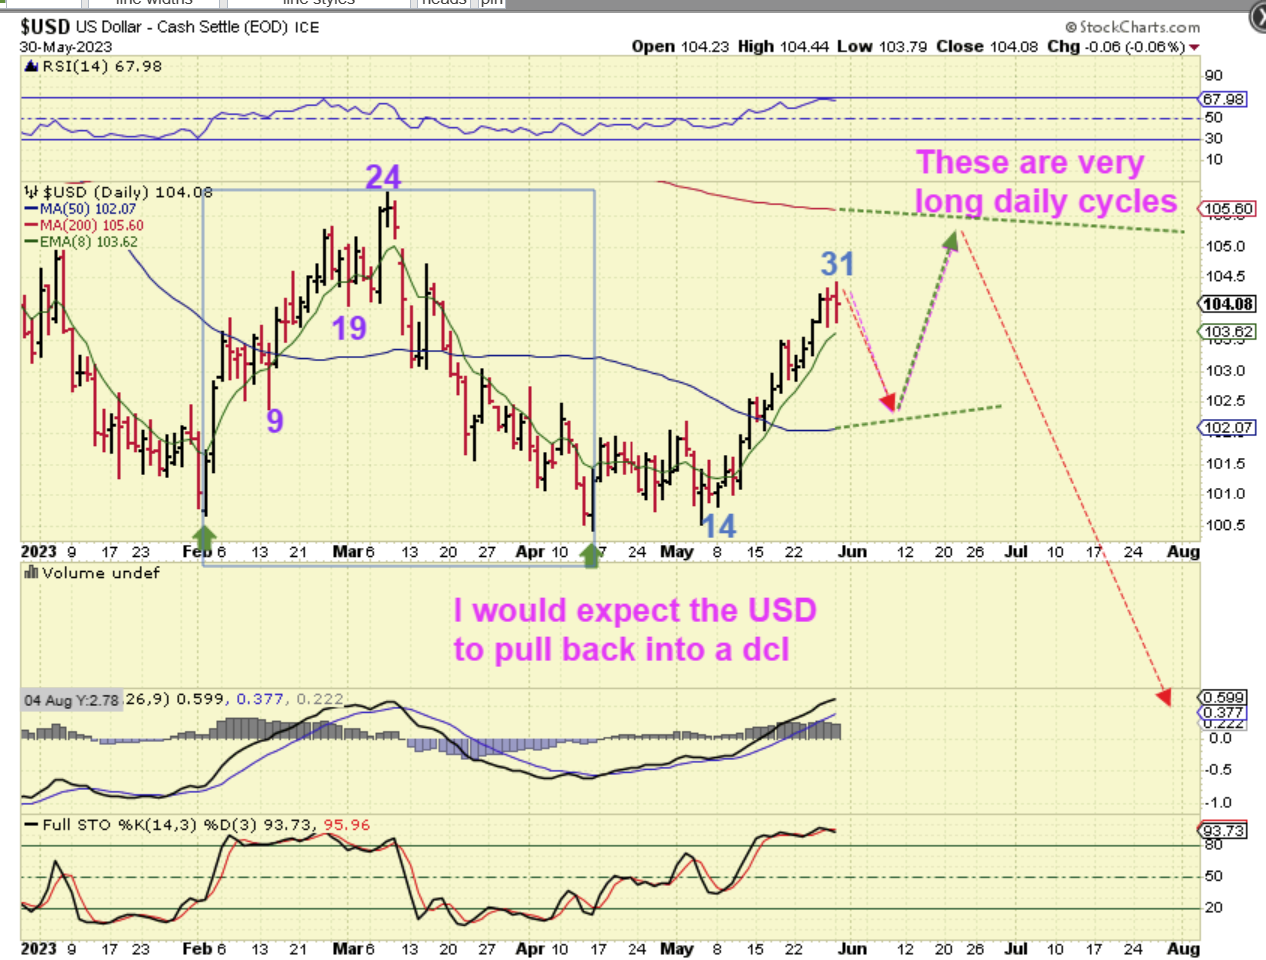
I could draw that version of 2 daily cycles like this, but we have to understand that this is not normal action for the USD, so we may need to expect ‘the unexpected’. What I mean by that is: That first rally that peaked at day 24 rolled over when the Banks failed. We don’t see a clear DCL after that for the whole month of March, right? We only see a couple of 1 or 2 day pops. It then broke to new lows(?), and THAT is not normal price action. Could this just rally to the 200sma and then roll over? I can’t rule anything out at this point. In fact…
.
I can’t rule anything out at this point. That first rally in February just appeared like one massively long daily cycle that even broke to a new low. Could that repeat here after a run to the 200sma as a second massive daily cycle? I would say ‘Yes’. That Feb rally could be one massive daily cycle and this is the 2nd massive daily cycle. It could tag that 200sma and roll over.
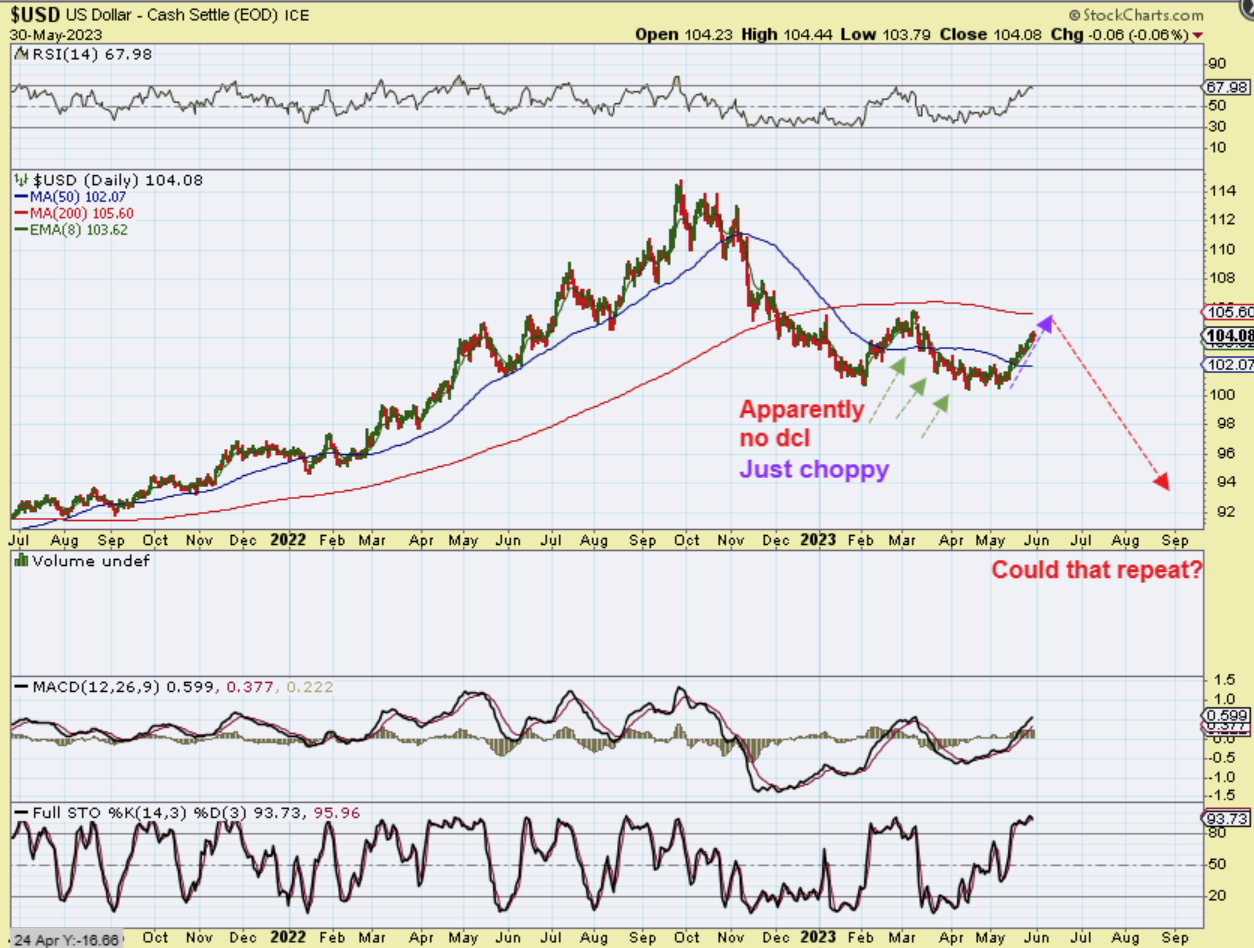
This is why I have been saying that we just have to let this play out. The USD did not act correctly on that first rally and this 2nd rally is also not normal. I am wondering if we got the ICL in Feb as expected with a huge first daily cycle and this will become the 2nd daily cycle that will run to the 200sma and roll over. We just have to let it play out and be ready to go long Gold when it is ready to break out.
.
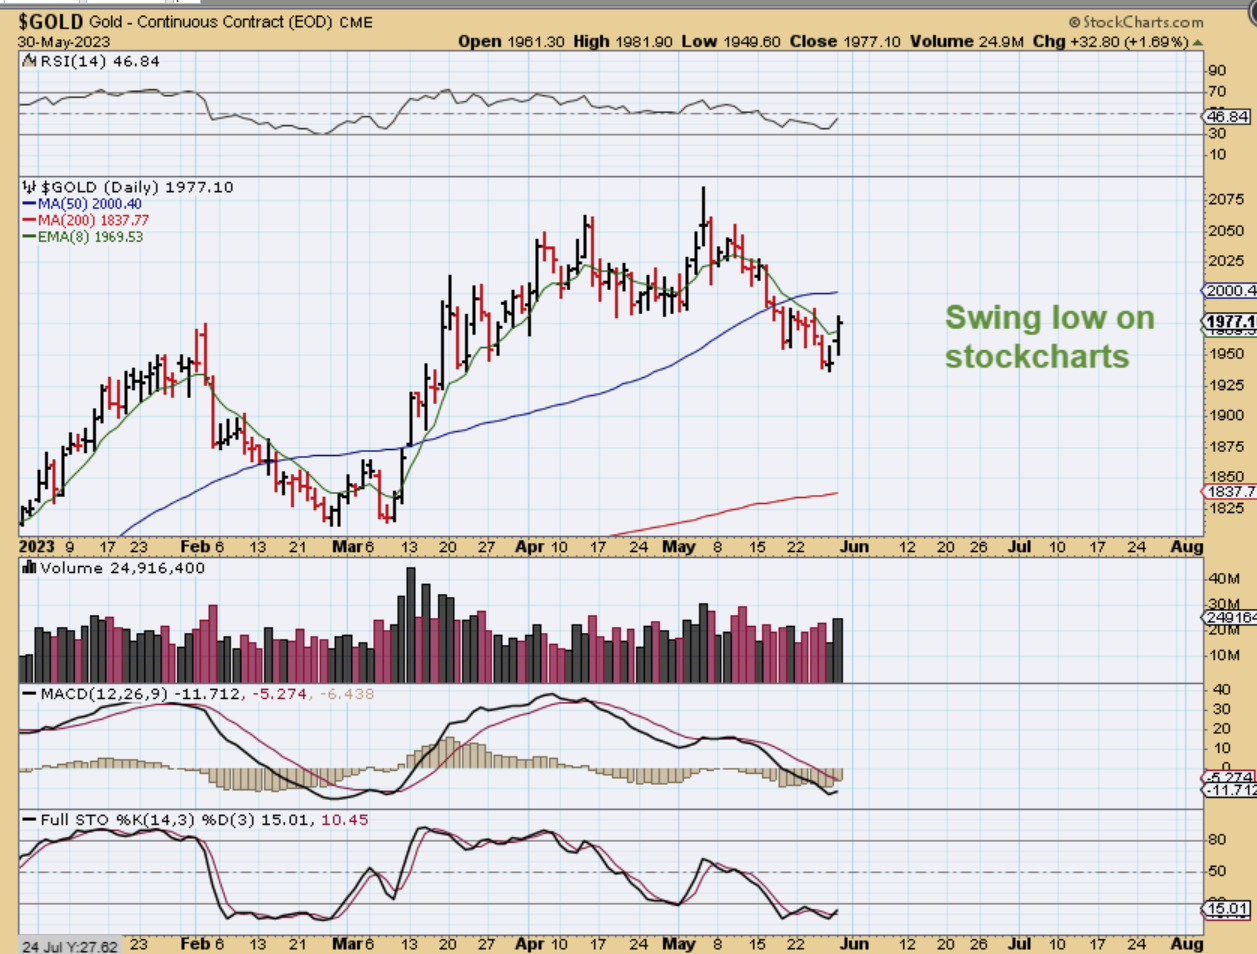
GOLD popped when the USD stalled yesterday. I noticed that Stockcharts version shows a low (or swing low) from Fridays lows, but other charts do not, so this is one version and …
.
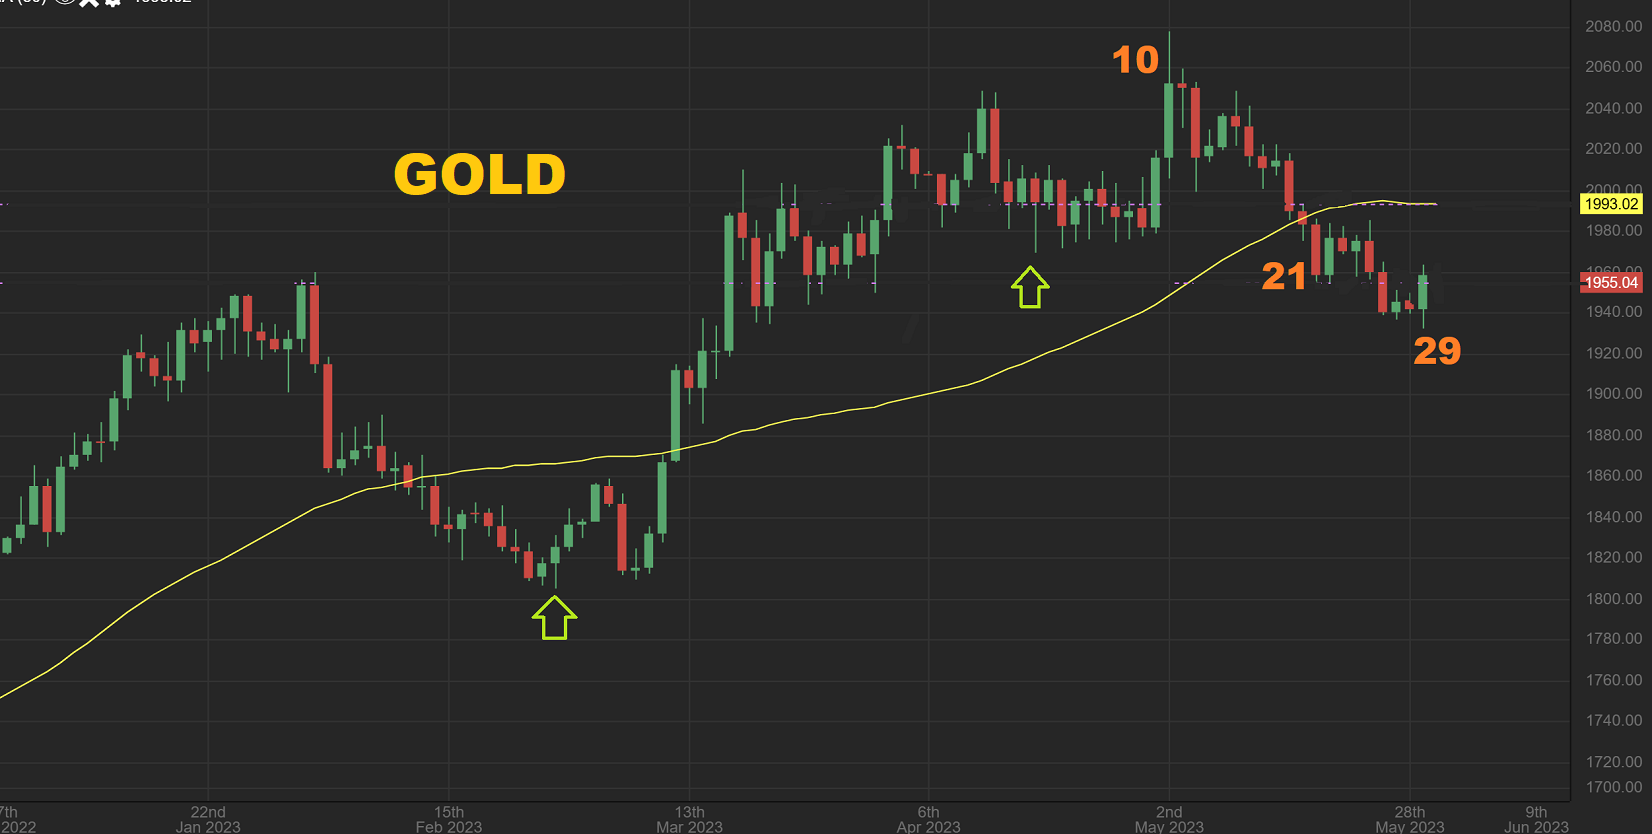
As you can see here on Spot Gold, GOLD shows a low on Tuesday. Gold has been choppy and it could form a dcl here, but it also may just remain choppy, depending on what the USD does. So…
.
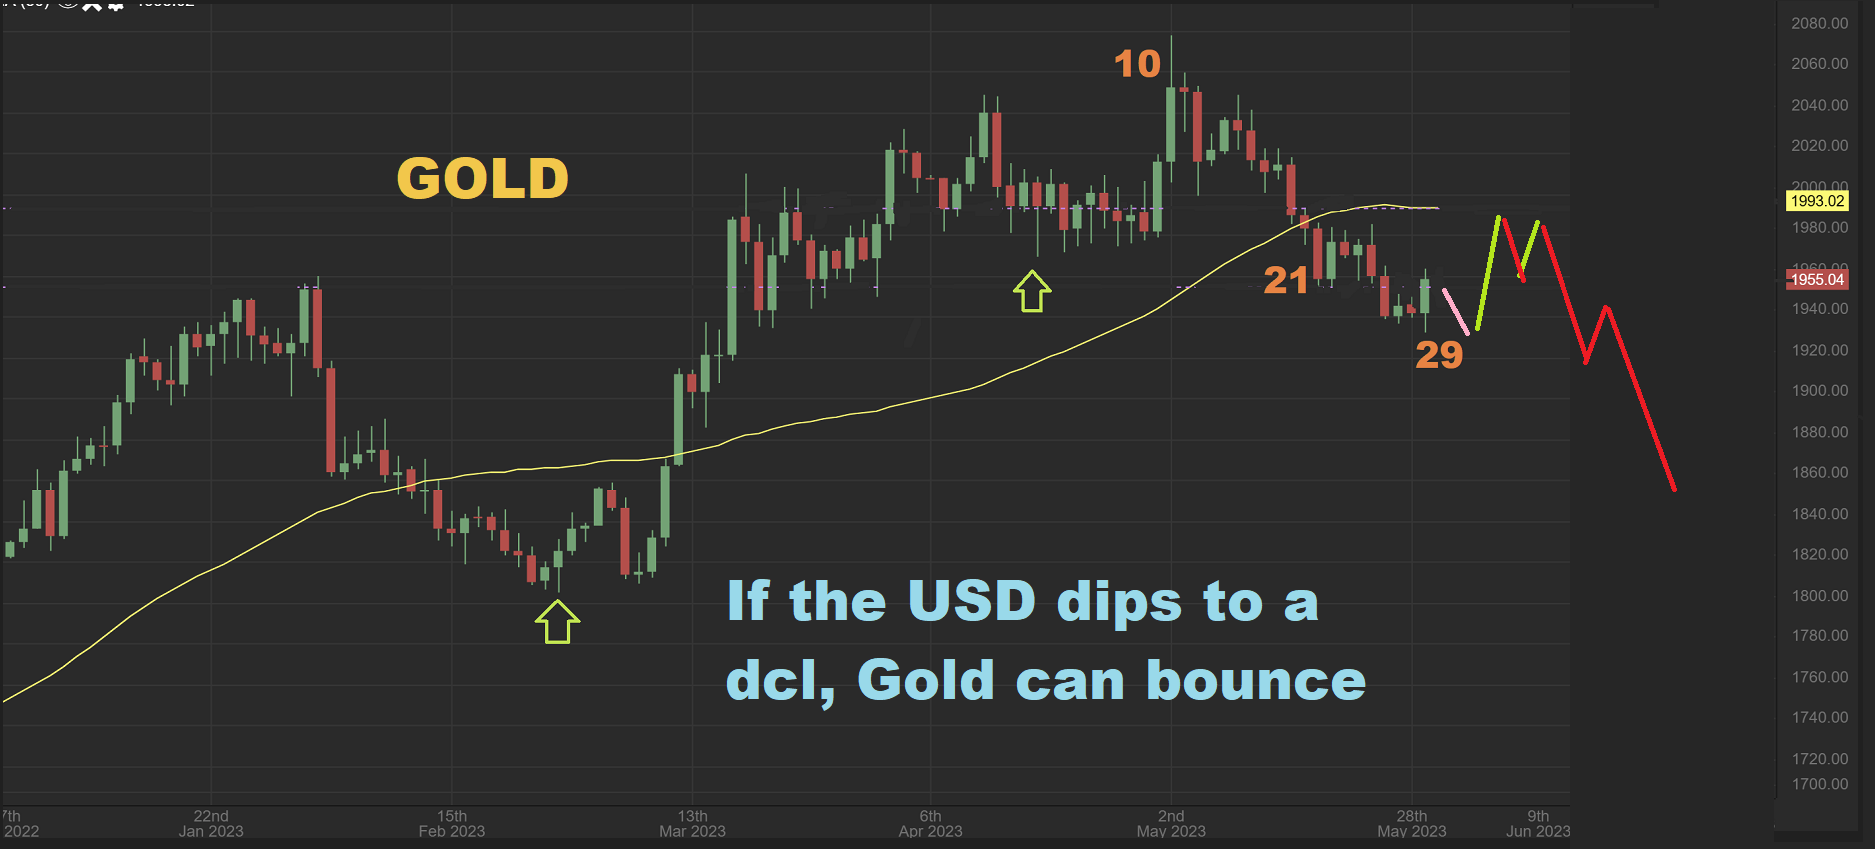
If I was to draw the opposite of the USD pulling back and bouncing to the 200sma, GOLD could bounce and then roll over one more time into an ICL in June (hopefully), as the USD tags the 200sma and rolls over. We just have to let it play out, but if GOLD gets above the 50sma, that would be a bullish looking development.
.
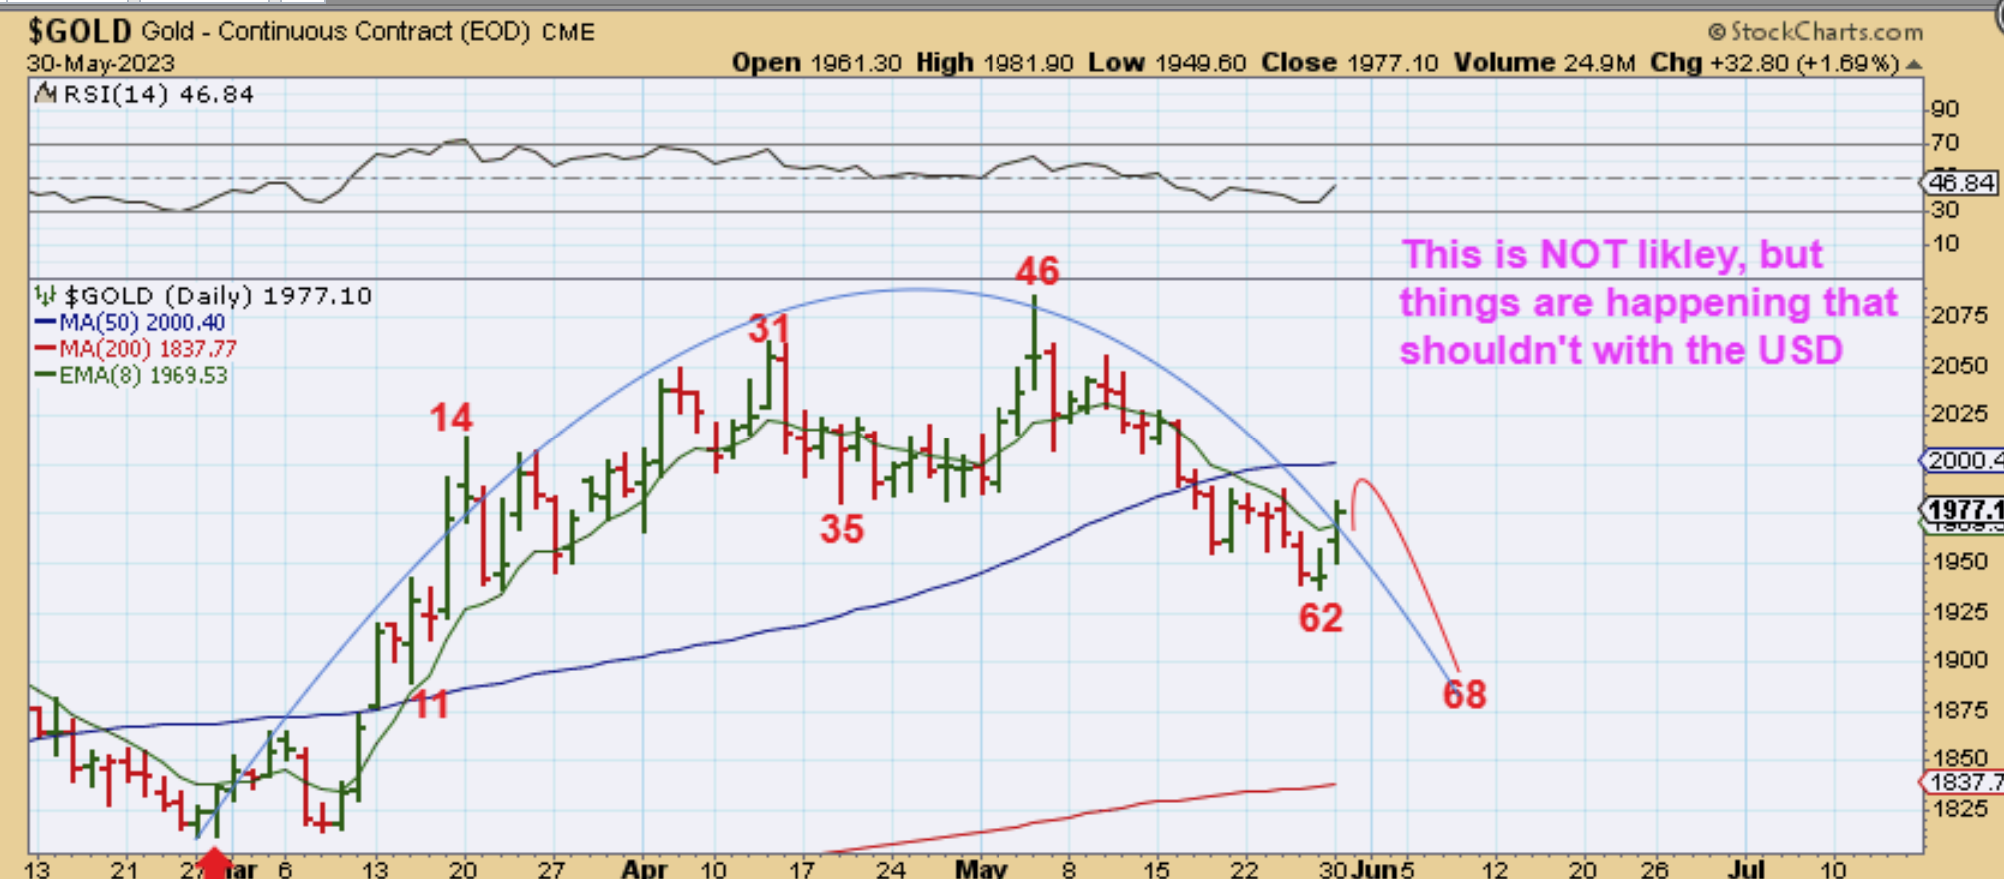
The Bank Failures caused us to see the USD act in a way that is not normal. It looked like the USD had a massivley long daily cycle in Feb-March. I started thinking: What if GOLD does have the ICL in place, but it putting in a massively long daily cycle too? Like instead of a 33 day daily cycle, what if we got a 60+ day daily cycle, because of the USD movement and rally? It could look like this, BUT THIS IS REALLY NOT LIKLEY. I’m just trying to keep my mind open as to what we could see if the USD tags that 200sma and then just rolls over. Gold would bottom and run. This would be 1 massive daily cycle that peaked on day 46 and is R.T. ( again, a less likely scenario).
.
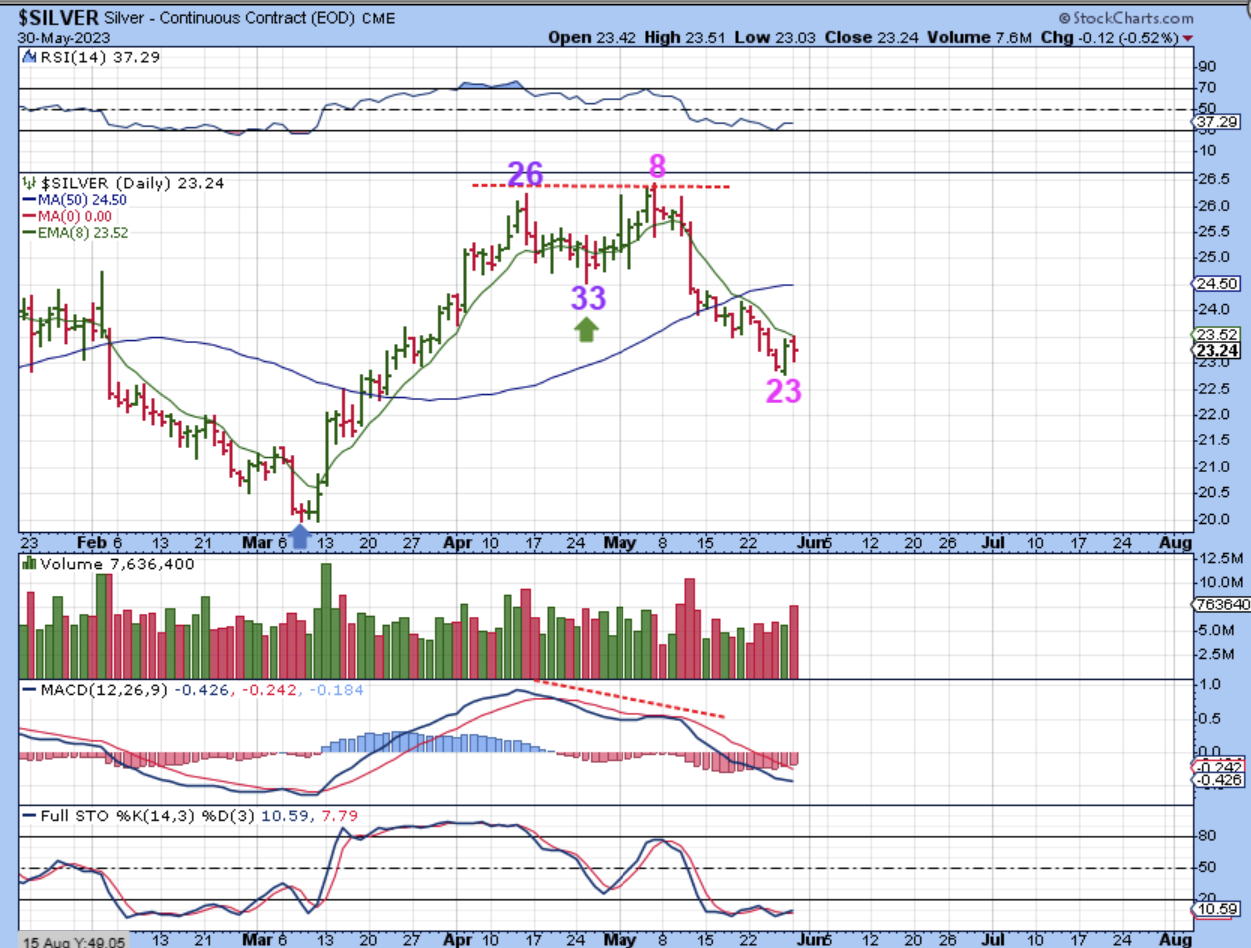
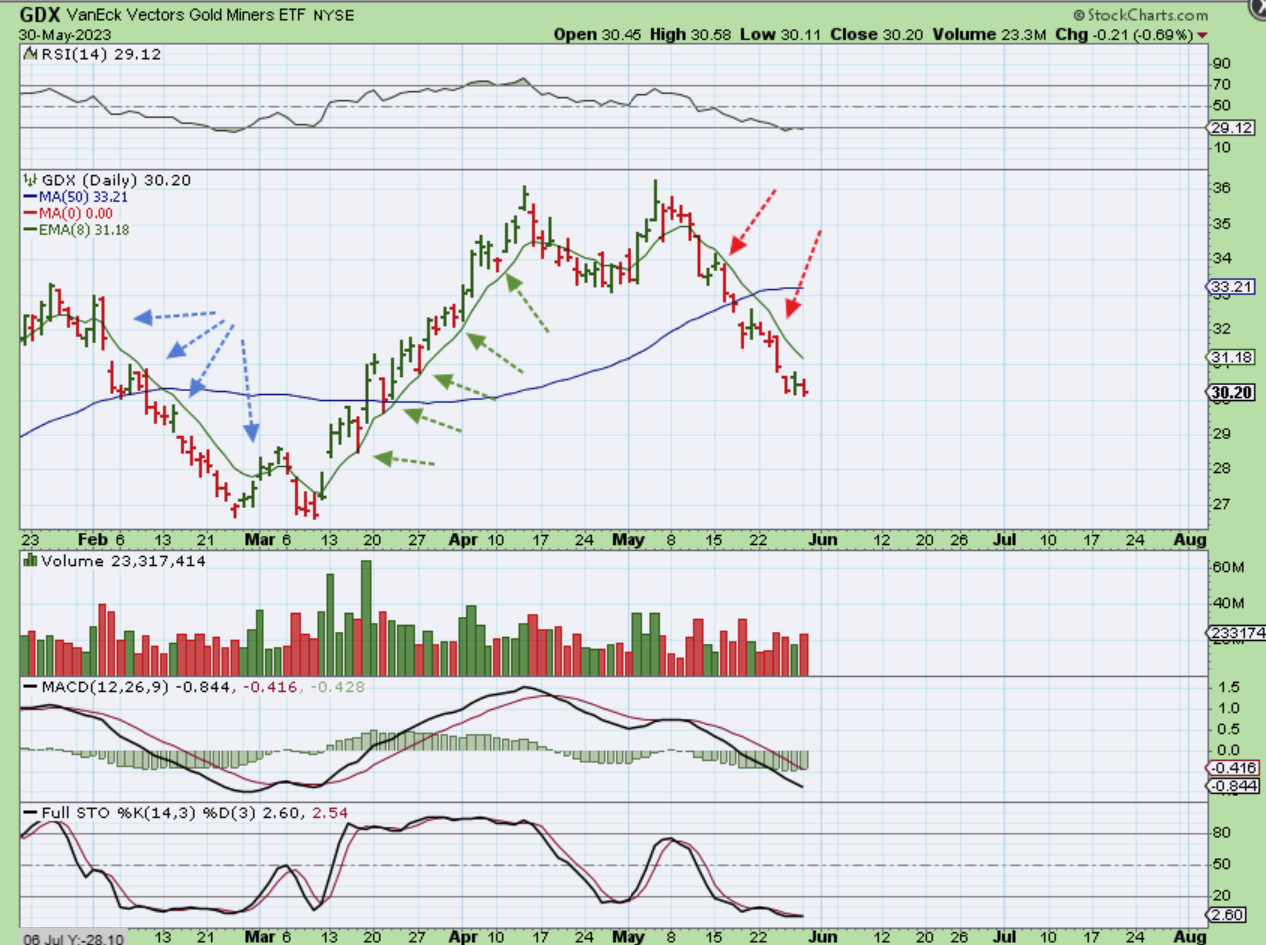
SILVER is set up as though we have a strong rally and then a dcl on day 33, but now it failed? That also doesn’t make a lot sense after such a strong rally, so could this be 1 massive daily cycle out of an ICL in March? If so, day 8 would be day 41 peak and this would be day 56. Again, this is less likely, but I’m just trying to keep an open mind about this current price action with the USD and Precious metals. The GDX looks very much like Silver…
GDX looks much like Silver. We had a strong rally climbing the 8 ema out of what would be an early ICL (Banks failed and sparked the rally). Now GDX is unable to get back over the 8 ema, just like in February.
.
The General Markets remain Bullish, Oil remains very Choppy and difficult, and the Precious Metals and the USD are not acting in a normal manner. This is the 2nd strong rally for the USD, and it seems way too early for another ICL drop if we had one in March for Gold. The price action in the USD & GOLD has not been normal ever since the Banks failed and sparked Golds strong rally, so now we are getting a change in the character of cycles, so we just need to let this play out.
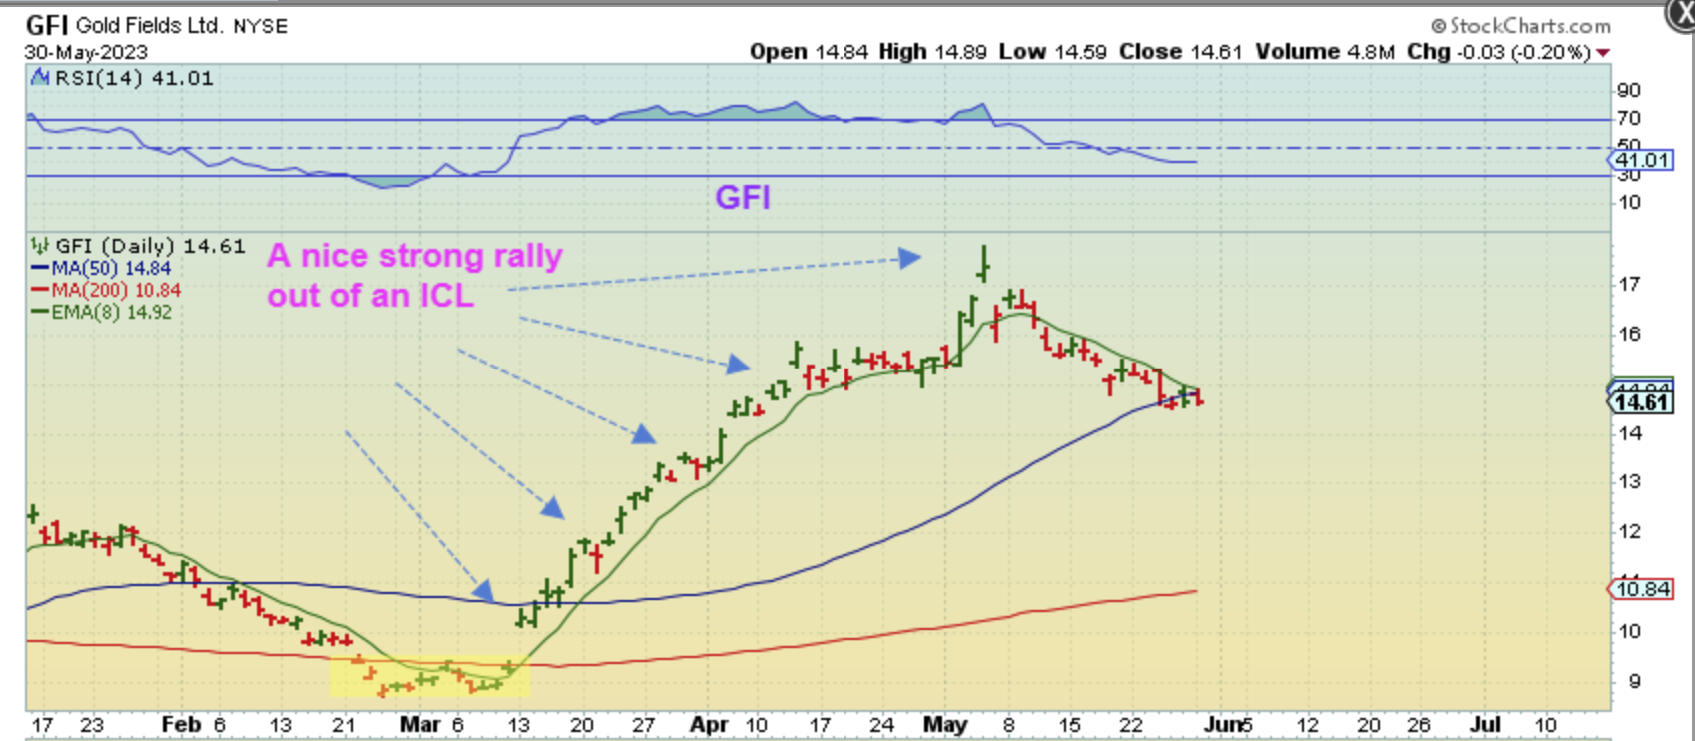
Buying the next low in Gold is an option, but it could still roll over and fail with 1 more daily cycle lower, so stops will be needed and that can be frustrating. We are sailing through uncharted waters using cycles, so one would need to adapt if that is your preferred method of analysis. Using technical analysis, none of this is all that unusual. Gold tagged all-time highs and would be expected to pull back to build energy for a breakout to new all-time highs. That should cause Miners to all run very strongly and trend higher for Months. Look at the last rally in GFI, HMY, OR, AU, etc and that is what I would expect once Gold breaks out.
.
THAT kind of a rally in Miners will be worth waiting for, so let’s be patient and let this energy in the USD wear itself out.
.
~ALEX
.
In my next report, I hope to set aside more time to discuss some stock picks and set ups in tech that look promising. The Nasdaq lagged for a bit & chopped sideways, but many of the leaders have been in a strong recovery mode since November. NVDA is a perfect example and other Semiconductor stocks responded well too. I am thinking that some of the others tech stocks may play catch up. Let me give you 1 example of what I am talking about:
.
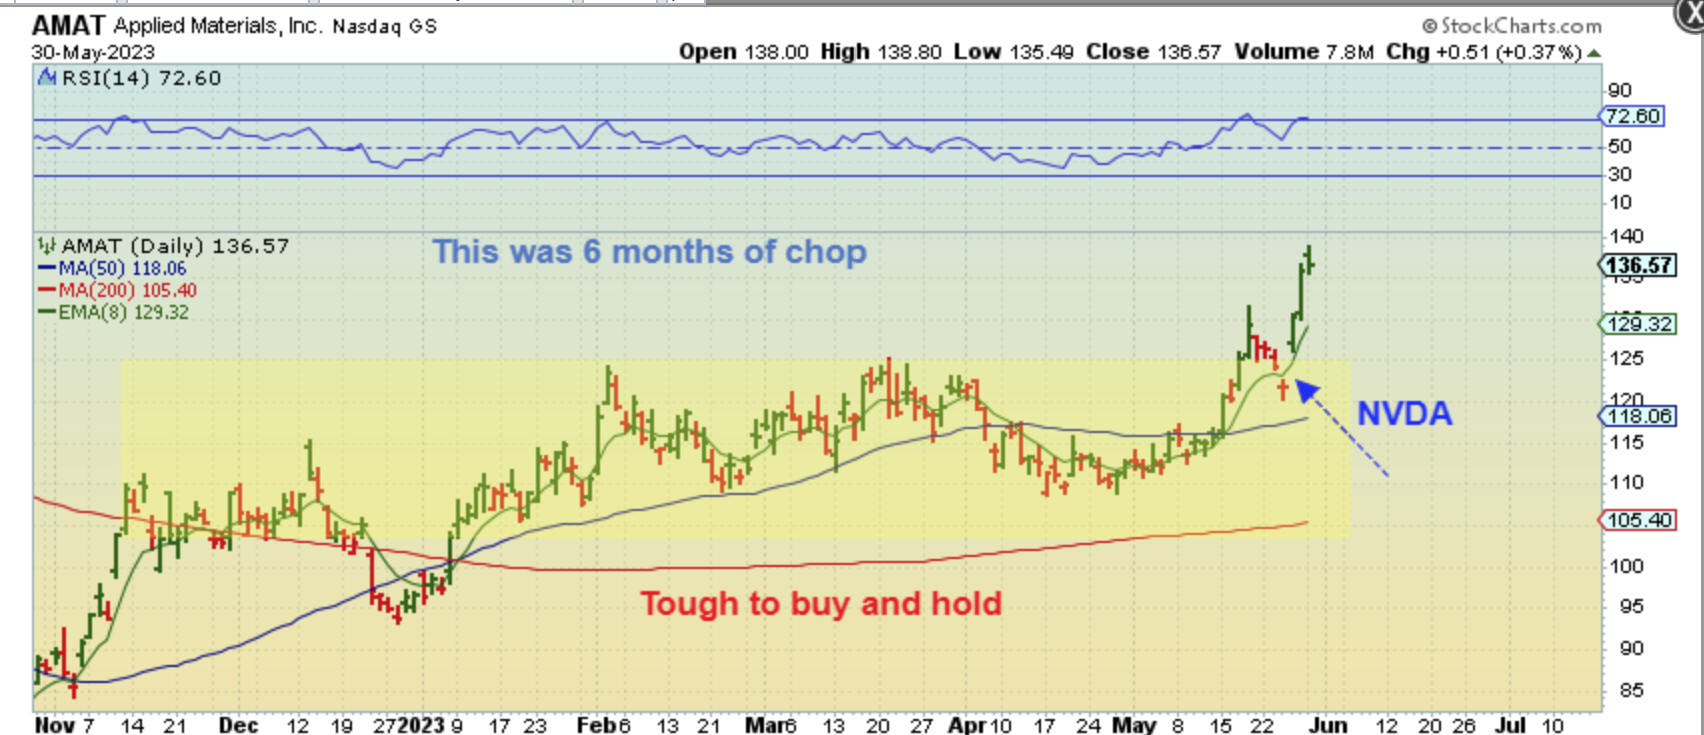
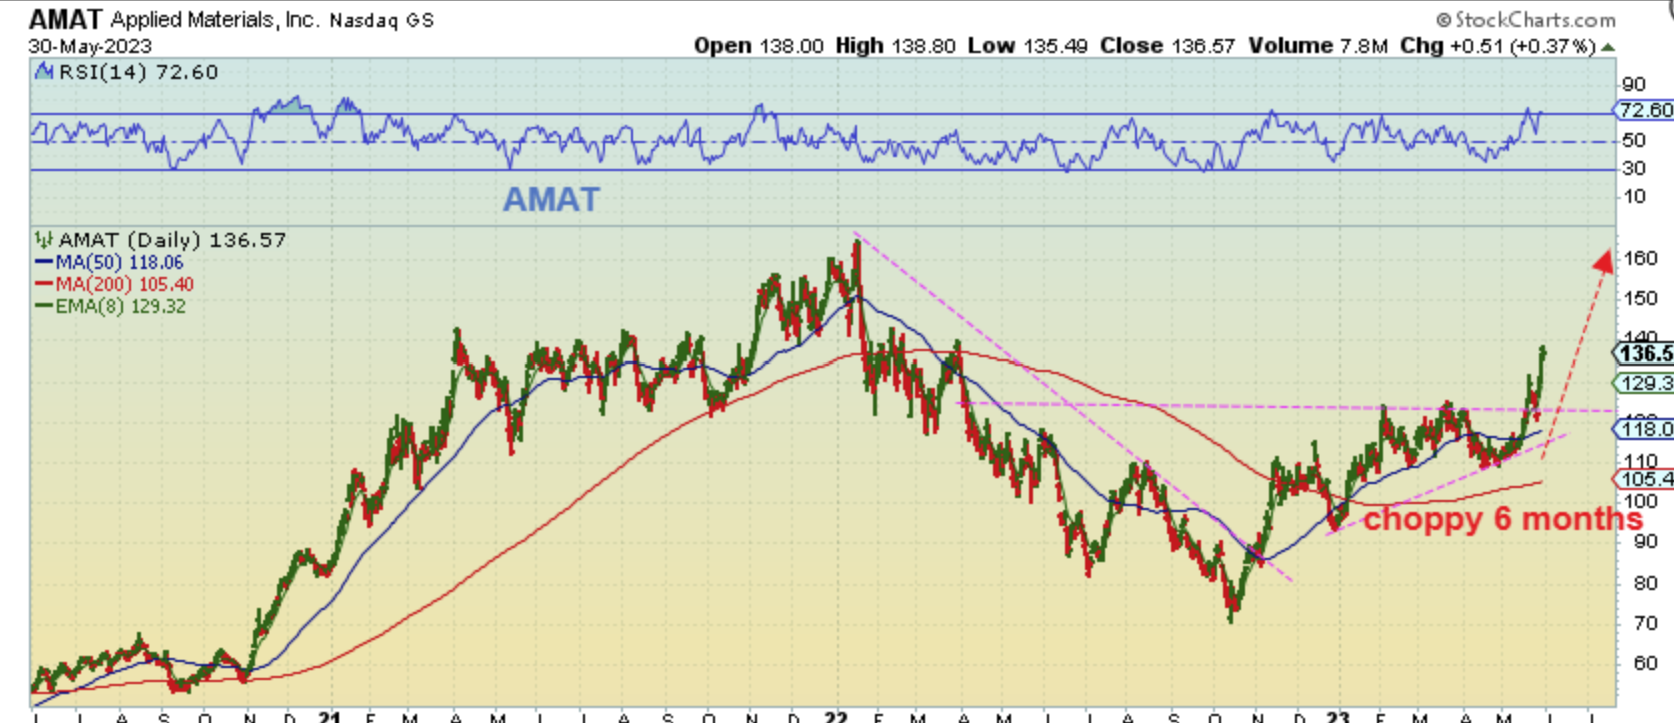
AMAT – If I had you buy AMAT in January, it was choppy and break even for months, right? Buying in November would give you a $110 price and it chopped around $110 all through 2023, but that NVDA trigger is causing a break out from that consolidation and…
.
AMAT – If you now look at that choppy period, we have the Bear market sell off into a V-Bottom. It rallied and chopped sideways for 6 months, but now it could rally to former highs. Buying that NVDA break out area ( or any dip after that) could be worth a buy and hold as some of these start to recover the rest of that bear market drop and return to the highs.
.
And Just a reminder: Some of the recent stock picks in past 2 -3 weeks reports are still acting correctly. Some actually broke higher while others, like TWST, are still set up in a base, but do still look ready to push higher. This tiny move in the base is $12 to $16 and it can run a recovery too.