May 28 Weekend Report
Welcome to the Big Picture Weekend Report.
I usually cover the various market sectors’ direction and possibilities in the Big Picture by using weekly charts, but in some cases I’d like to also show you the daily charts too, since it may affect things going forward. The General Markets have already been bullish out of the lows, but the Semiconductors were lagging a bit by chopping sideways…until This Week. NVDA Earnings caused semiconductor stocks to gap up and push higher, so lets start with the daily chart of the SSOXX.
.
The SOXX actually Gapped DOWN on Wednesday on day 19 and looked rather weak after a failed attempt to break out. Well, then NVDA blew out earnings and Boom! The torch was lit. That was a BIG gap higher on Thursday and another on Friday. It would be nice to be able to by a dip if it takes place anything like this. This may just continue to run though, let me show you why….
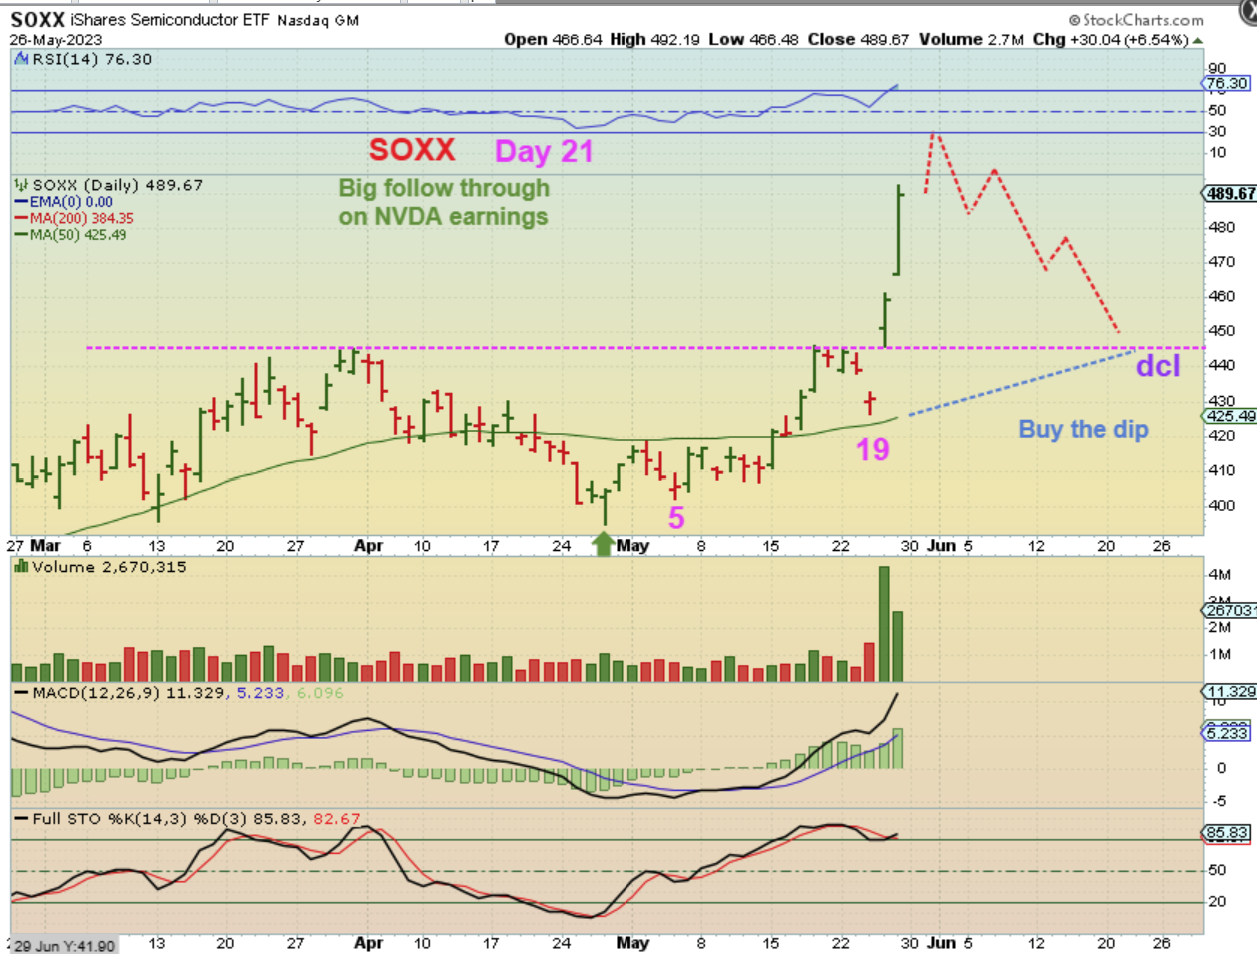
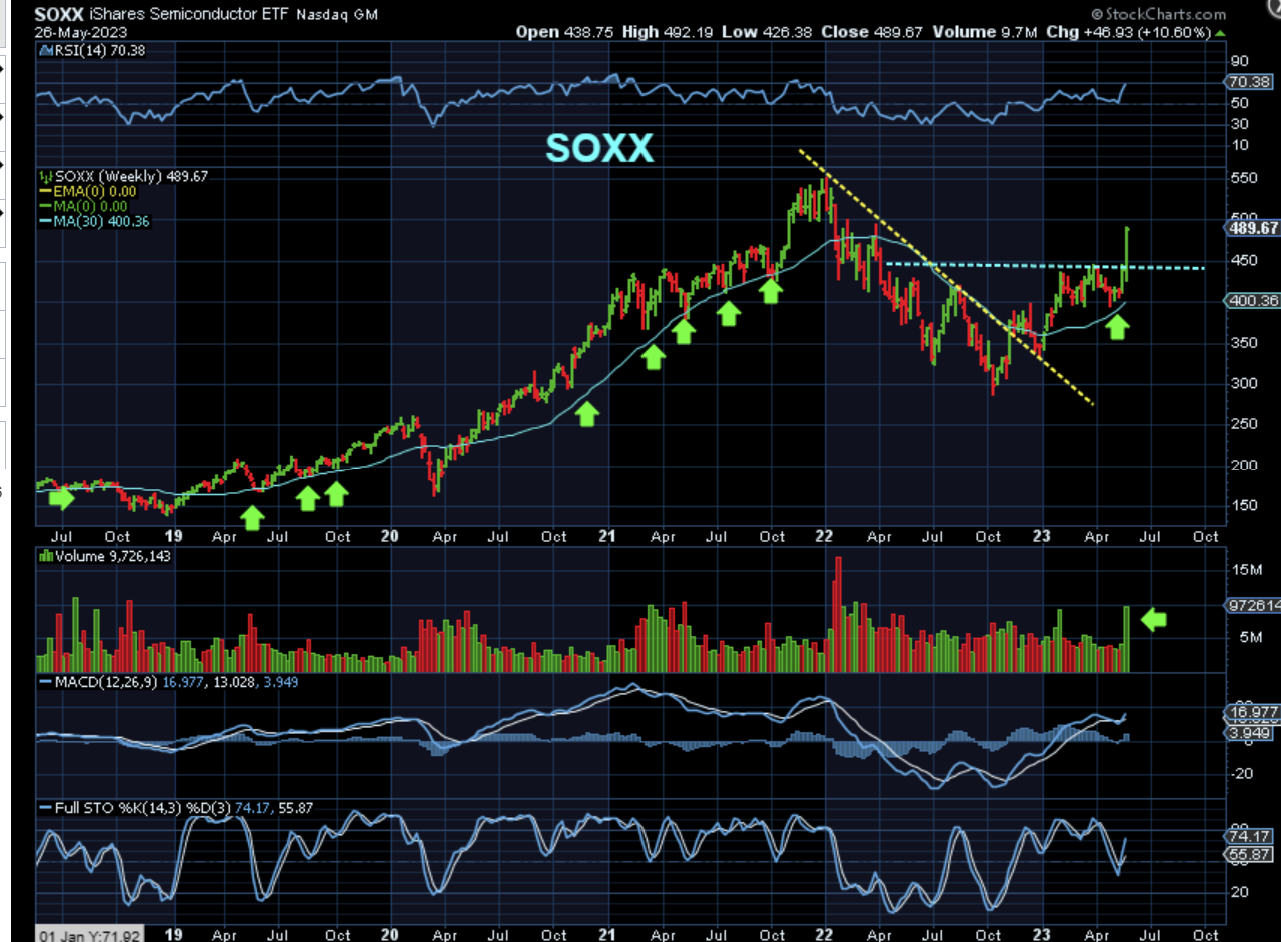
In the bigger picture, The SOXX is really breaking from a base. This may dip back in a dcl dip to back test the breakout as shown in the chart above, but since it is only on day 21, it could also just accelerate to former highs near $550 and then just go sideways slanting lower for a dcl. An opportunity to Buy a dip would be nice.
.
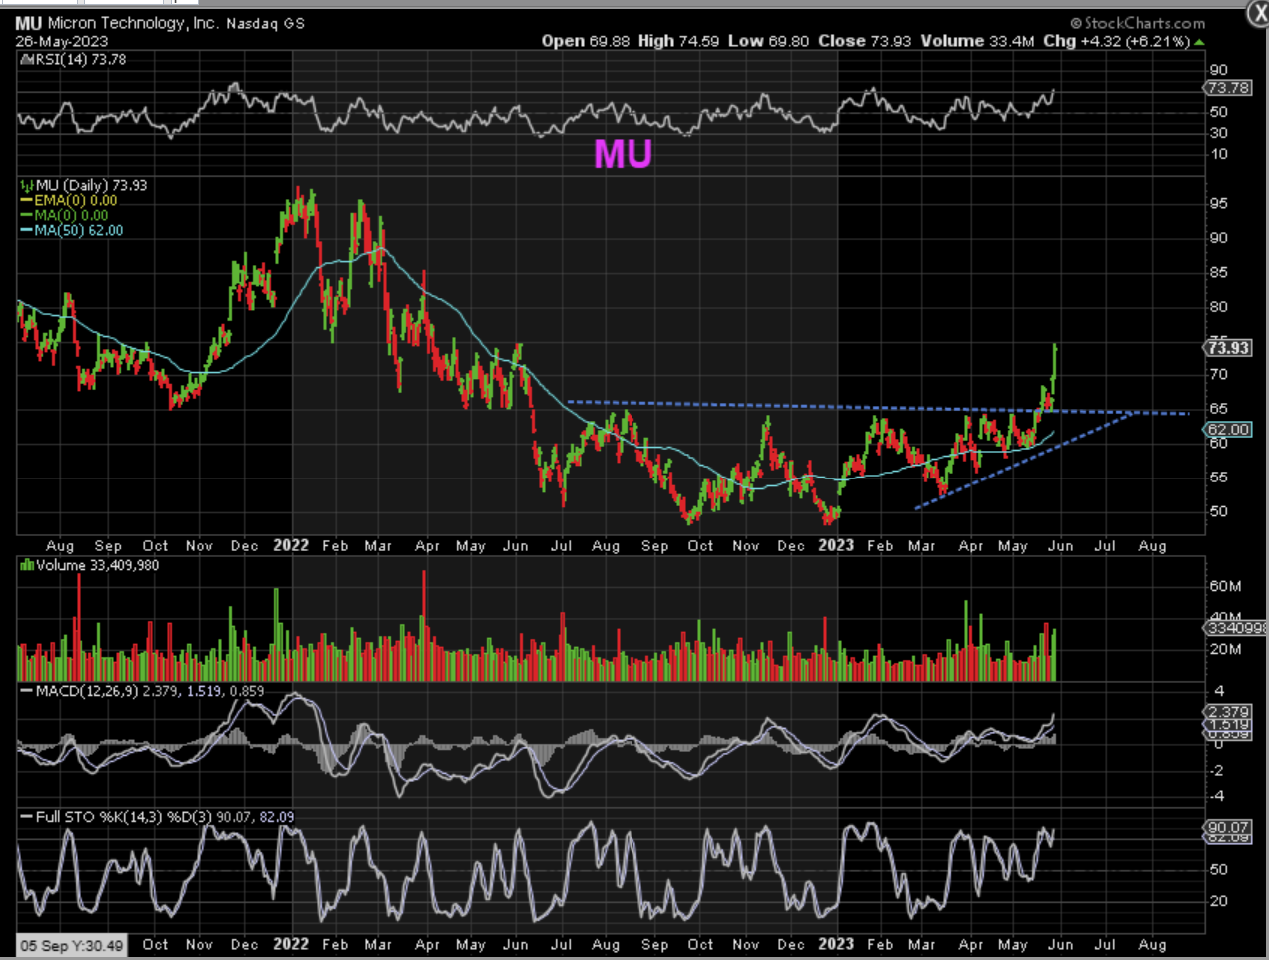
I looked up many Semiconductors and some that were just chopping sideways ripped higher too. AMD, MU, TSM, AMAT, etc were mentioned last week, so let’s take a look at MU as an example:
.
MU DAILY – So this chopped higher into a flat topped wedge for a few weeks. It then broke out and back tested on that Wednesday gap down. With NVDA, it has run from $65 to $74 roughly. Again, at times like this it is good to check the Big Picture to see if maybe we can see how a future entry opportunity may develop…
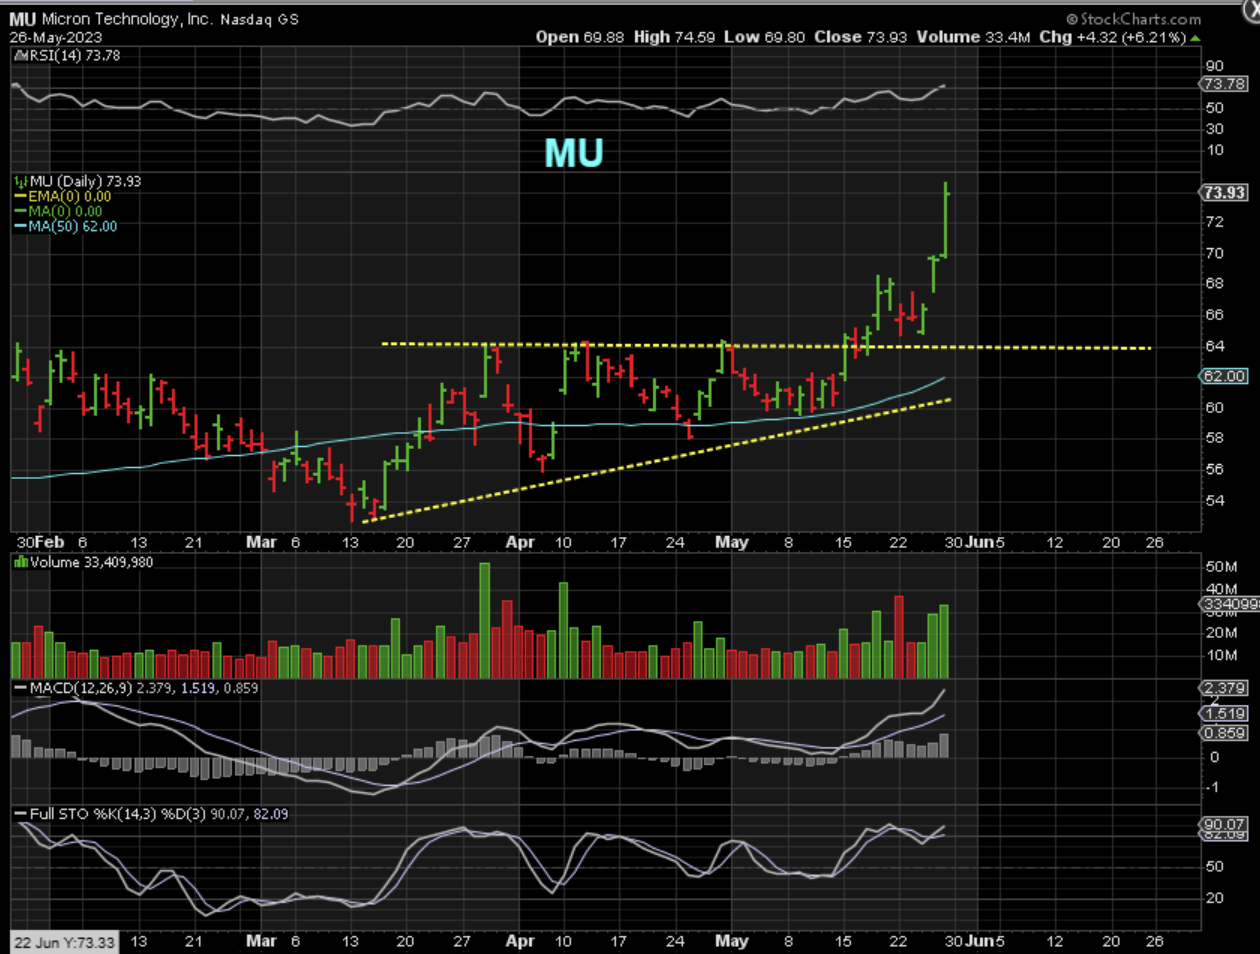
MU is also breaking out from a large choppy base. Again, these CAN just run right back to the highs, or it can pull back to the 10 or 20sma, so we’ll just have to watch these as they play out. Taking a small position last Thursday or Friday would be fine, and then you could add on any dips.
THE SPX is also chopping along sideways, but it does keep trying to make new highs with each chop higher. A buy and hold in this environment ( say SPY or SPXL) is very hard to enjoy. What about the Big Picture?
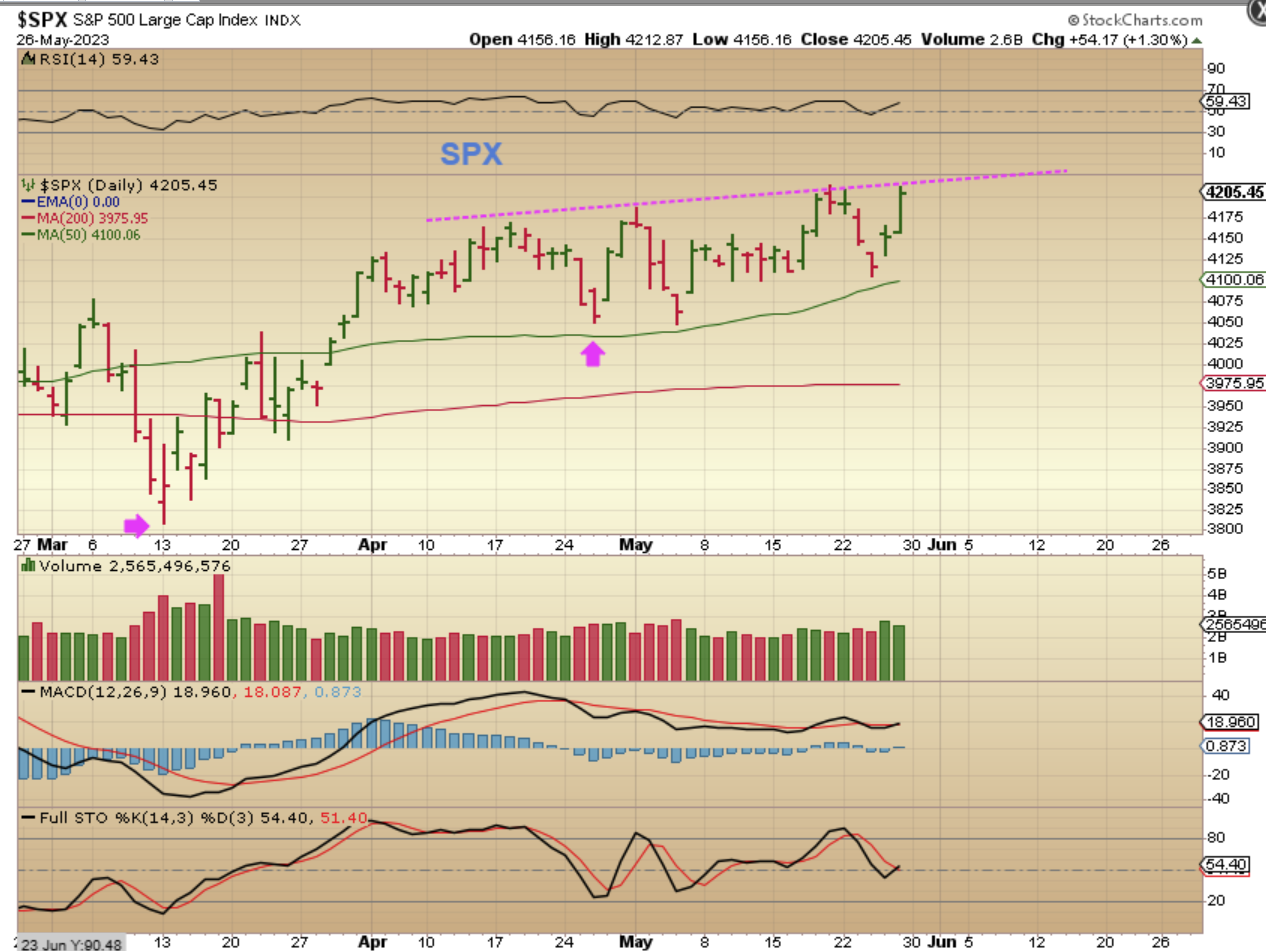
Remember that the SOXX was chopping sideways in a base and then took off higher last week. Well, The SPX is gradually chopping higher in what also could be a base needing a catalyst. For now though, I called for this to be a Bottom to the Bear market correction and a breakout of the downtrend confirmed that.
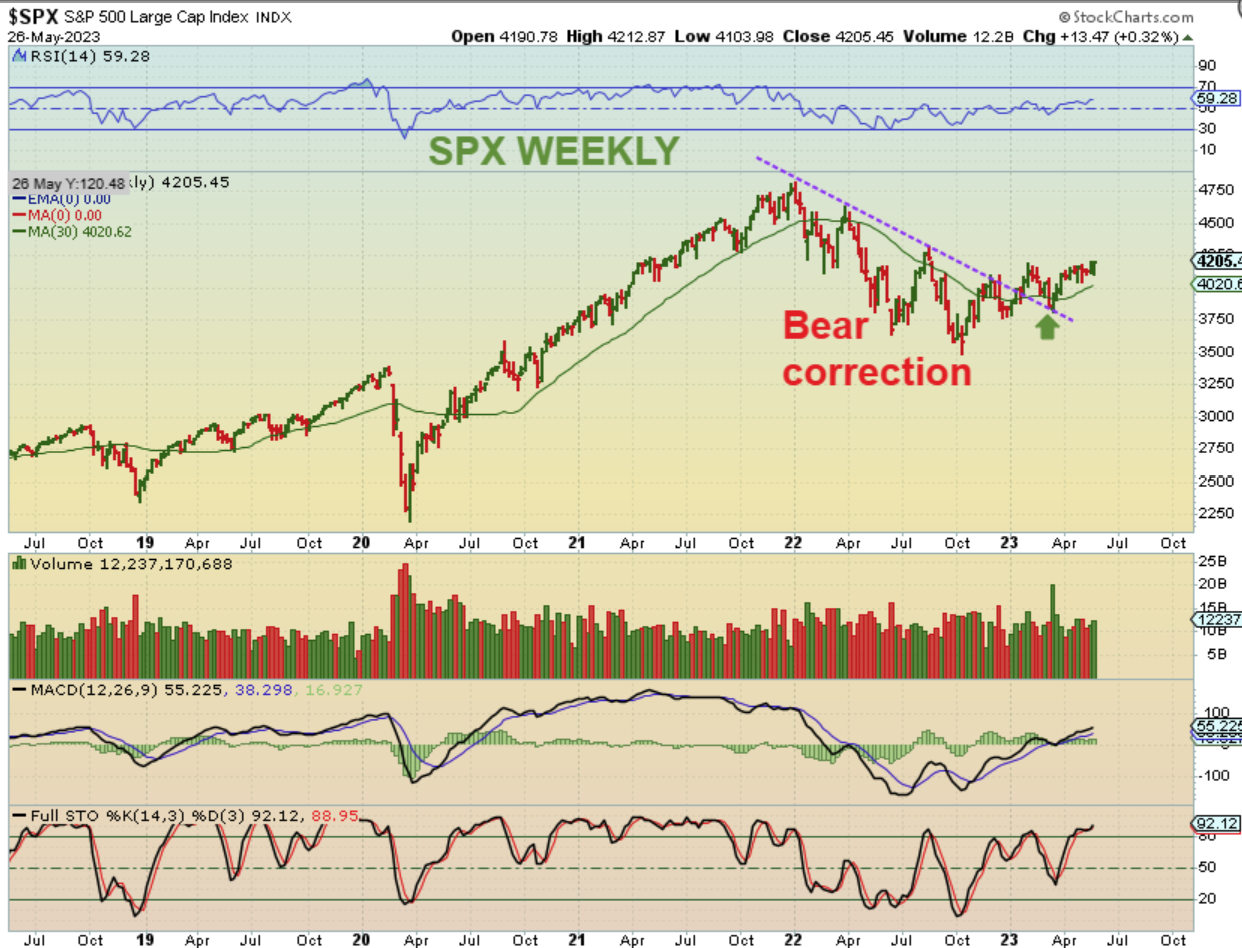
And each week I still say that I am expecting a recession by the year end. This could double top by then, it could roll over and double bottom at the bear market lows, or it may just Ignore Bad News like it is right now ( Inflation, Debt ceiling fears, War accelerating, etc etc.) and keep climbing bullishly. We will just have to take it step by step, but I have been saying all through 2023 that these are bullish set ups, and the SOXX really showed that ‘surprise to the upside’ this week, despite persistent bad news all around.
.
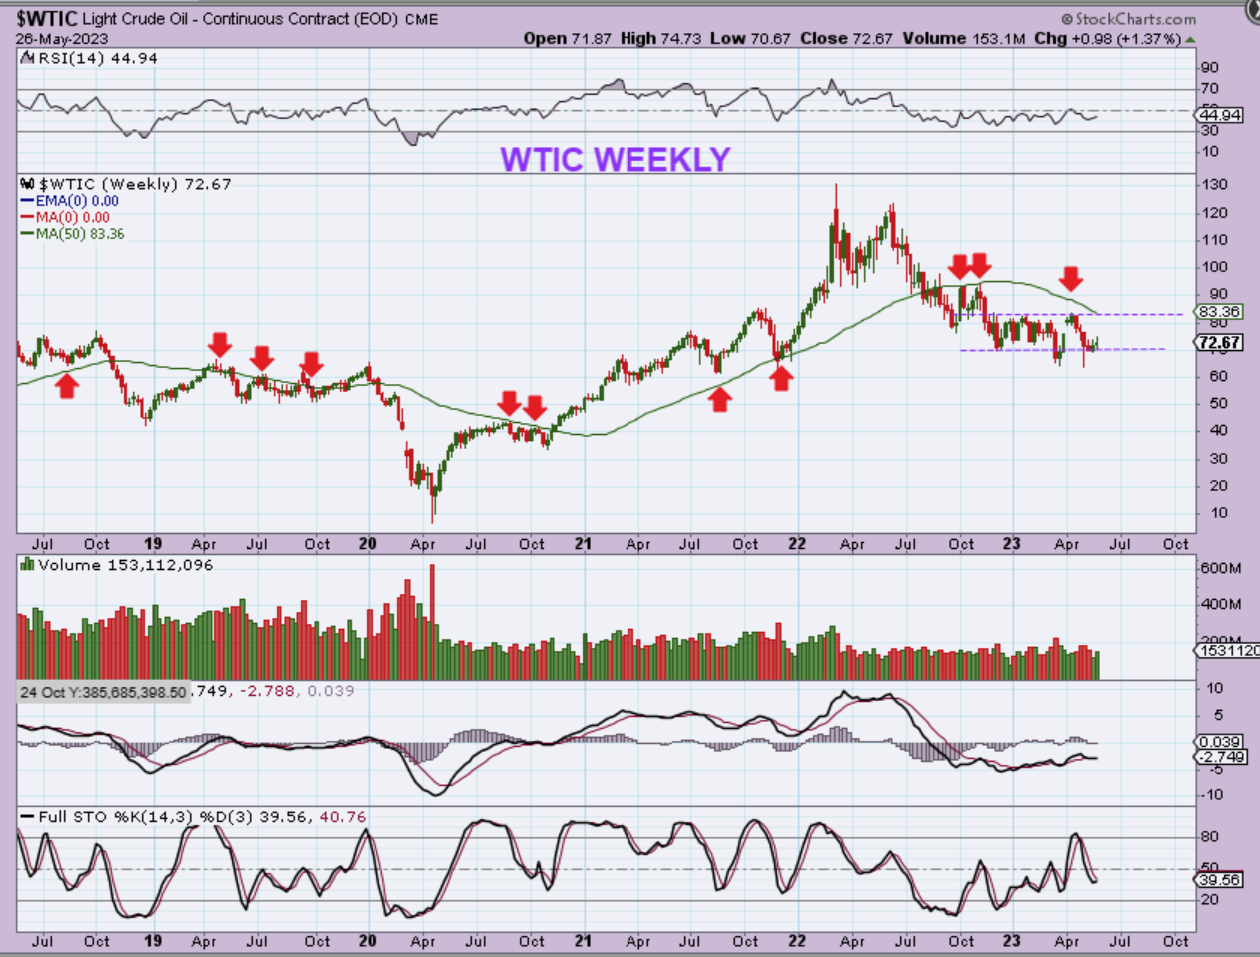
WTIC – Oils weekly chart shows that Oil has simply been very choppy, as it chops sideways in this channel. Really, until Oil breaks and closes above $83 for a while, I see this as continuing to be choppy or in a downtrend with occasional trades to the upside from the bottom of the channel.
.
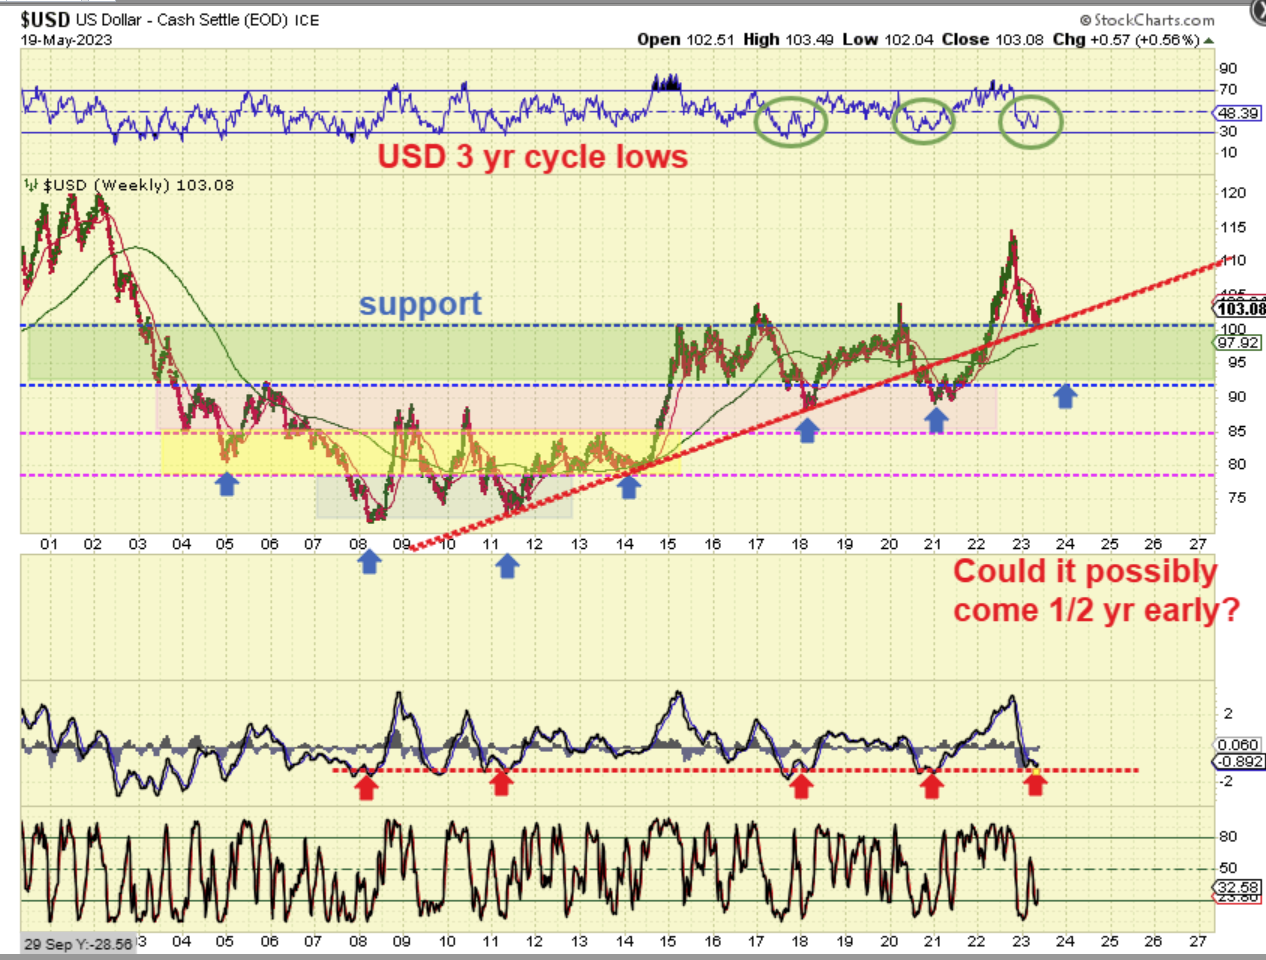
THE USD has pushed steadily off of the lows. At this point I am seeing this as an ICL and expect possibly 2 daily cycles higher. The 2nd daily cycle higher should peak as L.T. and begin to drop again, allowing Gold to bottom and break out from the Massive Pattern that it has formed.

I admit, the USD looks strong and last week I discussed with this chart that it should seek out and be due for a 3 yr cycle low in early 2024.
As you can see, these are very consistent time periods, but I did question: Could that 3 yr cycle low come now a half yr early and cause Gold to have a triple top? With so much Fed intervention, it is hard to say, but I am sticking with the original plan for now, and that is: The USD should drop into a 3 yr cycle low this year, likely at the next blue arrow so…
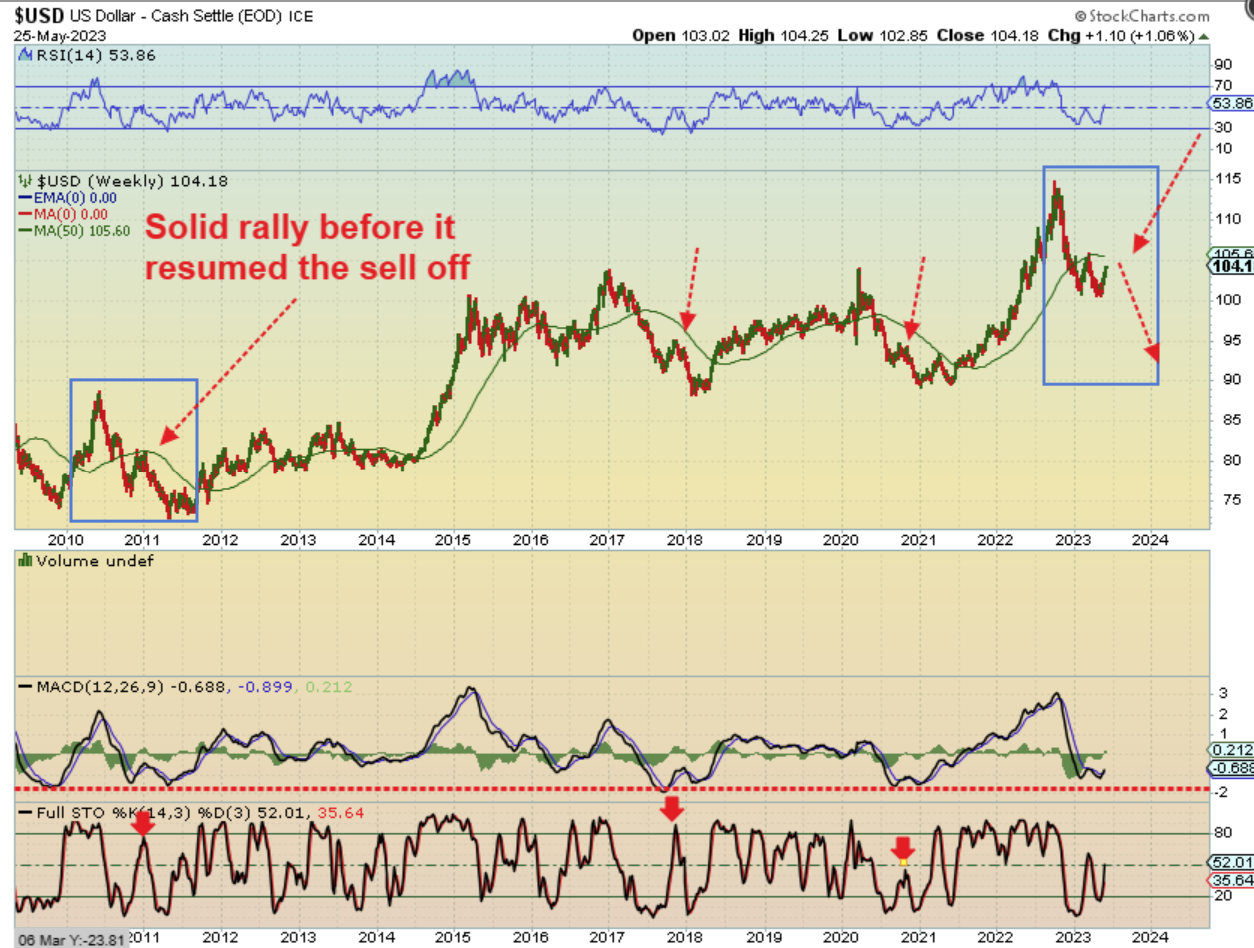
I wanted to go back and see if I could see a similar drop as the one that I am seeing now.
The USD does have a similar drop with a mid-point rally back in 2010-2011. That also looked like a strong USD rally, but it did roll over and continue the decline to the 3 yr cycle low. 2017 and 2020 have red arrows pointing out USD rallies that failed too.
.
Note: If the $USD closes firmly above that Green 50 week ma, which stopped price back in 2011 and recently, then I may have to start looking at things differently.
.
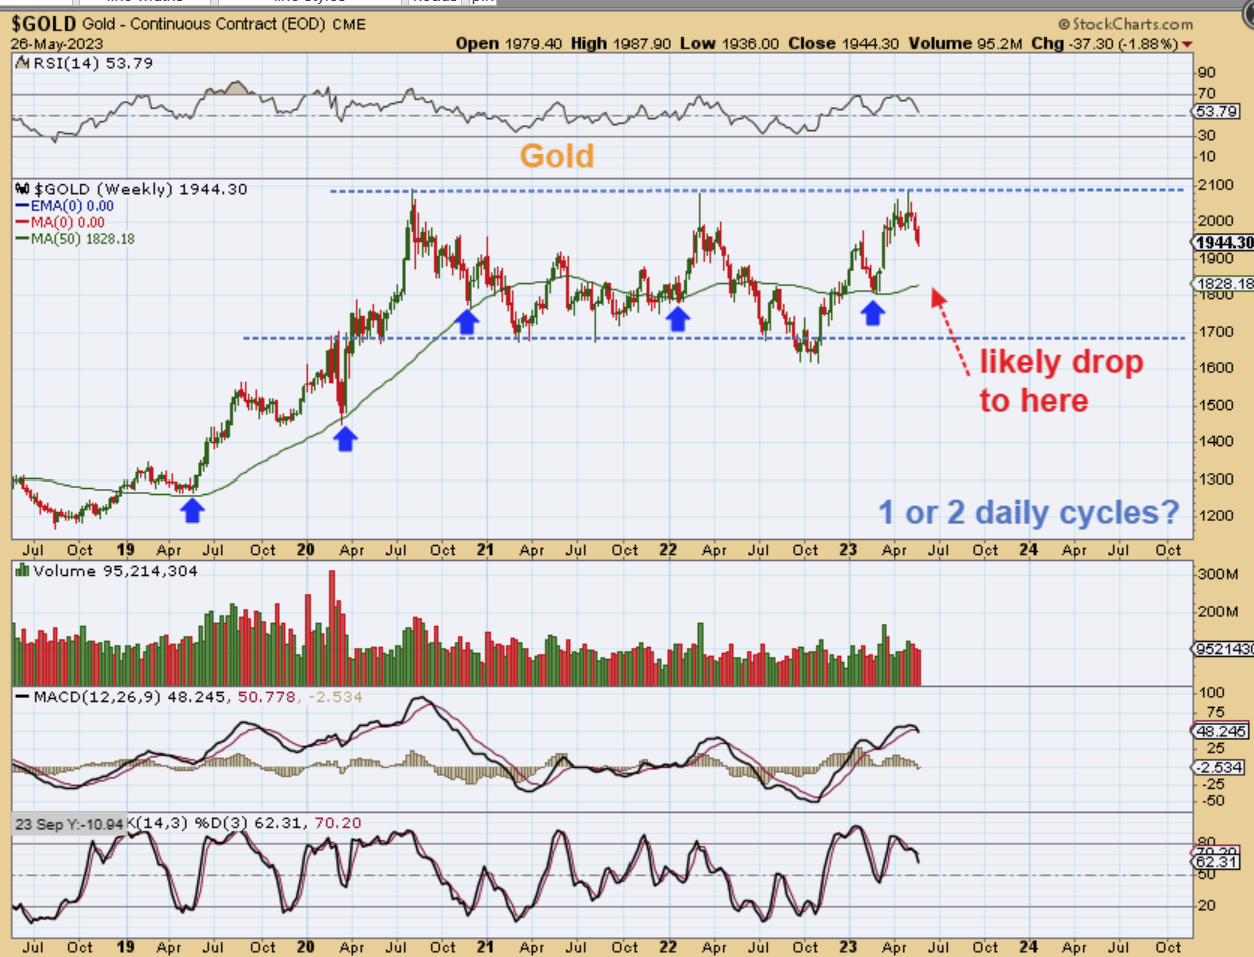
GOLD made it back to the highs. We bought that shake out low expecting Gold to run to the former highs, pullback, and then break out and so far that is happening. If the USD drops and then has another daily cycle to new highs, then gold can put in a dcl, rise up and then drop one more time too.
.
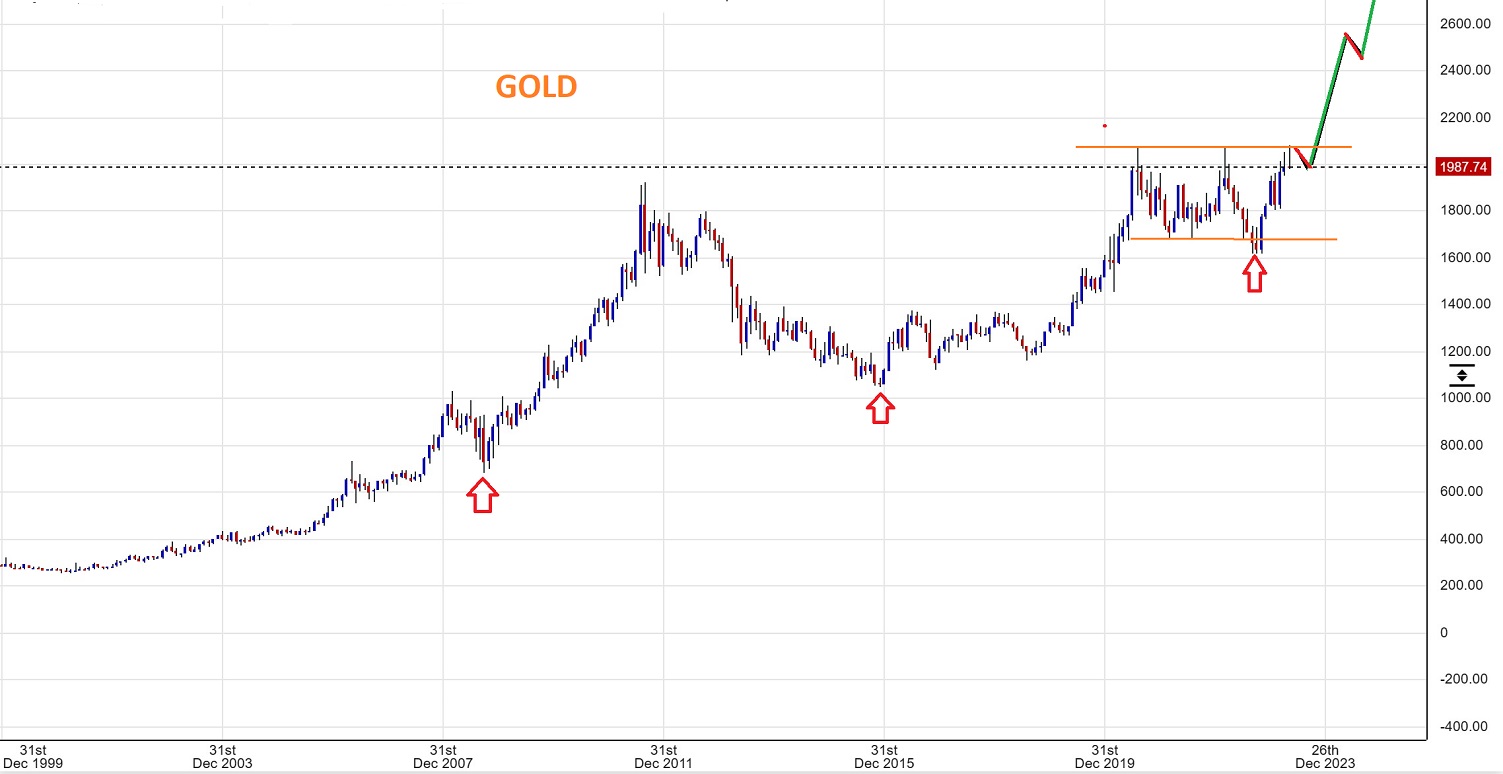
GOLD I have been posting this BIG PICTURE CHART, to show what I am expecting.
1. Gold has reached former all time highs as expected.
2. We almost always see a pullback at this resistance to build energy for a break out.
3. I think that the next rally will be explosive and become the next blow off top, where Miner will rally Very Strongly, just we like recently saw with HMY, OR, GFI, AU, etc. We must be patient and wait for that time to come to us.
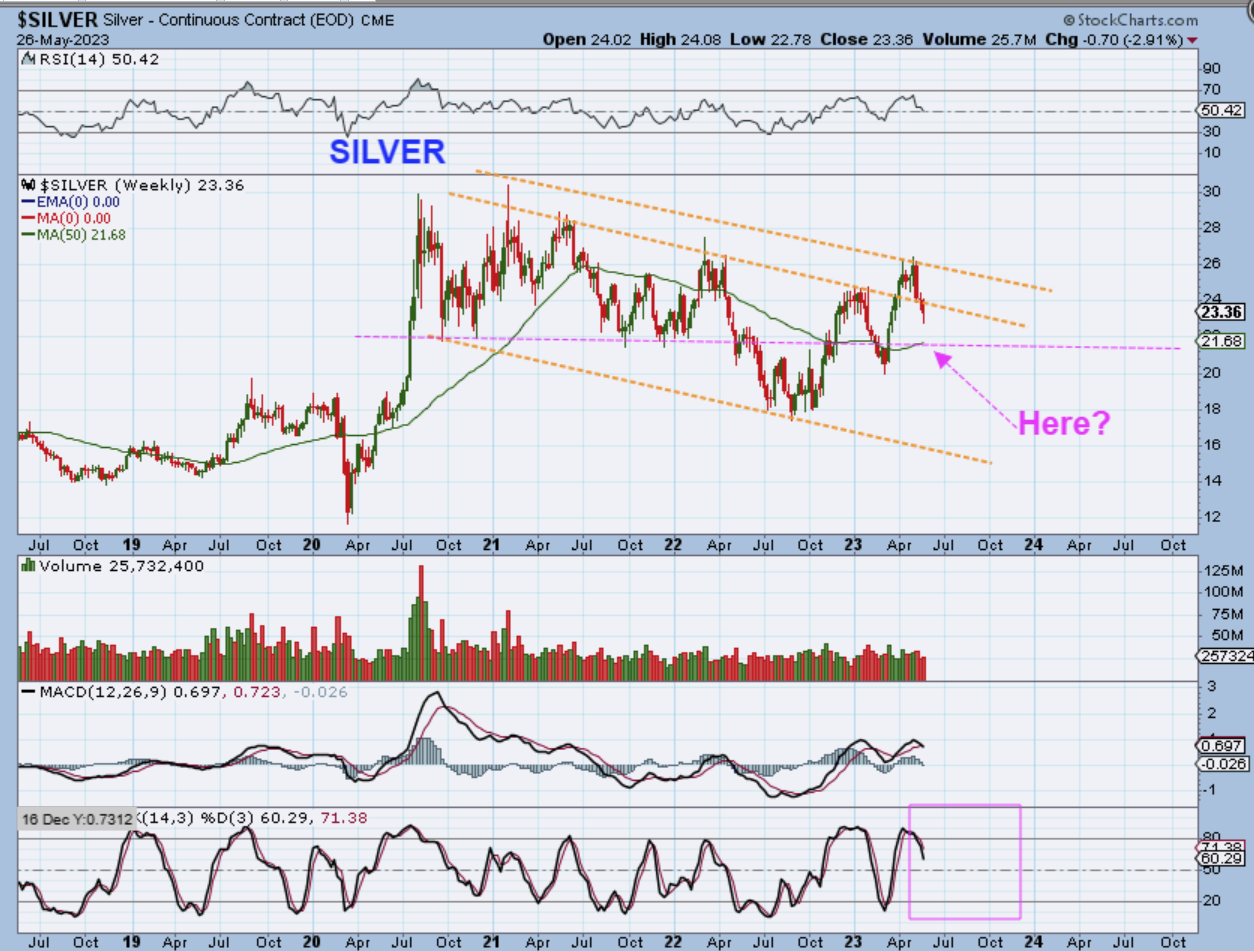
SILVER – The Big Picture for Silver is a choppy looking chart. I’m thinking that it might only drop to the Magenta line or 50 week ma, but when it rallies, it can run very strongly. When it dips, it can plunge, so at this point we are seeing a dip and we want to avoid any plunges. I got stopped out near the top on a large down day and I was eager to get back in at that time, but the opportunity has not presented itself, so we want to be patient and allow this to play out.
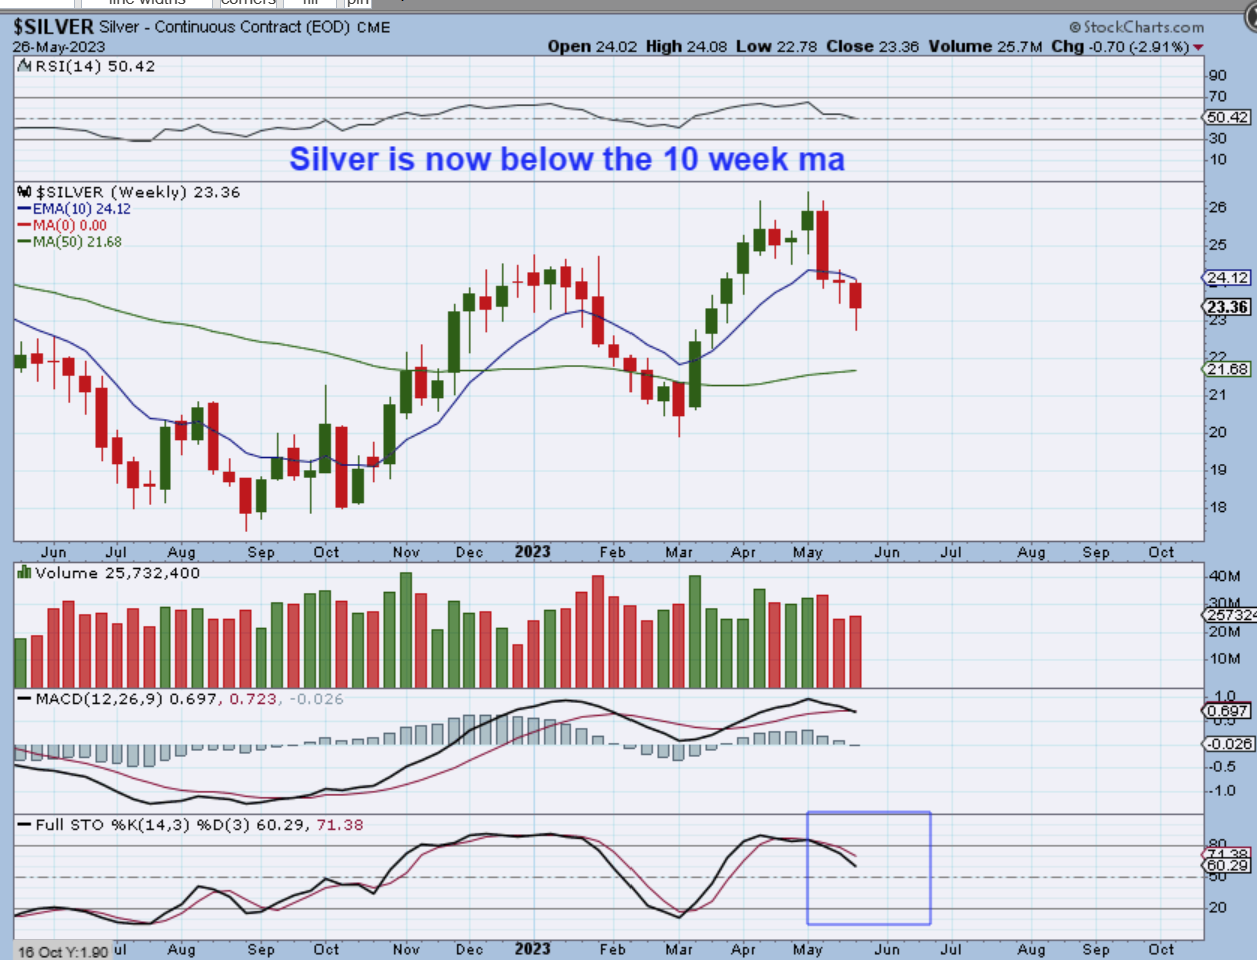
SILVER – has a weekly reversal candle, but in technical analysis, a close under the 10 week ma is often a sign that a bigger pullback is coming ( ICL). So this may chop sideways this week if the USD pulls back, but I am not expecting a rocket higher yet.
.
On May 18th I showed how similar this top looked to the drop that was supposed to lead us into an ICL in February. So I drew a continuation to the sell off…
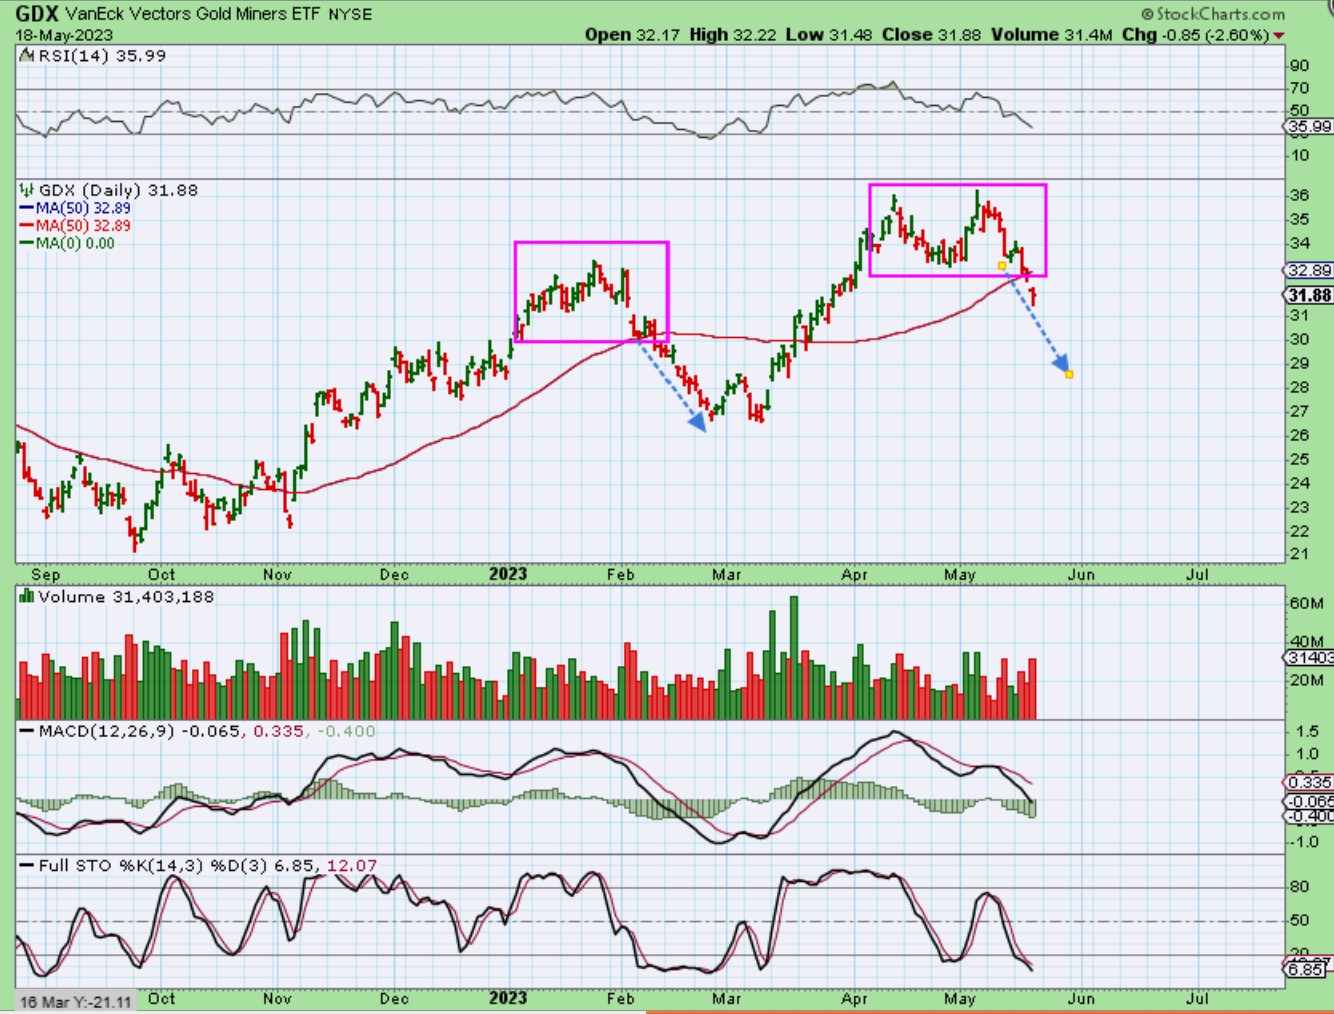
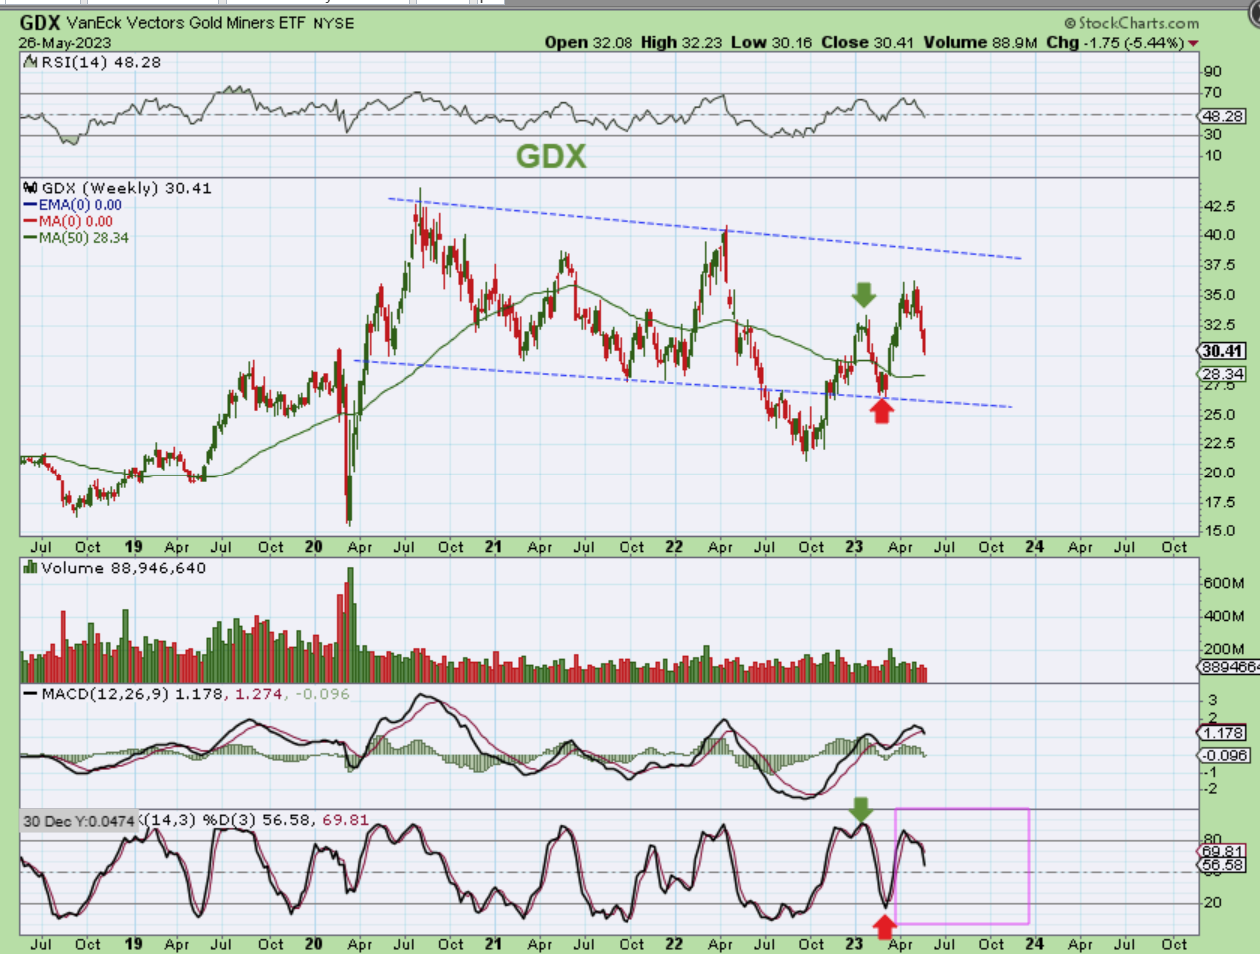
GDX Then I started to show the similarities between the ‘ Drop – Pause – and the sell off’ in GDX then and now. That sell off was a slow motion day after day after day drop and those can be rather torturous. As of May 24, it looked to be repeating. So at this point I am expecting us to see GDX back down near or under that 200 sma.
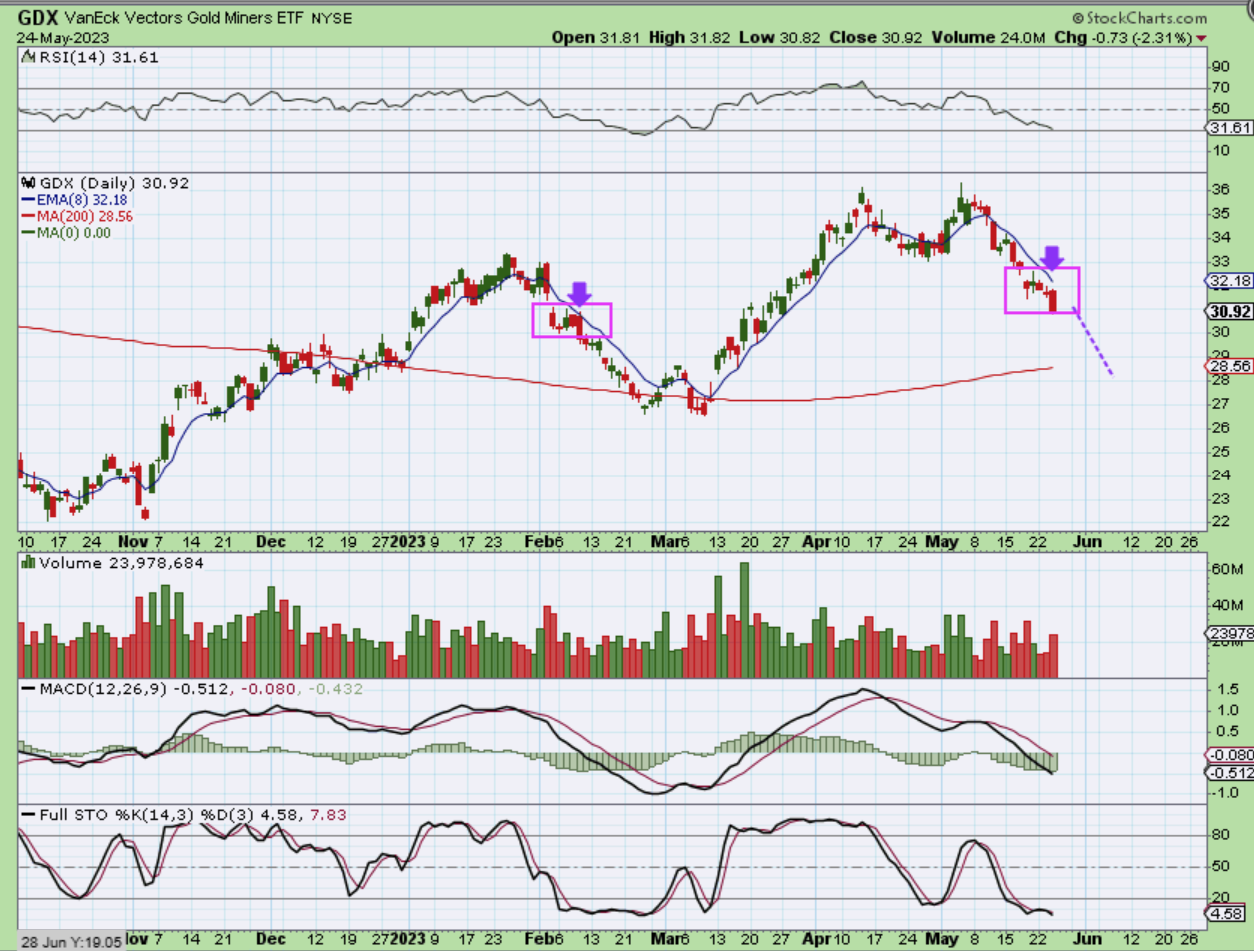
GDX WEEKLY – In the Big Picture or on the weekly chart, that long slow relentless sell off in February doesn’t really look at all that bad, because it then recovered very quickly. I am expecting this to drop back to that area and hopefully it rallies up just as quickly as we saw when the Banks failed.
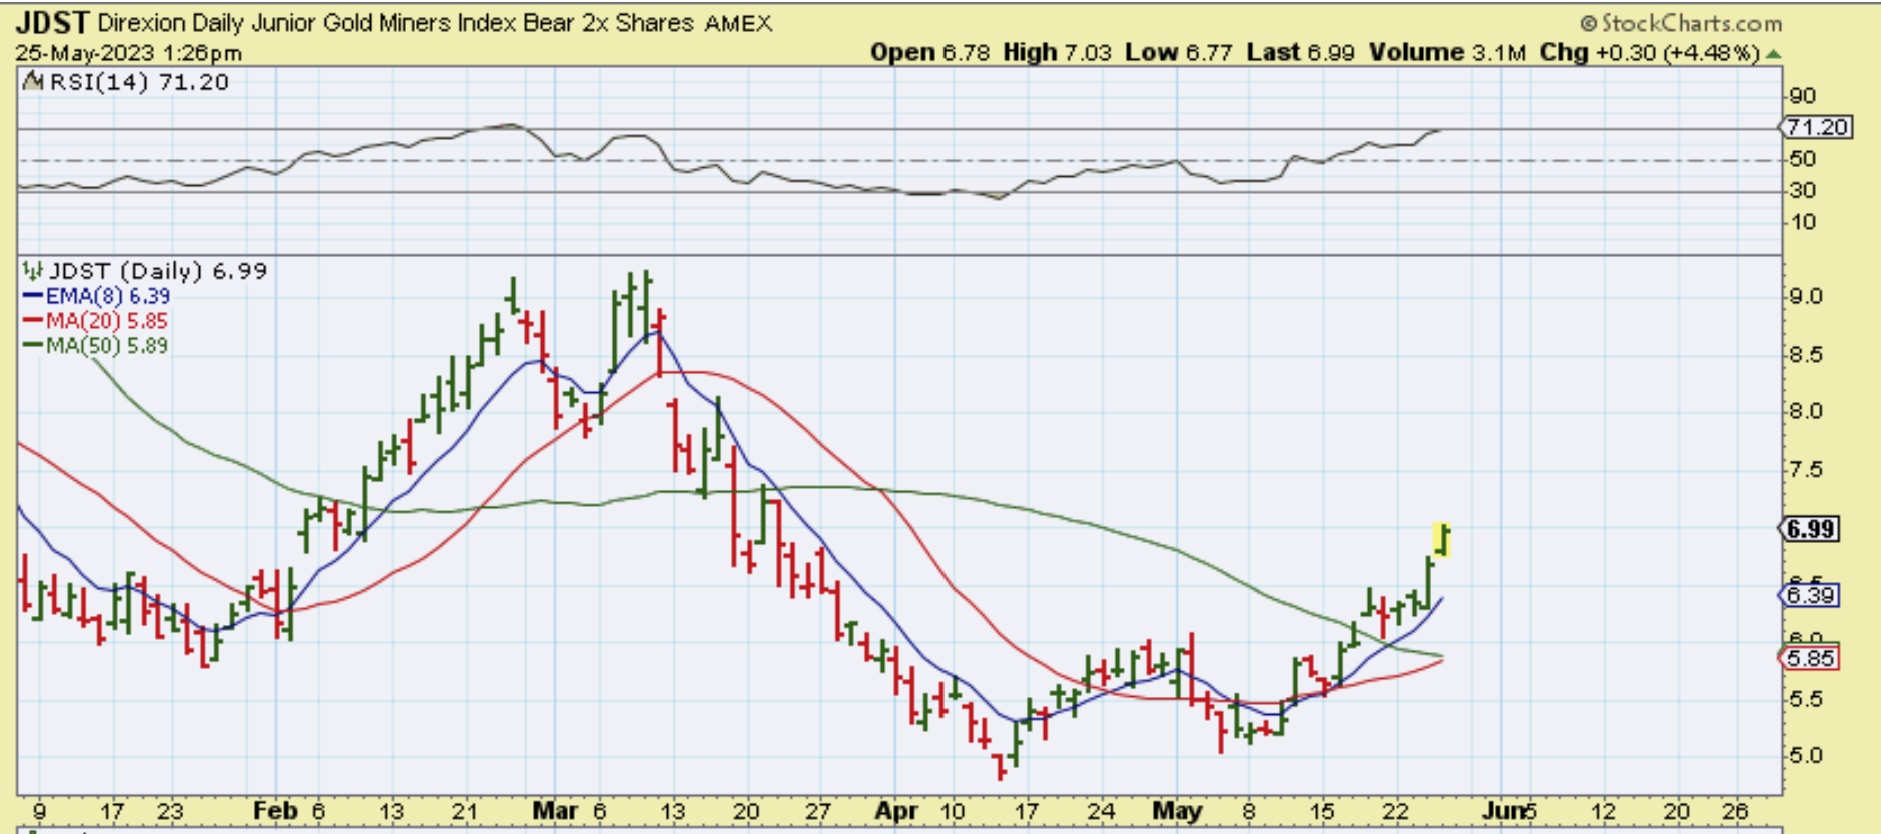
I had mentioned that with a sell off more than likely, anyone that likes to just ‘Buy & Hold’ could add some JDST or DUST to their portfolio to ease the pain of a sell off. So far JDST hs helped in that case.
.
So really we have Bullish charts remaining in the General Markets, but they are getting follow through higher despite the USD rise. The Big Picture Charts for Gold, Silver, and The Miners also remain bullish at this point too, but they are dipping lower as the USD rises. And I have been saying that BITCOIN looks to have put in a dcl for a 3rd daily cycle, but it kept chopping sideways. Does it remain Bullish? We’ll look at Bitcoin below.
.
Enjoy your long weekend if you are in the U.S. and thanks for being at Chartfreak with me!
.
~ALEX
.
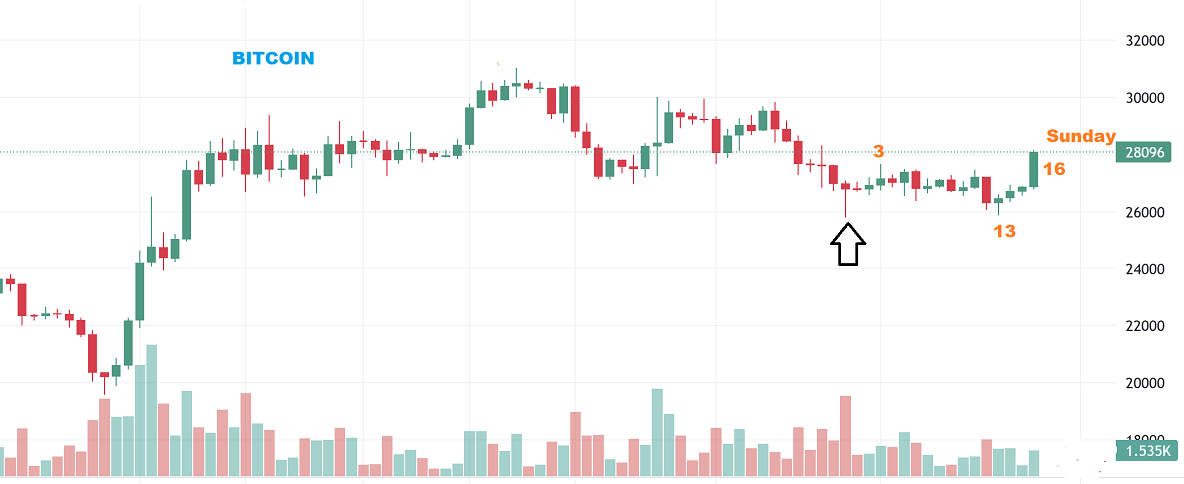
BITCOIN Does remain Bullish. It continued to chop sideways and even threatened the lows last week on day 13, but take a look at what it has done on Saturday and Sunday. Bitcoin is pushing higher out of those day 13 lows, so things do look good for Bitcoin so far. This is the 3rd daily cycle, so we do need to watch for signs of weakness once it has an opportunity to run higher. The crypto stocks also look good with most holding at support during this choppiness.