The May 6th Weekend Report
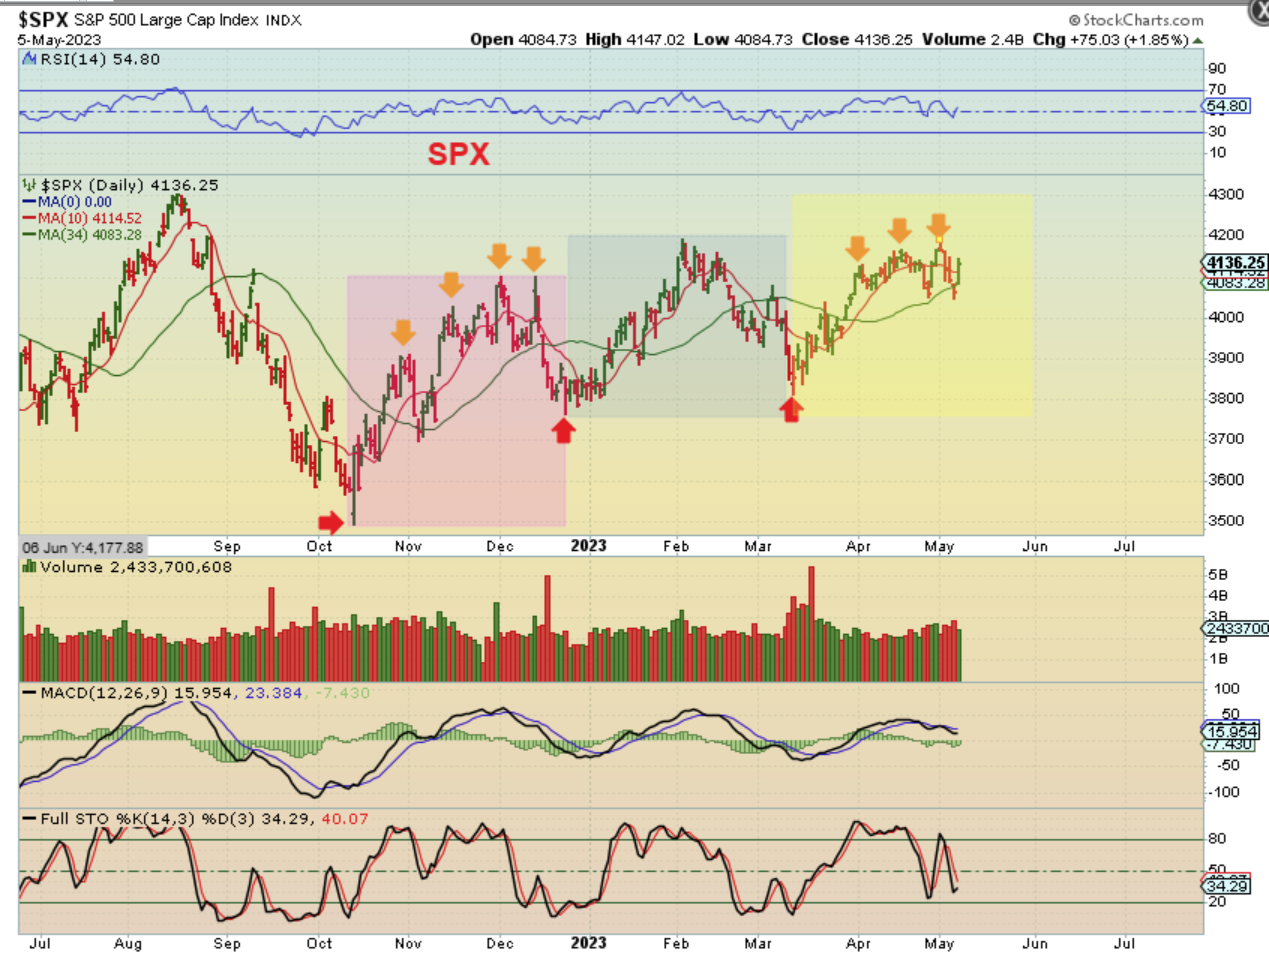
SPX DAILY – On Friday the General Markets reversed again at the 34 sma area and did not have follow through on the Post Fed sell off. This was likely because of Fridays Jobs Report, so short term we have a choppy top, similar to he first daily cycle. This looks a lot like the November -December topping process to me,
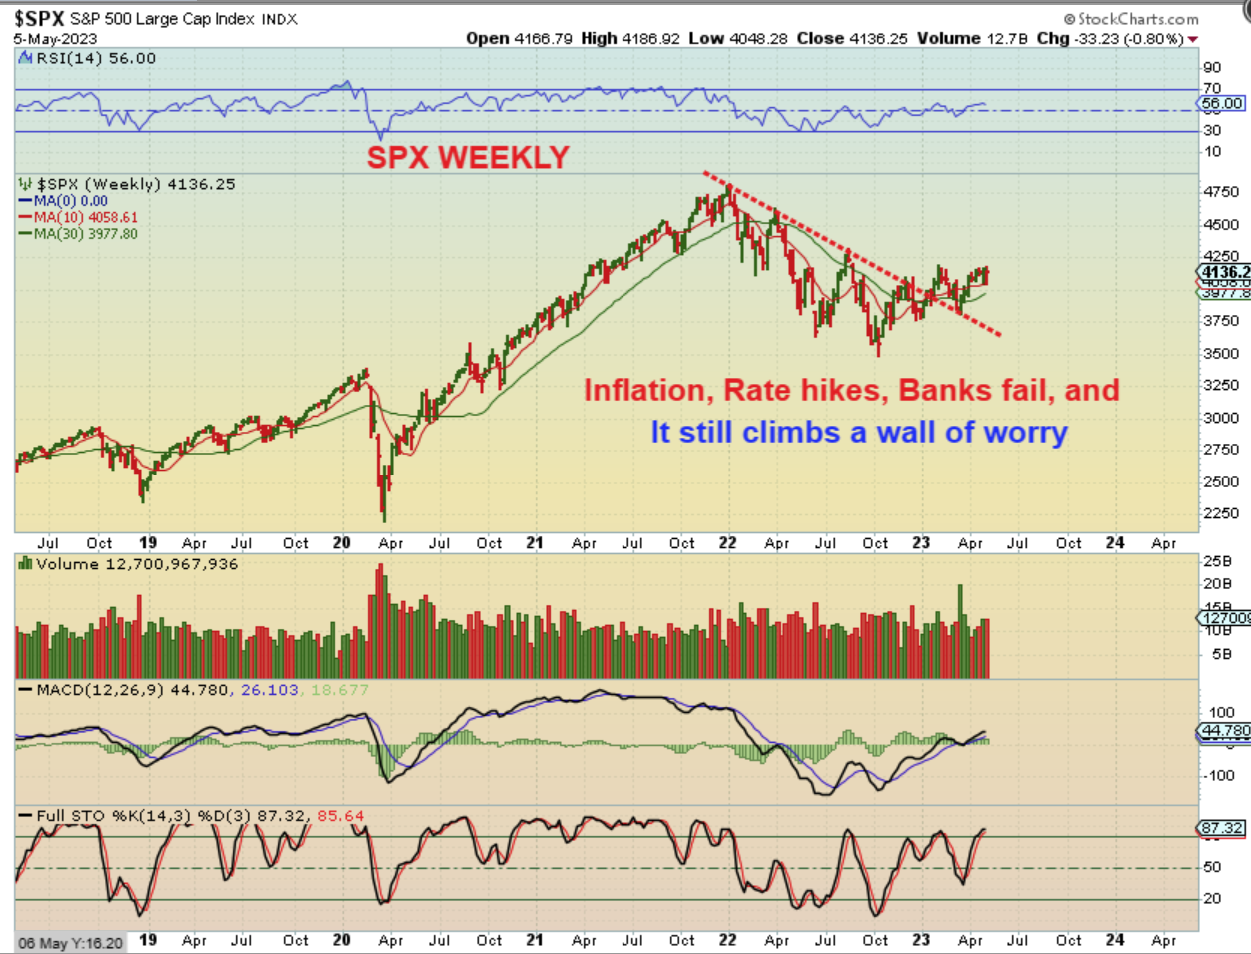
SPX WEEKLY- We caught the lows (ICL) last year and watched for the breakout at the downtrend line to confirm that the bear market selling was likely done after 1 year. We got that breakout and a back test already. The markets continue to climb a wall of real worry. Can this continue if we have a recession ahead (which I think we will see by the end of the year)? …
.
Against all odds and with the bad news of inflation, rate hikes, War in Russia / Ukraine, Bank failures, etc – The markets have bottomed and since we got that breakout and a back test already, I do think that this can continue higher, so…
.
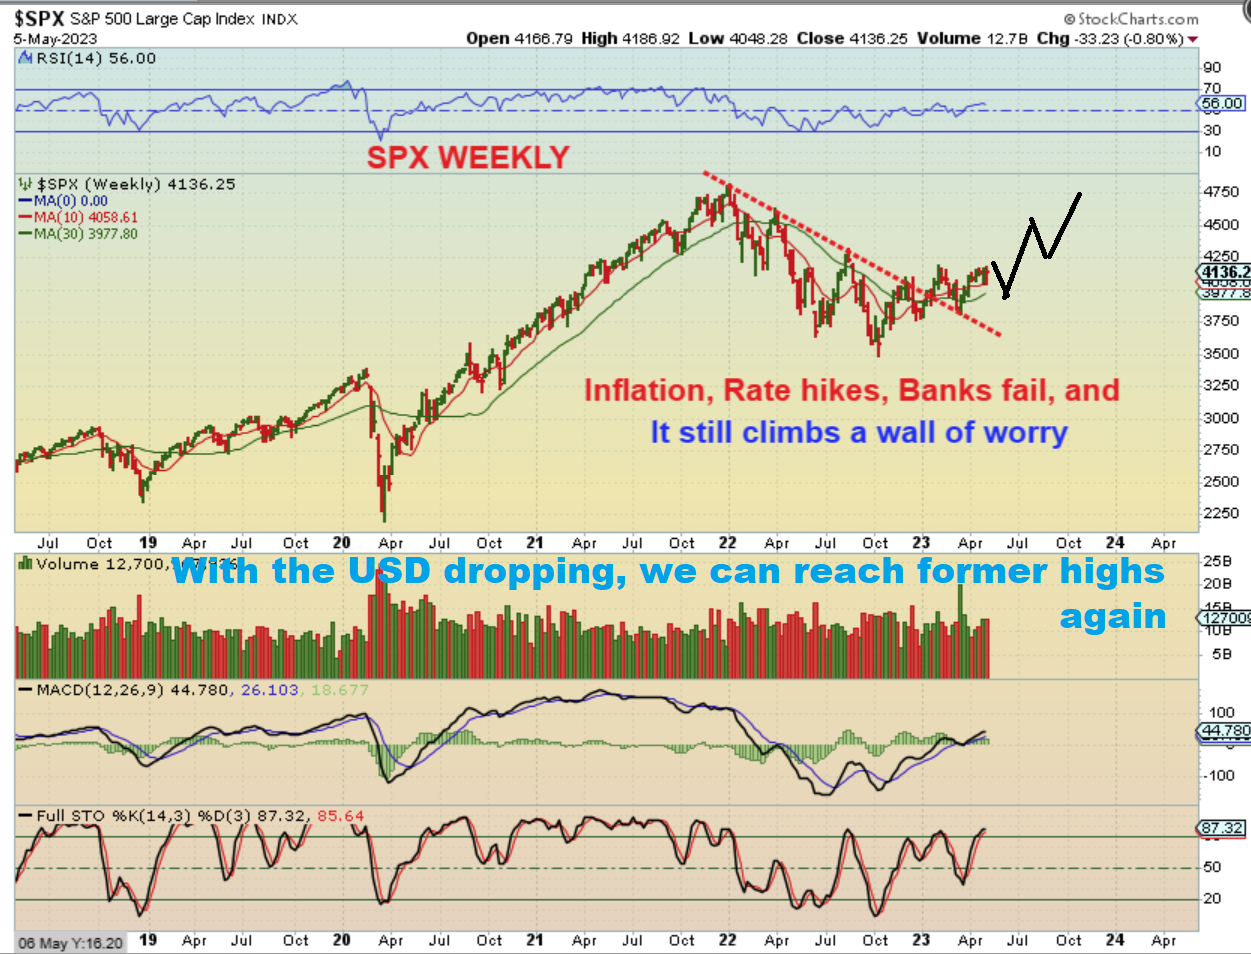
Soon we should have that USD breaking down again, so I can see this heading back to the highs, but then what? By then we should see ‘data’ showing evidence of a recession and the markets Might double top and roll over into another bear market drop, but we have to wait and see. This is how I still see the Big Picture for the General Markets.
WTIC –Take a look at what Oil did in 2019. It chopped sideways along the 200 week ma, and that is horrible price action to trade in. Oil has started to do that again so this may just remain choppy. Let me zoom in…
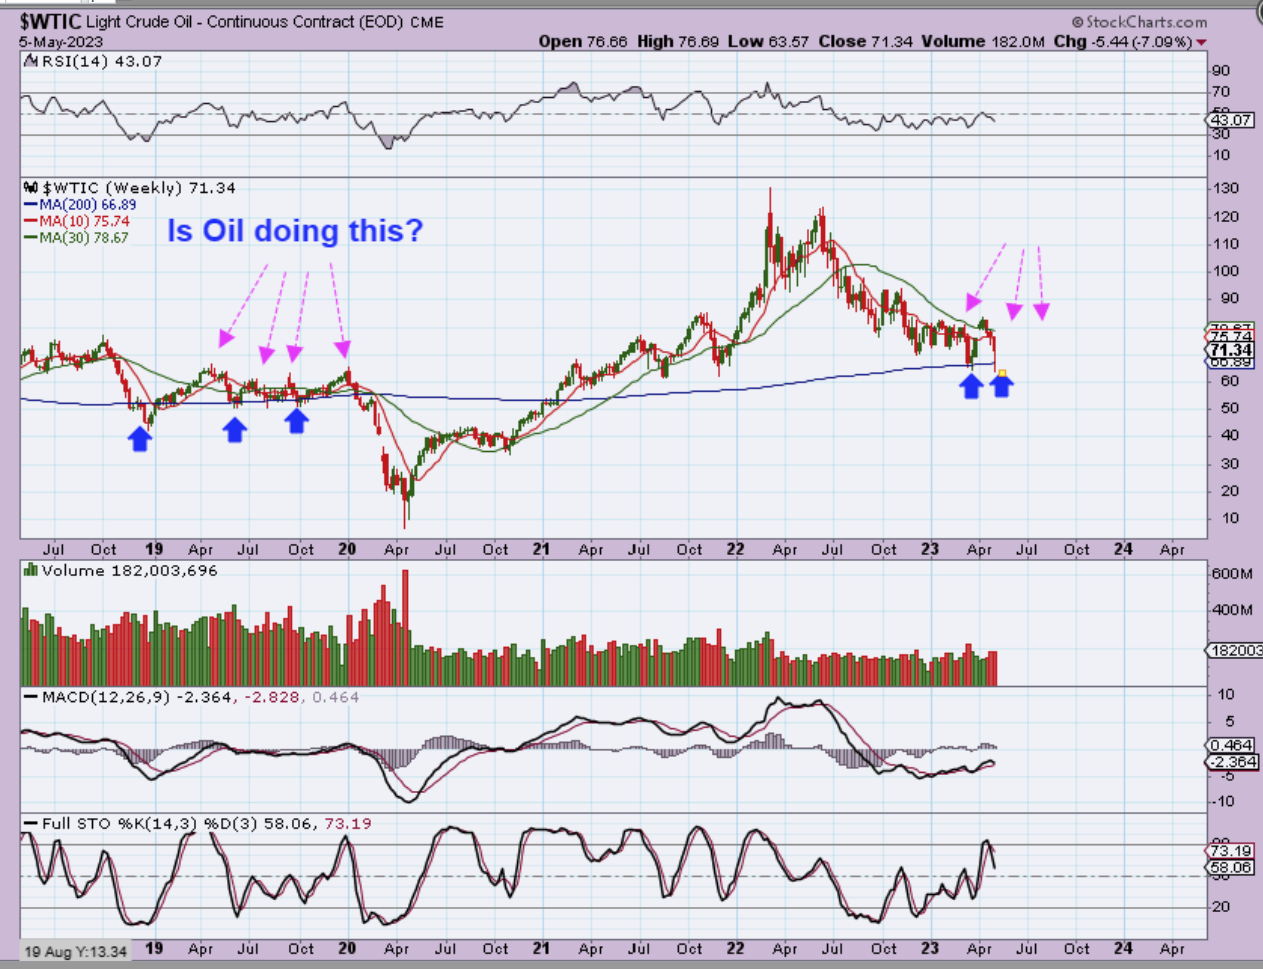
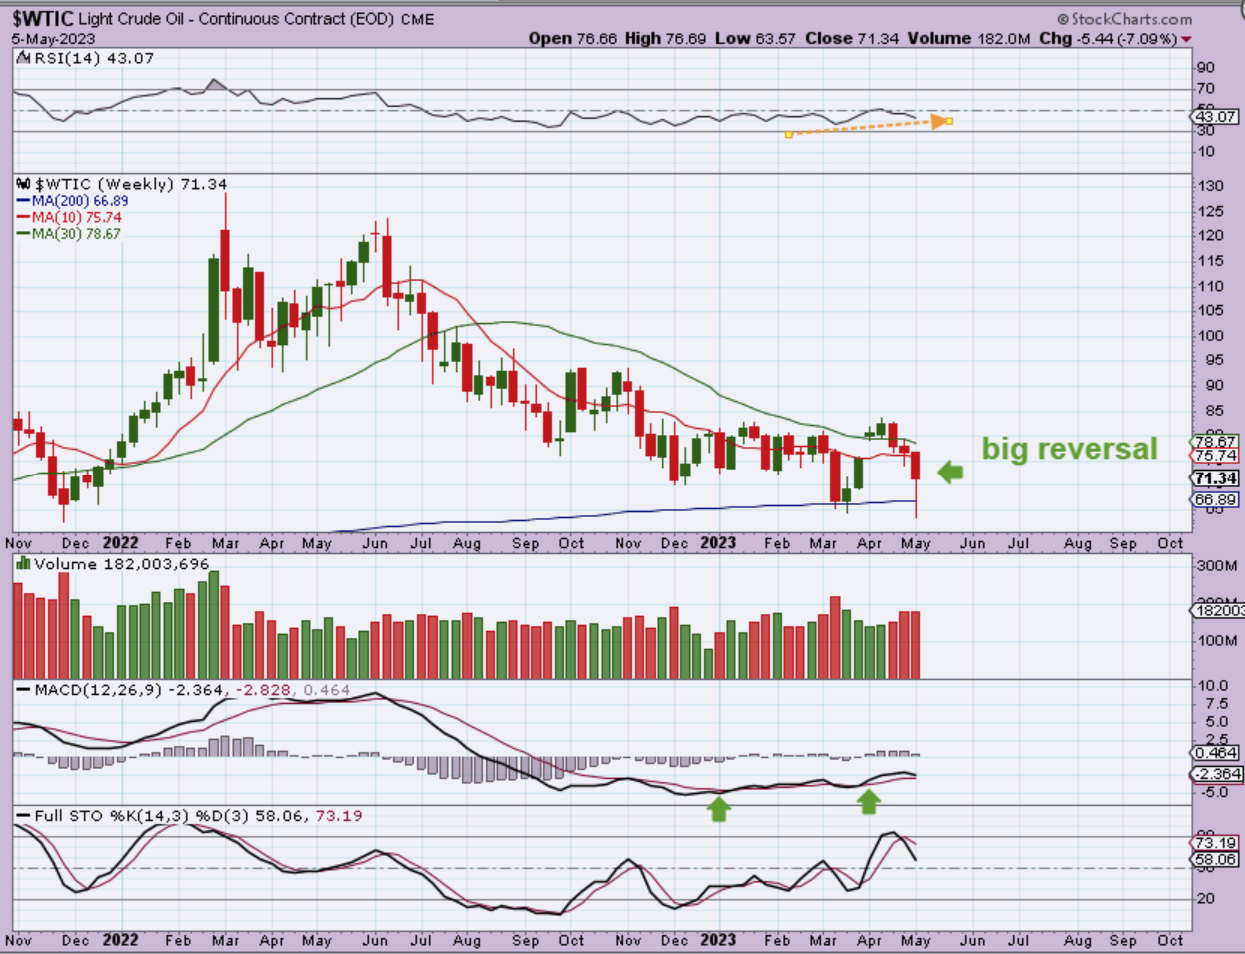
WTIC – When I zoom in you can see that Oil crashed this week and bounced back to give us a weekly reversal candle. This could break out and run as a false sell off with divergence or this can keep chopping like I just showed you in 2019, so for now I’d rather be trading other more stable set ups, like The Precious Metals. This could, however, be an ICL buy.
I’m going back to Dec 2 here for the USD : In 2022 I had been pointing out as the USD rallied straight up that it would top and drop into a 3 yr cycle low. I will admit that at times I thought we might get as high as $120, but I still expected a top and drop to Bottom out Gold & Silver and give us a great buying opportunity that would rally through 2023. At $115 it began to drop.
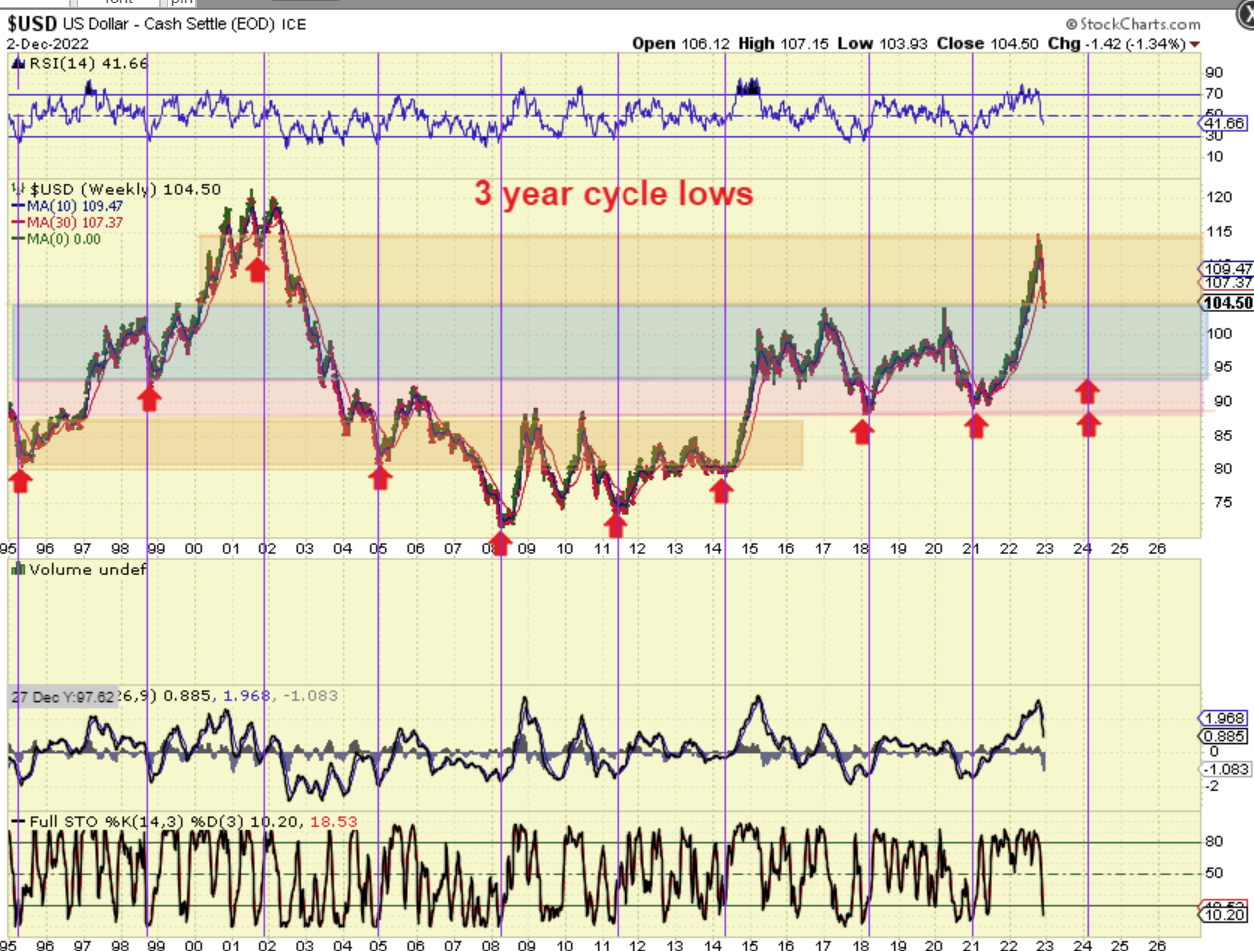
.
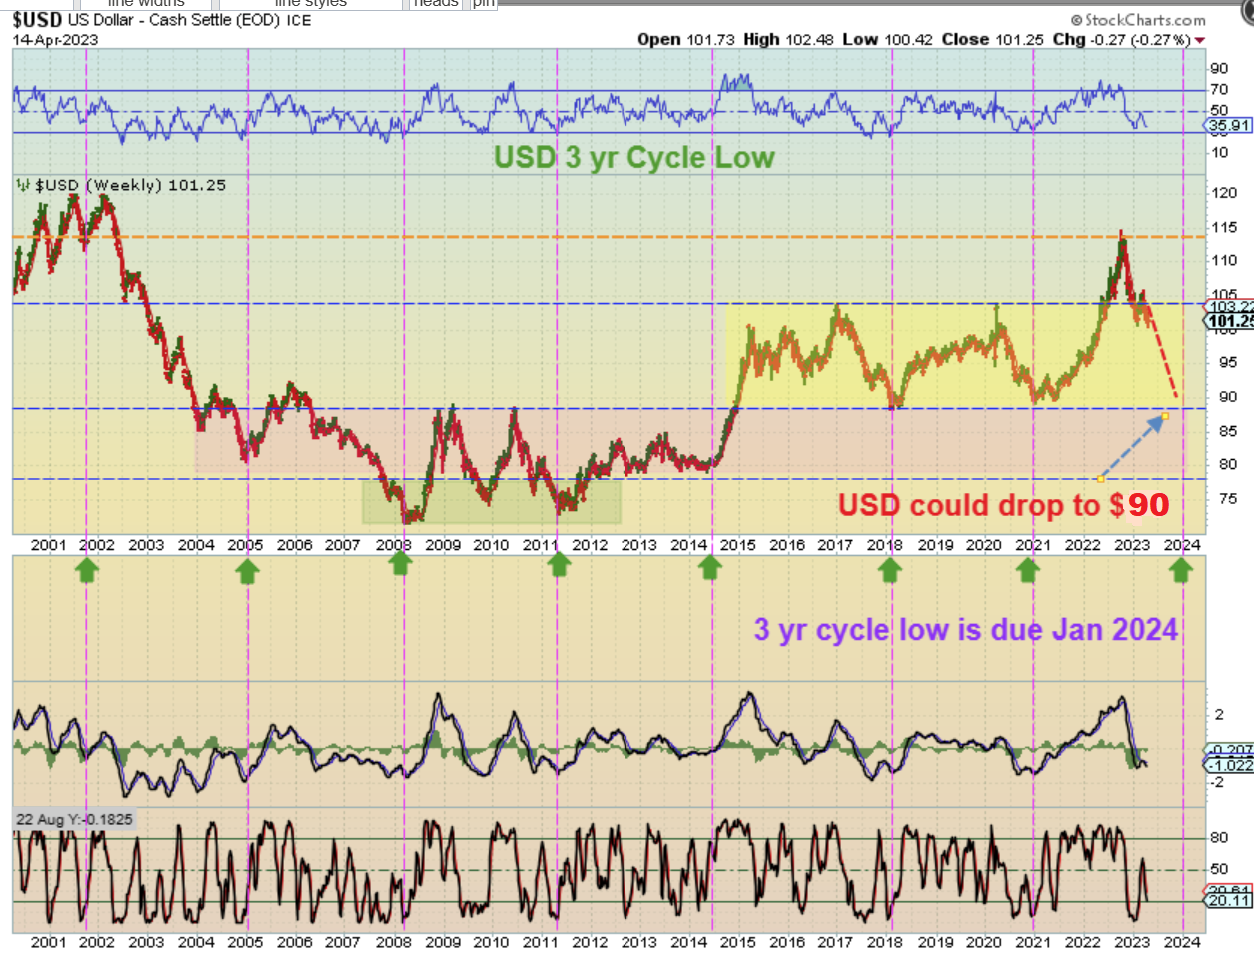
THE USD bounced in Feb-March and we actually expected that too. I expect this to be a midpoint bounce and I have mentioned that we could see the USD drop to $90. I have been thinking that Gold will have a major break out and bull run at this time.
.
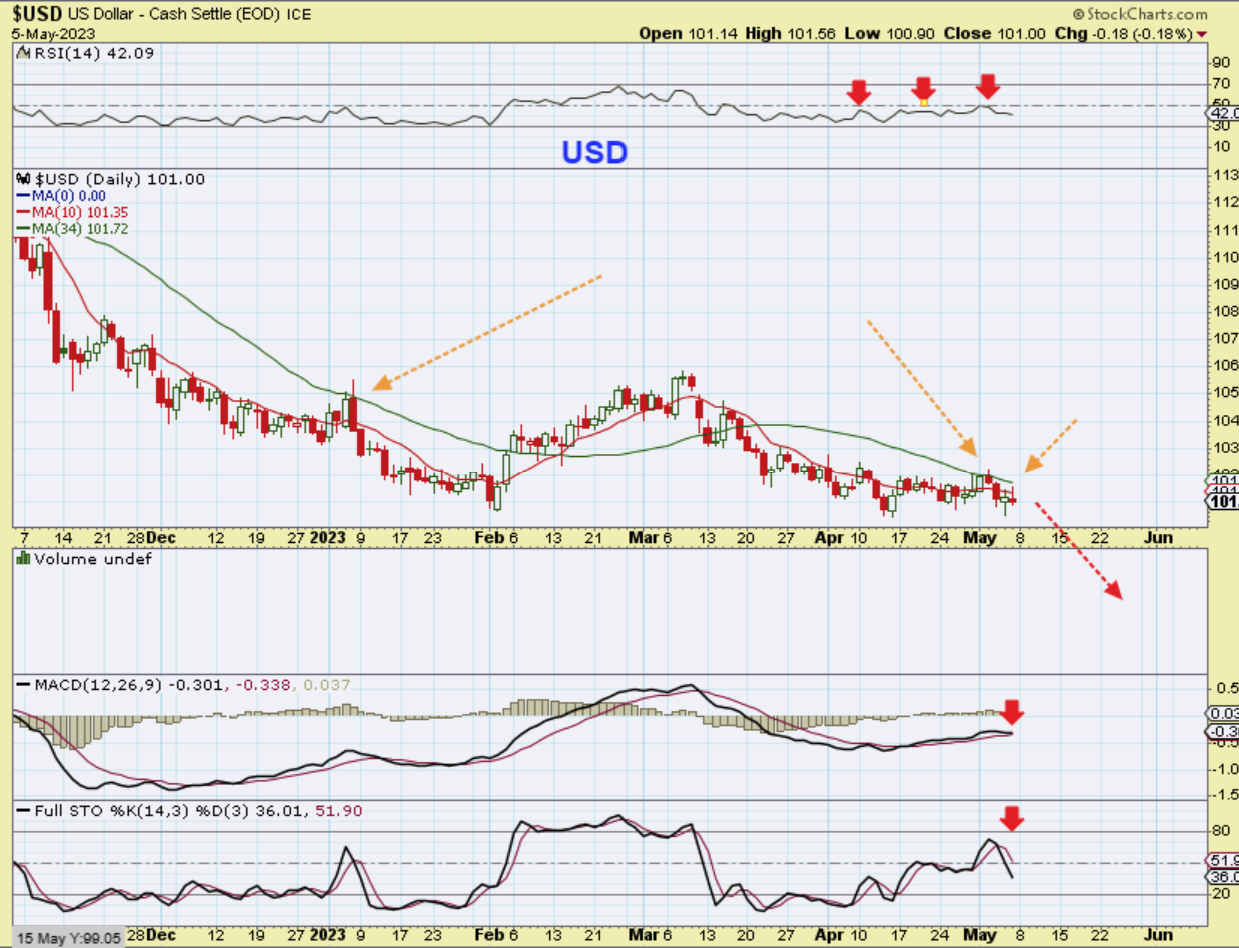
So on The USD daily chart we have seen small bounces and I have been pointing out that the USD should hit resistance at the 34 sma. So far that is what we are seeing, and the RSI cannot get above 50. I expect this bounce to chop and drop and for Gold to rally as it does.
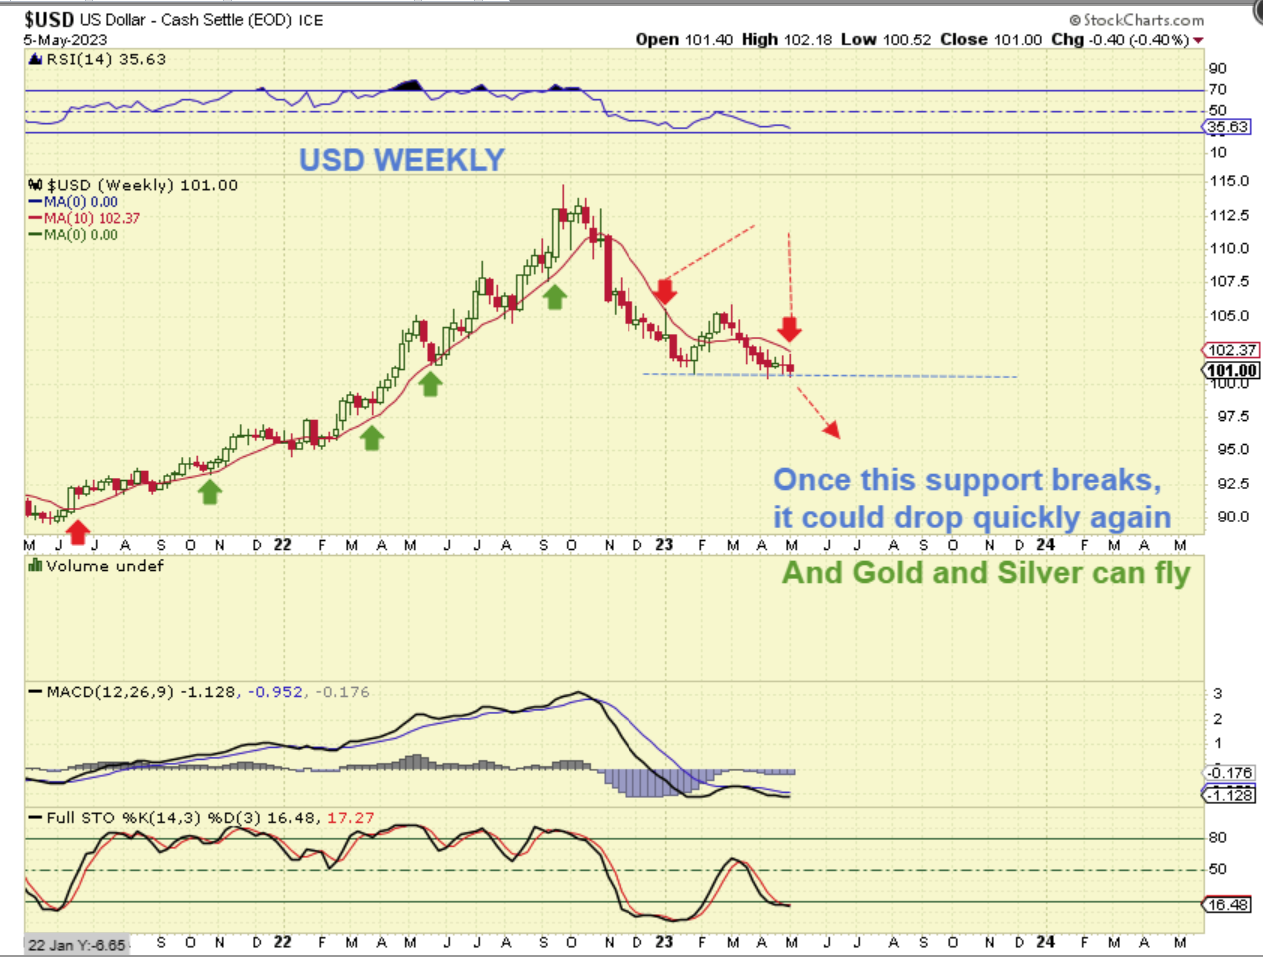
USD WEEKLY – Please read the chart
.
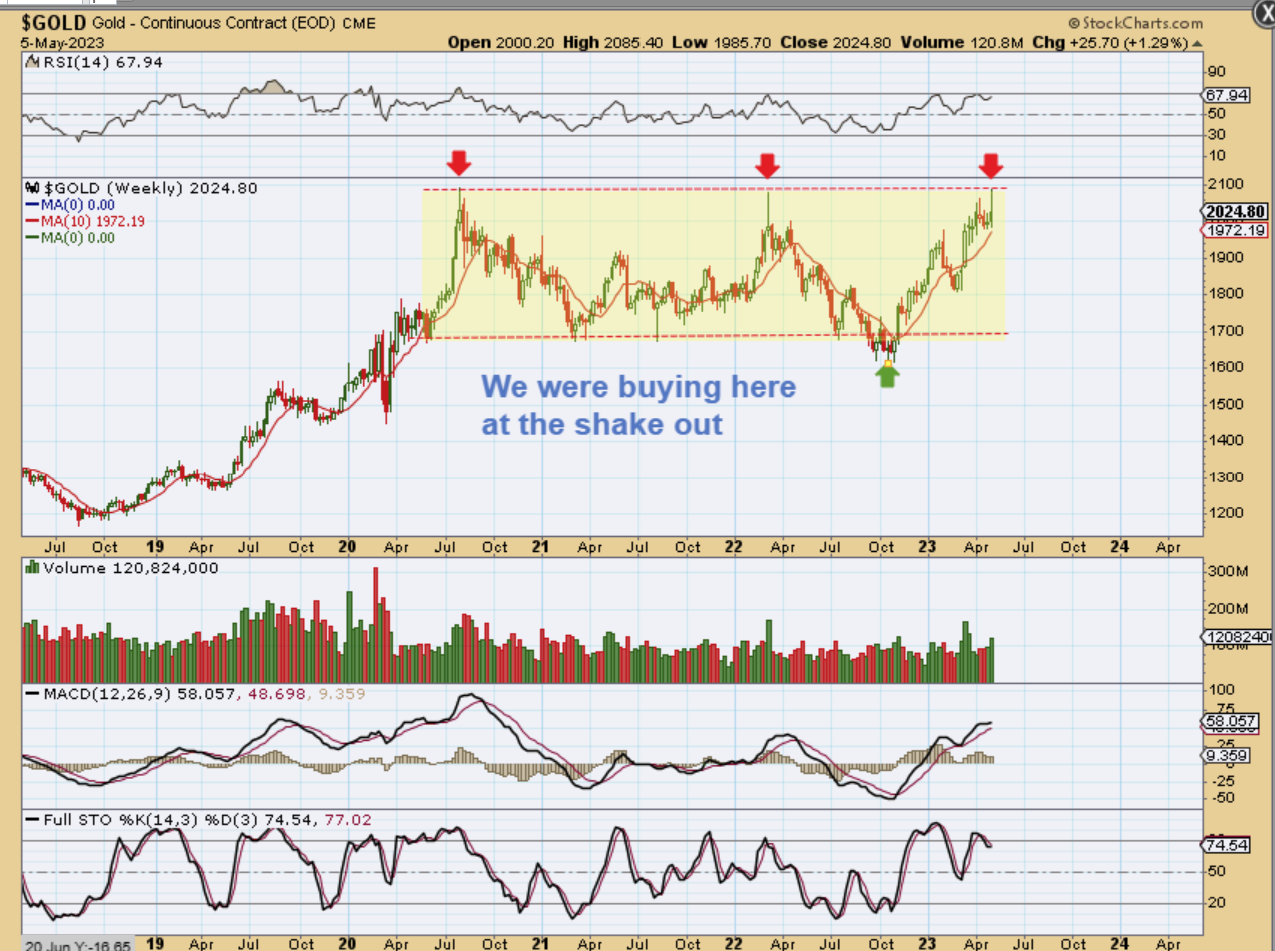
GOLD was able to rally up and reach the all time highs on Fed Wednesday this week. It then pulled back a bit. This is usually where selling, profit taking comes in and I know that this does look like a triple top, but again, with the USD due to fall into that 3 yr cycle low, this should be able to break out this time and rally nicely.
.
Going way back to the Shake Out ICL in September and October of last year, Gold surged quickly and it was mentioned that we ought to buy at least a core position and try to ride it out as’ core’ until we reach the prior highs. Then we would decide what to do, cash in (?) or ride it further(?) . Well, as a trader I sold as we dropped into the March ICL and got back in after the reversal when Miners were near the 50sma. Now with Gold at the all-time highs, would I cash in or ride it? I would let it ride, because we rocketed out of the march lows and had a small dip into a dcl. This does not resemble a top in Miners at all at this point. We’ll discuss that with Miners, but I think we’re going to break out and rally in Gold soon too.
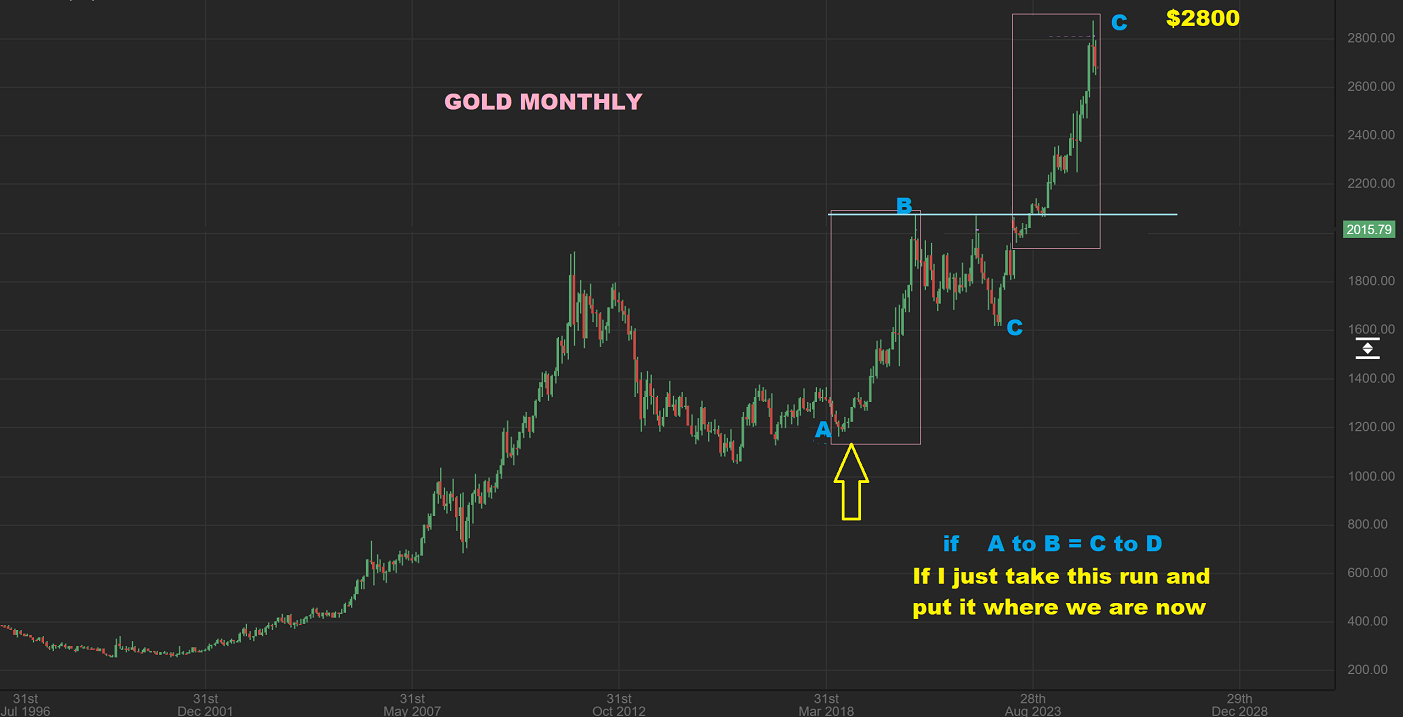
GOLD MONTHLY- As I mentioned, I think we’re going to break out and rally and
if I look for a measured move using A-B = C-D, we can get to almost $3000. I have ‘copied’ the A-B run and placed it where we are now to show you how that would look. I would think that Miners should really move once we break to all time highs, and it may be hard to get back in if they go up day after day after day.
.
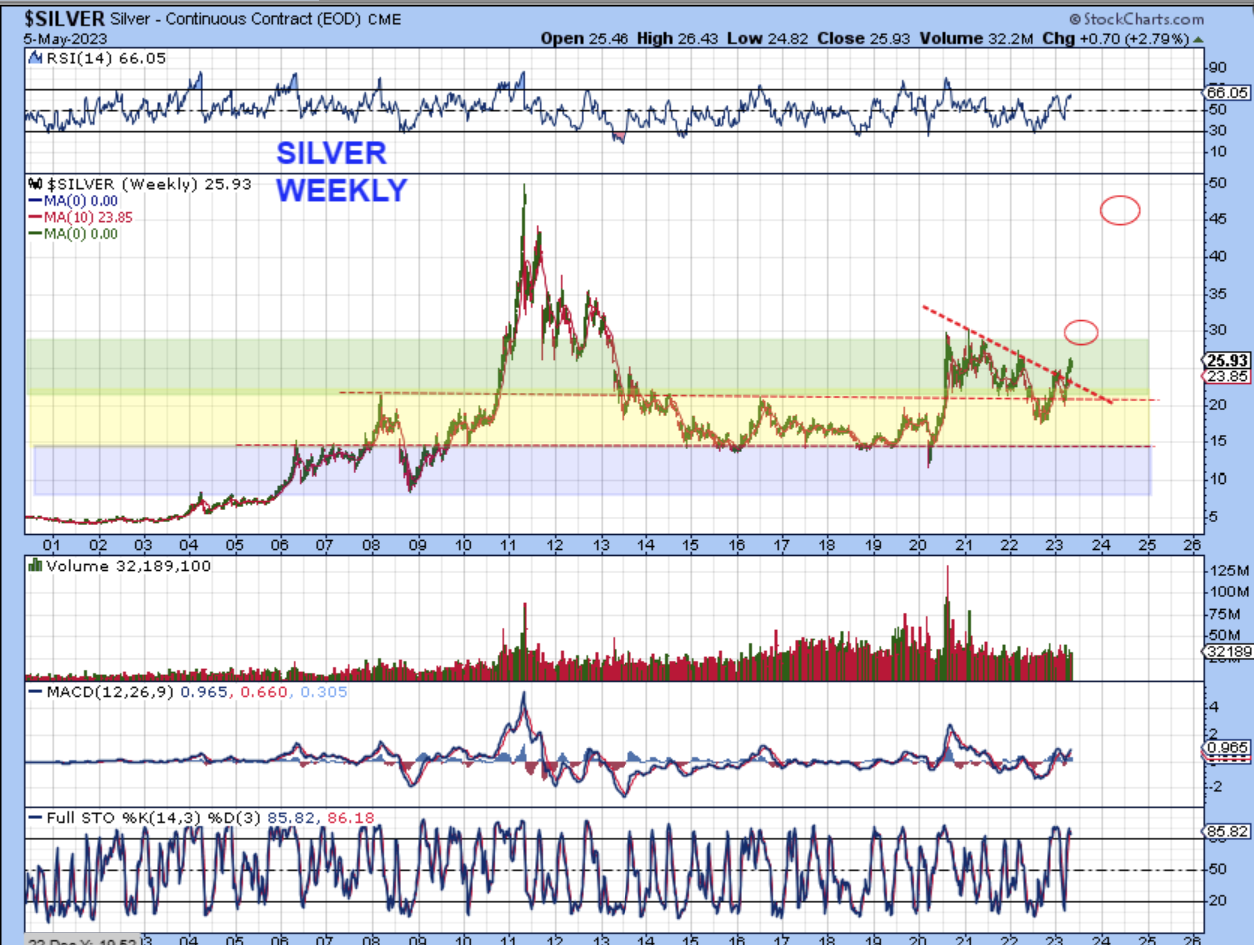
SILVER WEEKLY – Silver is lagging Gold, since it is not at all-time highs, but when Silver wanted to run it can really turn on the power! Look at that run in 2020 on the left side of the chart. I think that when the USD breaks down, Silver will also rocket higher and Silver stocks can also really move quickly.
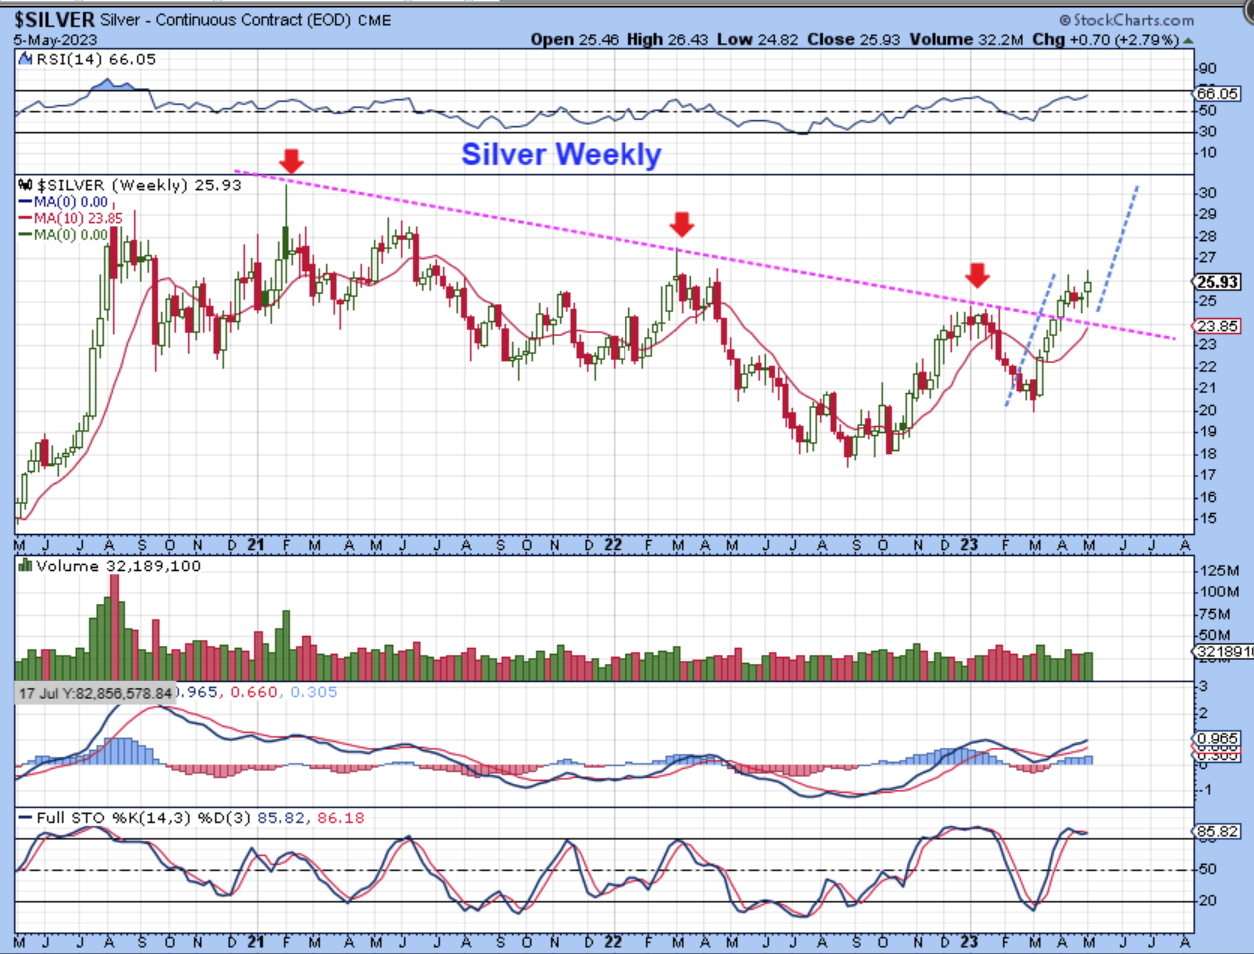
SILVER to 2020 highs is one thing, but if Silver gets to the 2011 highs? For Silver alone that is a 100% move, and silver stocks often double and triple that move, so let’s keep that in mind once Silver starts to accelerate. Profit taking may be a mistake at that time, because the pullbacks to get back in may be very minimal.
.
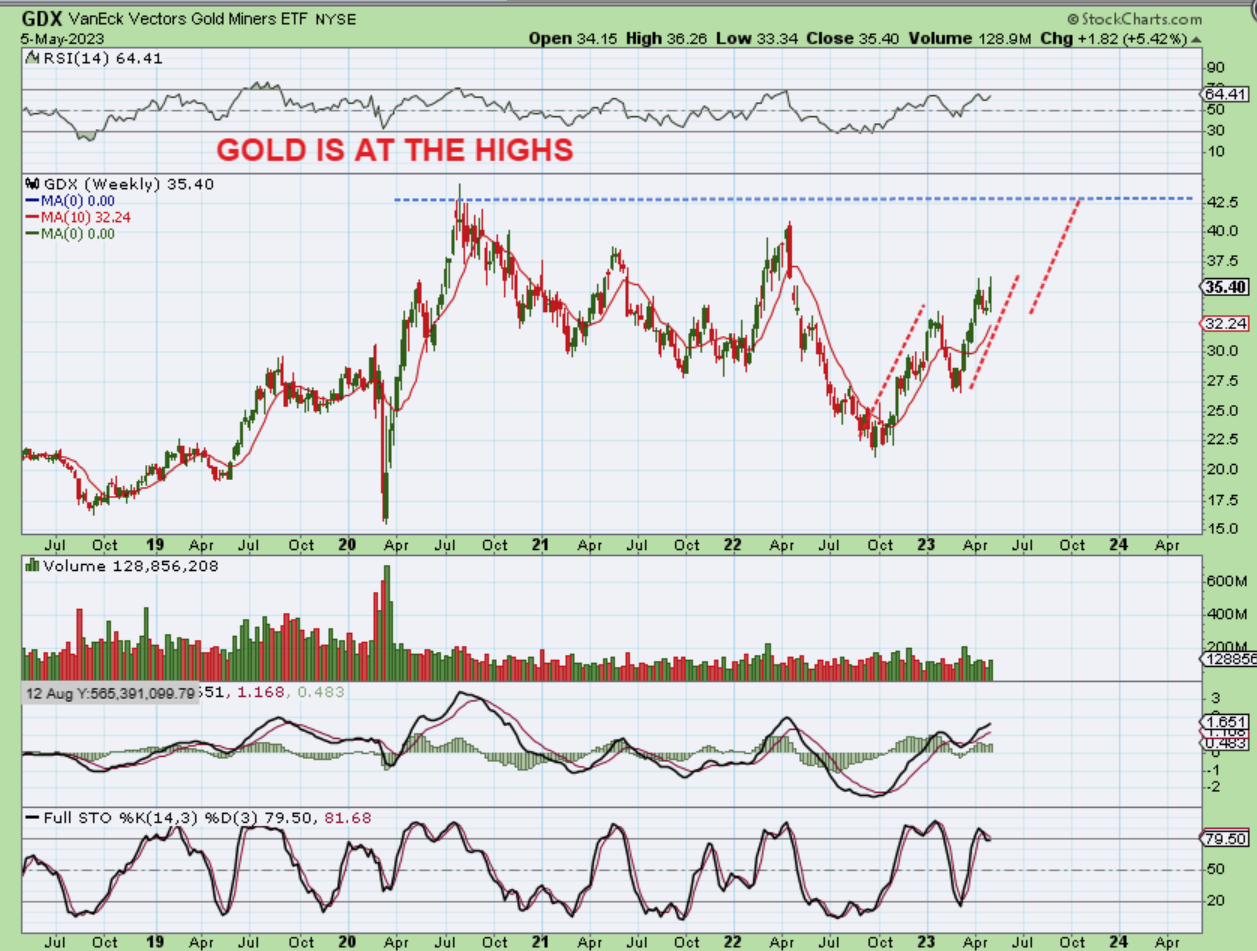
GDX WEEKLY– Gold is at All time highs, so there is no doubt that miners have lagged Gold, but this was still a great run for many Miners, and there is further to go.
.
We have discussed the bullishness of the Precious Metals sector in past reports and now that we have another FOMC meeting behind us, you can see that the bullishness remains. The general markets and bitcoin also remain bullishly set up, so I will discuss bitcoin in greater detail below.
.
Thanks for being here at Chartfreak with me and have a great weekend.
.
~ALEX
.
BITCOIN DAILY– The trendline break was our Buy and for Crypto stocks mentioned, like MARA, RIOT, HUT, HIVE, CLSK, CIFR, BTBT, etc., and many crypto stocks were up 300% or more from the lows. In this report I want to show you why that was an Important low and what I expect over time. I will say right from the start that this is one of the hardest trades to buy & hold due to the degree of volatility on a day to day basis (Bitcoin or Crypto Stocks), but you’ll see why I think this sector has much further to go.
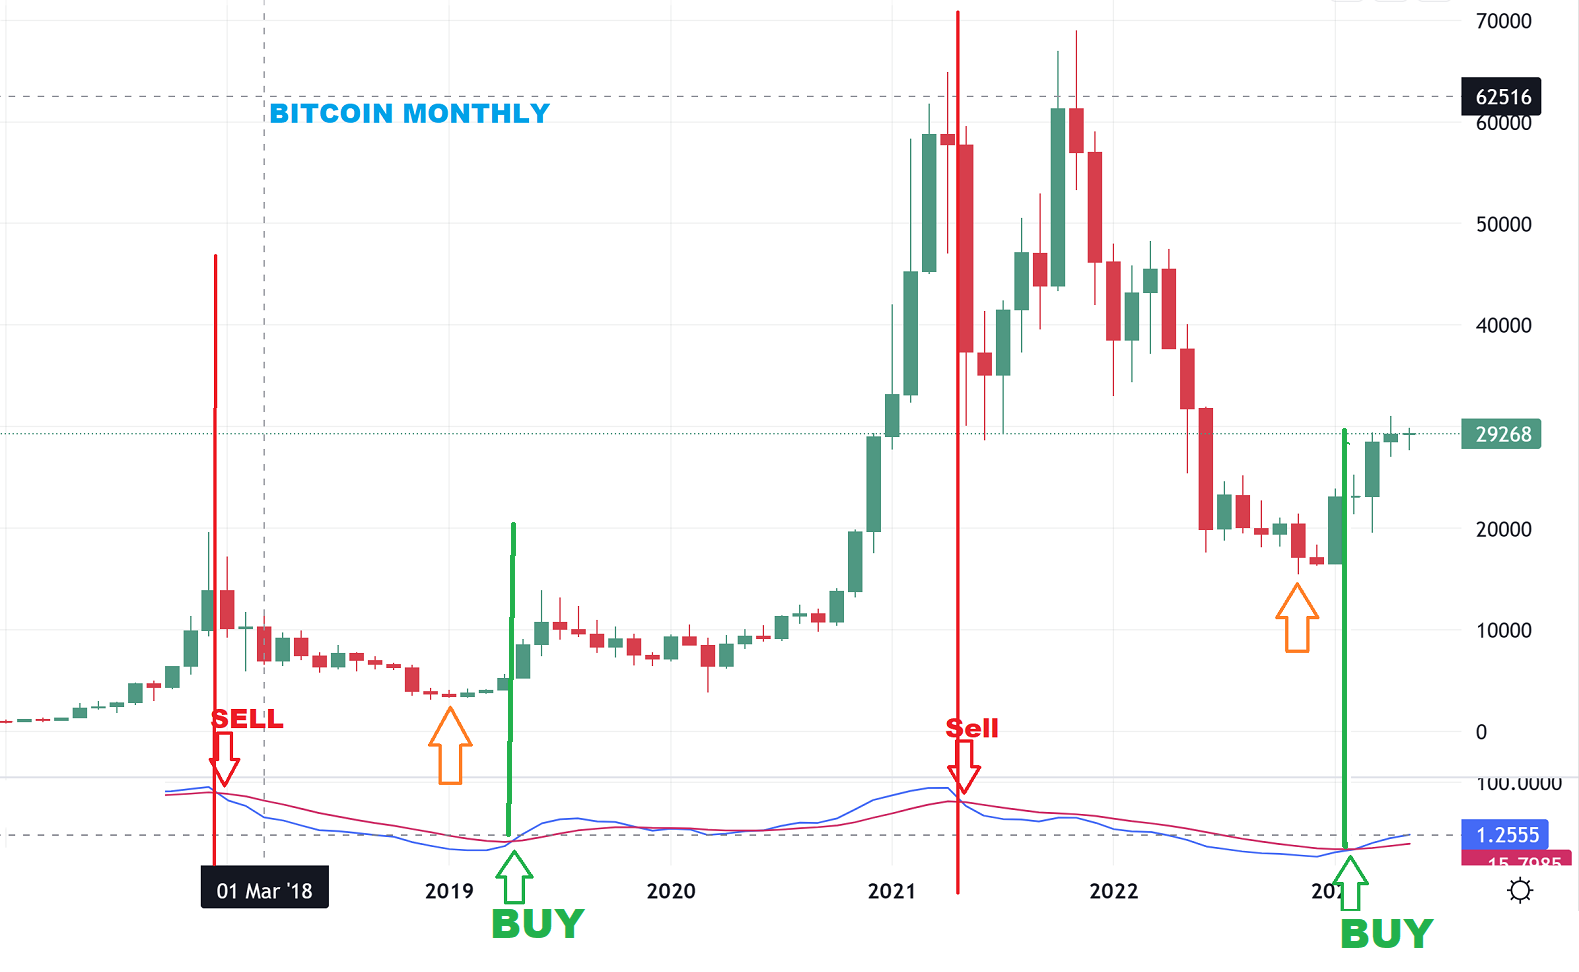
BITCOIN MONTHLY– To start with, using an indicator that I developed for Gold, I got a Monthly Cross over buy signal in Jan 2023 shortly afer the lows were in place. These are major Buy & Sell signals that are Very Rare and often can lasts for many months. May is only the 5th month out of the lows. Now let me show you something on the weekly charts.
.
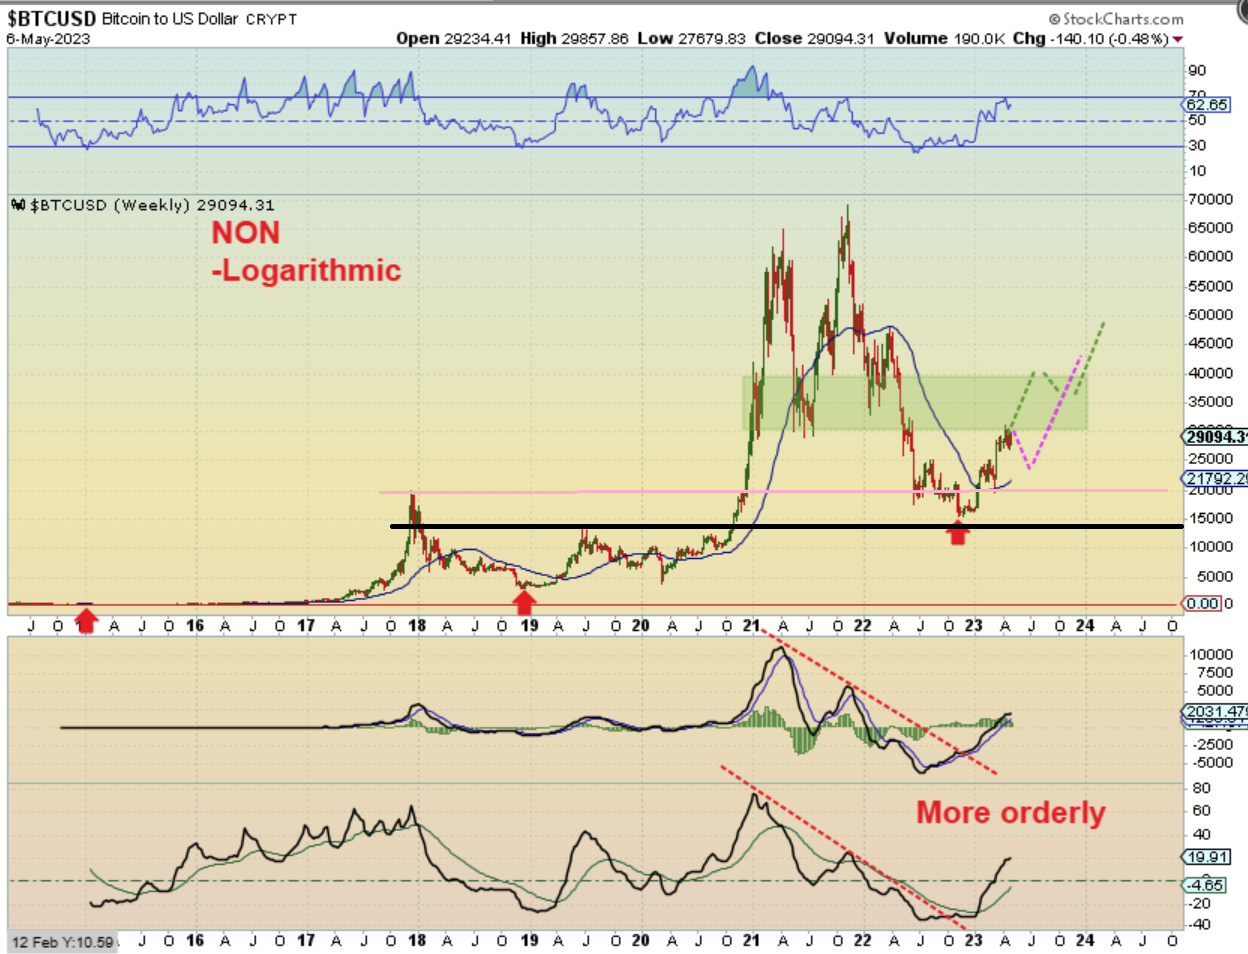
There is usually a big difference between a logarithmic and a linear charts over a long period of time. I want to show you Bitcoin using both (They are extremely different looking charts, but both are accurate and bullish).
.
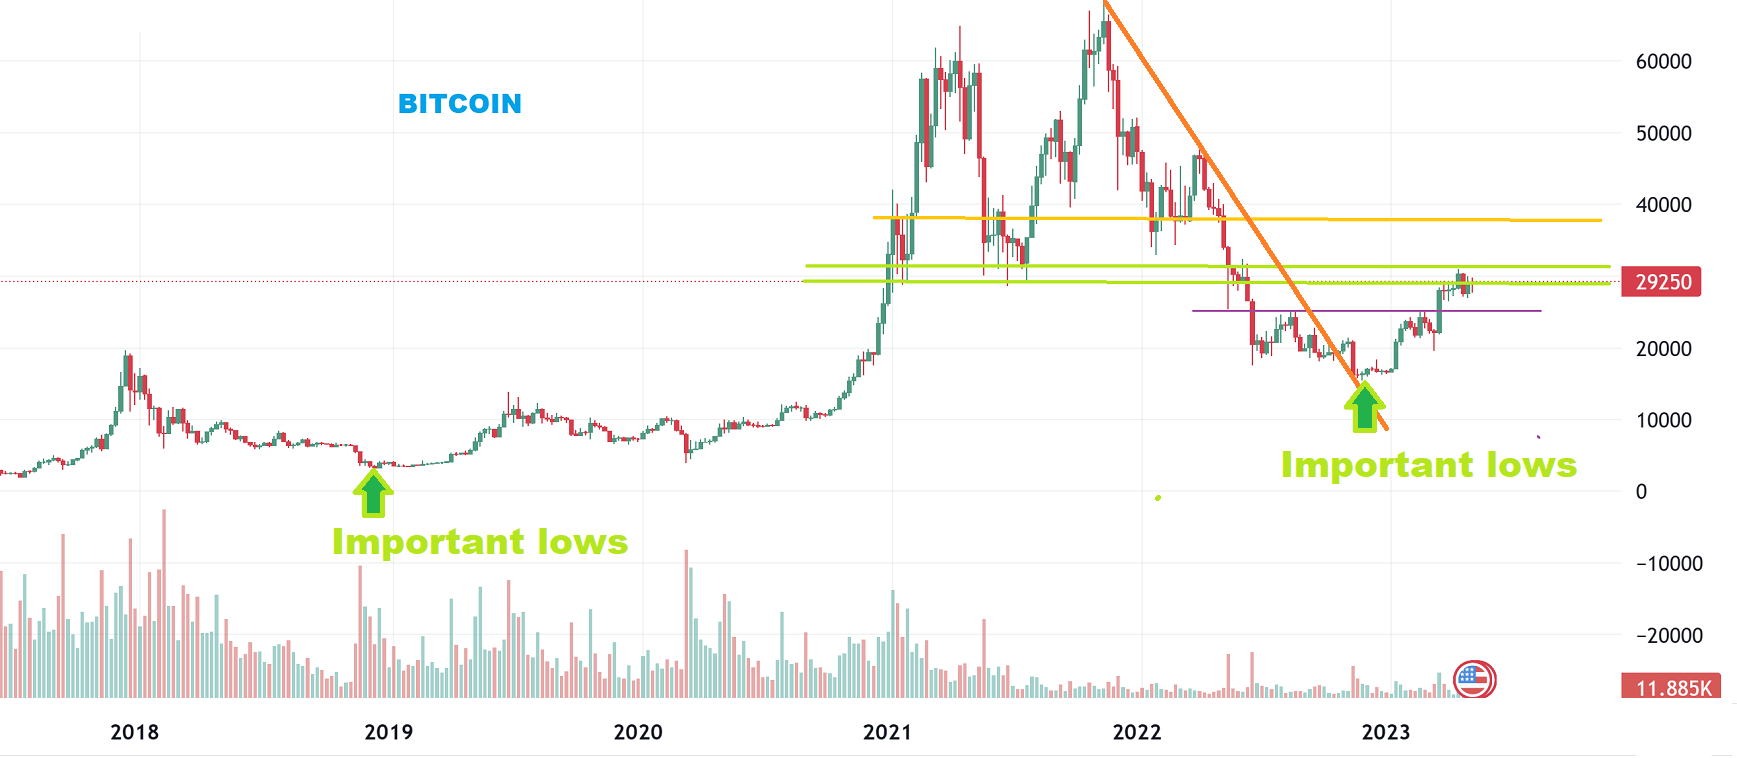
BITCOIN WEEKLY– You can see that every 4 yrs a major low develops in Bitcoin (red arrows). Take a look at the MACD and my bottom indicator and you can see that they gave a buy signal too, but now let me switch over to a logarithmic chart.
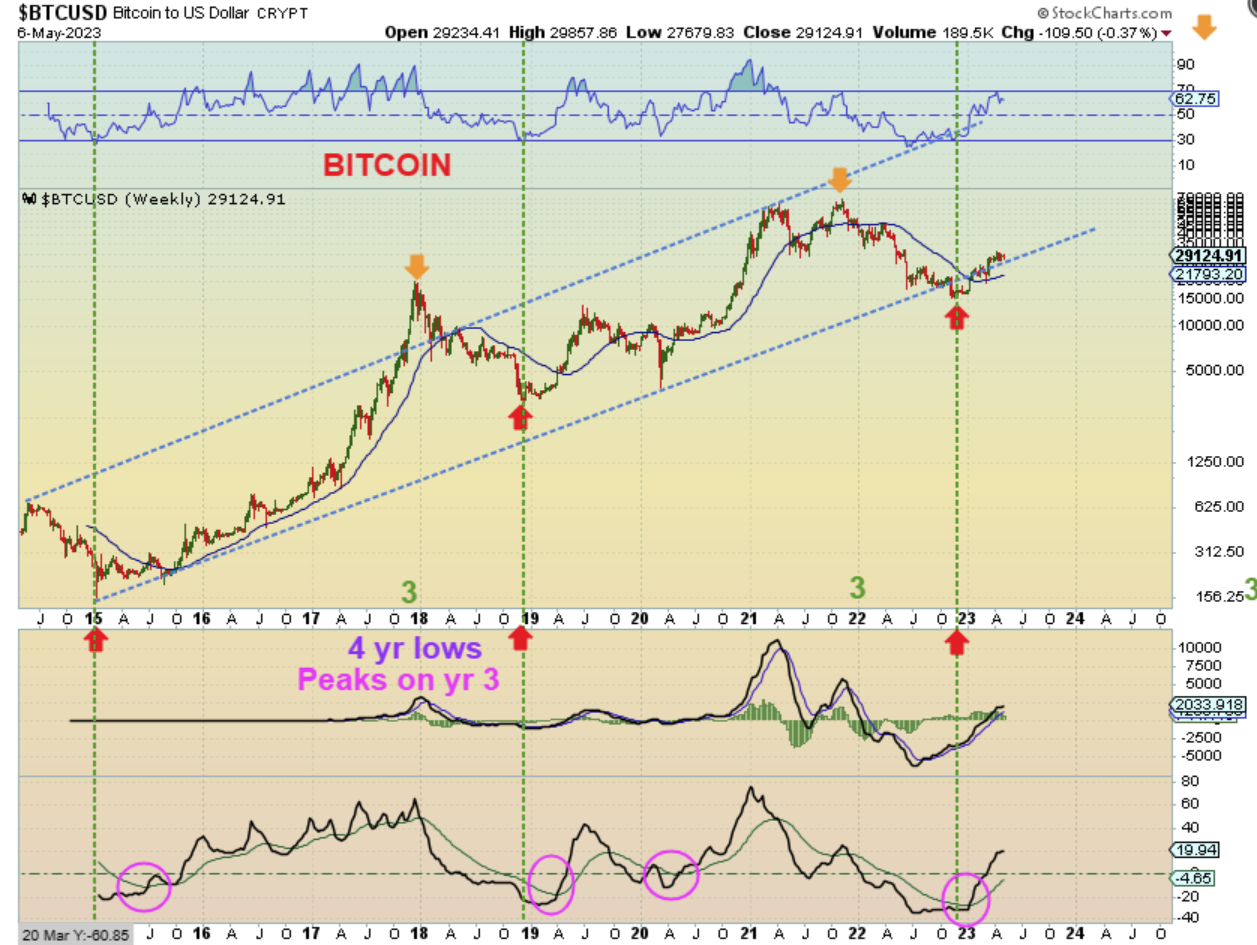
BITCOIN WEEKLY– The details of 2015-2018 show up clearly on a log scale. The 4 yr lows show up clearly on this chart, and you can see that so far, the ‘peak’ doesn’t really come until 3 yrs later too. When I draw a channel or even just a lower trend line, it helps us to see that we are at the 4 yr lows of a new beginning run for Bitcoin. Yes, it can be very choppy over time, but we shouldn’t ‘peak’ for a couple of years and when the USD starts to drop again, I think that bitcoin will put in another move higher in 2023.
If what I have pointed out above with Bitcoin is true, what will happen to the Crypto stocks?
.
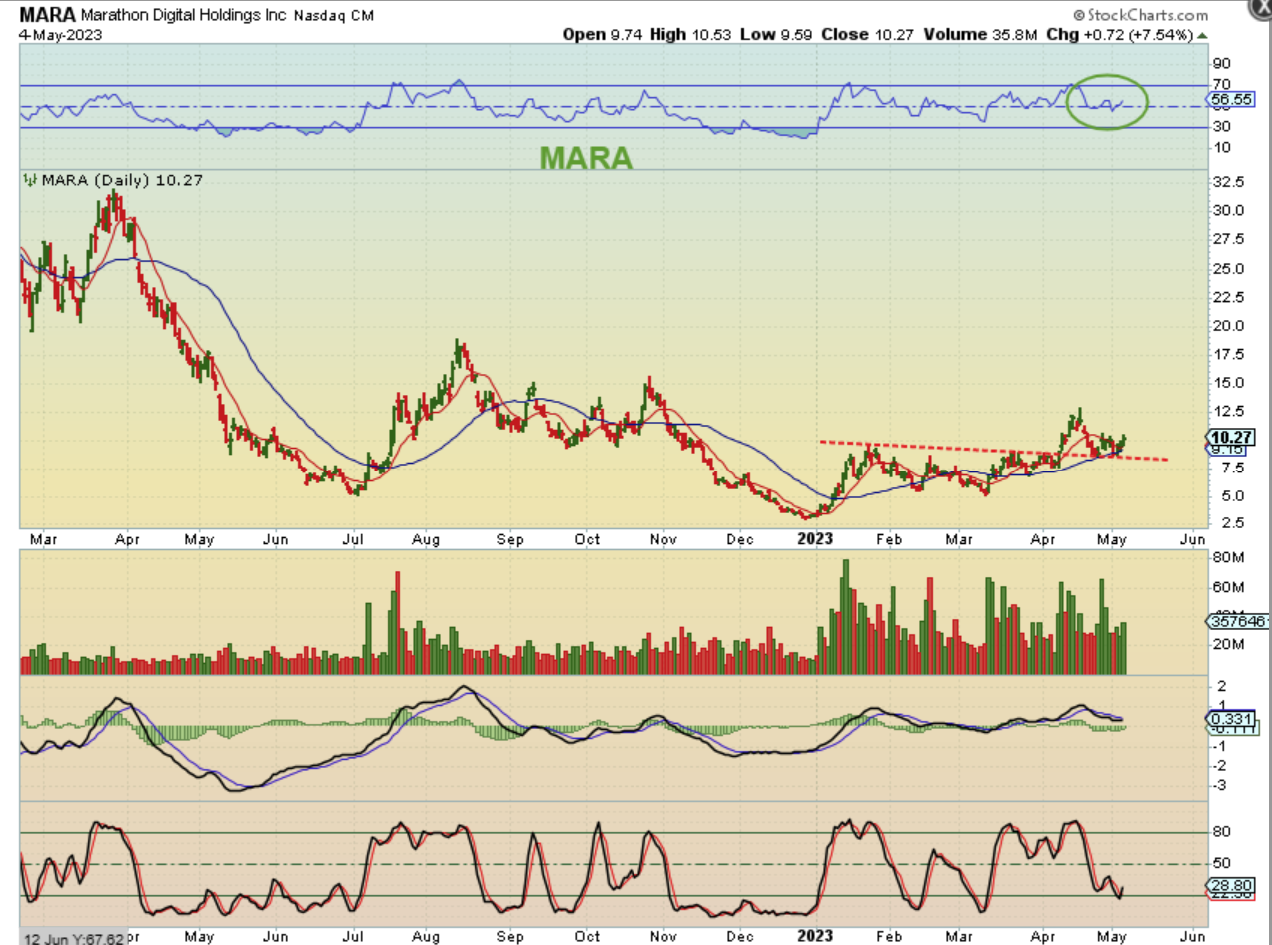
At this point MARA has moved up out of the lows and we now seem to have a back test. It was choppy and difficult / volatile, but it has also run from $3 to over $12. The upside potential in these stocks is really good.
.
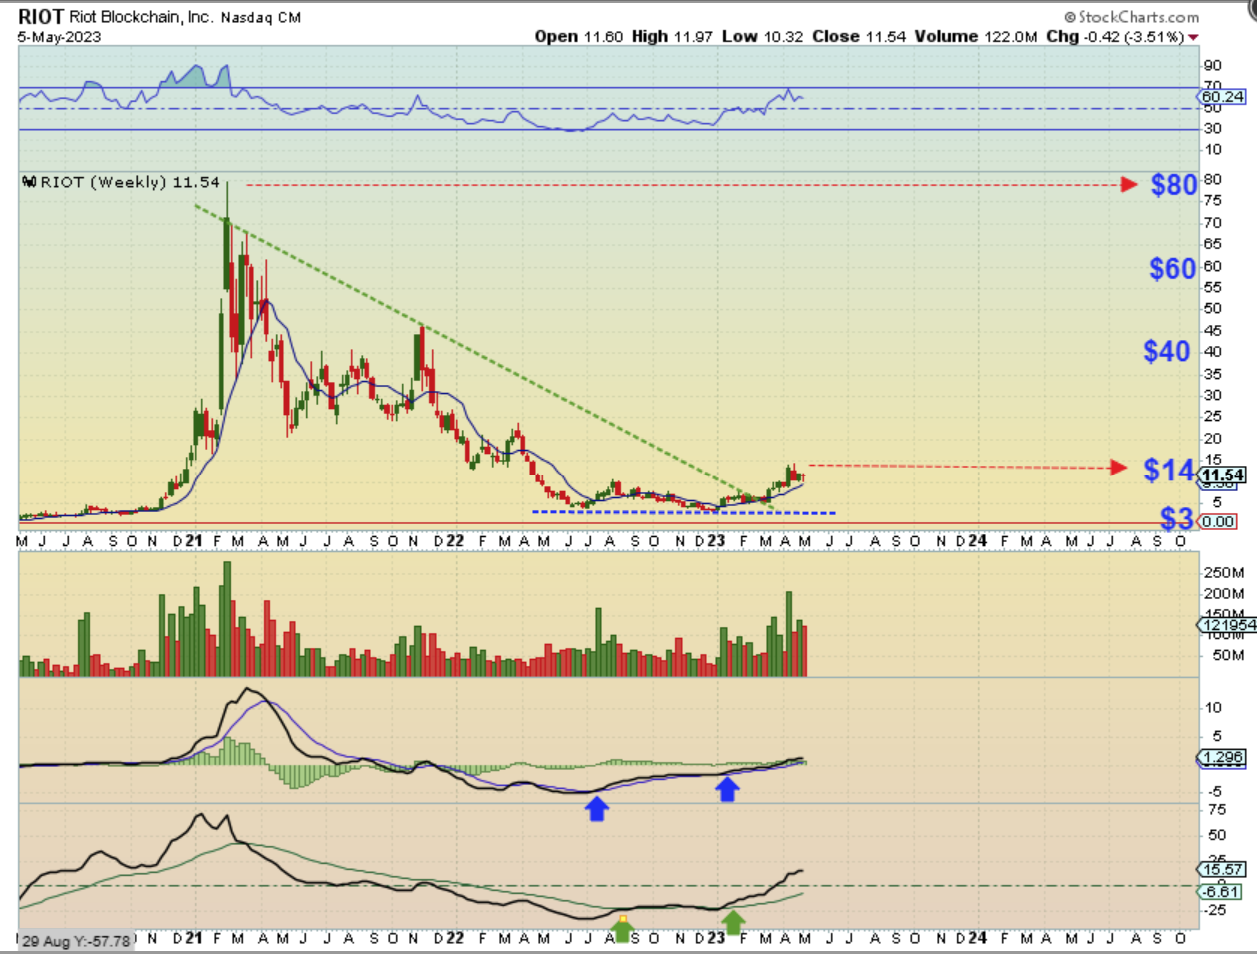
Other Crypto Miners like RIOT also have already made good gains, but still have great upside potential. They are volatile, but holding at least a small position in a few might be rewarding.