Friday May 5th
Today is Friday, the last day for trading this week. The US Employment report is released today at 8:30. I’m just going to do a review today, since all of the other reports this week were long and quite detailed. By now you all know the expectations that we’ve had going into that Fed Mtg ( DCL in Precious Metals being the main one, and the USD should begin weakening), and we see things playing out as expected. I’m going to use The weekend Report to give additional details on our current set ups, so let’s just get to the charts…
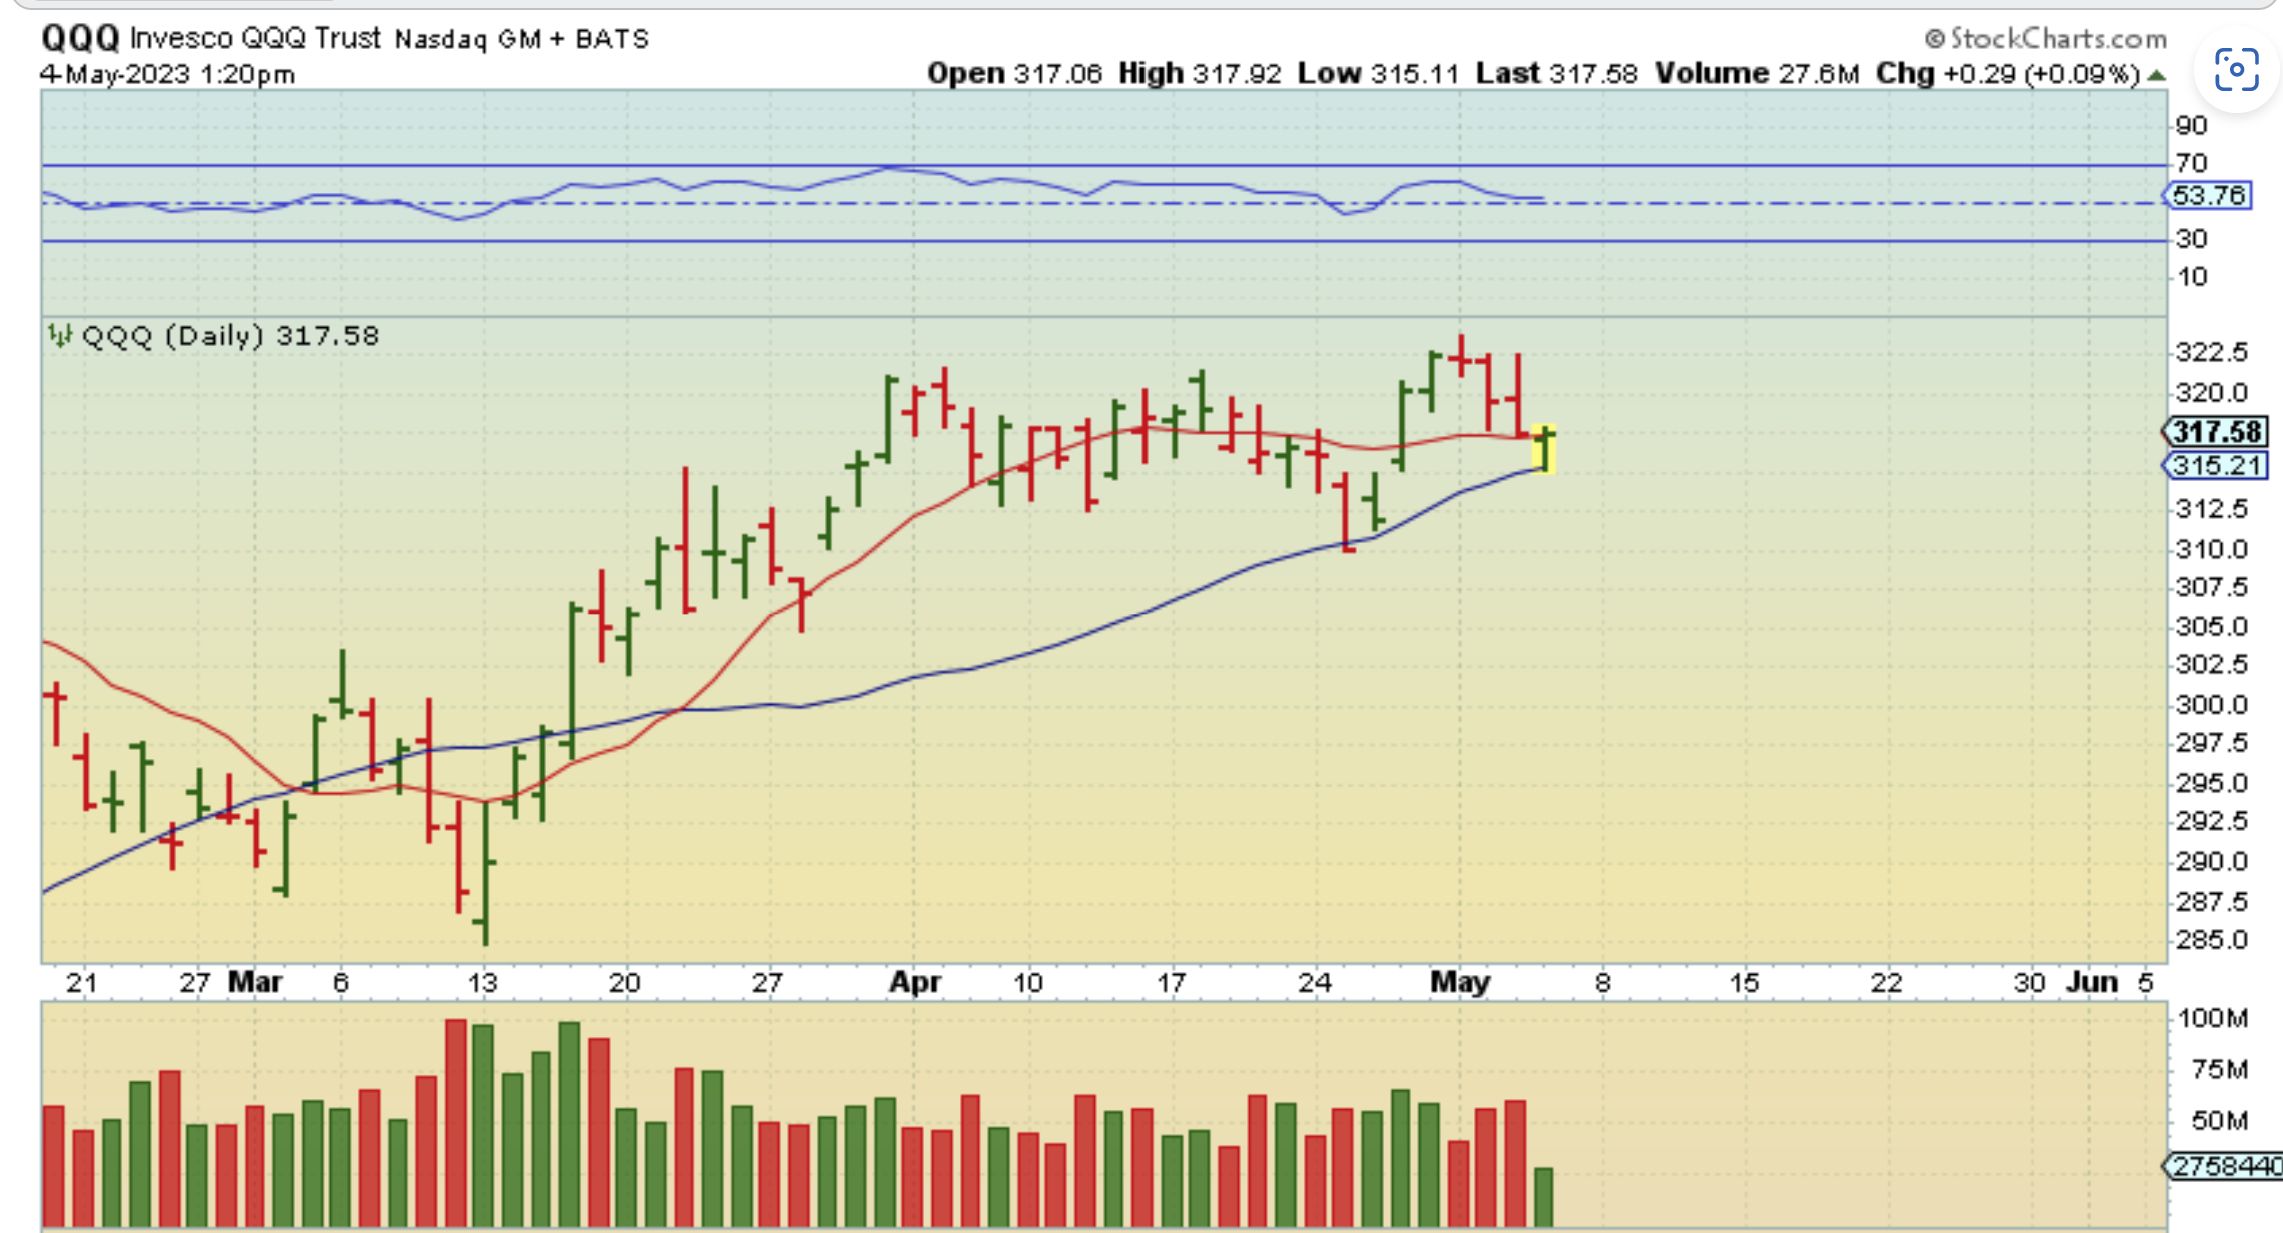
QQQ at 1:20 p.m.– I was pointing out that after the Markets dropped all morning, I was seeing reversals at support for both the QQQ and SPY.
.
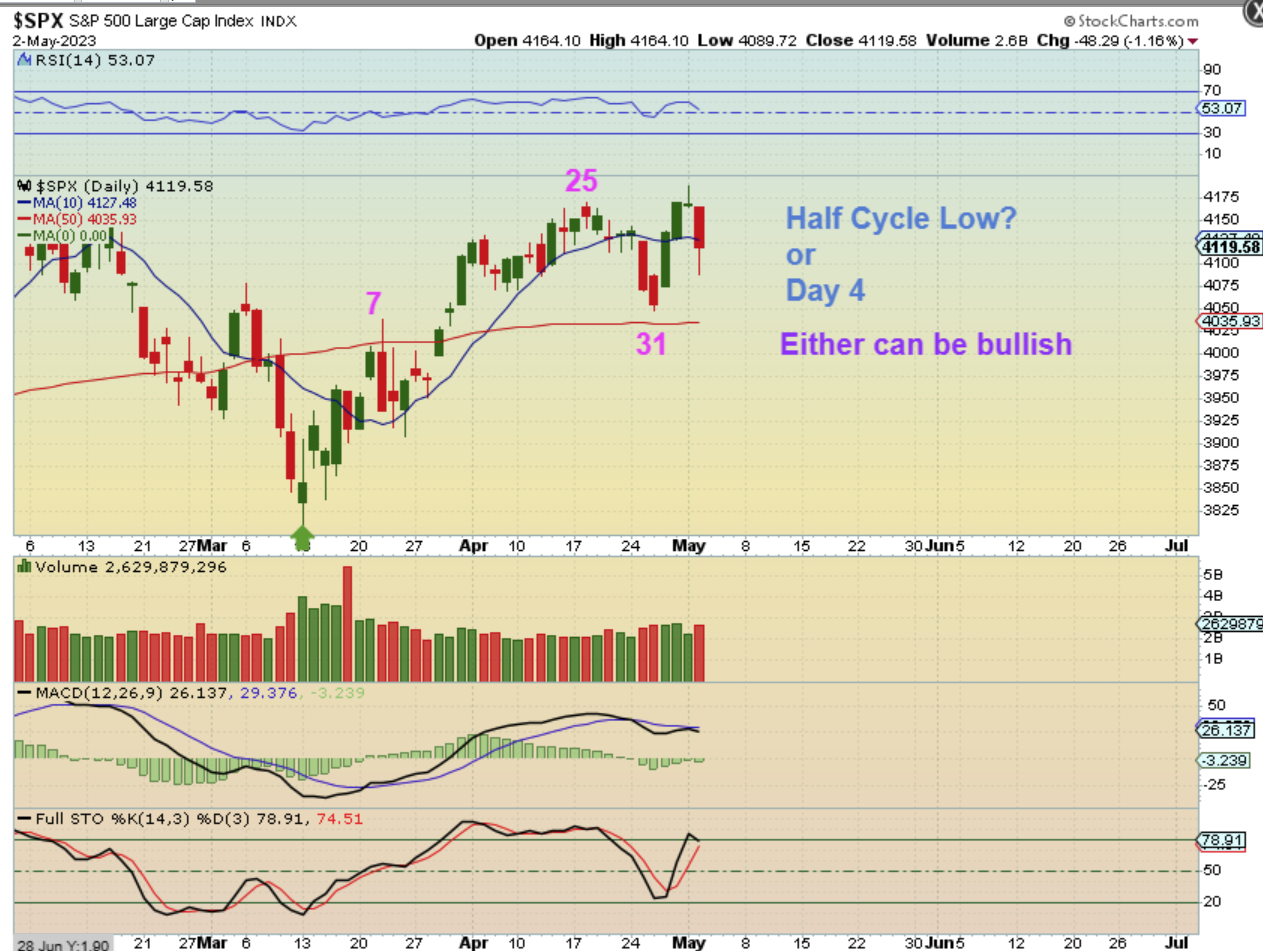
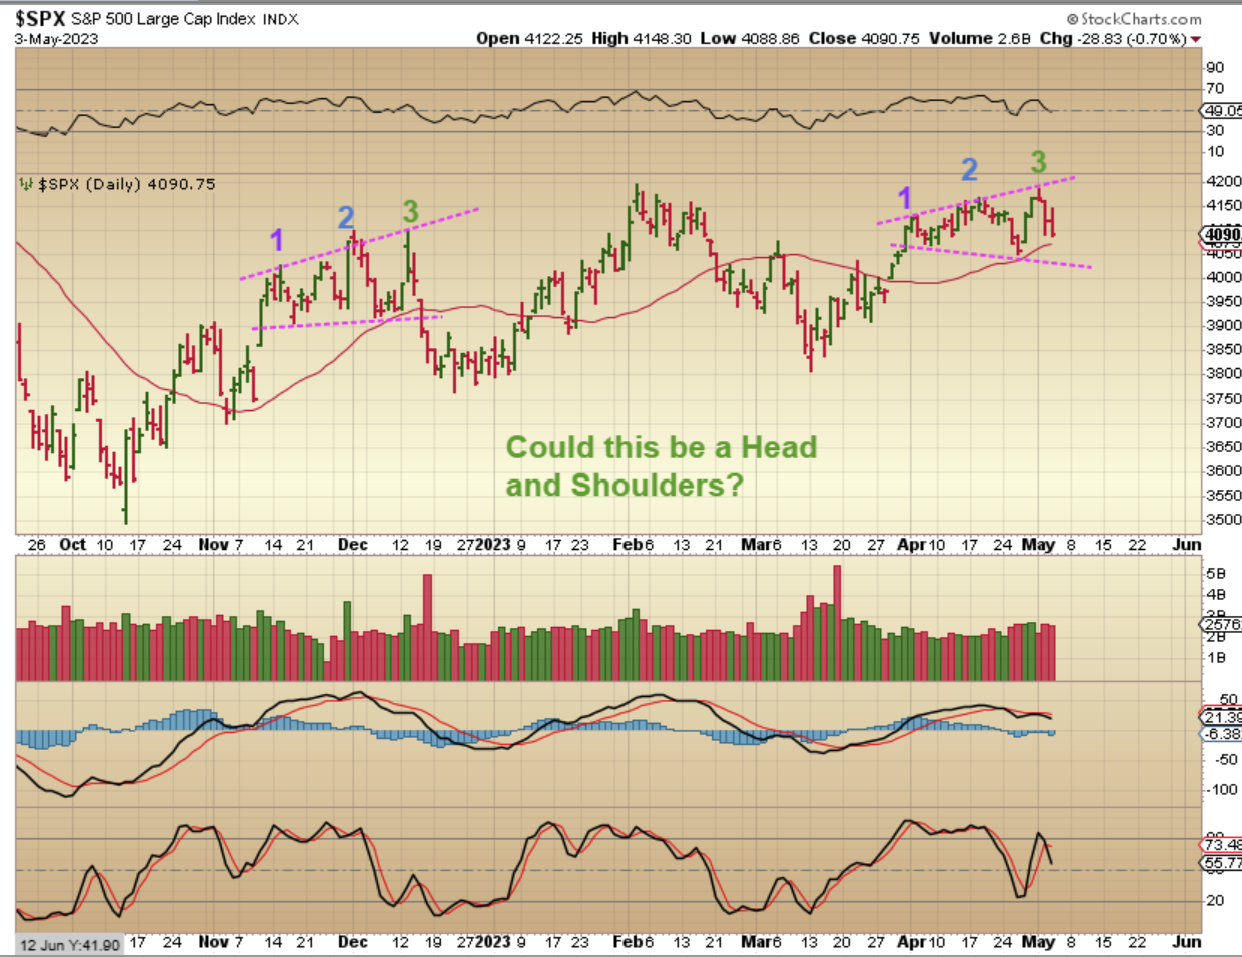
MAY 2 SPX– Recently I’ve discussed that day 31 was either a 1/2 cycle low or an early dcl, since the last 2 daily cycles were 50 days long (They average 40 usually) so that would be 2 long daily cycles and now a short one).
.
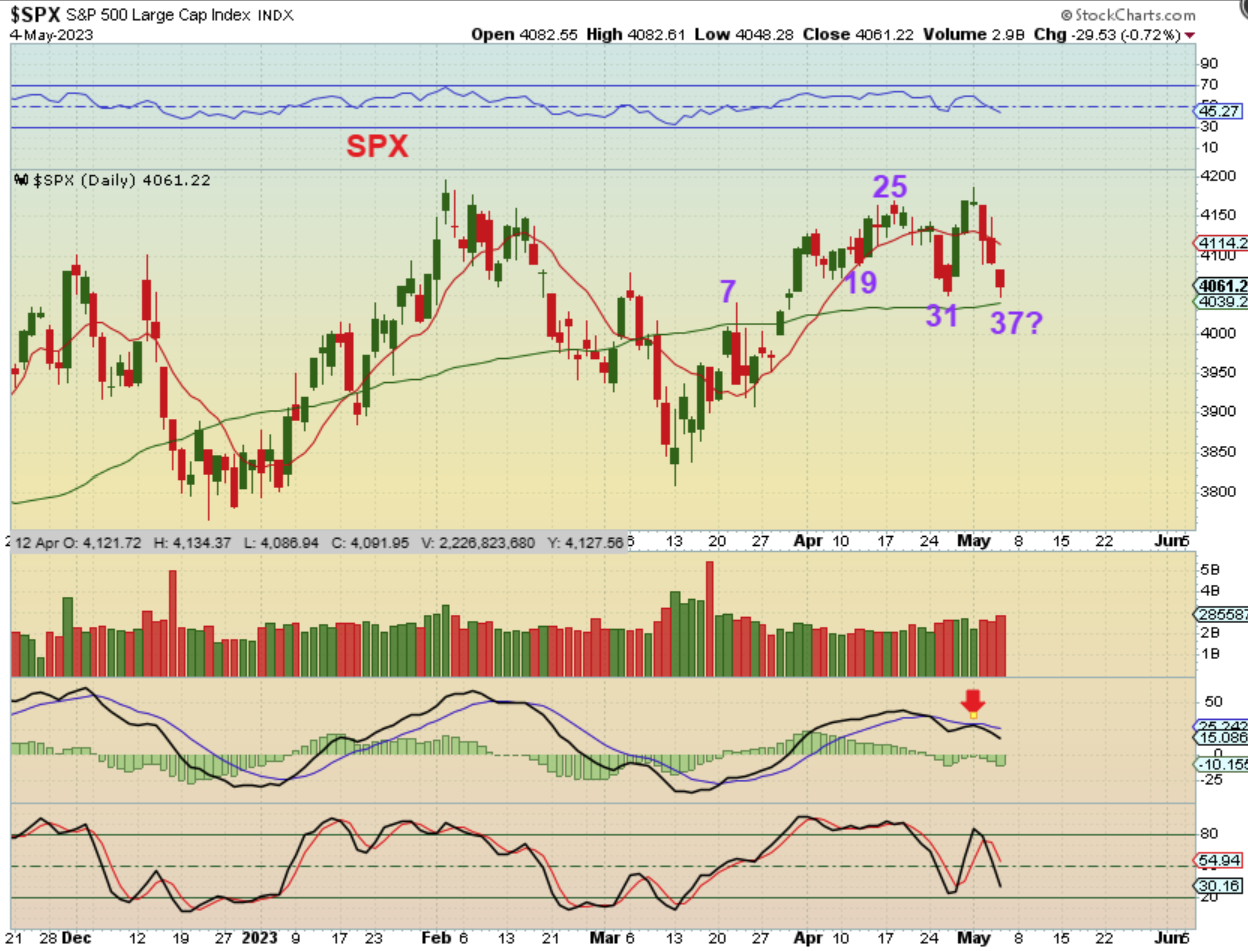
SPX– So it is still not clear whether that was a dcl or 1/2 cycle low, but at this point I think it was more of a normal choppy dip and not a dcl. If it was it peaked on day 3 and that is very early. I am thinking that we may be still dropping into a dcl now. Actually, day 37 is close to the normal timing for a dcl, so I will discuss in the weekend report the big picture since we could put in a dcl here or next week. NOTE: This is NOT Oversold and the MACD did a kiss, so I can’t view this as a long set up right now.
.
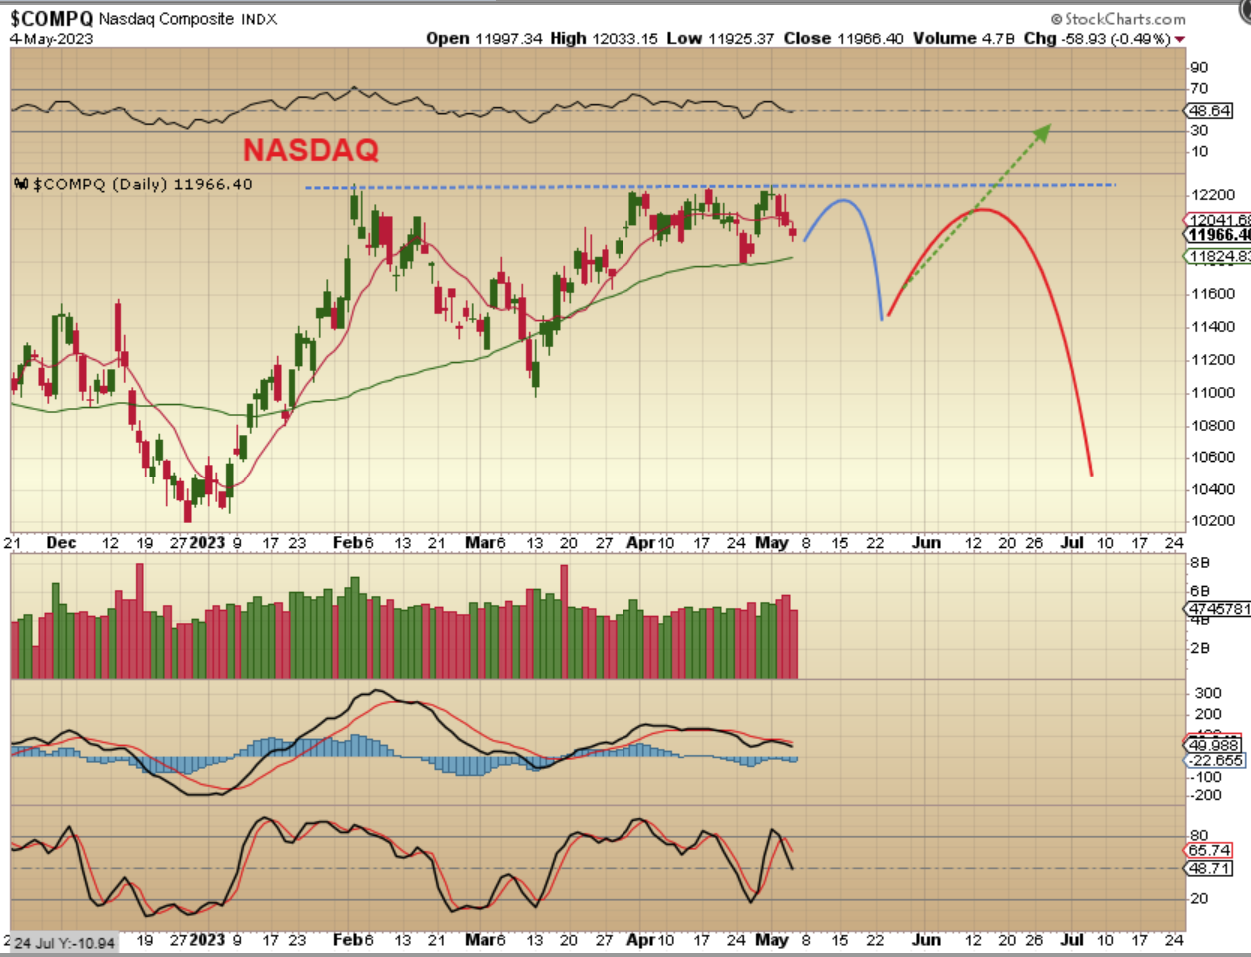
NASDAQ – The Blue line is a deeper drop into a dcl. The Red line is a bounce and a bearish drop, the Green line shows that what we have been getting ( a bigger push out of our bear market lows). I do expect a recession at the end of the year, but we’ve been climbing a large wall of worry lately, right? We have inflation, rate hikes, Bank failures and more, but it hasn’t been hurting the markets. I’ll discuss this in the weekend report.
.
On this chart I showed 1-2-3 & drop into a dcl, so we may see something similar to the drop in December.
REMINDER: The US Employment report is released today at 8:30, and this may cause the markets to drop into that dcl.
.
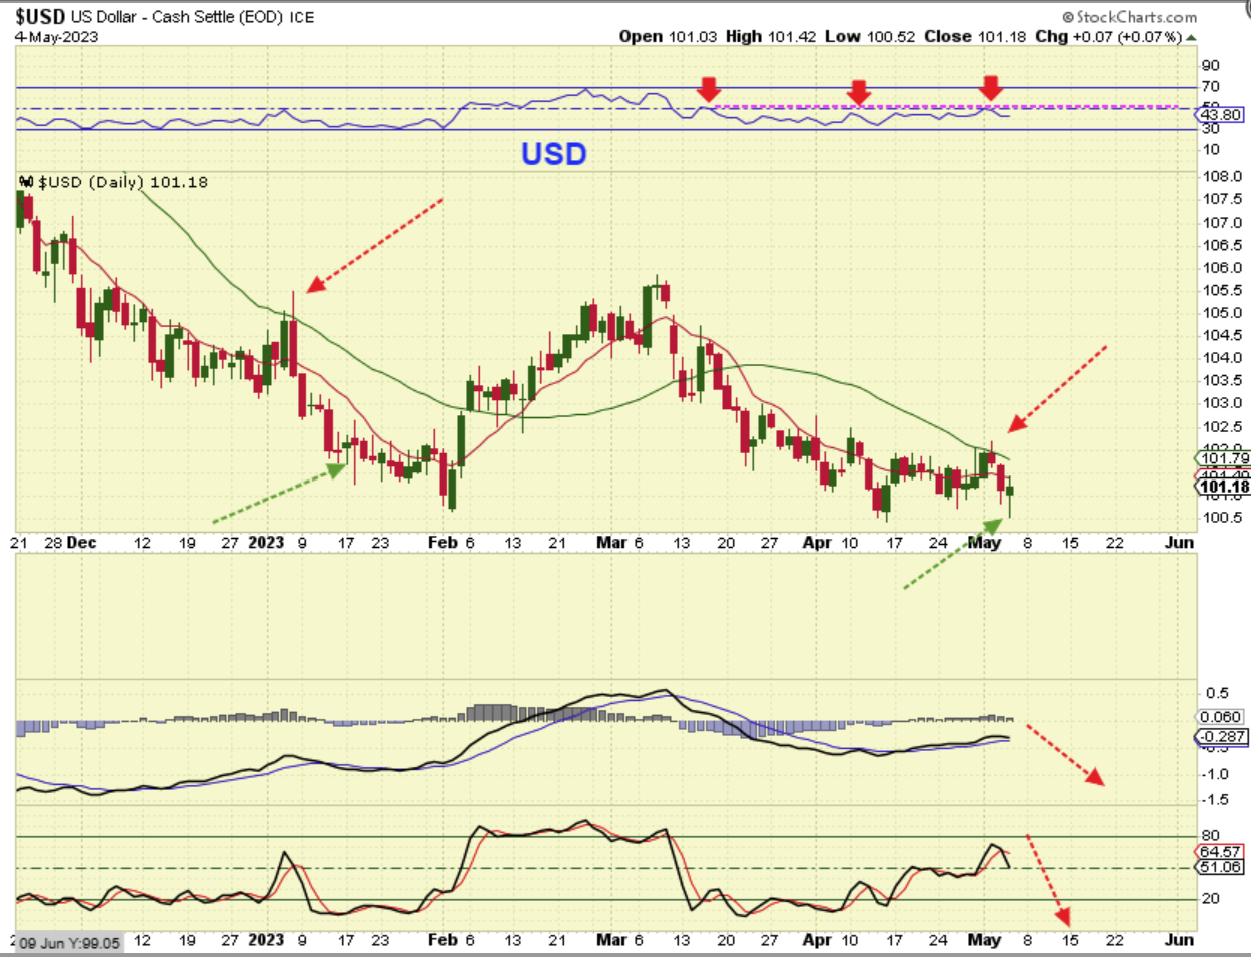
I’ve been pointing out that resistance area for the USD and expected a bounce into the Fed and then a drop. So far, this is how it is playing out.
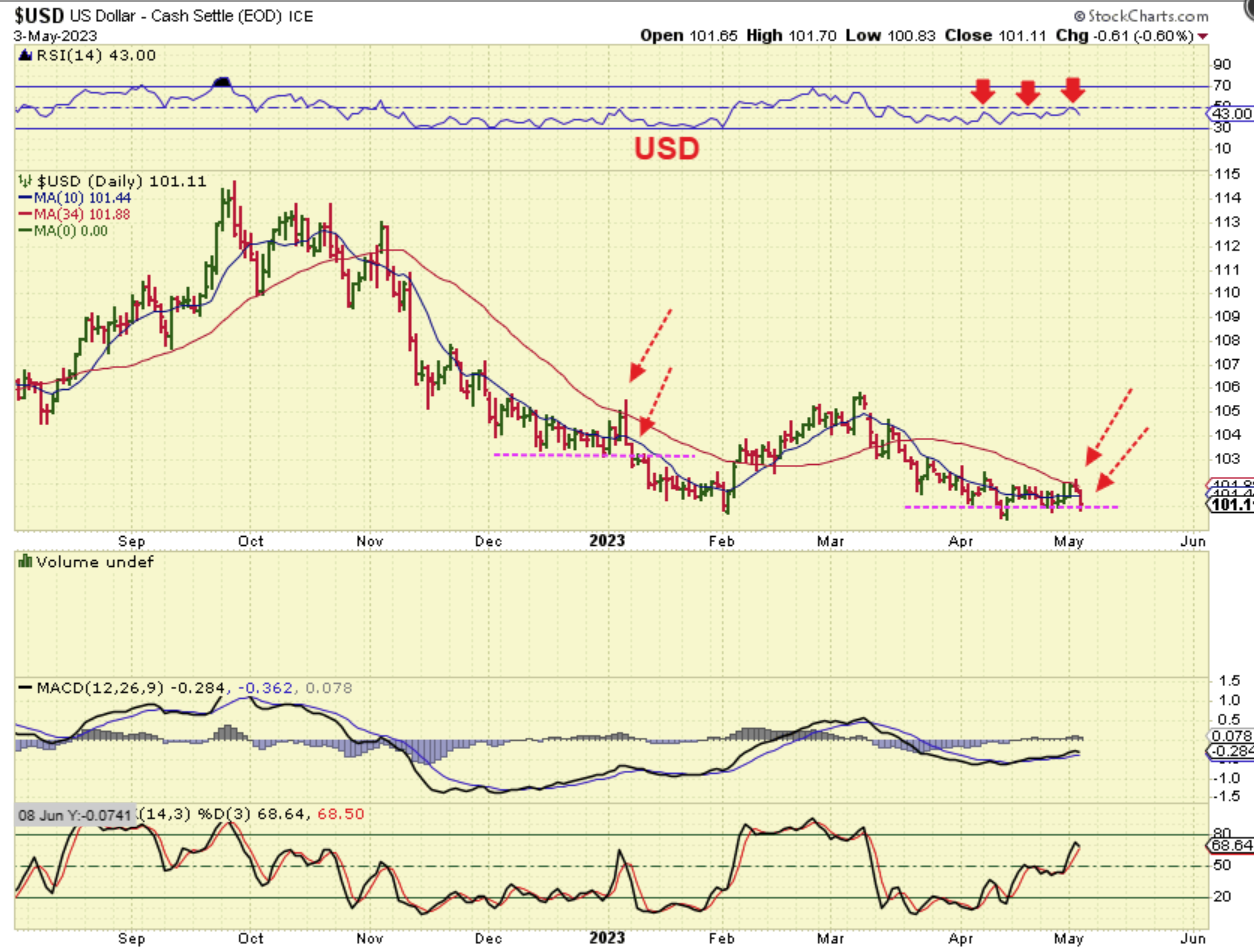
The USD dropped and reversed, so we may see something choppy in the short term. Once the USD breaks these lows and starts to sell off again, I expect it to pick up speed and for Gold & Silver to rally nicely. That will also be discussed in the weekend report.
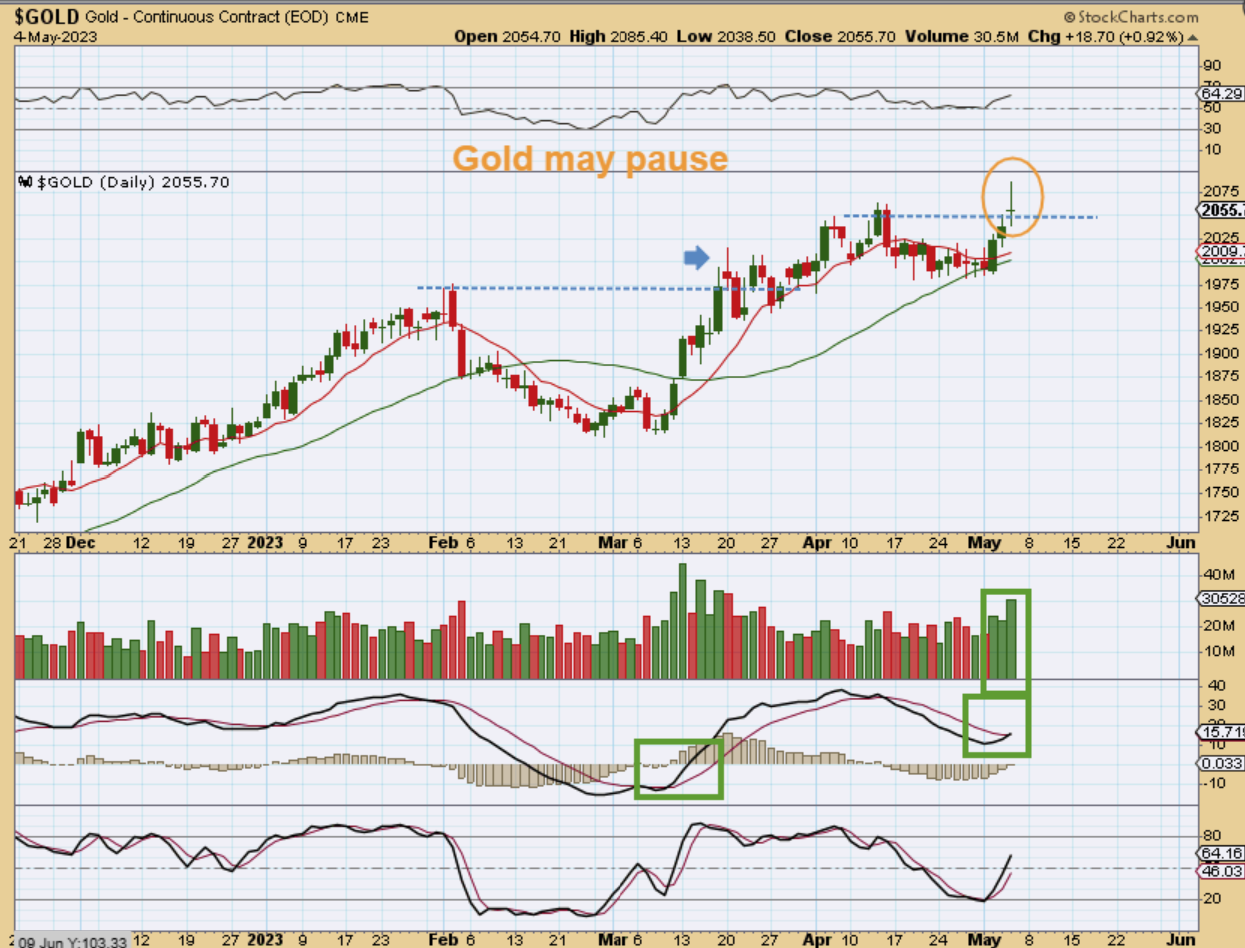
GOLD may pause with that USD choppiness, but dips now are a great place to buy / add to positions if you wanted to. Here I am showing with the blue line that often a break to new highs can lead to a pause, but this pause should be a short one in my opinion. Notice the bullish volume increase.
.
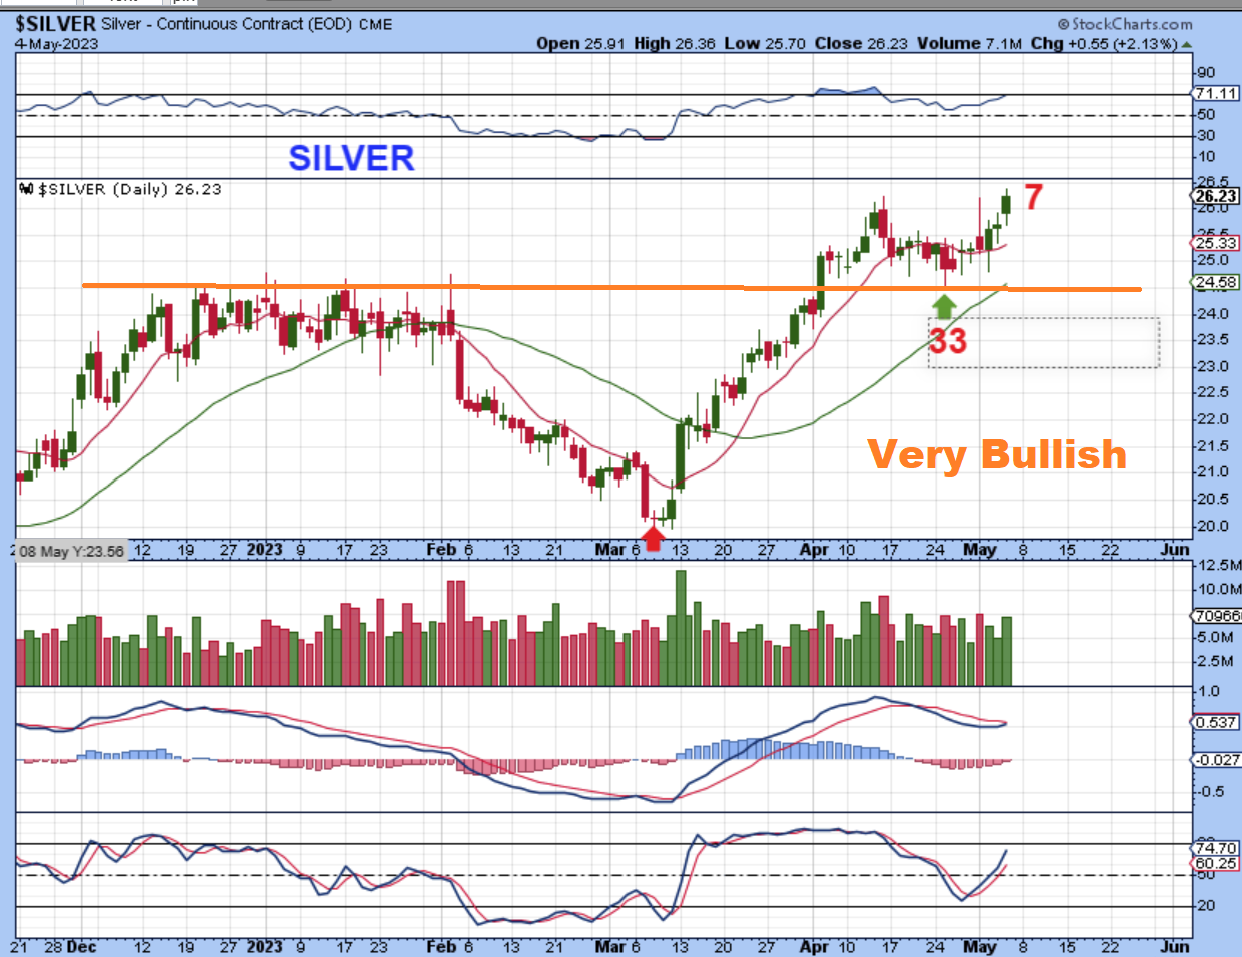
After a very strong run out of the March ICL, SILVER landed on Support with a mild dip and put in a dcl on day 33. This is really a perfect set up and I am expecting a second run to be similar to the first one, once that USD finally drops and picks up speed to the downside. We are on day 7 and this also may ‘pause’ as it breaks to new highs.
.
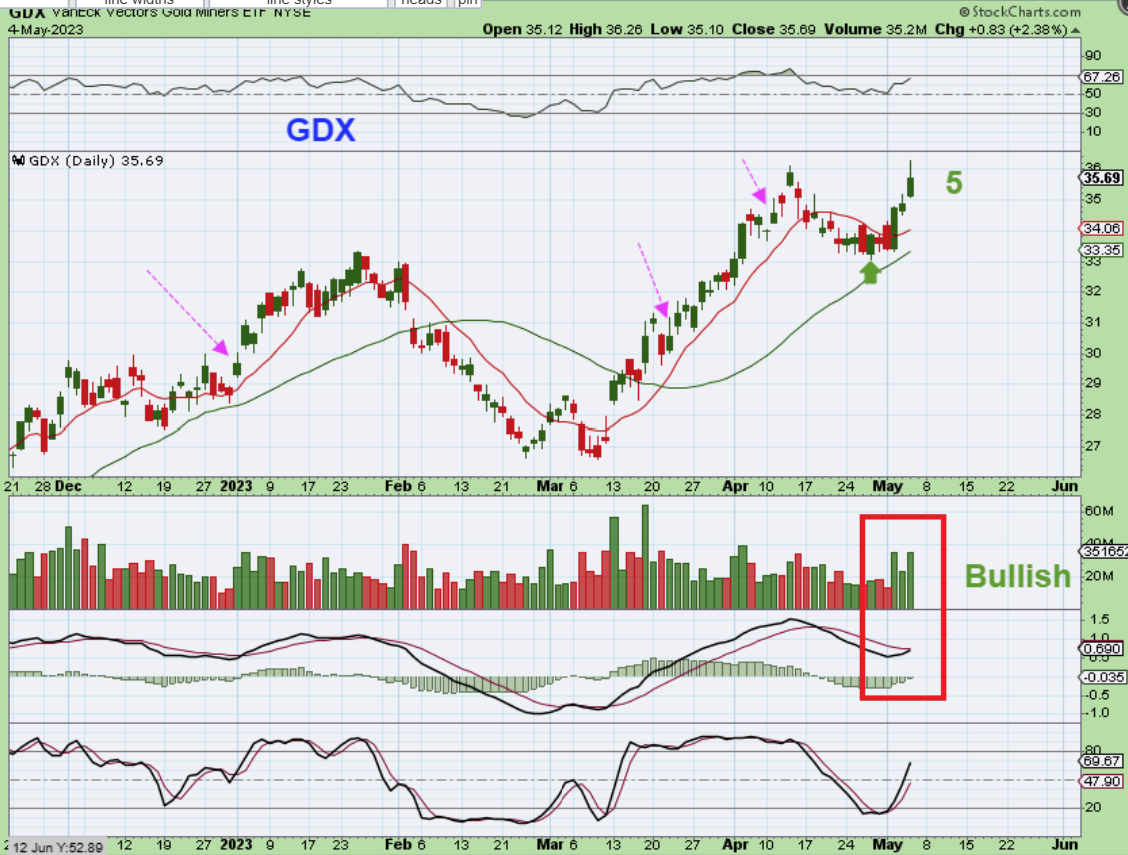
GDX – The Miners have moved nicely out of the lows on Fed Week, and seem to be on day 5. A pop and drop Thursday may indicate a pause here too as the USD bounces, but my Magenta arrows are showing you that in a strong rally time period, those ‘reversal’ candles did not stop The Miners from running.
.
So the General Markets set up is choppy and the timing for a dcl is here. The US Employment report is released today at 8:30 and that can push the markets down if the time is right. Oil is a choppy mess right now, so I’m just watching to see what happens there. The USD and Precious Metals are set up in a manner that has been and remains bullish for the Precious Metals.
.
I will discuss all of this, including Bitcoin in the weekend report, which will be out by Sunday morning my time. I love the set up in the precious metals sector, it is in buy the dip mode. Enjoy your Friday trading!
.
~ALEX
.
I have been saying for months now that the Big Picture for Bitcoin bottomed in a big way and that it was Very Bullish. That has not changed and I will discuss that again in the weekend report. I still see it as bullish, and there are days (like this week) when the General Markets sell off and bitcoin does not. The daily chart I just want to point out a couple of short term thoughts.
.
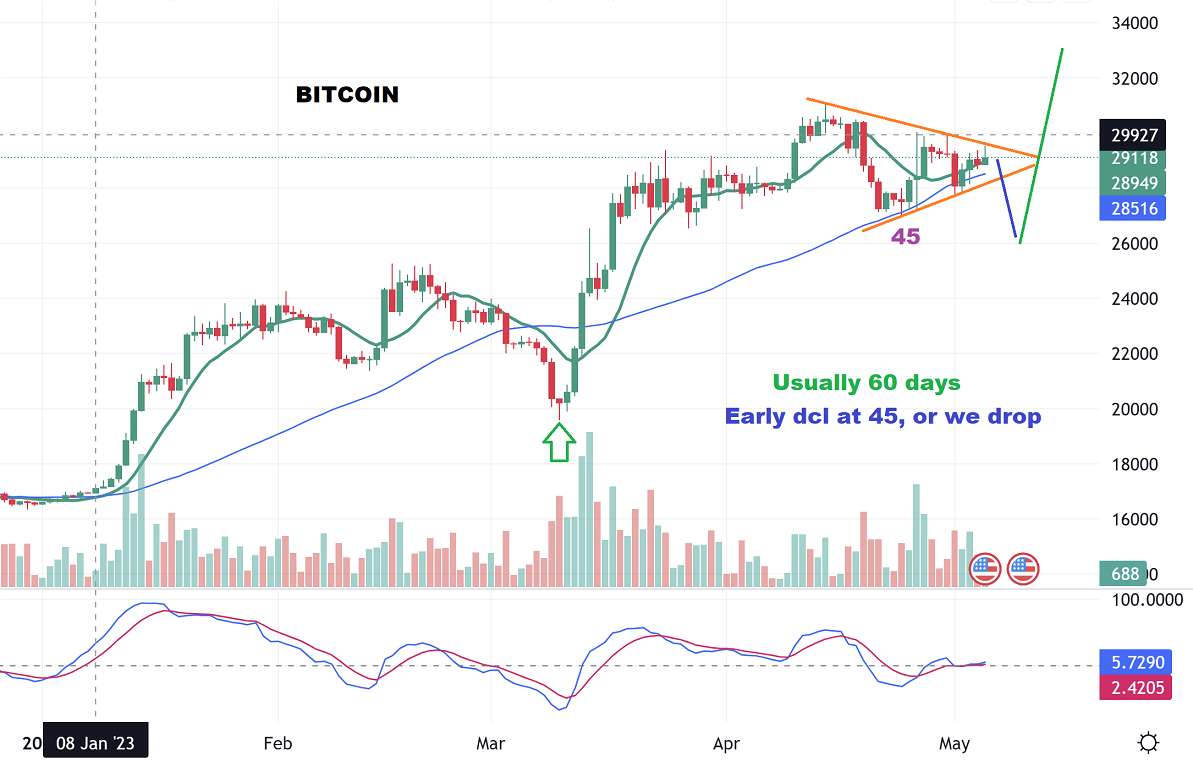
Bitcoin daily: I see dcls every 30 or 60 days. I say that because usually the 30 day dip can be very mild and is more of a 1/2 cycle dip. It doesn’t always act like a dcl, but the 60 day dip is larger and looks like a dcl, so what do we have right now?
– I see a day 45 dip that looked like a dcl, but that is early and right between 30 & 60 days.
– Now I see a triangle forming, and dcls CAN form inside of a triangle so is that happening now? Possibly!
– If not, this is day 56 right now inside of that triangle, and we could see a quick false break down of that triangle and then a rally higher. Crypto stocks themselves are choppy with the triangle, but acting bullishly.
THESE CHARTS WERE IN YESTERDAYS REPORT:
.
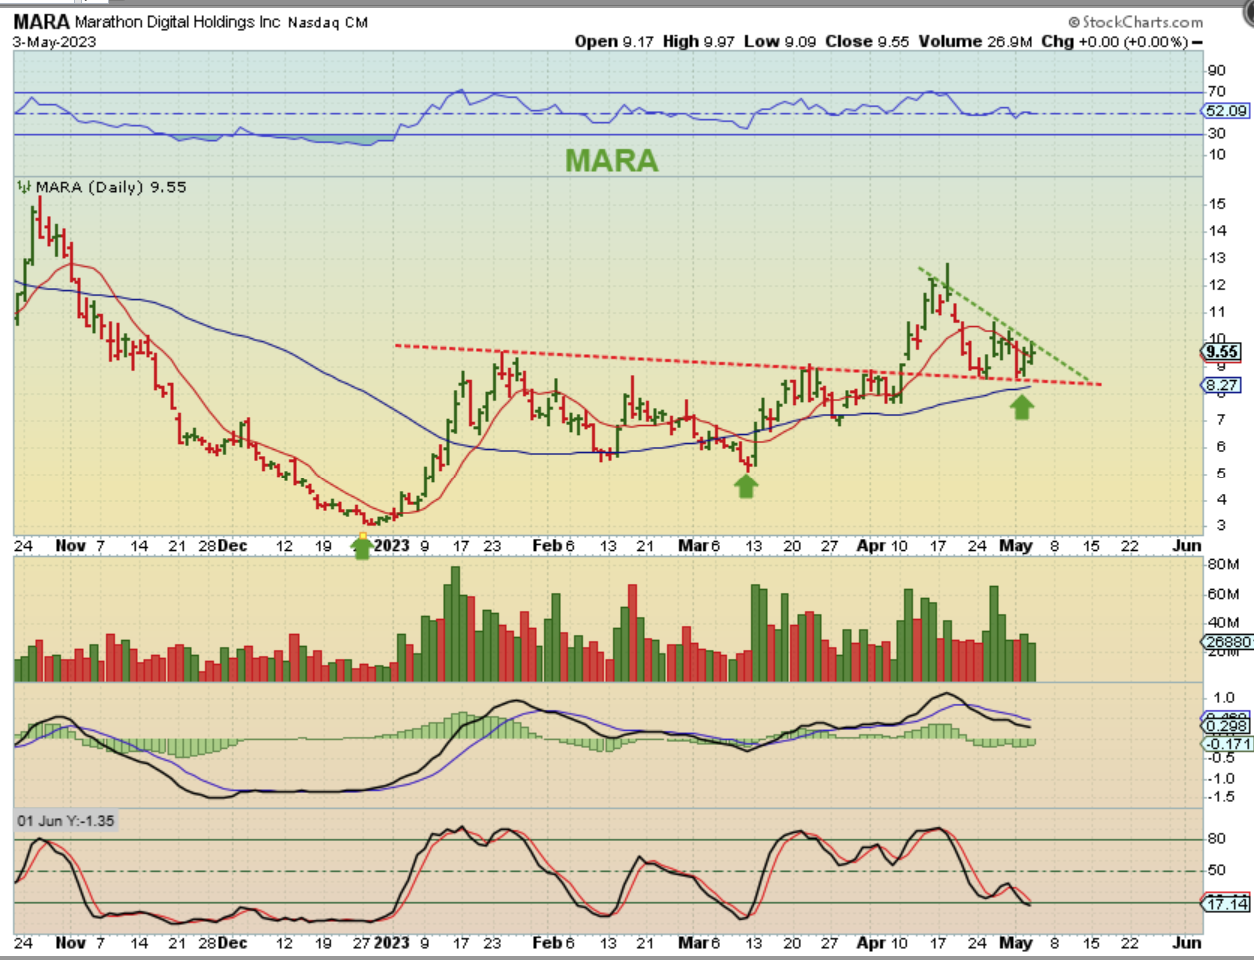
MARA – I have been discussing the bullish set ups in MARA, RIOT, HUT, HIVE, CIFR, CLSK, etc. We can also trade BITF, BTBT, BTCM, and others as long as you are aware when they release their earnings. MARA has run from $3 to $12 and now rests at $8. The stochastics is finally getting oversold again.
.
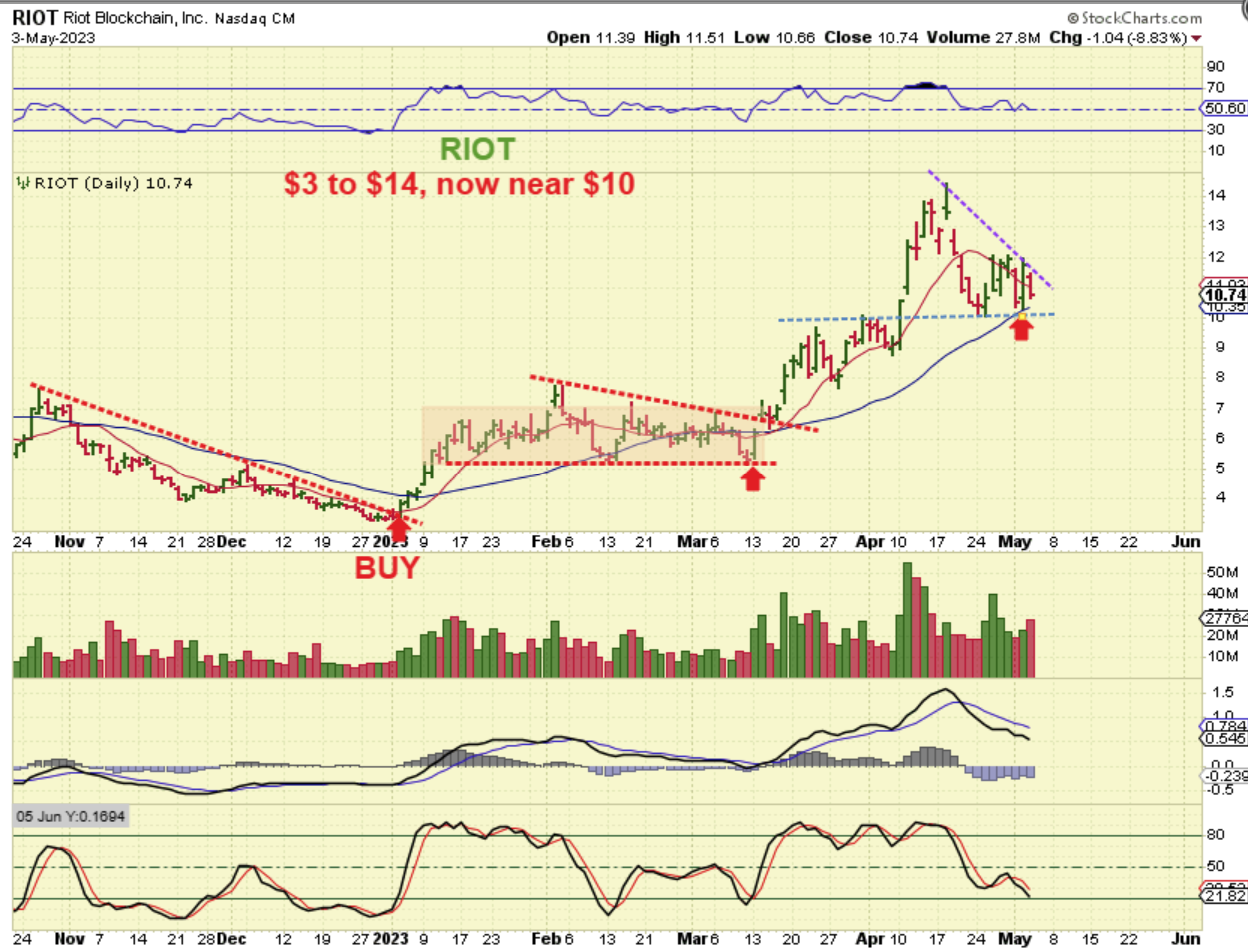
RIOT has been consolidating and like Mara, it is near support and the stochastics is finally reaching oversold again.